
The Effect of Surface Pretreatments on the Reliability of Glass Bonded Joints


Abstract
1. Introduction
Pretreatment of the Surface Before Bonding
2. Experimental Part
2.1. Methods and Materials
2.1.1. Preparation of Samples Before Bonding
2.1.2. Selection of Adhesives
2.1.3. Bonding of Samples
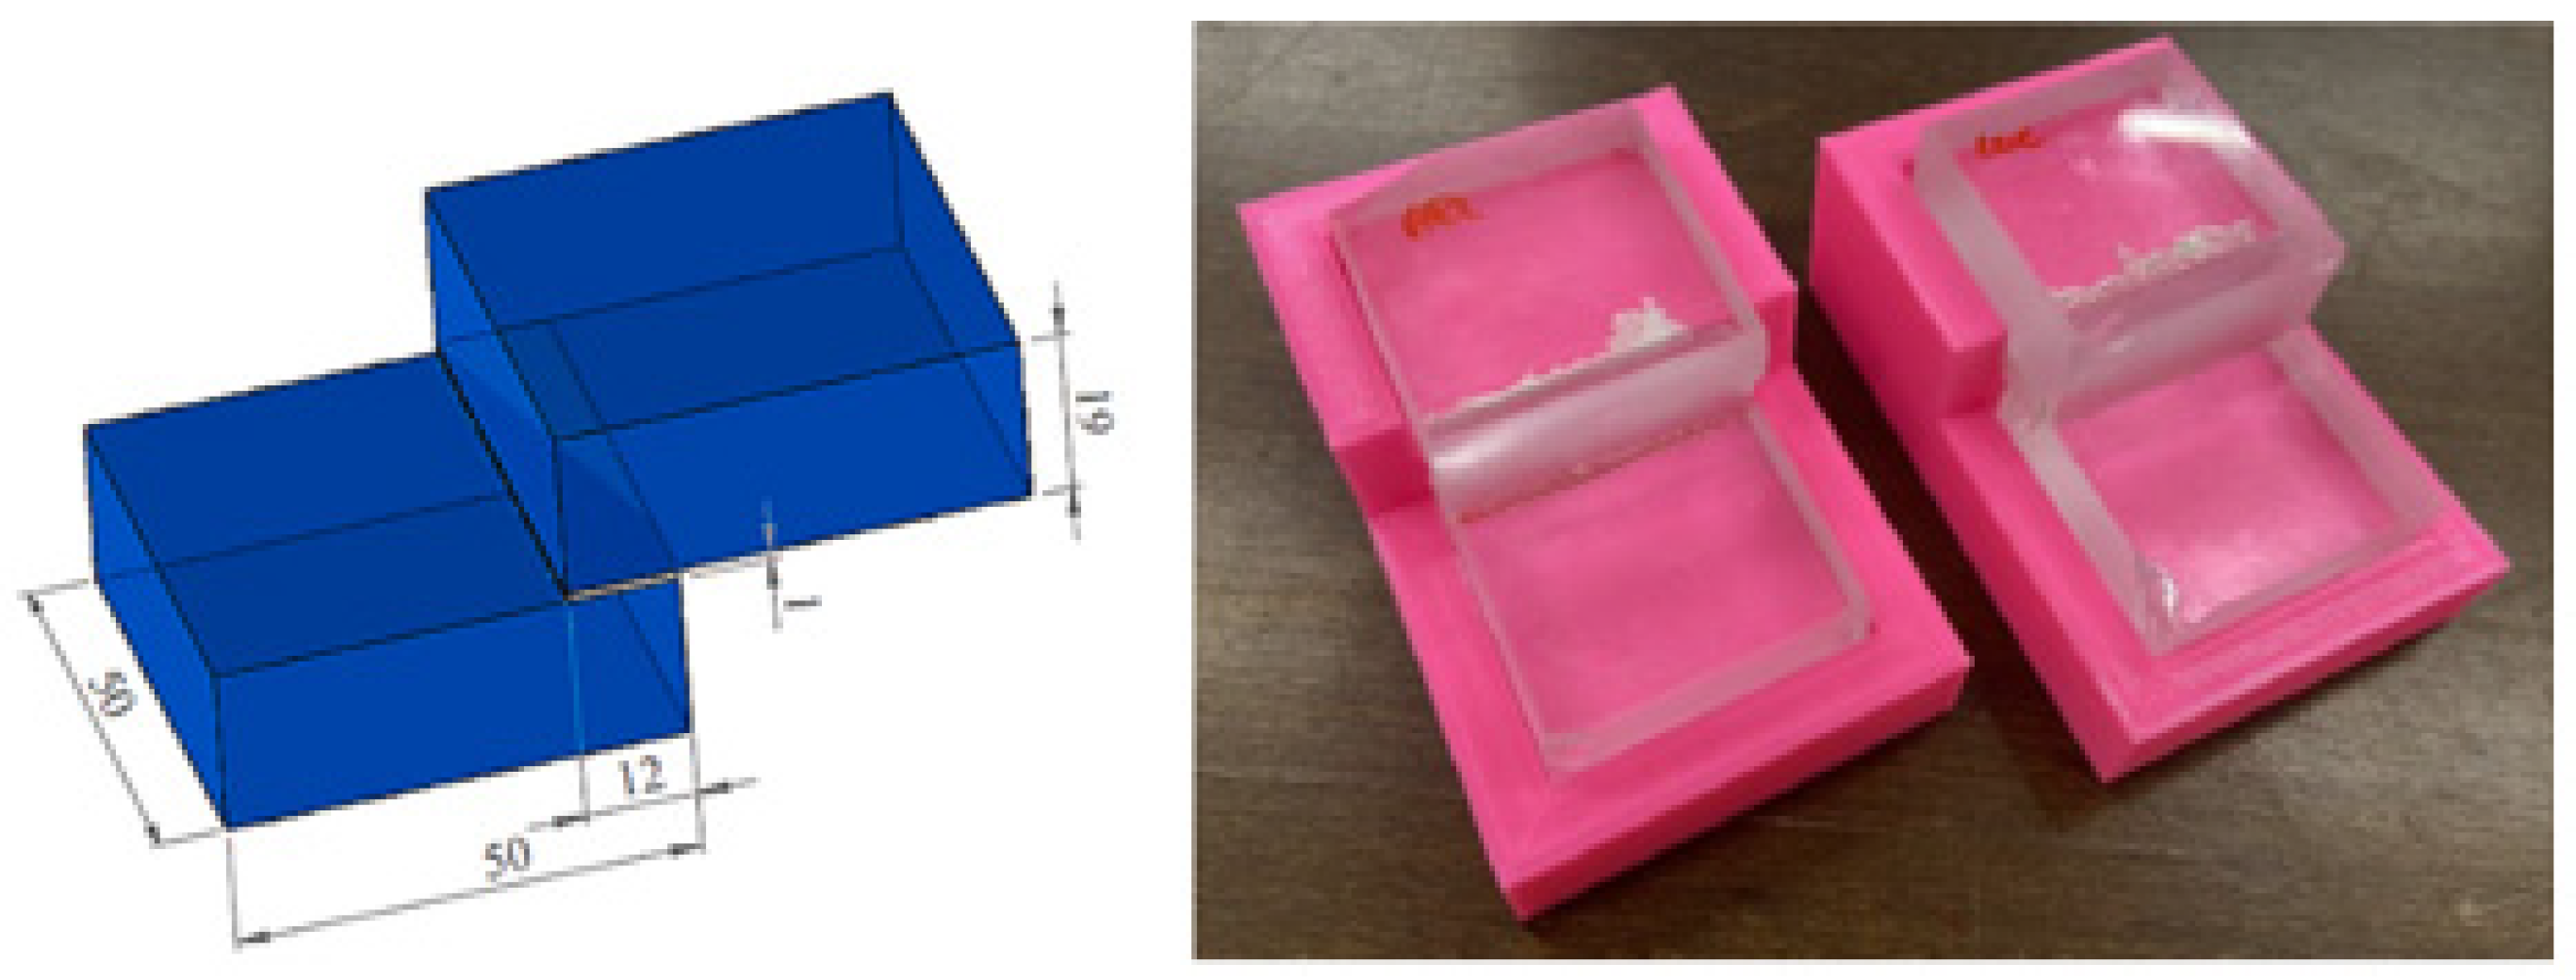
2.2. Test Methods and Samples
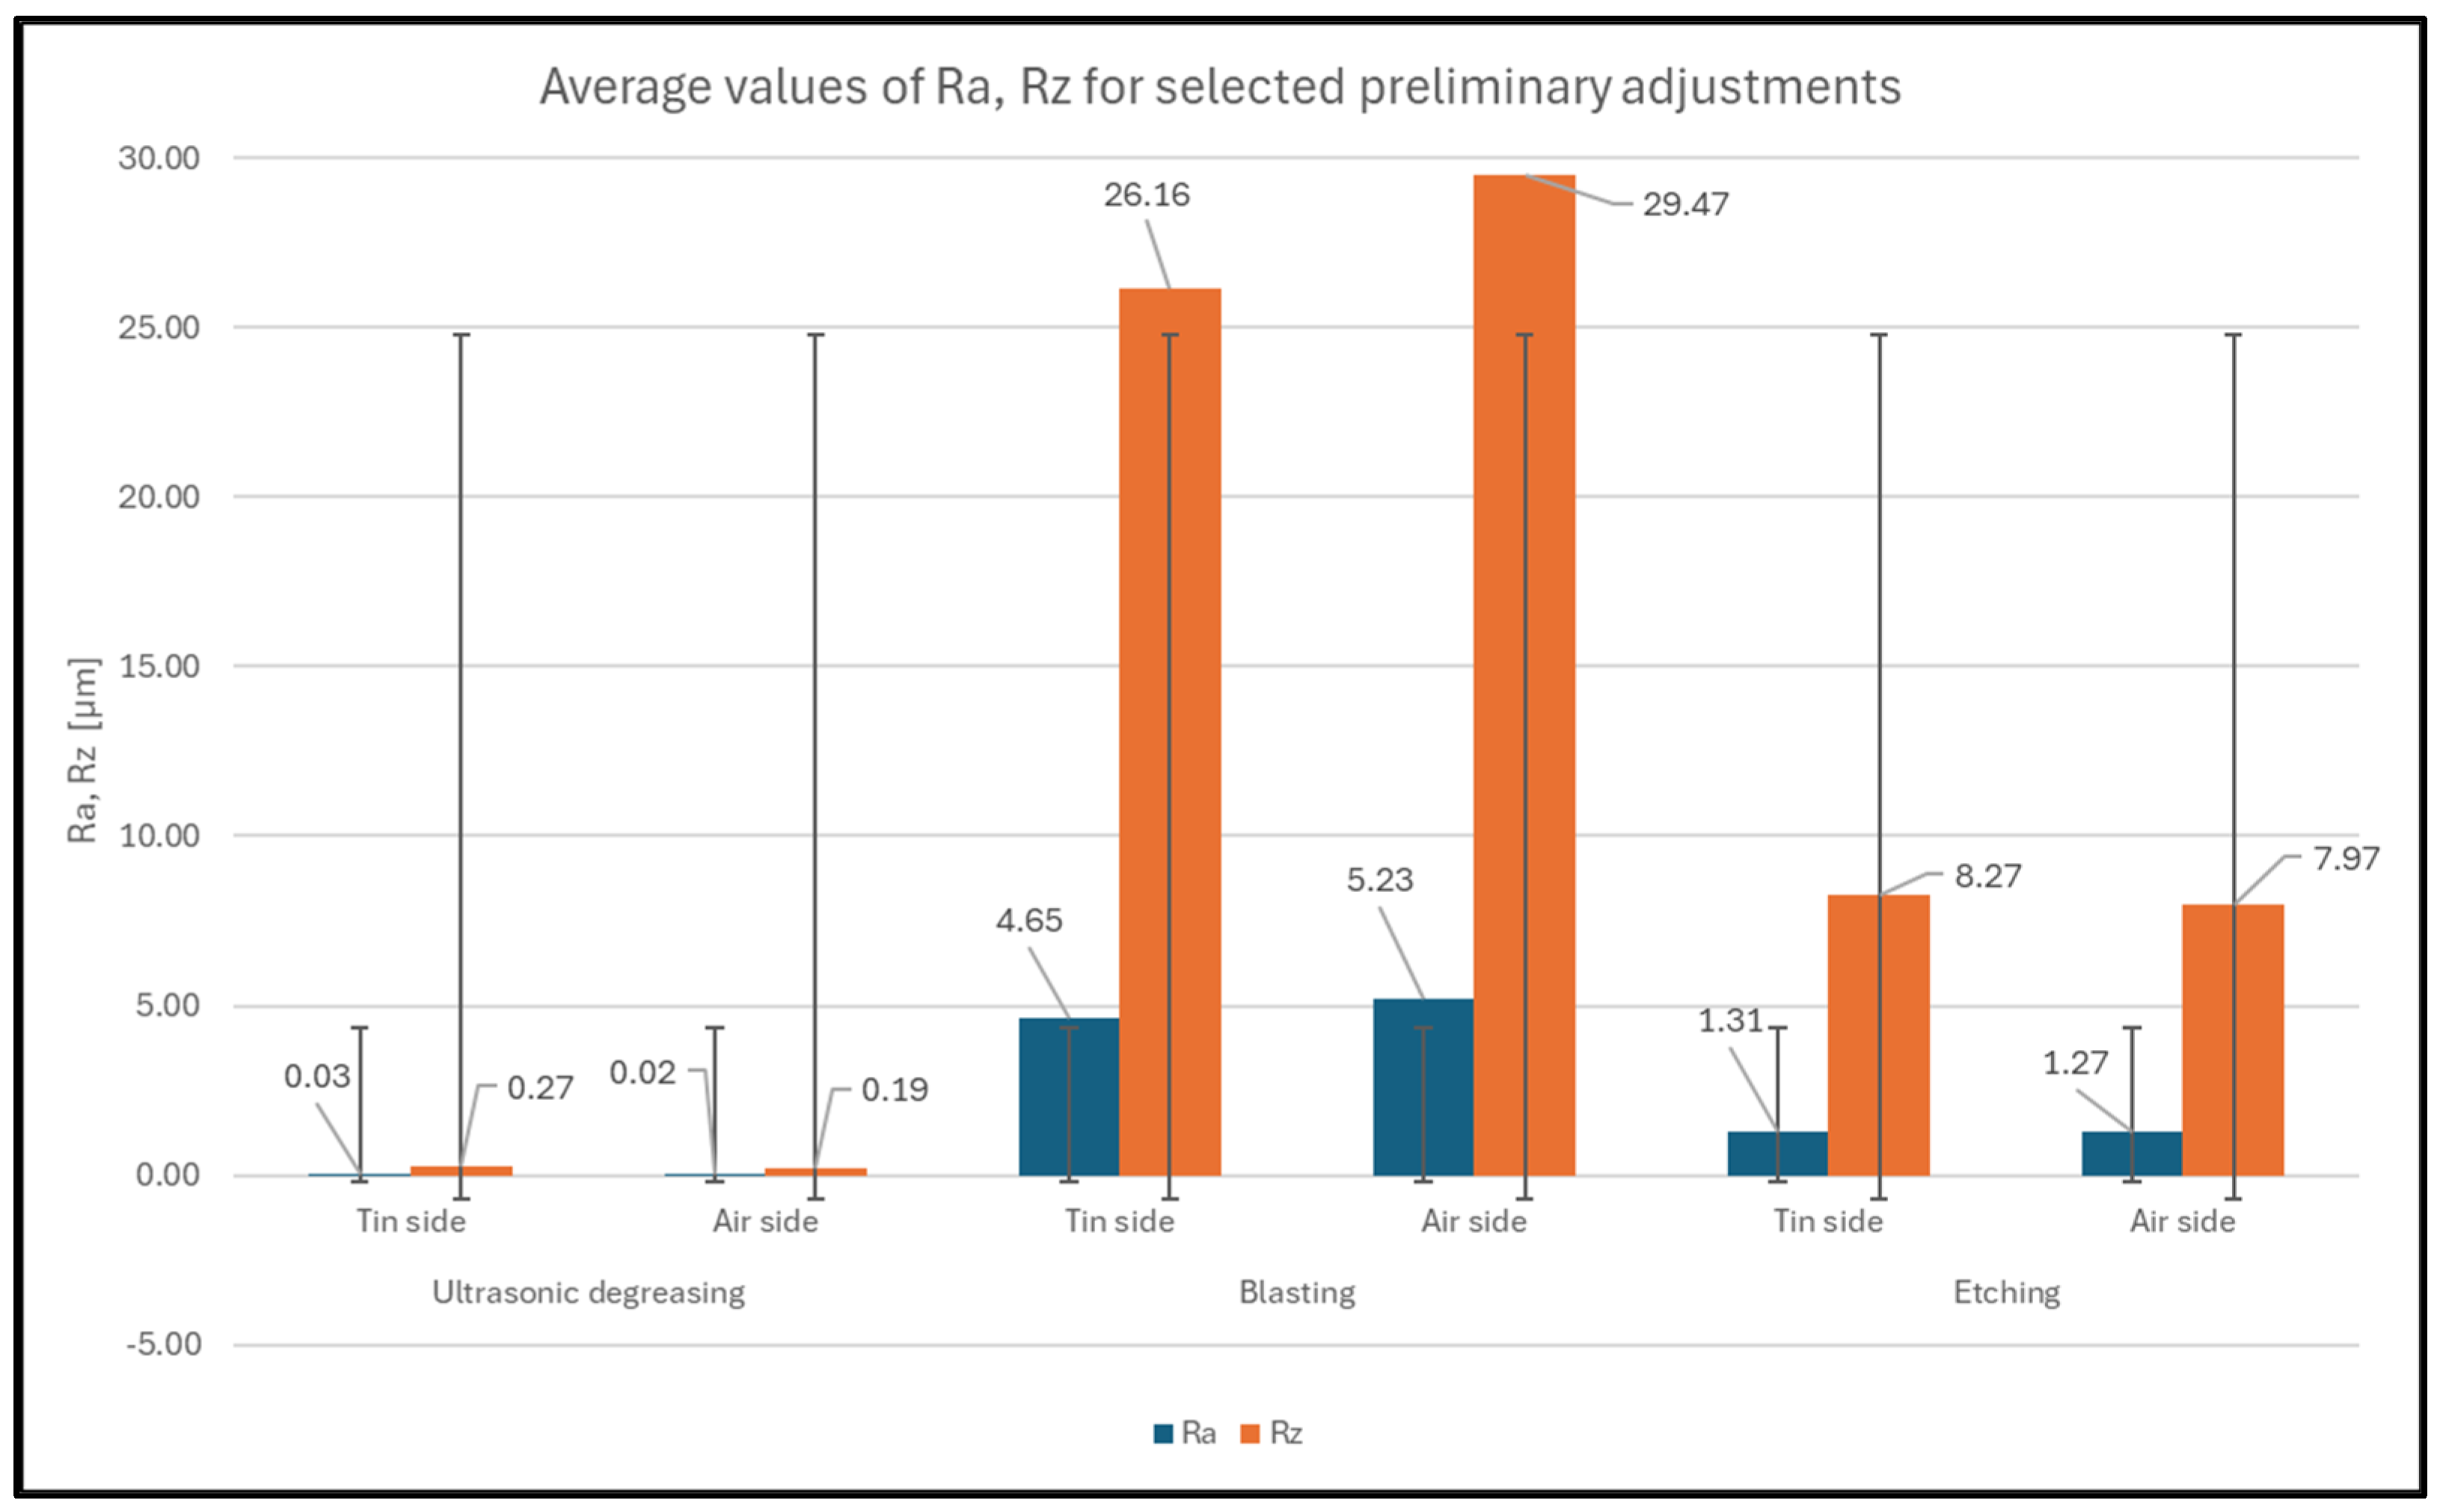
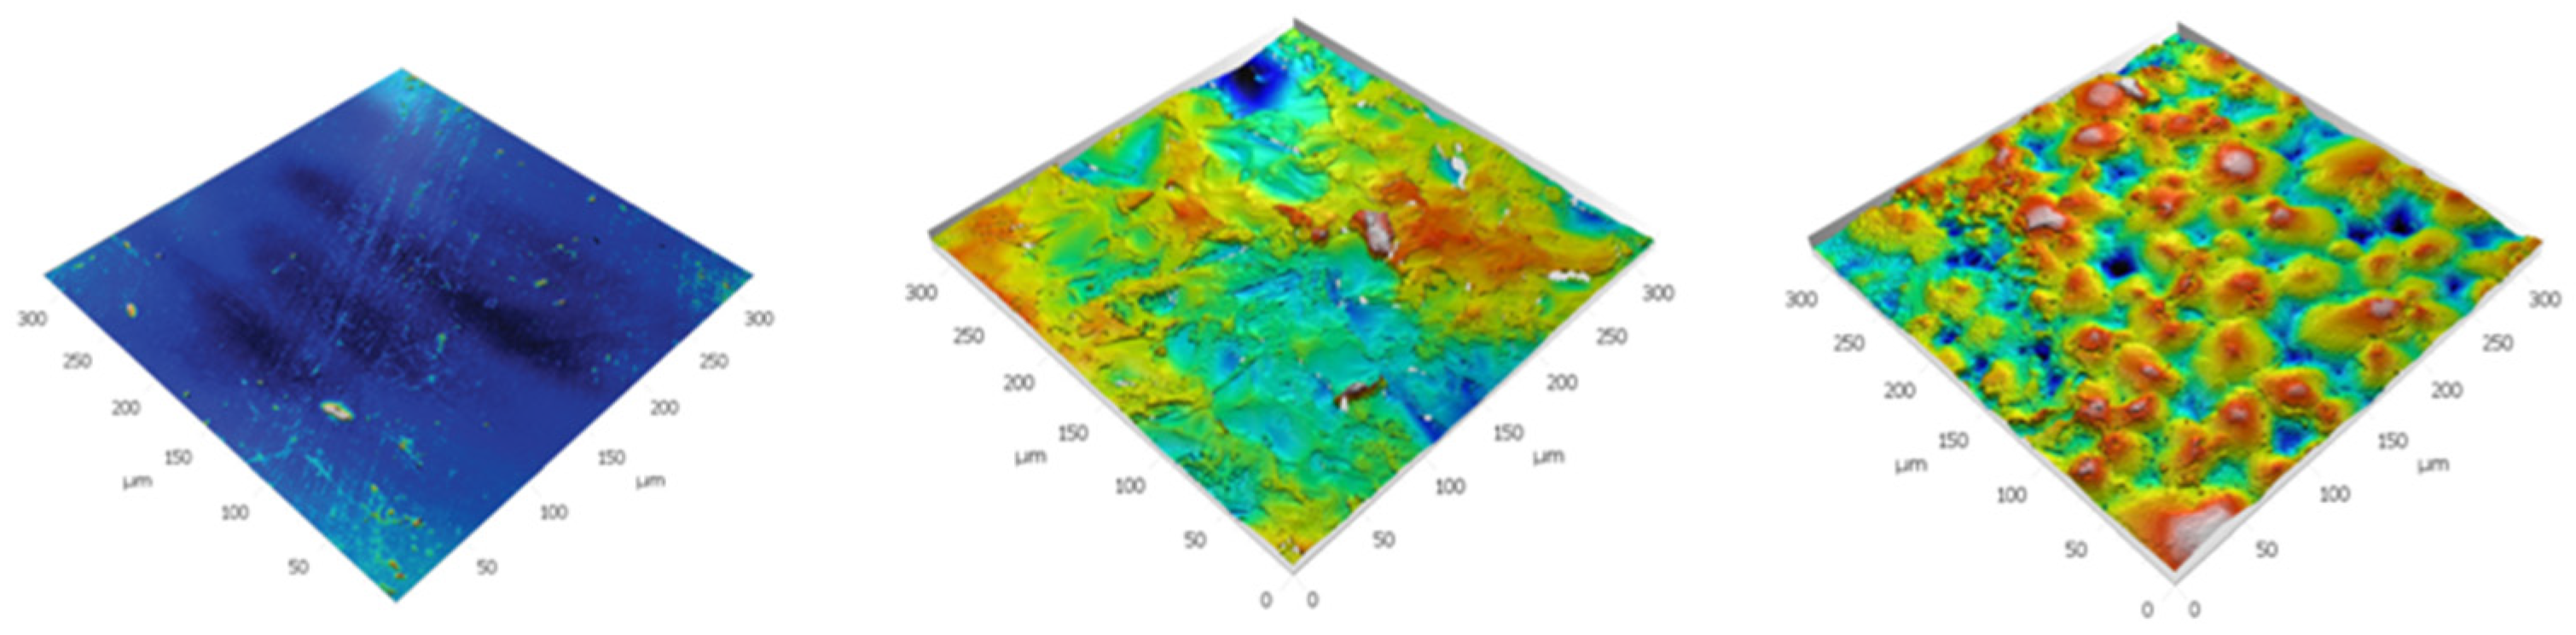
2.3. Surface Structure Measurement
- -
- This value indicates a smooth surface with no significant texture.
- -
- This is the highest SDR value, meaning that the surface is significantly coarse, with micro- and macro-structures increasing adhesion properties.
- -
- Etched glass has a finer texture than blasted glass but still produces some roughness.
2.4. Pull-Off Test
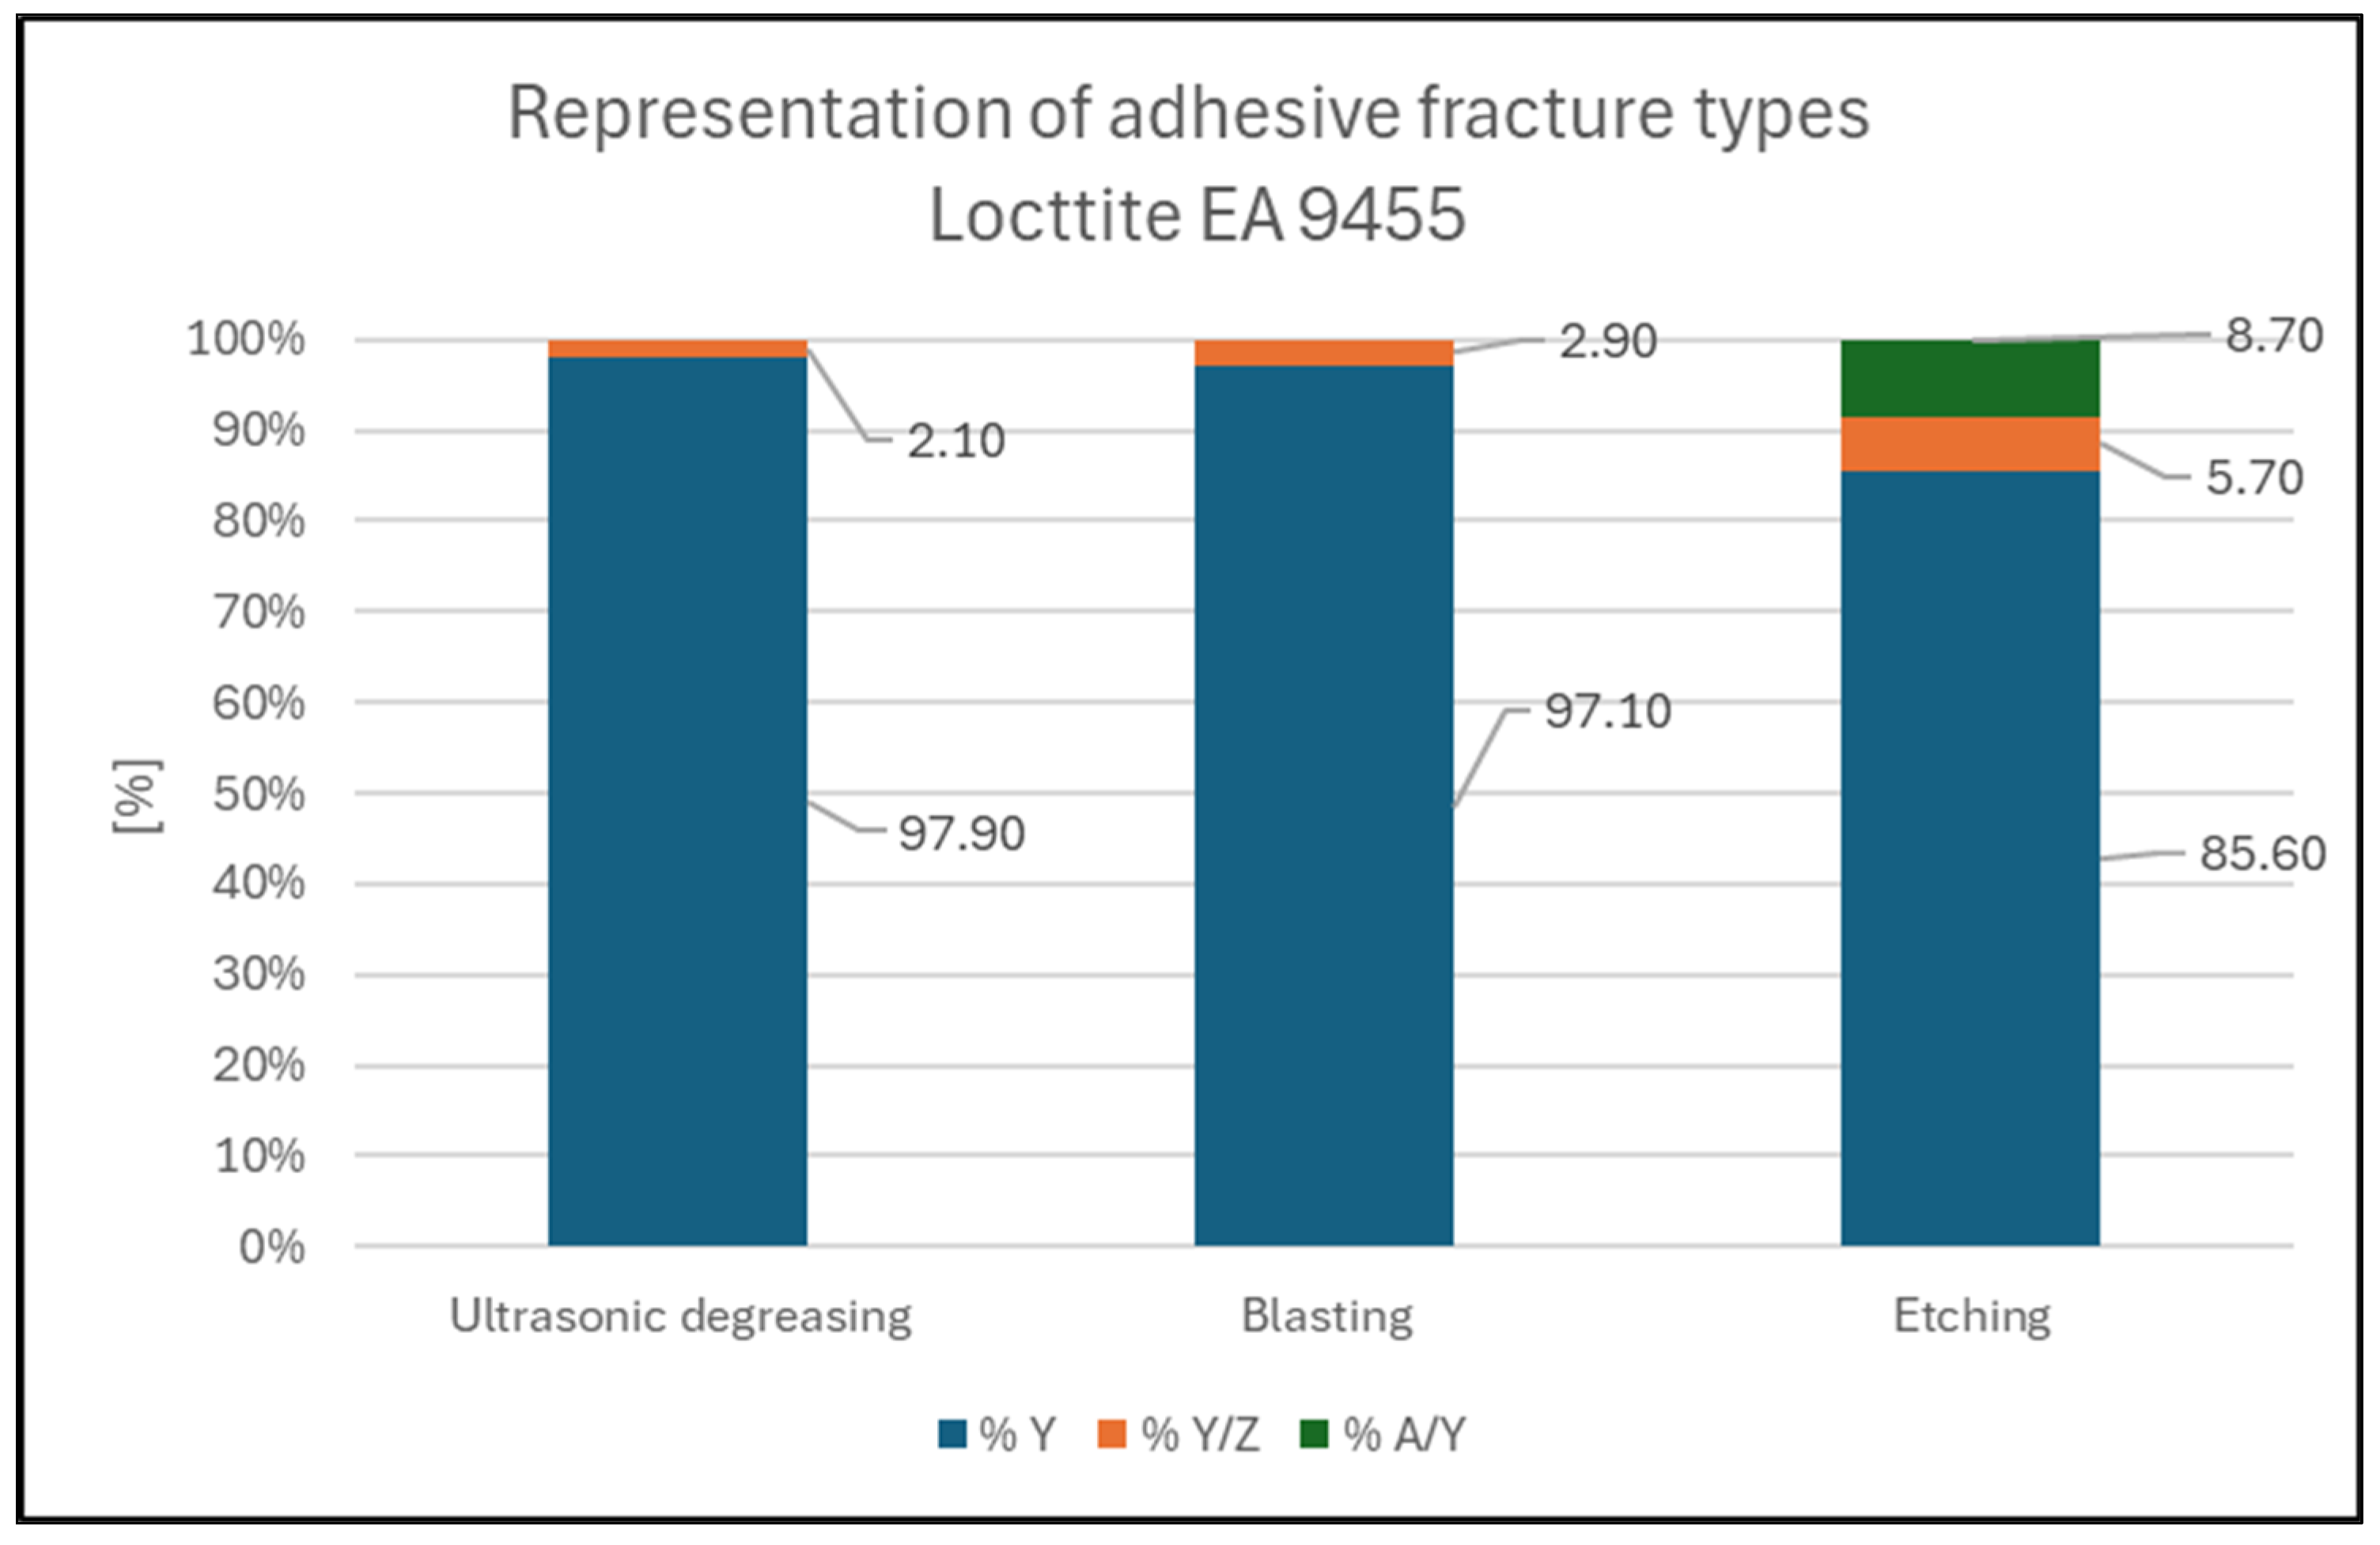
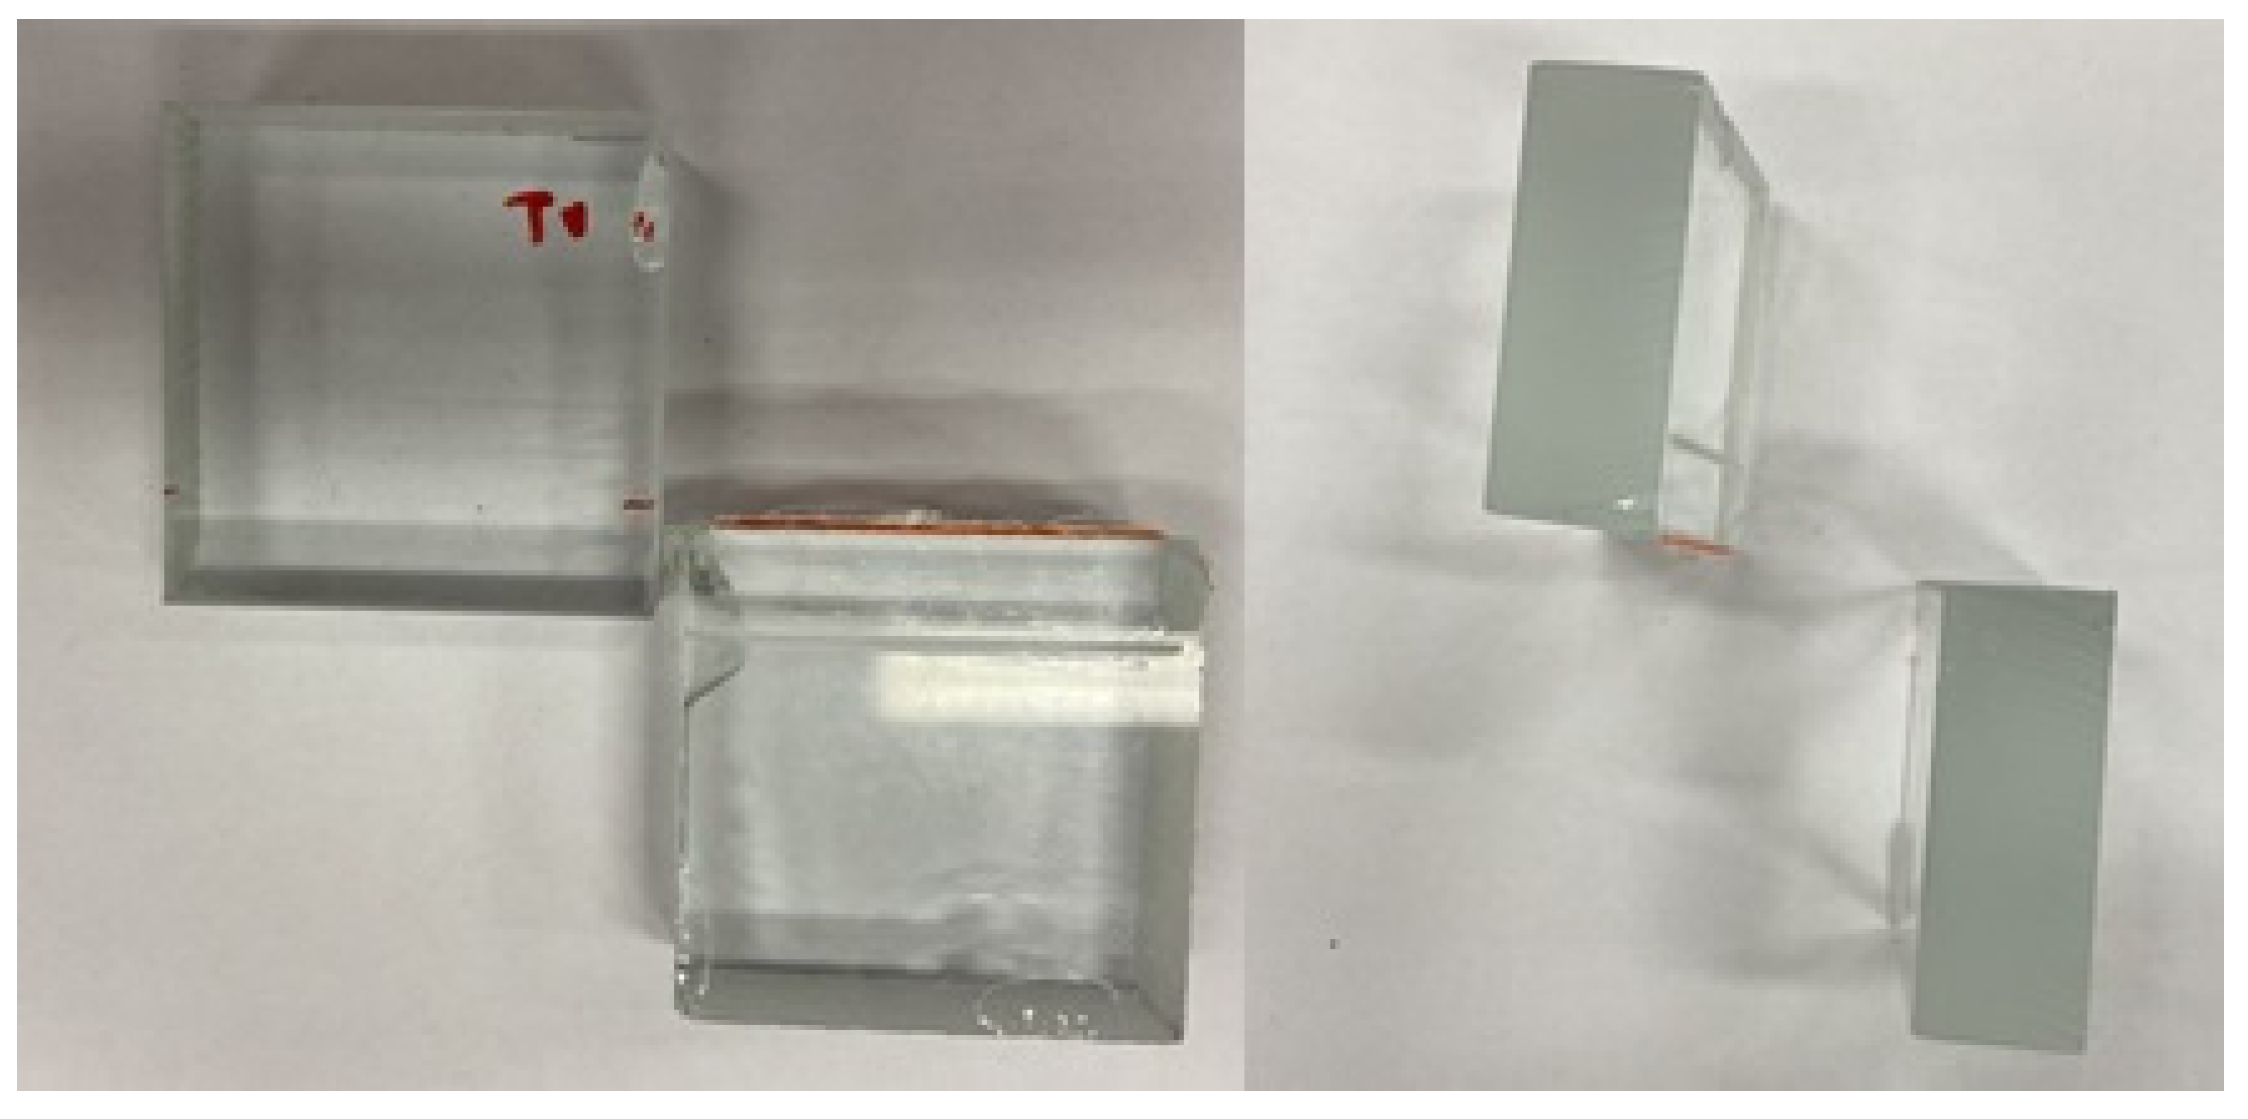
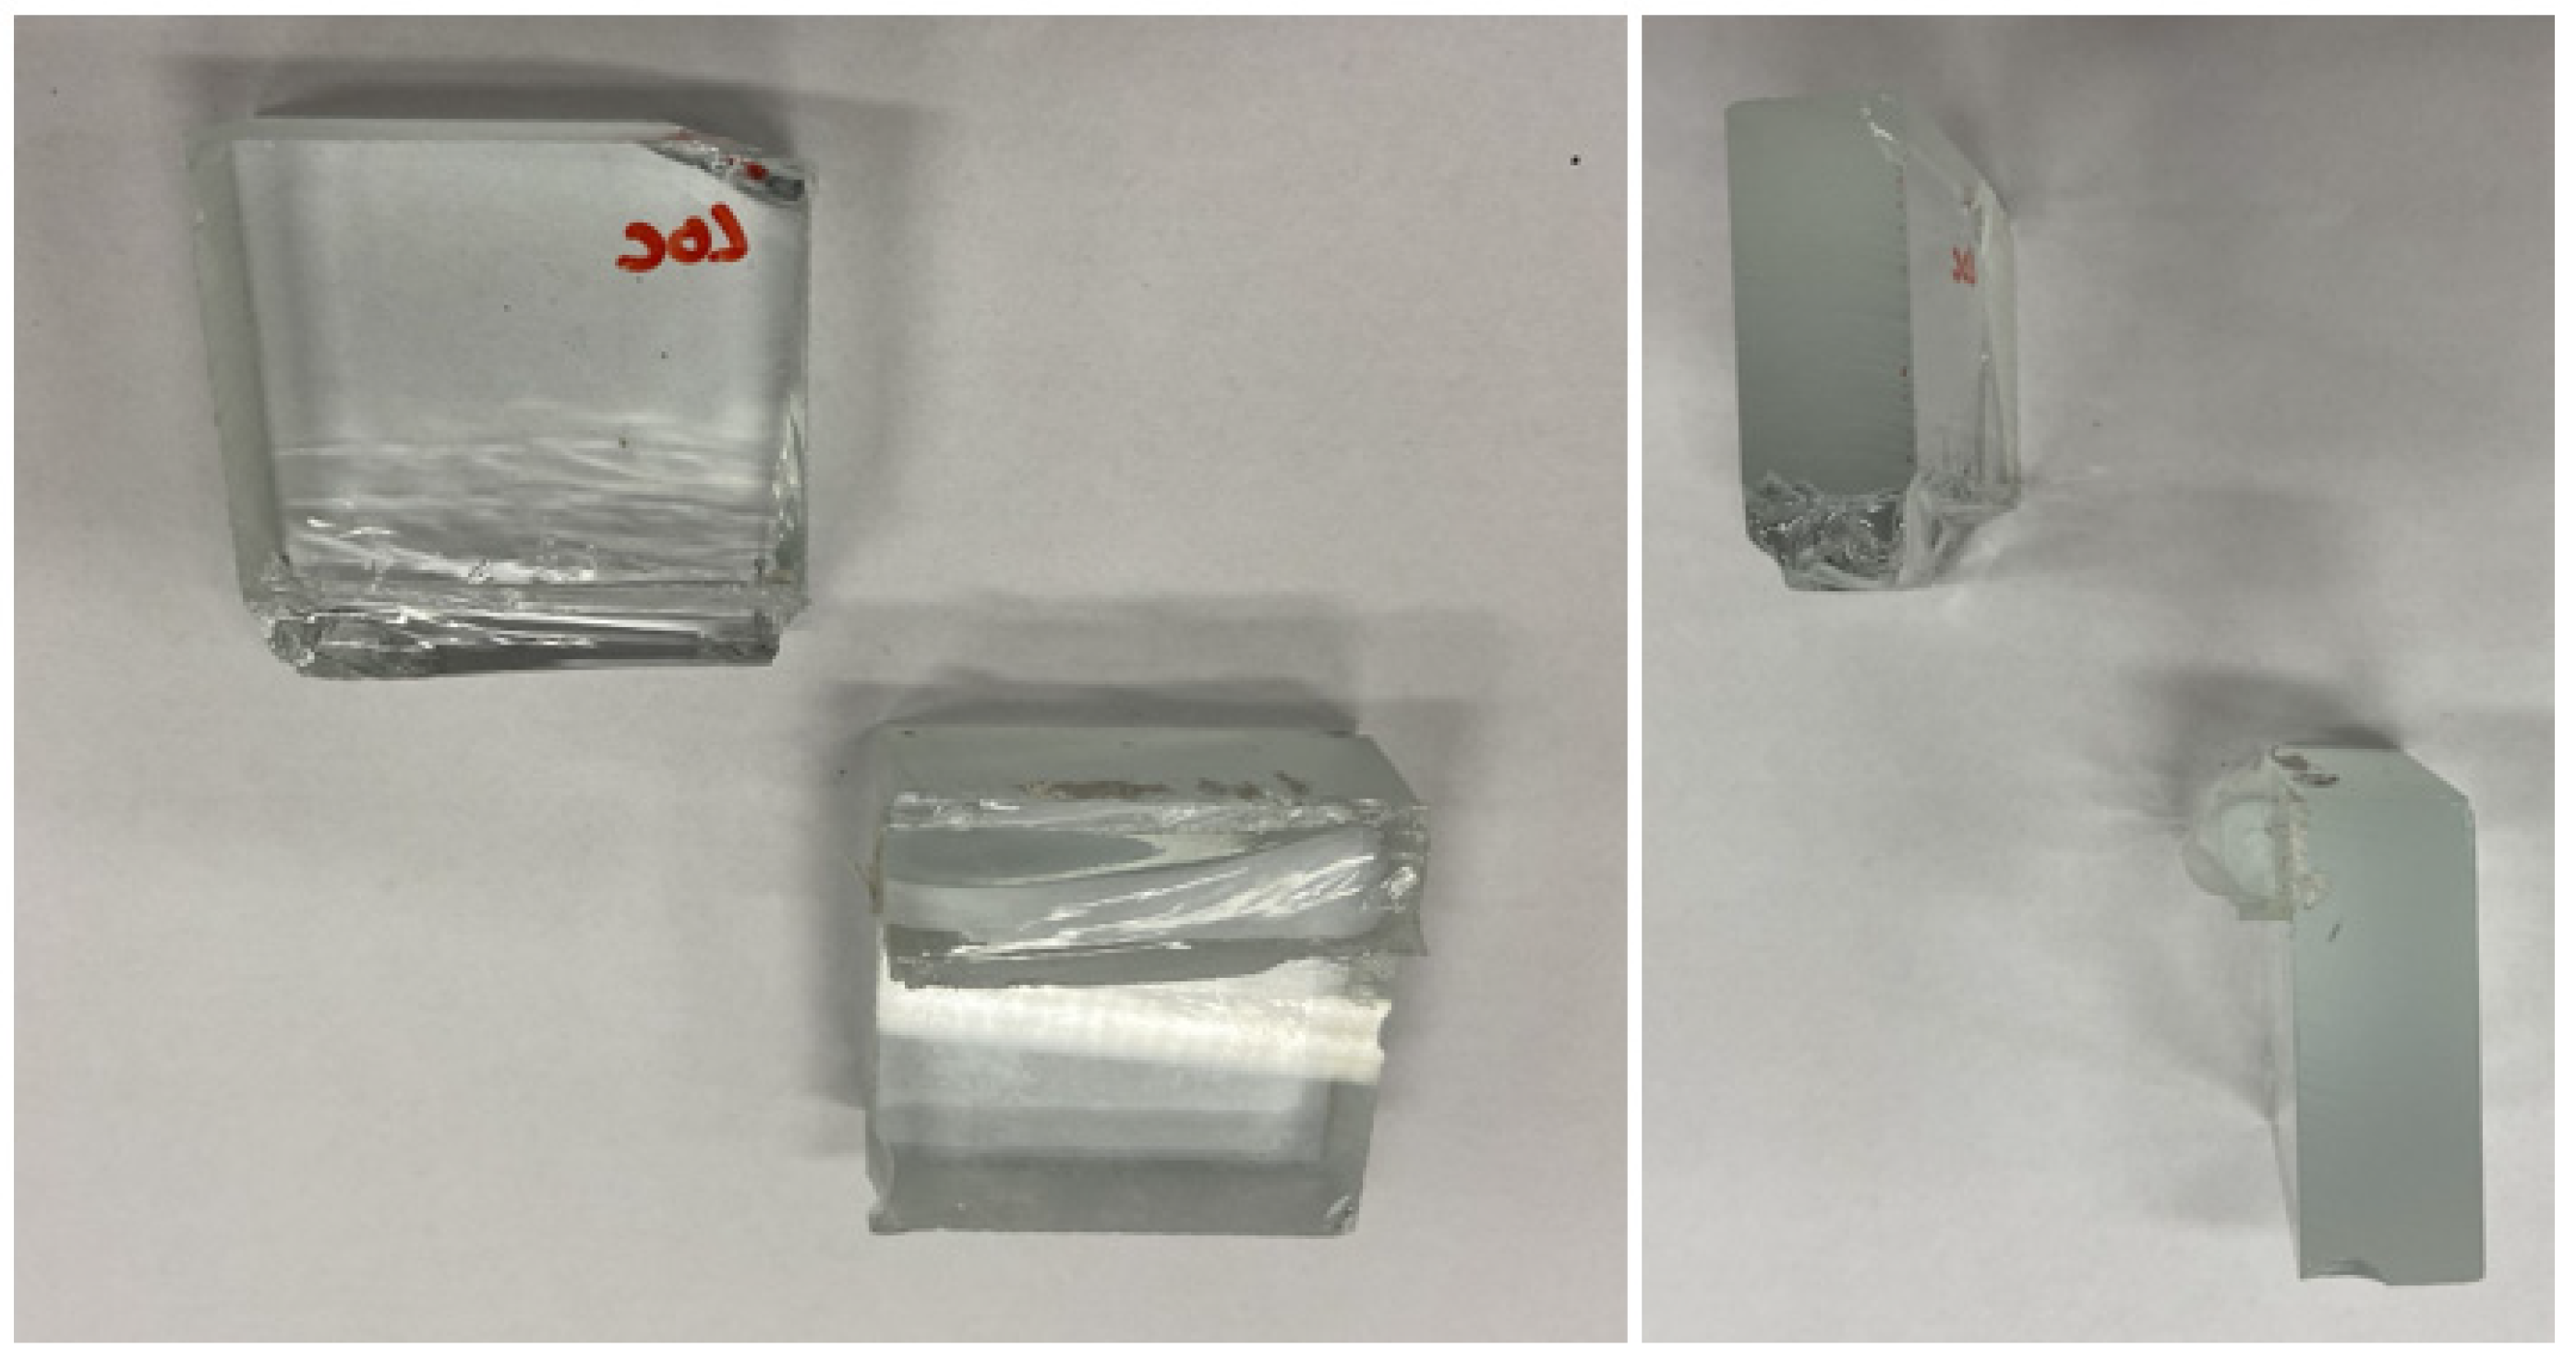
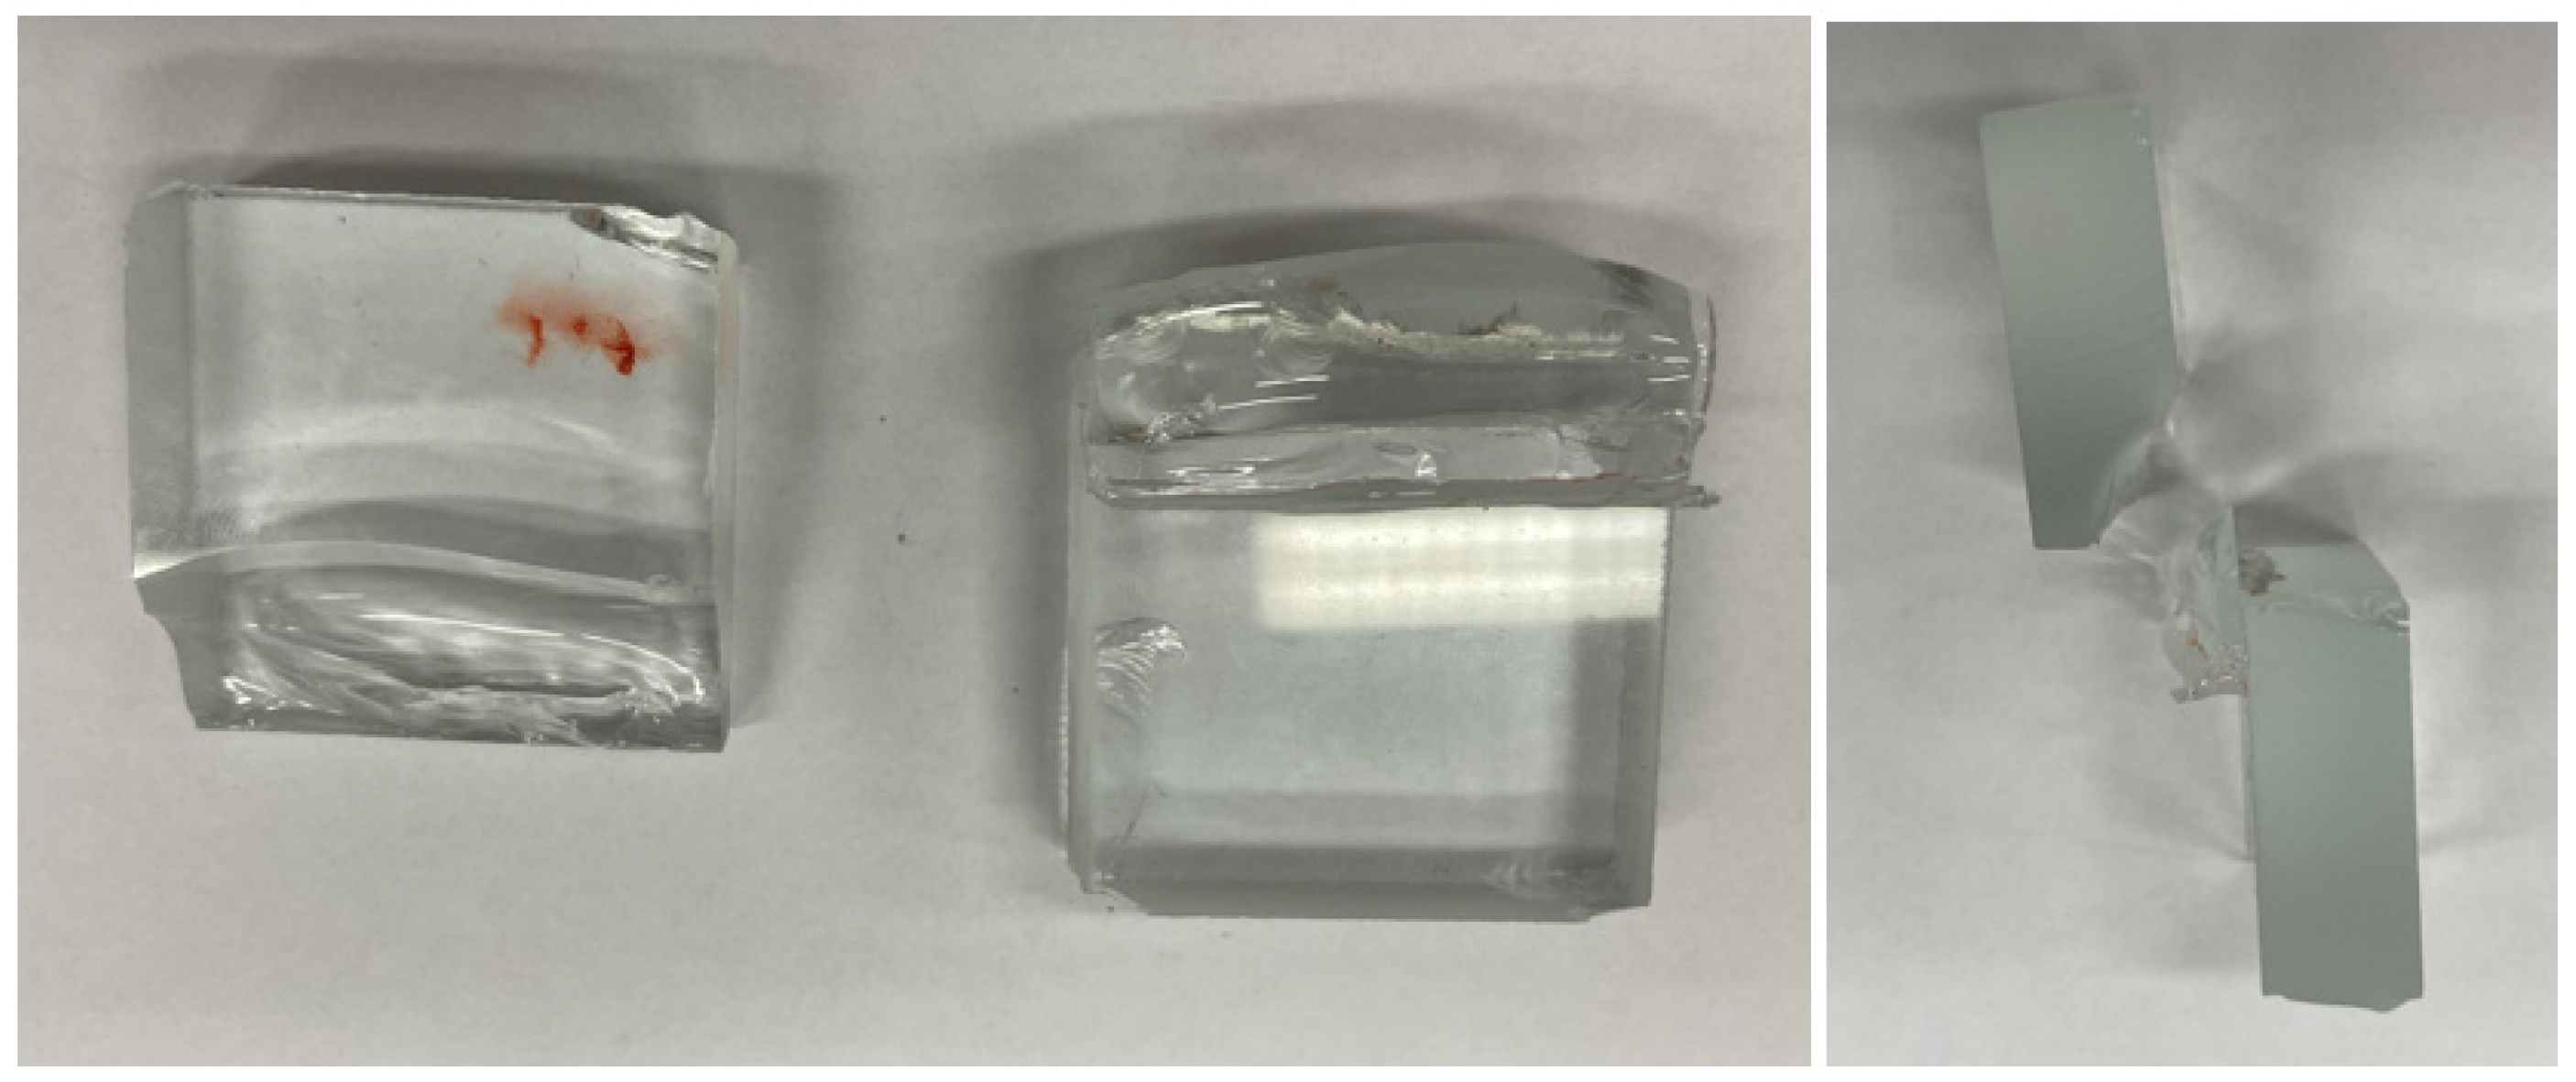
- The Loctite EA 9455 adhesive broke in the most similar manner across all three pretreatments, with over 93% of all pull-off trials ending in cohesive fracture in the adhesive (%Y), as shown in Figure 7, and even over 97% of pull-off trials in the degreasing and blasting pretreatments;
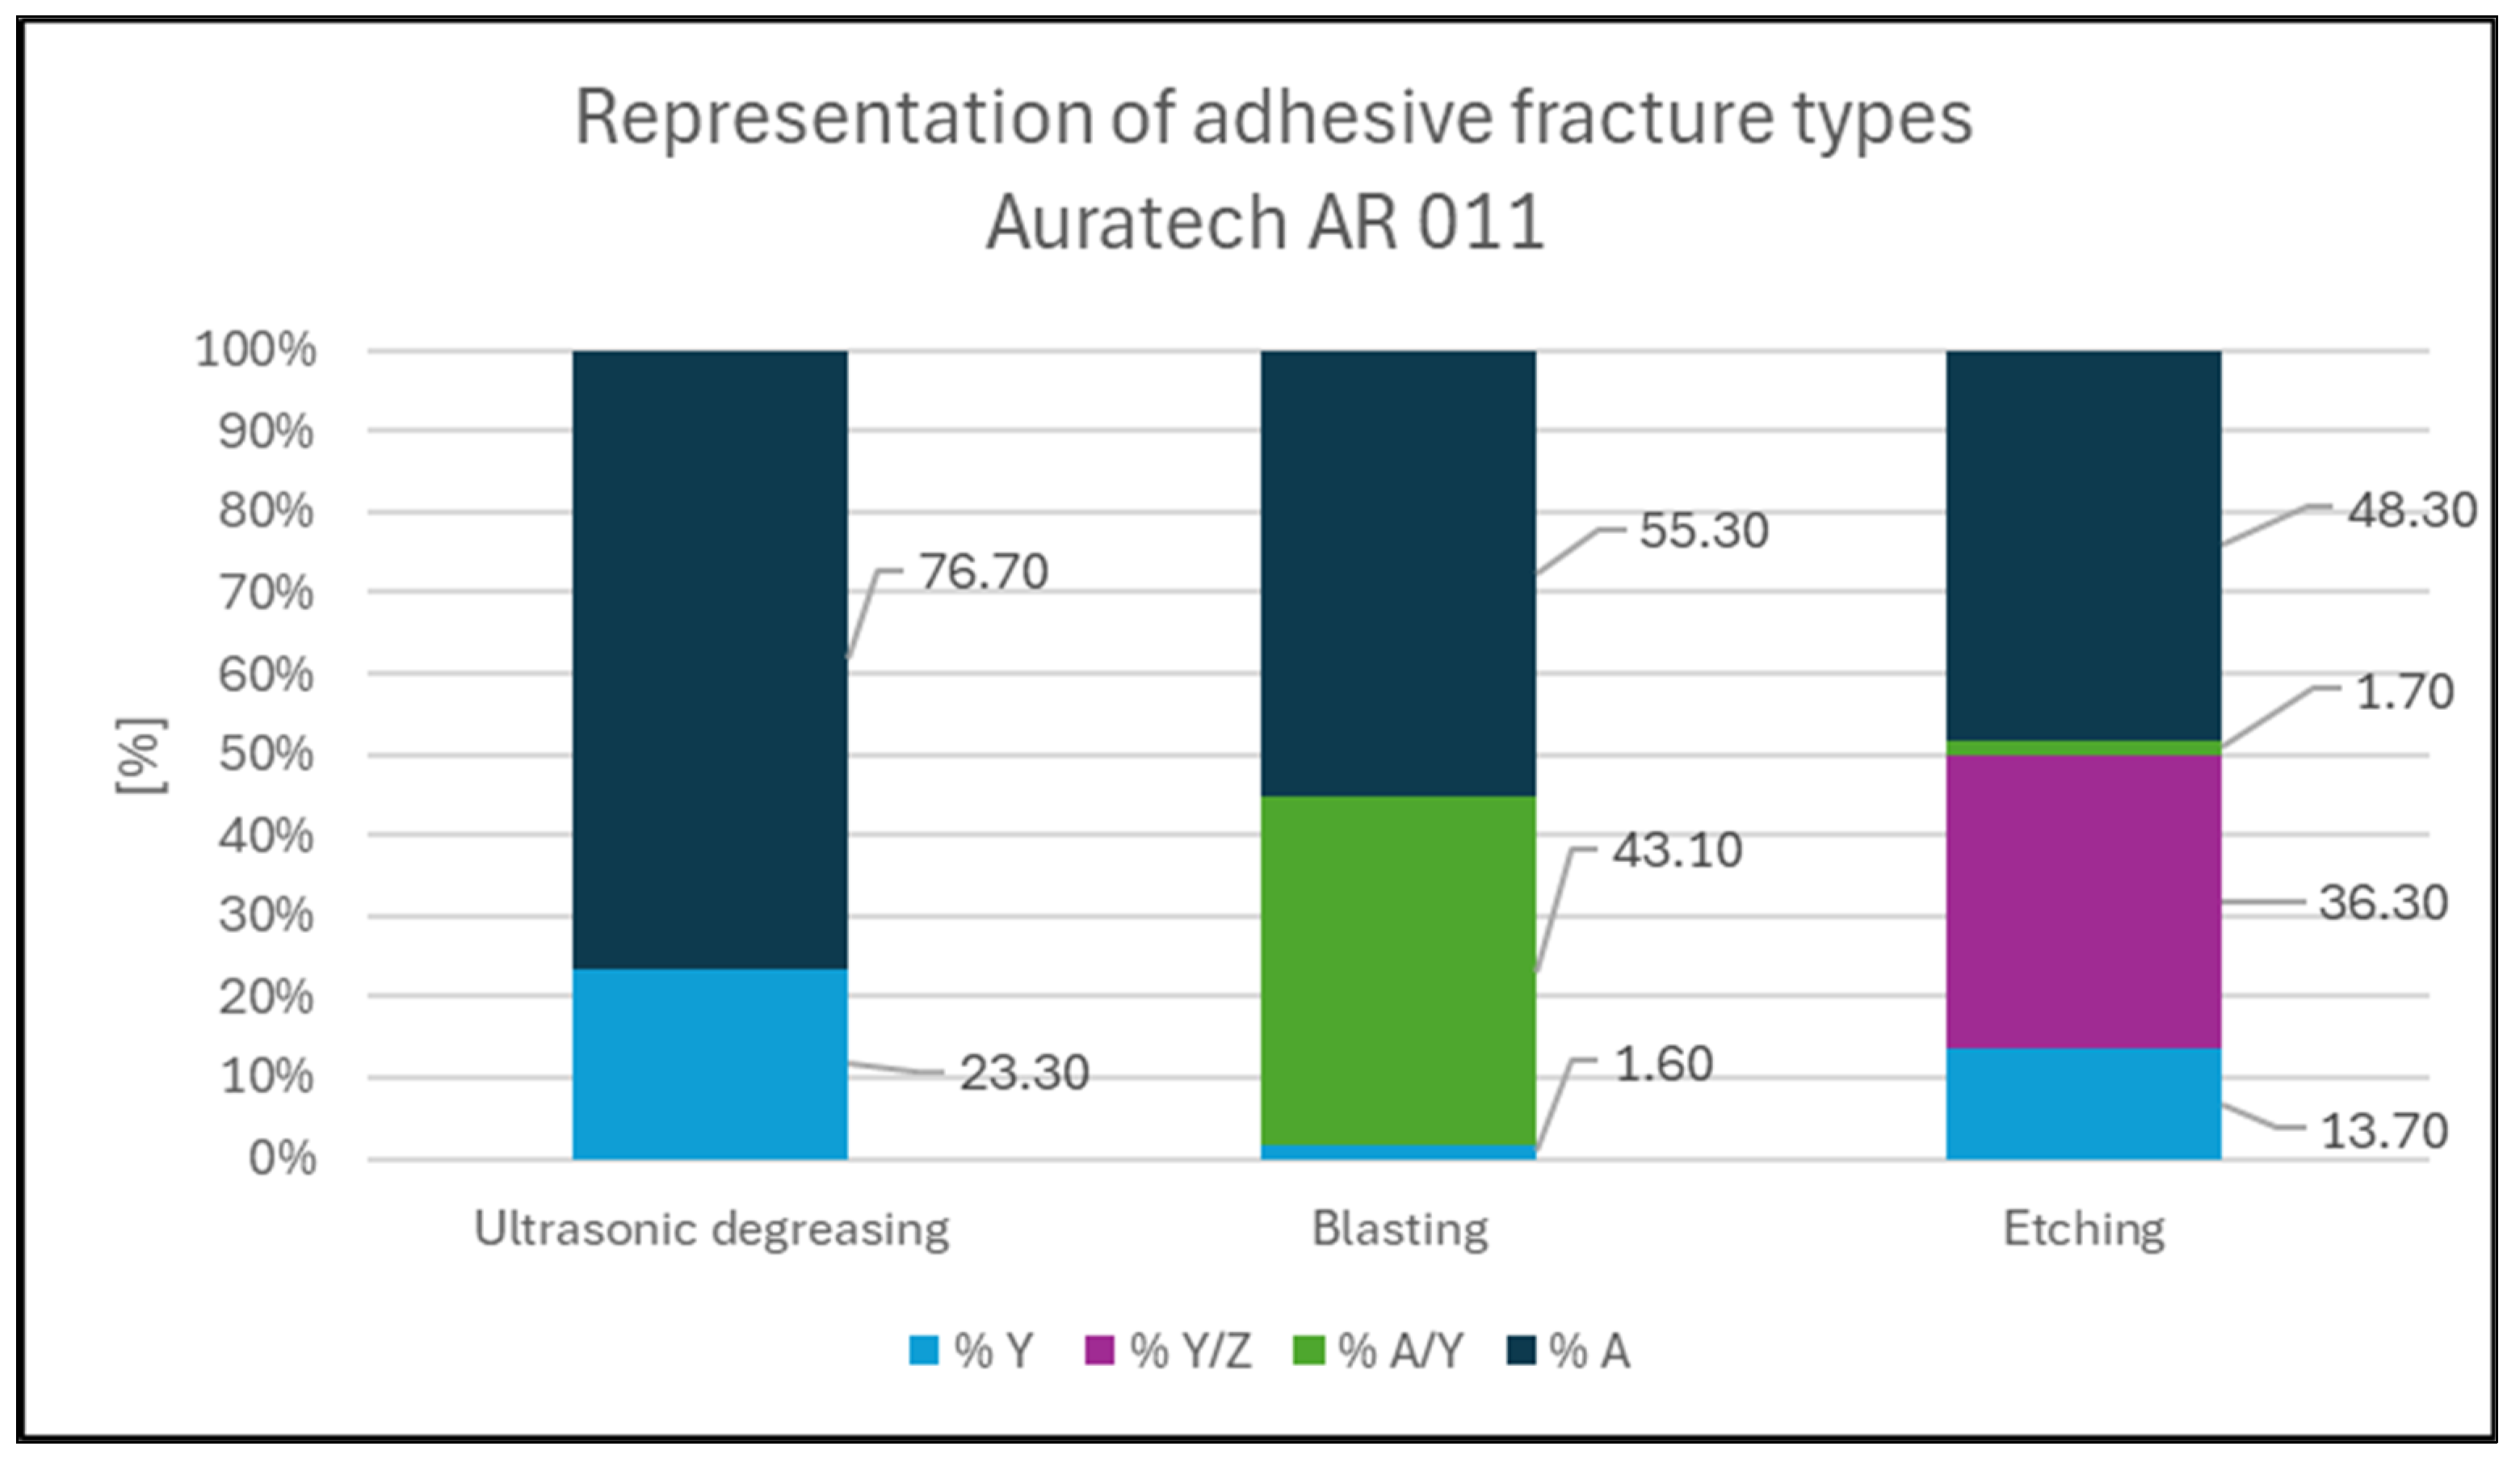
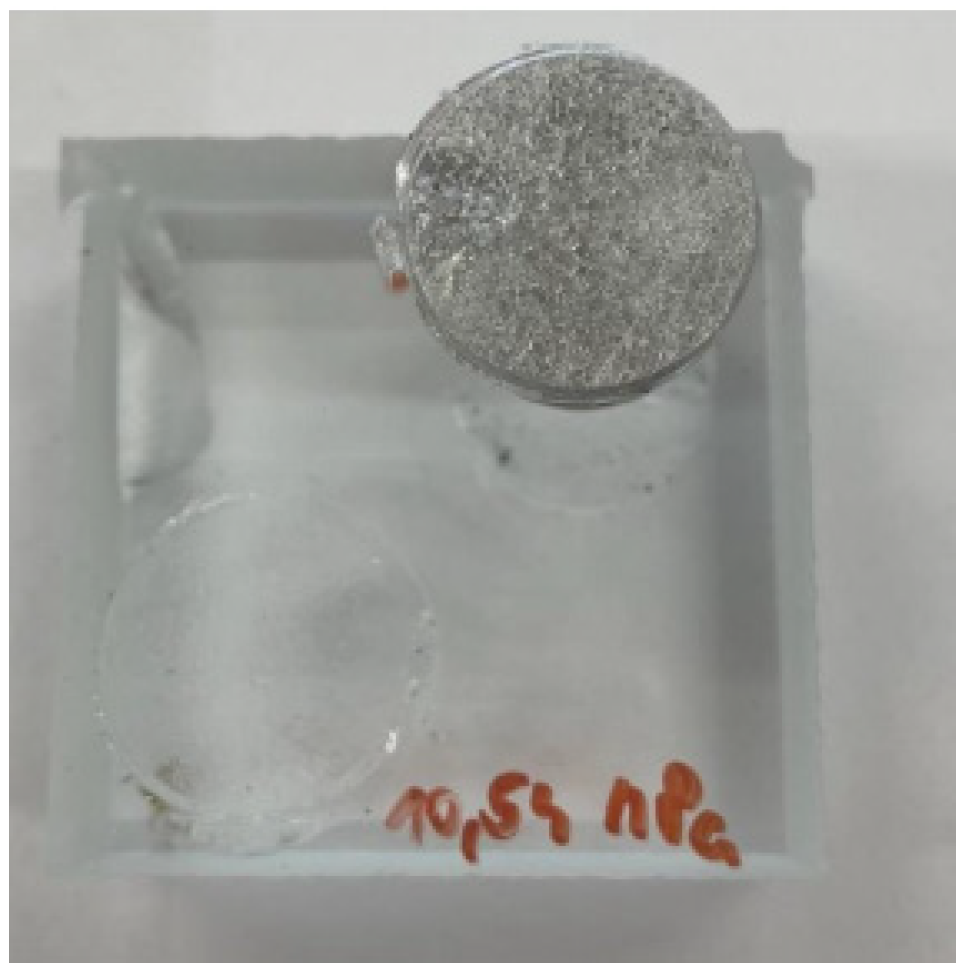
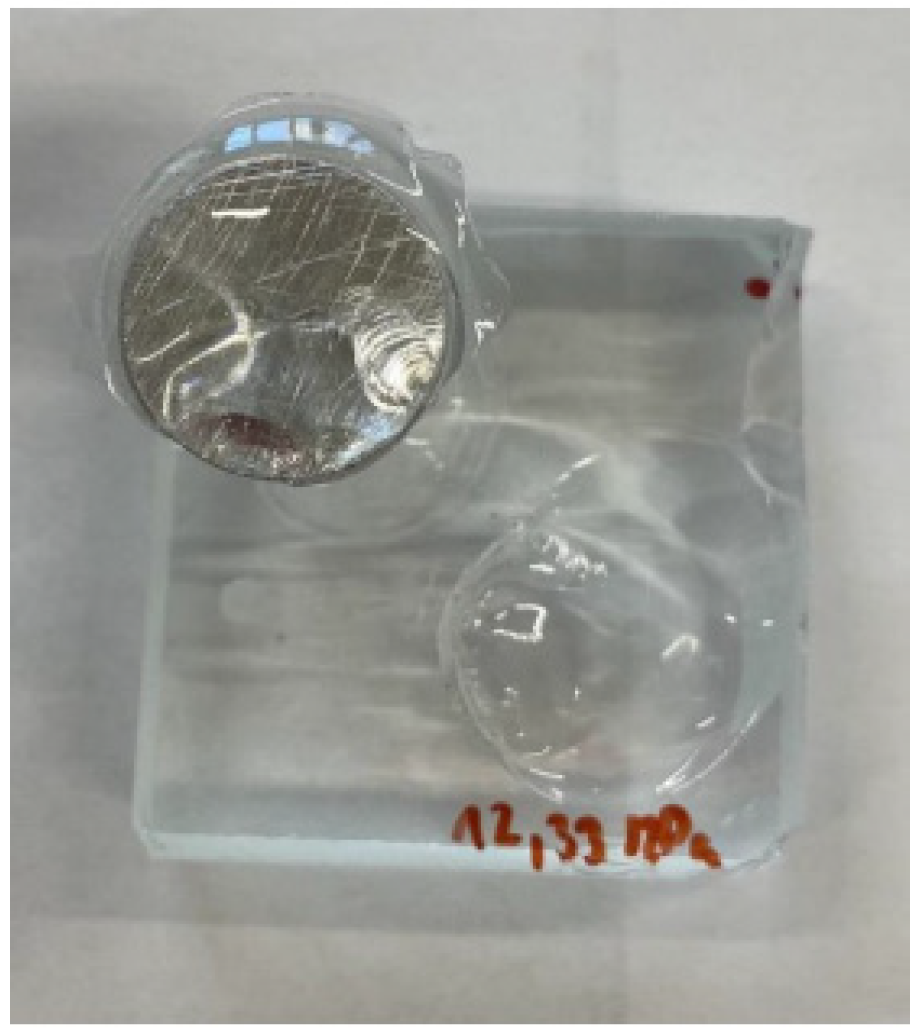
- In the case of the Auratech AR 011 adhesive, the most frequent failure that occurred was the cohesive fracture of the glass, as shown in Figure 8 (sample); in total, over 60% of the samples were broken, and the cohesive fracture (%Y) occurred most frequently in degreased samples (76.7%). In the case of blasted samples, 43% of the samples had adhesive fracture between the last layer (glass) and the adhesive (%A/Y). On the other hand, adhesion fracture between the adhesive and the test body (36.3%) was more frequent in the blasted samples (%Y/Z);
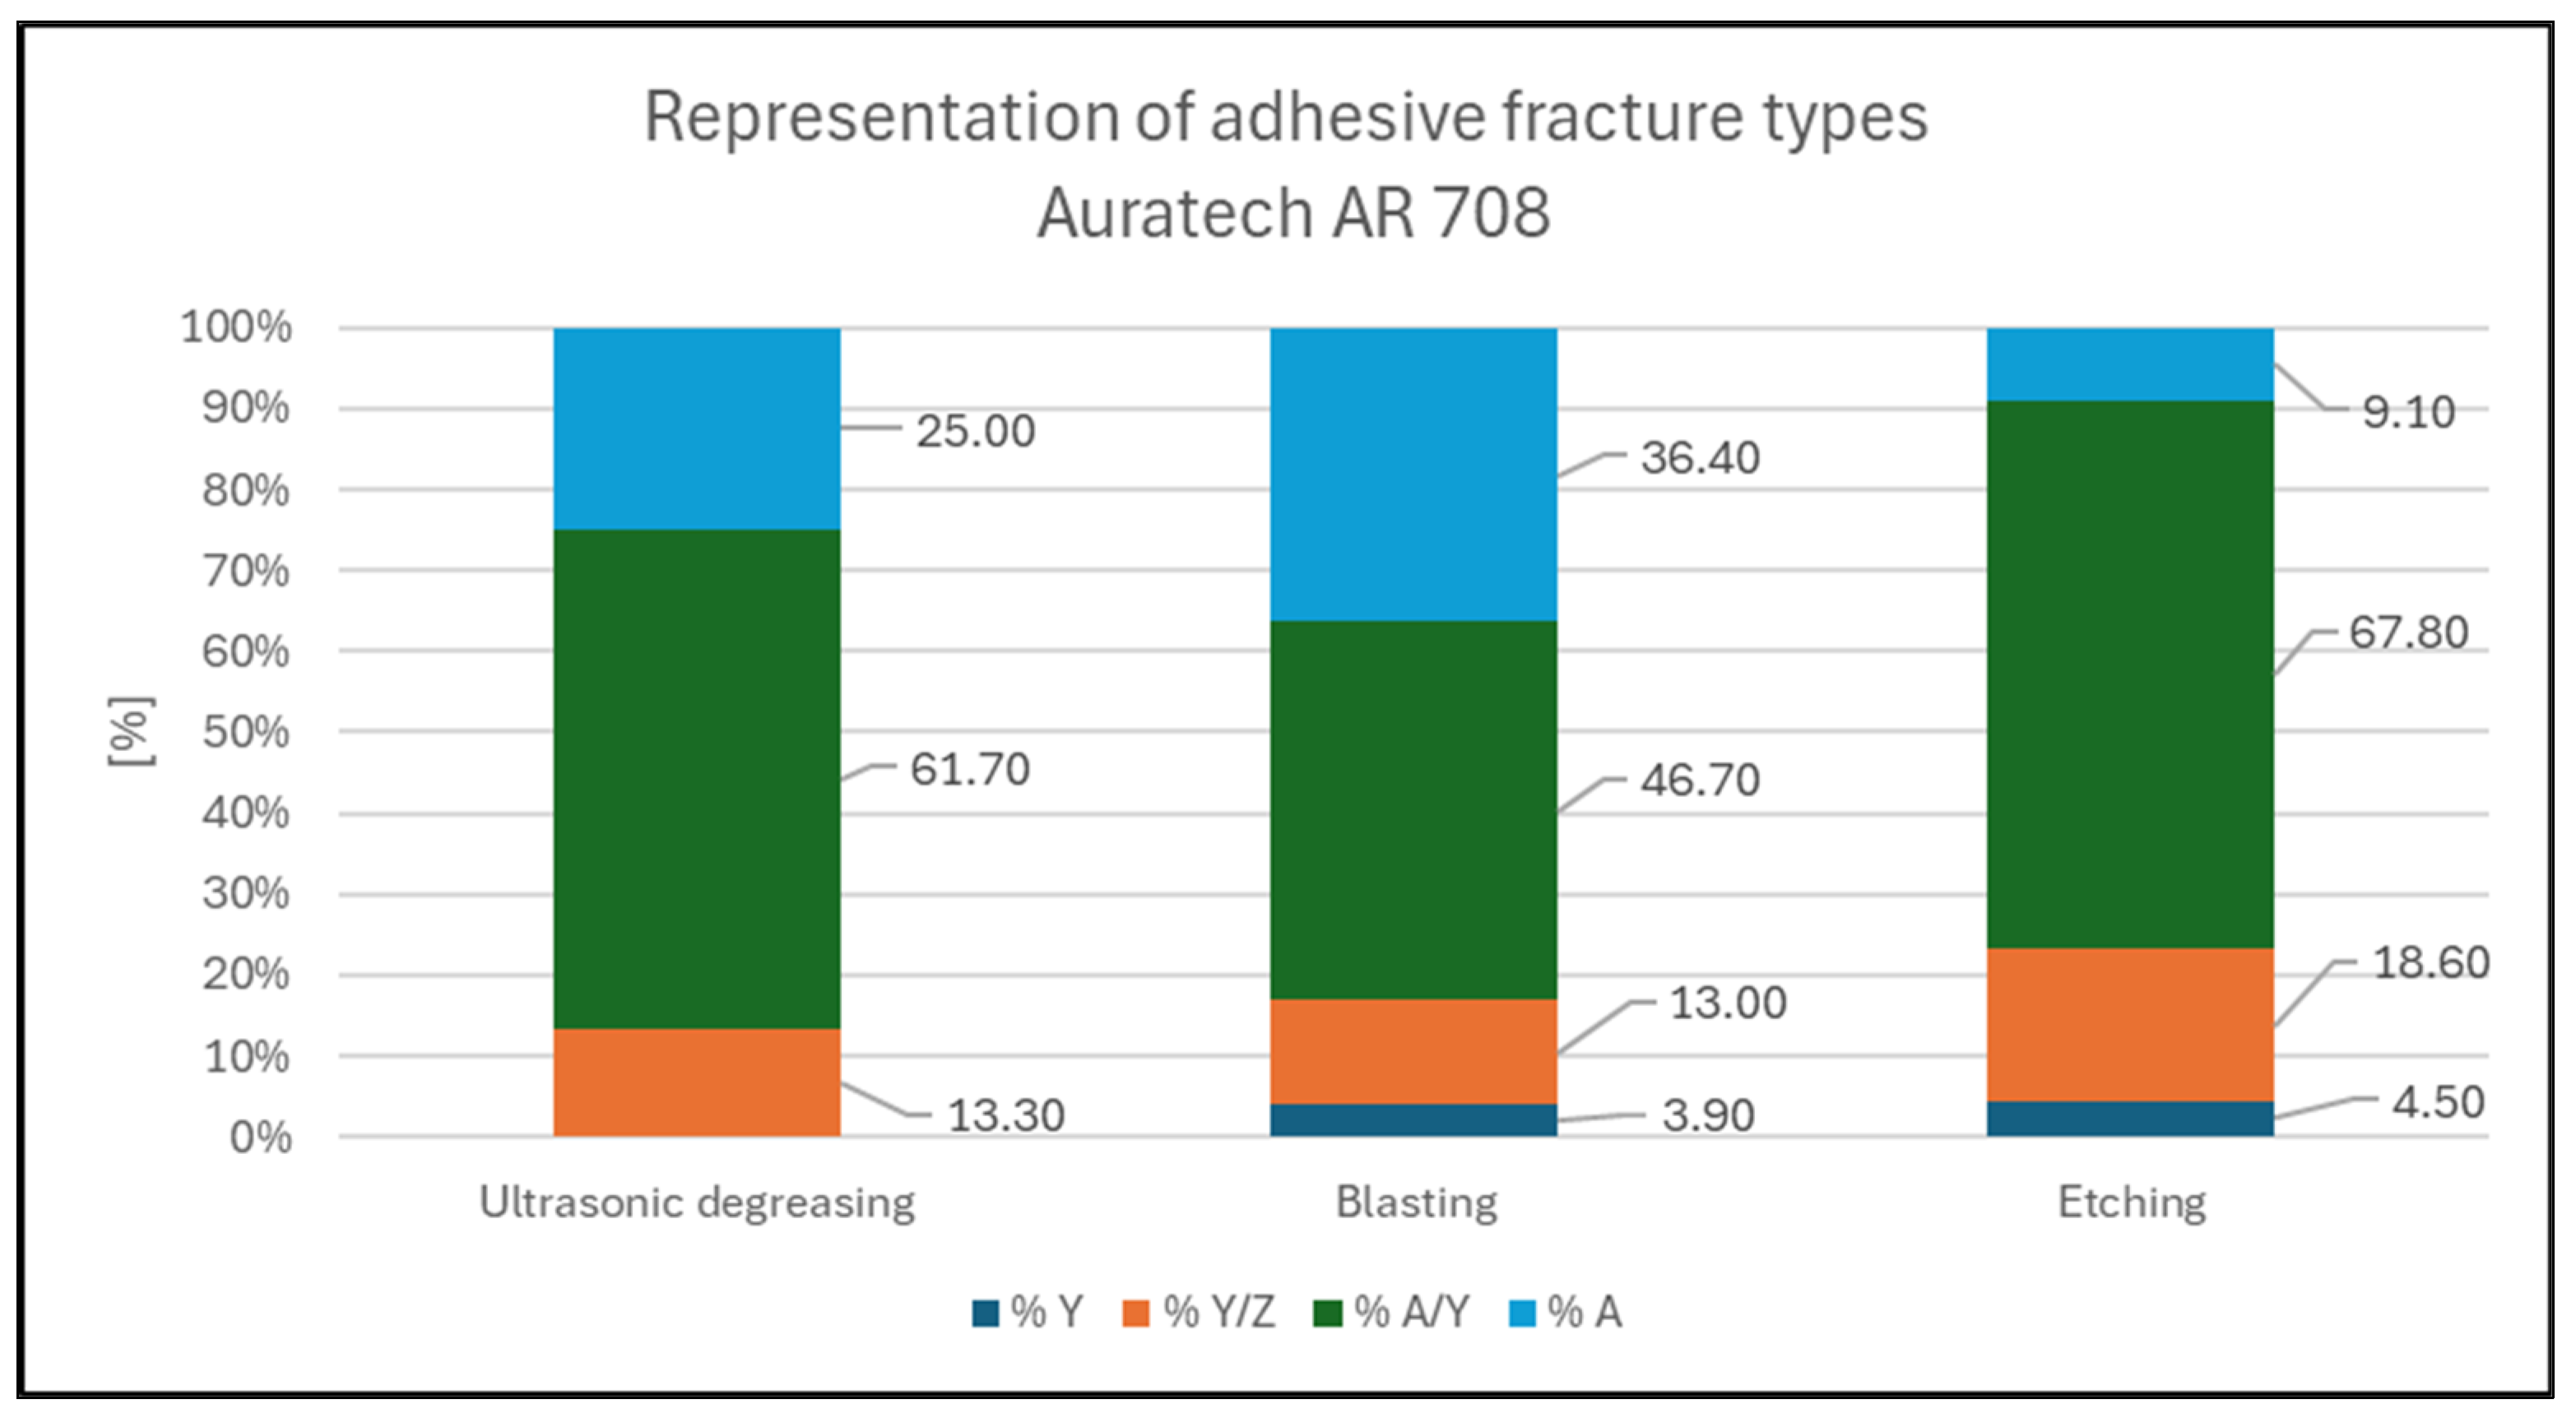
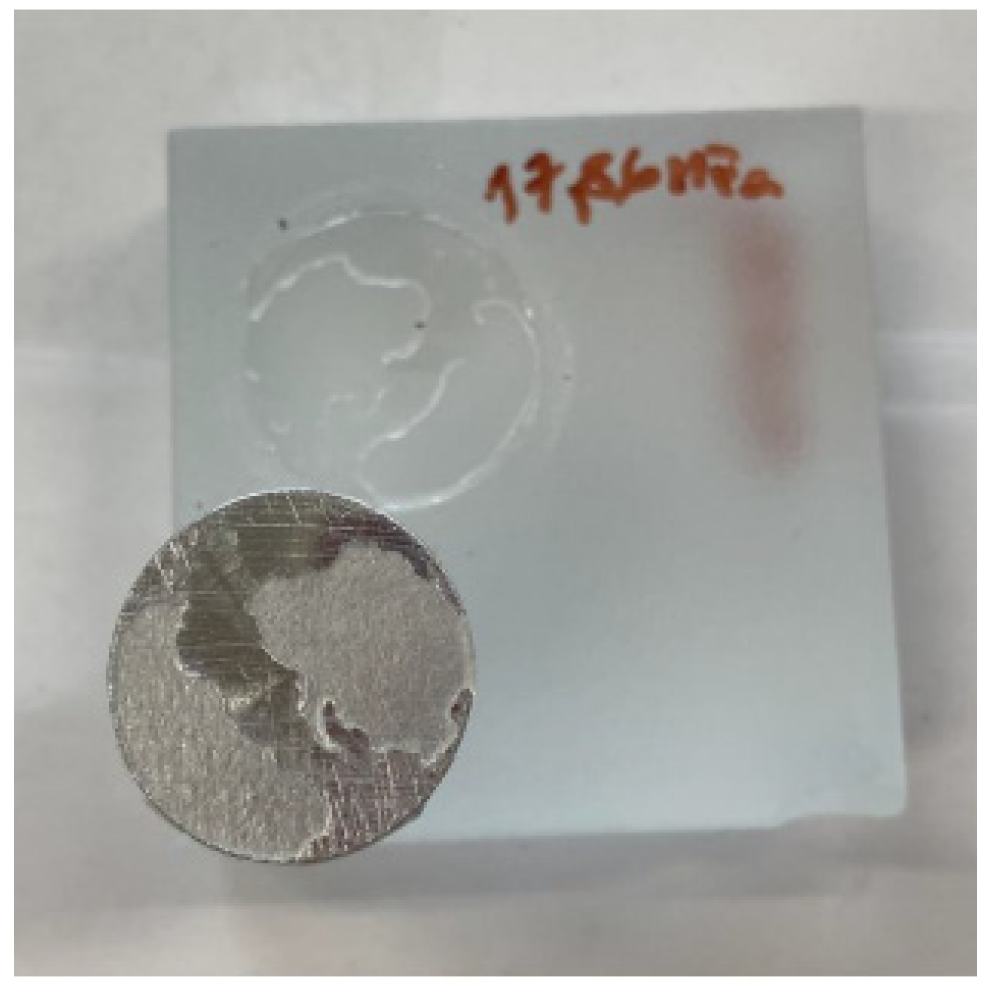
- In the case of the Auratech 708 adhesive, adhesive fracture between the sample and the adhesive (% A/Y), shown in Figure 9, occurred most frequently (altogether representing almost 59% of all pull-off events), followed by glass cohesive fracture (% A) (23.5% in total, mostly in the blasted samples), which occurred mainly in the second series of measurements. Adhesive fracture between the adhesive and the test body (%Y/Z) occurred in less than 15% of the pull-off samples. Cohesive fracture (%Y) occurred in less than 3% of cases and was not observed at all in the degreased samples.
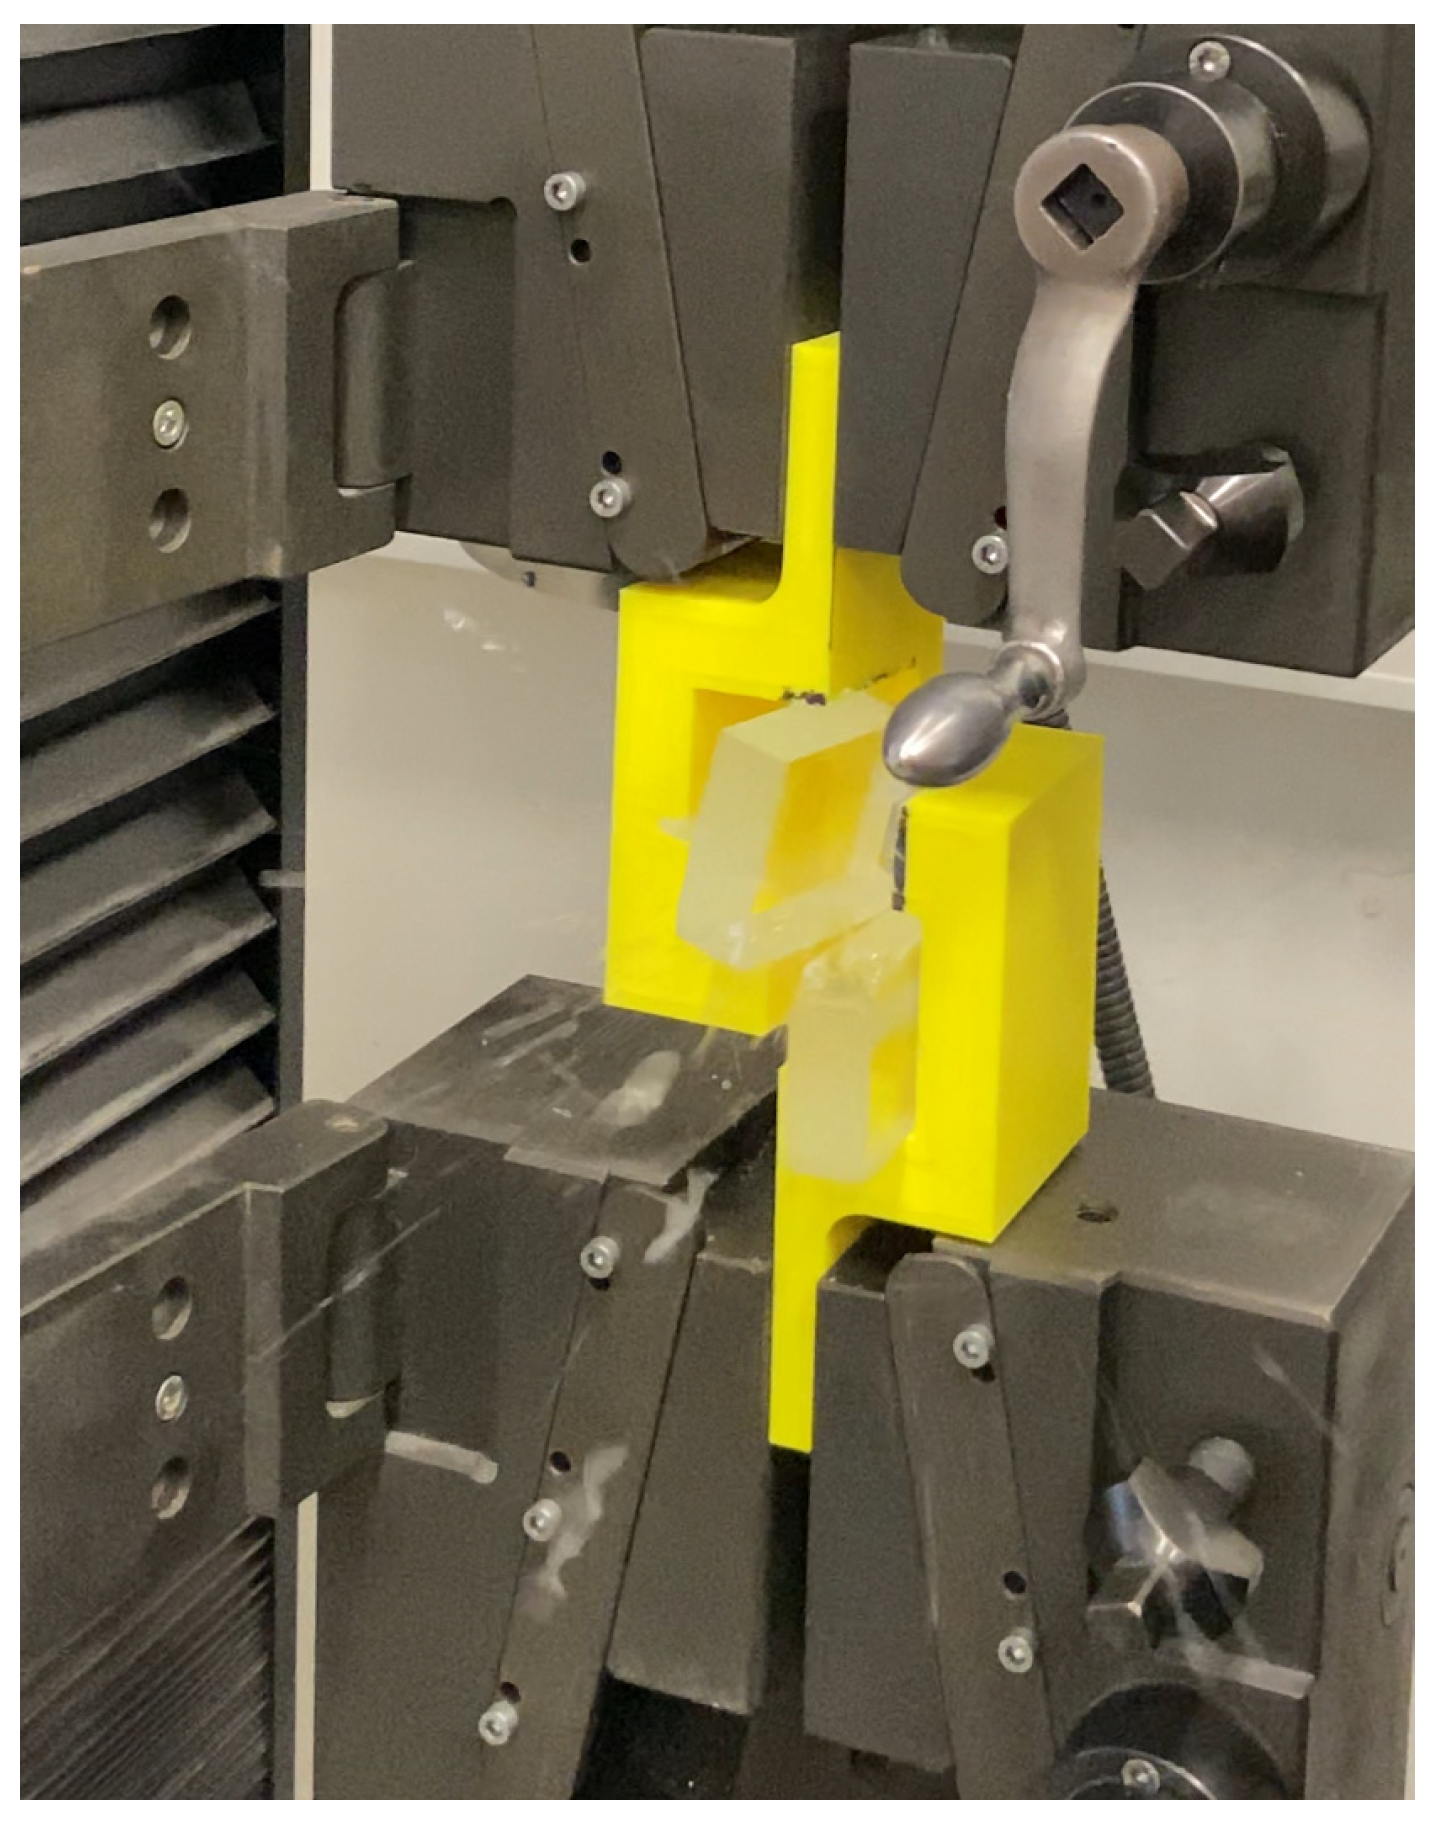
2.5. Shear Test
3. Conclusions
Author Contributions
Funding
Institutional Review Board Statement
Informed Consent Statement
Data Availability Statement
Acknowledgments
Conflicts of Interest
References
- Fernández Oro, J.M.; Argüelles Díaz, K.M.; Santolaria Morros, C.; Cobo Hedilla, A.F.; Lemaille, M. Multiphase modelling of pouring glass over the spout lip of an industrial float in the flat glass forming process. Int. J. Numer. Methods Fluids 2008, 58, 1147–1177. [Google Scholar] [CrossRef]
- Takeda, S. Oxygen and silver diffusion into float glass. J. Non-Cryst. Solids 2006, 352, 3910–3913. [Google Scholar] [CrossRef]
- Zhang, Q.; Chen, Z.; Li, Z. Simulation of tin penetration in the float glass process (float glass tin penetration). Appl. Therm. Eng. 2011, 31, 1272–1278. [Google Scholar] [CrossRef]
- Krohna, M.H.; Hellmanna, J.R.; Mahieub, B.; Pantano, C.G. Effect of tin-oxide on the hysical properties of soda-lime-silica glass. J. Non-Cryst. Solids 2005, 351, 455–465. [Google Scholar] [CrossRef]
- Ebnesajjad, S. 5-Material Surface Preparation Techniques. In Plastics Design Library; Handbook of Adhesives and Surface Preparation; William Andrew Publishing: Norwich, NY, USA, 2011; pp. 49–81. [Google Scholar] [CrossRef]
- Ebnesajjad, S. Surface Treatments of Materials for Adhesive Bonding, 2nd ed.; Elsevier: Oxford, UK, 2014; ISBN 978-0-323-26435-8. [Google Scholar]
- Mirski, Z.; Wojdat, T.; Zimniak, Z.; Łącka, I.; Pawełko, A. Effect of the Preparation of Aluminium, Magnesium and Titanium Alloys Surface on Properties of Adhesive Bonded Joints. Biul. Inst. Spaw 2017, 5, 81–90. [Google Scholar] [CrossRef] [PubMed]
- Jeon, S.-B.; Son, B.-K.; Choi, J.-W.; Son, I. Degreasing Efficiency of Electroplating Pretreatment Process Using Secondary Alcohol Ethoxylate as Nonionic Surfactant. Appl. Sci. 2022, 12, 11285. [Google Scholar] [CrossRef]
- Petrka, J. Lepení Konstrukčních Materiálů ve Strohírensví; SNTL: Rabat, Maroc, 1980. [Google Scholar]
- Khaskhoussi, A.; Calabrese, L.; Patané, S.; Proverbio, E. Effect of Chemical Surface Texturing on the Superhydrophobic Behavior of Micro–Nano-Roughened AA6082 Surfaces. Materials 2021, 14, 7161. [Google Scholar] [CrossRef] [PubMed]
- Lundevall, Å.; Sundberg, P.; Mattsson, L. Improved glass bonding with plasma treatment. Appl. Adhes. Sci. 2018, 6, 9. [Google Scholar] [CrossRef]
- Naat, N.; Boutar, Y.; Naïmi, S.; Mezlini, S.; Da Silva, L.F.M. Effect of surface texture on the mechanical performance of bonded joints: A review. J. Adhes. 2021, 99, 166–258. [Google Scholar] [CrossRef]
- Takeda, S.; Yamamoto, K.; Hayasaka, Y.; Matsumoto, K. Surface OH group governing wettability of commercial glasses. J. Non-Cryst. Solids 1999, 249, 41–46. [Google Scholar] [CrossRef]
- Prakash, C.G.J.; Prasanth, R. Approaches to design a Surface with tunable wettability: A review on surface properties. J. Mat. Sci. 2021, 56, 108–135. [Google Scholar] [CrossRef]
- Rudawska, A.; Miturska-Barańska, I.; Doluk, E.; Olewnik-Kruszkowska, E. Assessment of Surface Treatment Degree of Steel Sheets in the Bonding Process. Materials 2022, 15, 5158. [Google Scholar] [CrossRef] [PubMed]
- Penar. Leptací Pasta. Available online: https://www.pentart.cz/leptaci-pasta-50ml-glass-etching-paste (accessed on 20 January 2022).
- Henkel, LOCTITE-EA-9455. Available online: https://datasheets.tdx.henkel.com/LOCTITE-EA-9455-cs_CZ.pdf (accessed on 5 June 2015).
- Comyn, J. Introduction to adhesion and adhesives. In Adhesion Science; The Royal Society of Chemistry: London, UK, 1997. [Google Scholar] [CrossRef]
- Auratech, Auratech708. Available online: http://www.auratech.cz/Auratech/media/auratech/Technicke-listy/Konstrukcni%20lepidla/AR-708_technicky-list.pdf (accessed on 21 August 2015).
- Auratech, AR001. Available online: http://www.auratech.cz/Auratech/media/auratech/Technicke-listy/Vterinova%20lepidla/AR-011_technicky-list.pdf (accessed on 3 October 2012).
- Boutar, Y.; Eliášová, M.; Tichá, P.; Zikmundová, M. Assessment of the mechanical behavior of bonded glass-to-glass transparent epoxy adhesive joint at elevated temperatures for load-bearing elements. Int. J. Adhes. Adhes. 2023, 127, 103526. [Google Scholar] [CrossRef]
- AGC. Available online: https://www.agc-yourglass.com/sites/default/files/brochures/original/yg_pocket_2015_cz.pdf (accessed on 6 June 2015).
- ČSN EN ISO 21920-2; Geometrical Product Specification (GPS)—Surface Structure: Profile—Part 2: Terms, definitions and parameters of the surface structure. ISO: Geneva, Switzerland, 2022.
- Leach, R. (Ed.) Characterisation of Areal Surface Texture; Springer: Berlin/Heidelberg, Germany, 2013; ISBN 978-3-642-36458-7. [Google Scholar]
- Lacombe, R. Adhesion Measurement Methods: Theory and Practice, 1st ed.; CRC Press: Boca Raton, FL, USA, 2005. [Google Scholar] [CrossRef]
- ČSN EN ISO 4624:2016; Nátěrové Hmoty—Odtrhová Zkouška Přilnavosti. ISO: Geneva, Switzerland, 2016.
- ATRYX, Praktická Příručka—Hodnocení Přilnavosti Nátěru|ATRYX s.r.o. Nátěrové Hmoty|ATRYX s.r.o. 2018. Available online: https://atryx.cz/prakticka-prirucka/16-hodnoceni-prilnavosti (accessed on 5 March 2024).
- Gamin, Elcometer 510 Automatický Odtrhoměr. Available online: https://www.elcometer.cz/fileadmin/user_upload/Automaticky_odtrhomer_Elcometer_510.pdf (accessed on 11 July 2024).


| Adhesive Type | Technology Used | Sample Page | Set 1 [MPa] | Set 2 [MPa] | Average Values of Breaking Stresses [MPa] |
|---|---|---|---|---|---|
| Loctite | Ultrasonic | Tin side | 10.28 | 17.23 | 13.74 |
| EA 9455 | degreasing | Air side | 9.88 | 12.96 | 11.42 |
| Tin side | 10.73 | 14.05 | 12.39 | ||
| Blasting | Air side | 12.92 | 12.67 | 12.79 | |
| Etching | Tin side | 19.54 | 9.92 | 14.73 | |
| Air side | 18.62 | 8.84 | 13.73 | ||
| Auratech | Ultrasonic | Tin side | 12.03 | 8.74 | 10.39 |
| AR 011 | degreasing | Air side | 14.18 | 10.49 | 12.33 |
| Tin side | 13.03 | 9.15 | 11.09 | ||
| Blasting | Air side | 11.77 | 10.52 | 11.15 | |
| Etching | Tin side | 11.53 | 9.61 | 10.57 | |
| Air side | 9.38 | 12.26 | 10.82 | ||
| Auratech | Ultrasonic | Tin side | 14.89 | 11.05 | 12.97 |
| AR 708 | degreasing | Air side | 14.94 | 14.50 | 14.71 |
| Tin side | 11.19 | 15.44 | 13.31 | ||
| Blasting | Air side | 15.59 | 12.41 | 14.32 | |
| Etching | Tin side | 21.28 | 12.45 | 17.75 | |
| Air side | 19.46 | 12.44 | 15.95 |
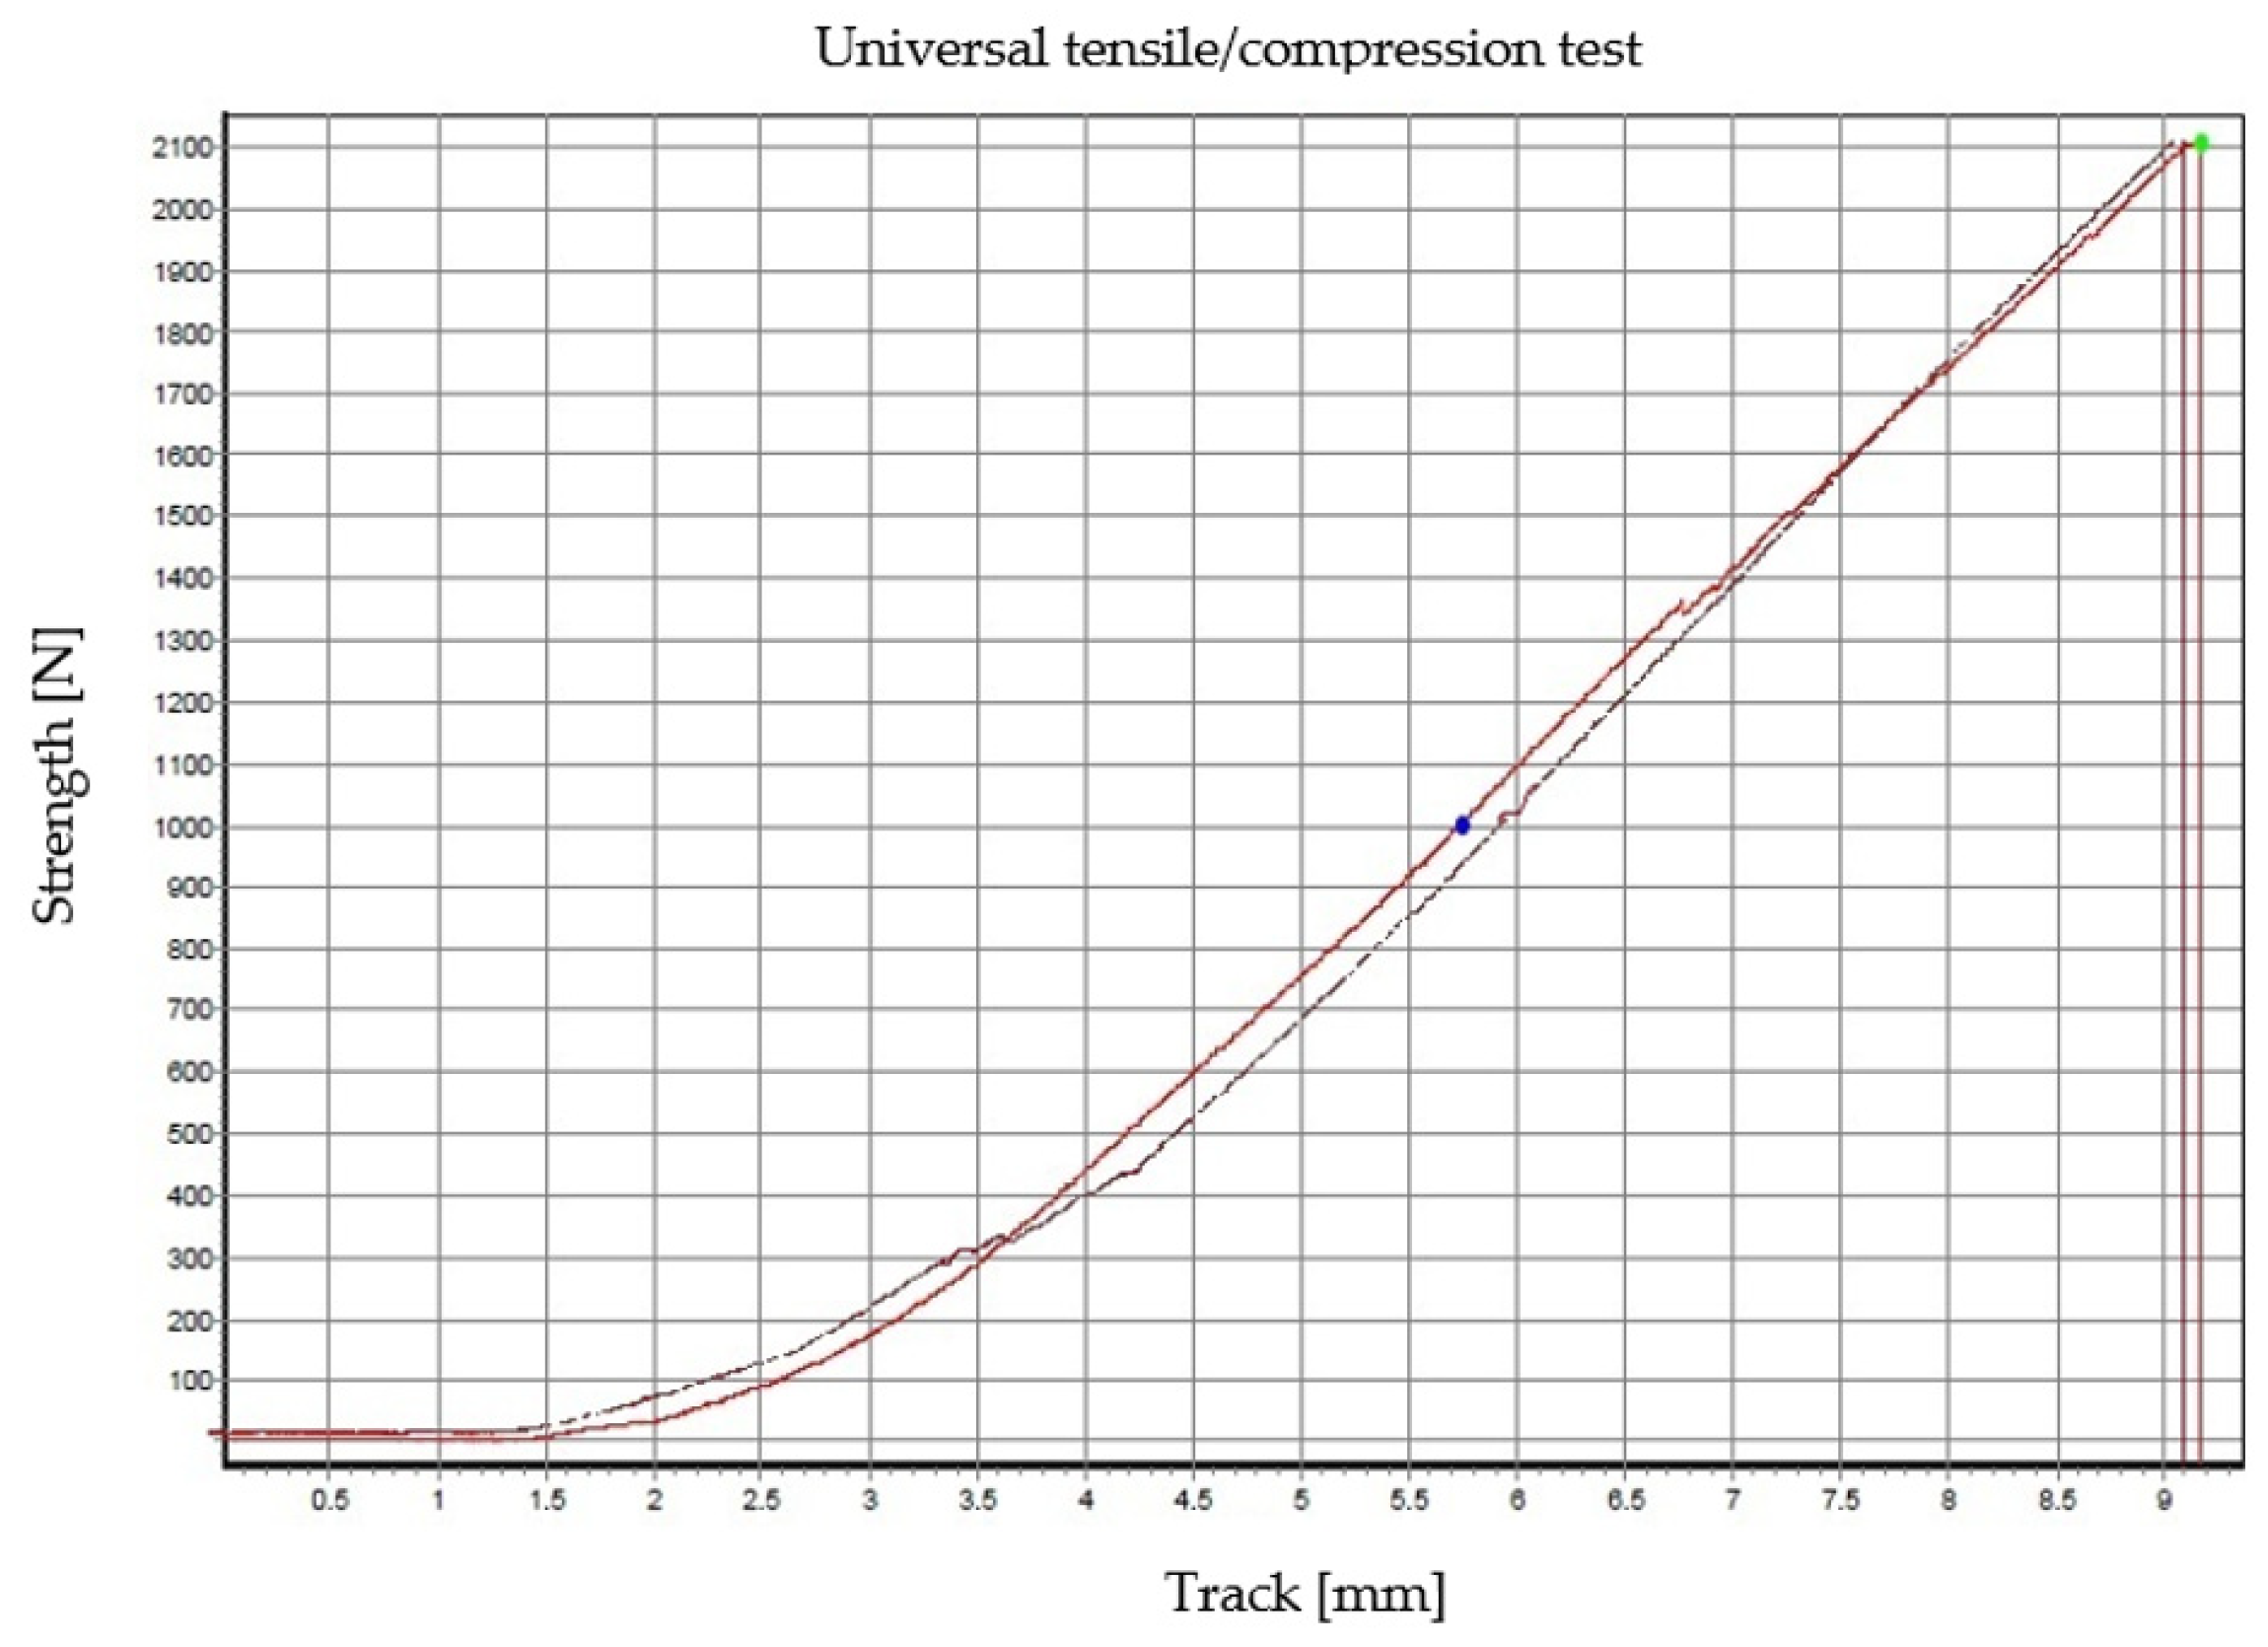
| Adhesive Type | Force at Breakage [N] |
| Loctite EA 9455 | 2108.90 |
| Auratech AR 708 | 2082.20 |
Disclaimer/Publisher’s Note: The statements, opinions and data contained in all publications are solely those of the individual author(s) and contributor(s) and not of MDPI and/or the editor(s). MDPI and/or the editor(s) disclaim responsibility for any injury to people or property resulting from any ideas, methods, instructions or products referred to in the content. |
© 2025 by the authors. Licensee MDPI, Basel, Switzerland. This article is an open access article distributed under the terms and conditions of the Creative Commons Attribution (CC BY) license (https://creativecommons.org/licenses/by/4.0/).
Share and Cite
Bachurová, N.; Kudláček, J.; Kuchař, J.; Červený, J. The Effect of Surface Pretreatments on the Reliability of Glass Bonded Joints. Coatings 2025, 15, 232. https://doi.org/10.3390/coatings15020232
Bachurová N, Kudláček J, Kuchař J, Červený J. The Effect of Surface Pretreatments on the Reliability of Glass Bonded Joints. Coatings. 2025; 15(2):232. https://doi.org/10.3390/coatings15020232
Chicago/Turabian StyleBachurová, Nikol, Jan Kudláček, Jiří Kuchař, and Jaroslav Červený. 2025. "The Effect of Surface Pretreatments on the Reliability of Glass Bonded Joints" Coatings 15, no. 2: 232. https://doi.org/10.3390/coatings15020232
APA StyleBachurová, N., Kudláček, J., Kuchař, J., & Červený, J. (2025). The Effect of Surface Pretreatments on the Reliability of Glass Bonded Joints. Coatings, 15(2), 232. https://doi.org/10.3390/coatings15020232