Article

In-Flight Particle Oxidation Evolution in HVAF: A Numerical Study

by
Sokhna Awa Bousso Diop
1,*,
Aleksandra Nastic
1,2,
Ali Dolatabadi
2,
Reza Attarzadeh
2 and
Christian Moreau
1
1
Department of Mechanical, Industrial and Aerospace Engineering, Concordia University, Montreal, QC H3G 1M8, Canada
2
Centre for Advanced Coating Technologies (CACT), University of Toronto, Toronto, ON M5S 1A1, Canada
*
Author to whom correspondence should be addressed.
Coatings 2025, 15(2), 215; https://doi.org/10.3390/coatings15020215
Submission received: 23 December 2024 / Revised: 5 February 2025 / Accepted: 6 February 2025 / Published: 11 February 2025

Abstract

:
Oxygen present in the High Velocity Air-Fuel (HVAF) process can react with the in-flight metallic particles and cause their oxidation. A grown brittle oxide shell on metallic micro-size particles can reduce their deposition efficiency and impair the coating’s final deposited properties/microstructure. In the current study, the oxide growth of MCrAlY particles, where M stands for Nickel (Ni) and Cobalt (Co), during their flight in the HVAF process has been numerically modeled and validated with experimental single-particle depositions. A thorough theoretical oxide layer growth background is also presented. The utilized oxidation development follows the Mott–Cabrera theory for very thin films, which uses the particle surrounding temperature and oxygen partial pressure to track and describe the oxide growth. The obtained results provide a good correlation between the HVAF system design, the operating conditions, and surface oxidation phenomena observed using focus ion beam scanning electron microscope (FIB/SEM) analysis on collected particles. Furthermore, the particle’s degree of oxidation in HVAF is compared to High Velocity Oxy-Fuel (HVOF) to demonstrate the influence of combustion processes on oxidation level.

1. Introduction

The High-Velocity Air-Fuel (HVAF) process is one of the few solid-state deposition methods, alongside cold spray (CS) and warm spray (WS) techniques [1]. The WS method is a variant of the combustion-driven High Velocity Oxy-Fuel (HVOF) process, where nitrogen gas is injected before the convergent-divergent nozzle in the mixing chamber. This adjustment allows for a lower flame temperature and, subsequently, a reduced in-flight temperature of the particles [2]. However, while the gas temperature is still deemed high; oxidation occurs and alters the solid particle phases [3]. In contrast, CS is a non-combustion process that deposits particles at around room temperature, utilizing low stagnation temperatures and pressures [4]. Since there is no melting involved, adhesion at the interface between the particles and the substrate relies entirely on the kinetic energy of the particles, as demonstrated by Wang et al. [5].
The HVAF spraying technique differs from HVOF in the oxidizer used during combustion. While HVOF employs pure oxygen, HVAF uses compressed air. In HVAF, a fuel-air mixture is injected into the combustion chamber, and the resulting combustion products form a gas jet that is accelerated through a convergent-divergent nozzle to supersonic speeds, generating diamond shocks at the nozzle exit. Particles are injected axially into the combustion chamber with the help of a carrier gas, typically nitrogen. The target surface to be coated is positioned at a specific distance known as the standoff distance (SOD), where the particles are projected to collide and form the desired coating. Before the introduction of HVAF, HVOF was massively utilized, for instance, in the aerospace industry to provide coatings with anti-corrosive or wear-resistant properties [6]. However, the high flame temperatures produced by HVOF can be detrimental to the materials used in critical applications, such as gas turbines, as well as to the mechanical properties of the deposited coatings.
The properties of a coating depend not only on the spraying process but also significantly on the composition of the spraying material. This study utilizes MCrAlY powder, where M represents cobalt (Co) or nickel (Ni). These materials, classified as superalloys, exhibit exceptional resistance to high operating temperatures, corrosion, and oxidation. MCrAlY is commonly used as a bond coat in thermal barrier coatings (TBCs), which are applied to turbine blades and gas turbines to insulate components from prolonged heat exposure and improve efficiency [7,8]. The corrosion and oxidation resistance of MCrAlY is due to the formation of a protective aluminum oxide layer. However, the formation of non-protective oxides, such as chromium oxide and nickel oxide, can occur when aluminum concentration is insufficient to sustain the growth of stable alumina. Research by Zakeri et al. [9] indicates that incorporating elements like cobalt and yttrium into the powder composition can enhance coating performance—cobalt improves ductility, while yttrium enhances adhesion to the oxide layer. While oxidation is necessary in TBC applications, the oxidation of feedstock powder particles prior to deposition can be detrimental. Lu et al. [8] showed that oxidation during flight negatively impacts the interfacial adhesion of the bond coat, leading to cracks that facilitate oxygen diffusion. The HVAF process, characterized by high-velocity, low-temperature particles and the oxidation resistance of MCrAlY, can produce high-quality coatings with minimal oxide content. The degree of oxidation of the in-flight particles is in many cases an important feature relating to the coating quality and therefore must be controlled and properly predicted. Khamsepour et al. [1] have demonstrated the effect of the oxide thickness on the bonding mechanism between the particle and the substrate. Results showed that bonding occurs if the particle velocity is higher than a certain critical value, enough to break off the oxide layer and create atomic bonding. A low oxide formation would result in better adhesion as the critical velocity required for its local fragmentation would be reduced.
Estimating the oxide content in thermal spraying is challenging due to the precision required to accurately characterize the particle/coating oxide thickness at the nanometer level. While a weight measurement of the deposited particles is typically conducted, it does not clearly identify the oxide produced during in-flight and post-impact stages. This explains the importance of studying particle oxidation in thermal spray, particularly during HVAF using predictive computational fluid dynamics (CFD) simulations. In this context, numerous studies have been conducted. First, Dai et al. [10] investigated the oxidation of an Al-Mg alloy during reactive spray deposition using the Mott and Cabrera theory for very thin films. They reported that the oxidation rate decreases with a decreasing temperature and/or oxygen partial pressure. N. Zeoli et al. [11] have also studied the in-flight oxidation of composite powder particles in HVOF. Their results demonstrate that the oxide is strongly dependent on the particle’s diameter: small particles oxidize more than large particles. Furthermore, the quantity of oxide uptake in certain particles is dependent upon the injection location at the subsonic or supersonic region. In their study, Wu et al. [12] thoroughly examined the oxidation of composite powder particles in HVAF. Their findings reinforce the established relationship between oxidation rate and particle size, while also highlighting the significant impact of the equivalence ratio. This ratio, which compares the actual air-fuel ratio (AFR) to the stoichiometric mixture for a given scenario, is demonstrated by their experimental results. In most HVAF or HVOF processes, the air-fuel mixture inlets are evenly distributed across a ceramic sheet. However, in this study, the mixture travels through holes located around the outer edge of the ceramic sheet. This unique feature affects the oxidation rate and requires further investigation to understand its role in particle in-flight oxidation.
In the current study, a numerical model is developed to predict the oxide thickness and oxidation rate of MCrAlY particles during their flight in the HVAF process. A comprehensive theory behind temporal oxide development is provided and included in the numerical model. The combustion process, the resulting gas flow characteristics, the thermal and dynamic behavior of particles (discrete phase), and more importantly, the oxidation process and oxide growth are simultaneously analyzed and discussed in detail. The in-flight thermal behavior of particles accounts for heating, melting, cooling, and oxidation processes. The oxide particle thickness is validated/measured from a sampled deposited particle.

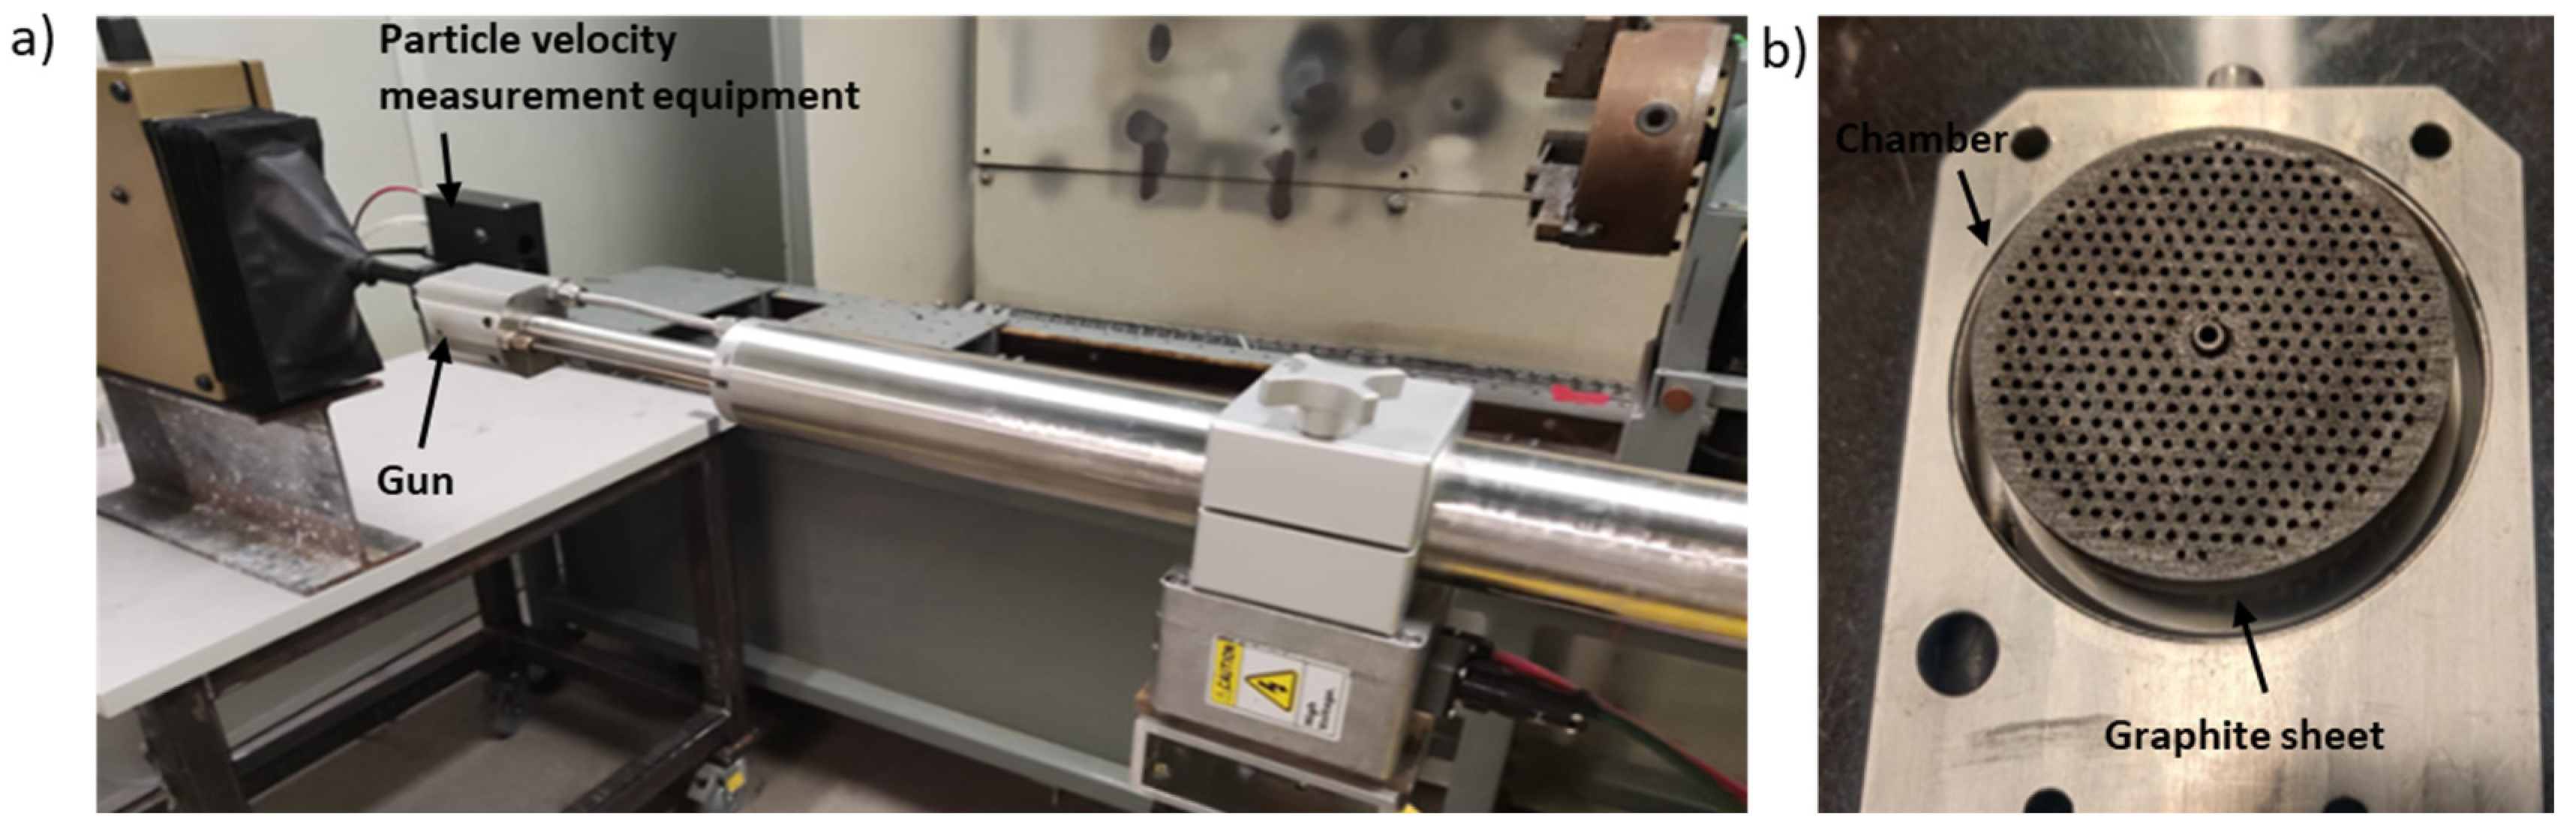
2. Experimental Set-Up

2.1. Powder Material

Oxidation results from the interaction between the powder and the surrounding oxygen-rich environment. Consequently, the characterization of the feedstock powder material is essential for studying particle oxidation. The microstructure of the presented powder material has been analyzed using scanning electron microscopy (SEM NX5000, Hitachi, Tokyo, Japan) equipped with energy-dispersive x-ray spectroscopy (EDS, Su 9000, Hitachi, Japan), as shown in Figure 1. The MCrAlY (Amdry 386, Oerlikon Metco, New York, NY, USA) material utilized in this study has a nominal composition of Ni-22Co-17Cr-12.5Al-0.25Hf-0.4Si-0.6Y. According to the SEM analysis, six distinct metals are detected, including aluminum (Al), silicon (Si), chromium (Cr), cobalt (Co), nickel (Ni), and yttrium (Y). The metals segregate into two major phases, which are the β -phase, an Al-rich phase, and the γ -phase, a Ni-rich phase, observed in Figure 1. The aluminum concentration across the particle cross-section is not uniform. A concentration of 23.3 atomic percent (at%) of aluminum is measured, corresponding to a weight percentage of 12.5%.
Due to the low-energy formation of aluminum oxide ( H f , A l 2 O 3 1650   K J m o l , H f , C r 2 O 3 1130   K J / m o l ,   H f , N i O 240   K J / m o l ), its formation on the particle surface is expected to develop first before any other oxide material [9]. Hence, due to its prevalence, the growth of aluminum oxide (alumina, Al2O3) is analyzed in this study. Its formation occurs at the surface of the powder through the following chemical reaction:
4 N i A l + 3 O 2 2 A l 2 O 3 + 4 N i .
As described by Equation (1) and illustrated in Figure 1, the formation of alumina arises from the upstream diffusion of aluminum outward of the β-NiAl phase of the MCrAlY, which serves as the aluminum reservoir. If the reservoir becomes depleted of aluminum, the following secondary oxides will start forming on the MCrAlY surface (chromium oxide (Equation (2)), nickel aluminate (Equation (3)), and nickel chromite (Equation (4)).
A l 2 O 3 + 2 C r 2 A l + C r 2 O 3 ,  
A l 2 O 3 + 1 2 O 2 + N i N i A l 2 O 4 ,  
N i O + C r 2 O 3 + A l 2 O 3 N i ( C r , A l ) 2 O 4 .  
However, the high in-flight particle velocities (600–800 m/s) [13] and resulting short travel time (order of milliseconds) of particles within the HVAF process greatly limit MCrAlY aluminum depletion in the β-NiAl reservoir. According to the findings of A. Zakeri et al. [9], spinel, an oxide comprising two types of metal ions in cubic close-packed layers, begins to develop only after 100 h of oxidation, exceeding the transit time of particles in thermal spray procedures.

2.2. HVAF Process

In the current study, the i7 gun (Uniquecoat Technology LLC, Oilville, VA, USA), shown in Figure 2a has been used to deposit single MCrAlY particles. As listed in Table 1, the experiment is conducted at a SOD of 2 inches, with specific mass flow rates of air and fuel selected to ensure that the ignition and flame are maintained constant in the gun throughout the process. These parameters generate a finer jet, resulting in higher particle velocity and denser coatings.
Once the Uniquecoat i7 gun (Oilville, VA, USA) is ignited, a graphite sheet, shown in Figure 2b is heated to approximately 1900 °K, which is the ignition temperature of the gas mixture. The ceramic medium is used to ensure continuous ignition of the mixture during spraying.

3. Numerical Model Details

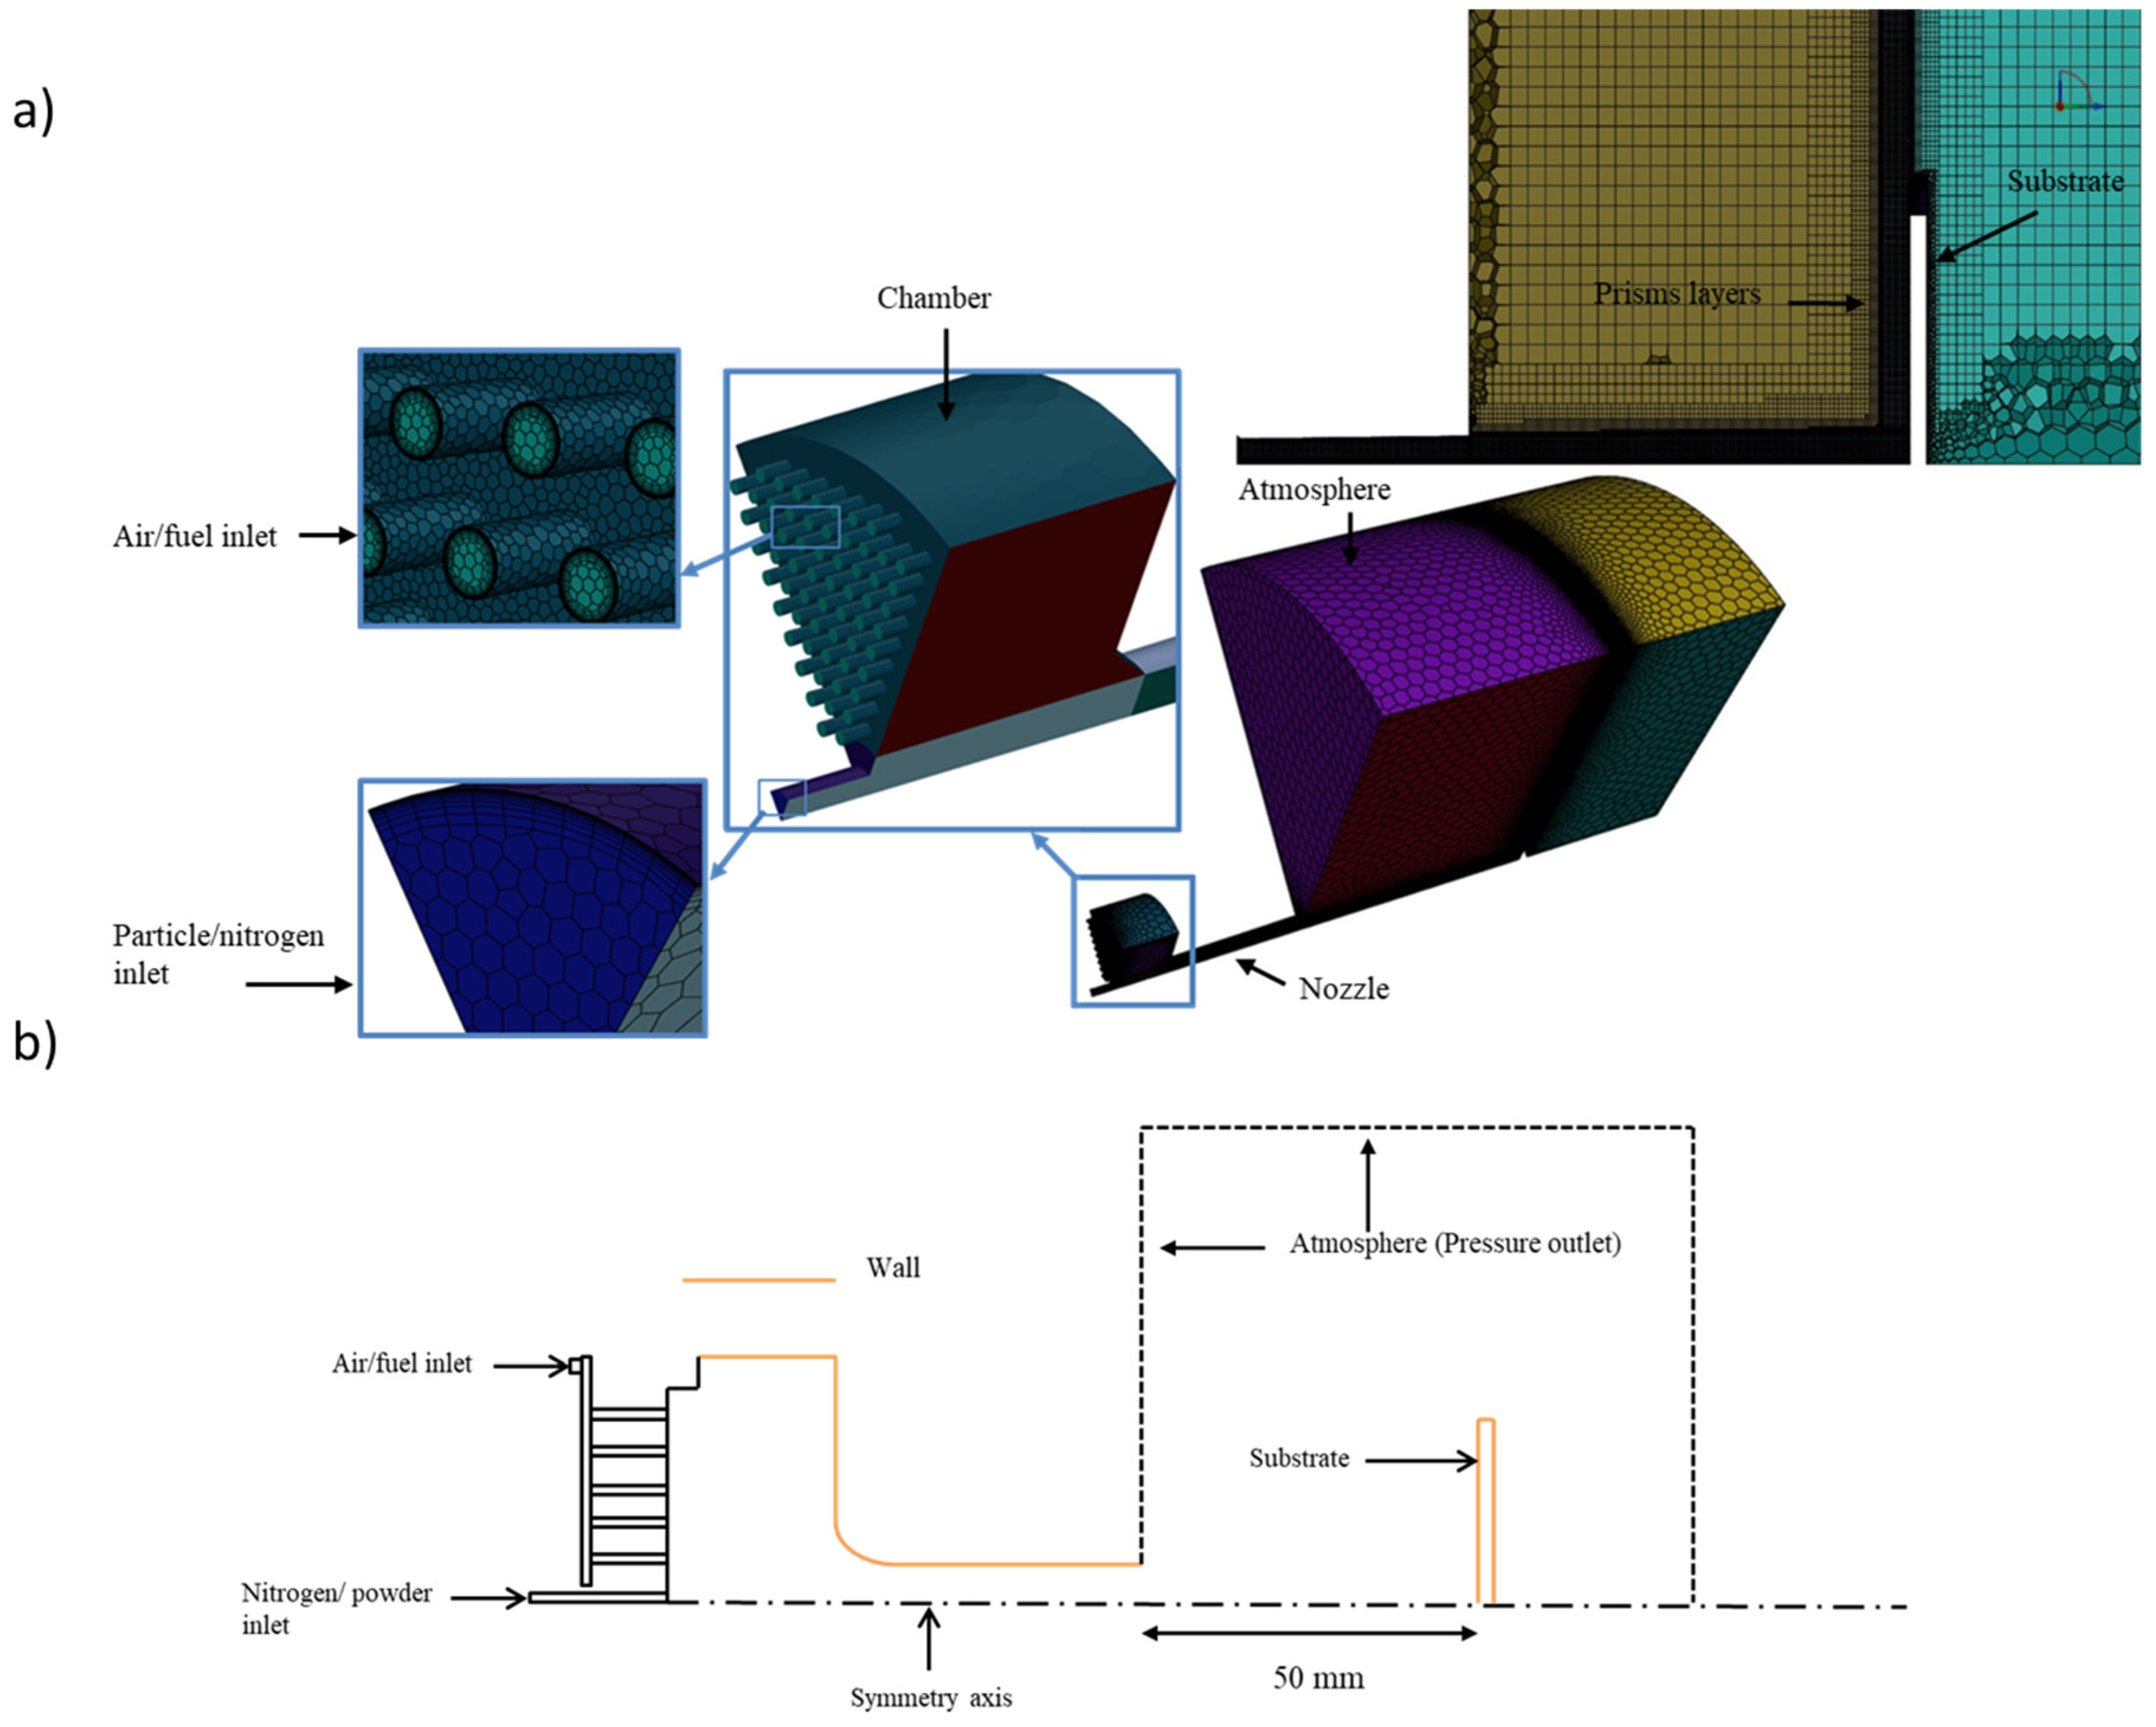
3.1. Computational Domain and Meshing

The developed 3D computational domain is shown in Figure 3a. As highlighted, the system’s principal components are the combustion chamber, rectifying chamber, porous graphite sheet, the De Laval nozzle, and atmospheric domain. To reduce computational time, only 1/6th of the spray system has been modeled. The air/fuel inlet holes are evenly distributed to match their physical position on the actual graphite sheet, as depicted previously in Figure 2b. The mixture of air and propylene is injected from the top outer edges of the injection plate allowing downward diffusion and circulation through the ceramic sheet. The particles are injected into a 2.2 mm diameter injector using nitrogen gas as a carrier flow.
The HVAF principal component dimensions are illustrated in Figure 3b. The height of the substrate to be coated is set to 2 inches and matches the substrate dimensions utilized in the experimental setup. A mesh study was performed to ensure resultant mesh independence. As depicted in Figure 3, 3D polyhedral mesh elements with hex-core have been chosen with added local refinement in the regions of interest. These regions are locally refined to ensure sufficient resolution in zones including shock locations and dispersion of particles, and the boundary layer thickness near the substrate and the nozzle walls. Ten prism layers with an expansion ratio of 1.4 have been used at the walls, i.e., the surface of the substrate and nozzle walls, where interactions with traveling particles and the flow features are important to capture. The nitrogen inlet mesh zone is refined to render a uniform and representative distribution of particles using the discrete particle model (DPM). The mesh in the current study consists of 1,241,907 cells with 7,811,326 nodes.

3.2. Gas Flow Model

The developed numerical model includes the description of the physical, chemical, and species transport processes governed by the mass conservation, momentum, and energy/species transport equations, respectively. The key equations describing the gas properties/characteristics are given by:
Mass conservation:
ρ t + x i ρ u i = 0
Momentum conservation:
t ρ u i + x j ρ u i u j = P x i + x j τ i j + ρ g i
Conservation of energy:
ρ Γ t + ρ u i Γ x i = x j k T x j + τ i j u i + ρ g i u i + q h
where ρ is the density of the gas, P is the pressure, ui is the velocity in the xi coordinate, Γ is the specific enthalpy and qh is the dissipation function. The stress tensor, τ i j , is described as:
τ i j = μ u j x i + u i x j 2 3 μ u i x i δ i j
The renormalization group (RNG) kɛ turbulence model is used to define the turbulent kinetic energy and rate of dissipation of turbulent energy [11].

3.3. Combustion Model

The Eddy dissipation model (EDM) has been used to model the combustion reaction between air and propylene. This model assumes that the rate of chemical reaction is higher than that of turbulent mixing, which implies that the reaction process is governed by the mixing rate between fuel and oxidant. In this type of reaction, three theoretical scenarios are possible: excess fuel, excess air, or stoichiometric reaction. A non-stoichiometric reaction defined with an excess of fuel, is considered in this study, and the chemical reaction is described by:
0.0709 C 3 H 6 + 0.15252 O 2 + 3.71 N 2 + 0.047 A r 0.00681 A r + 0.1884 C O + 0.02447 C O 2 + 0.00004 H + 0.14492 H 2 + 0.06769 H 2 O + 0.56766 N 2
The coefficients of each product are calculated using the one-dimensional equilibrium chemistry code developed by Gordon and McBride [14], setting the air-fuel ratio to 7.06, as per the current study experimental setup.

3.4. Particle Injection-Discrete Phase Model

Once the gas flow characteristics are numerically solved, particles are injected using the DPM. The particles are injected at a rate of 100 g/min with an initial velocity of 32 m/s. This initial velocity has been calculated based on the pressure differential across the particle injector tube along with its corresponding diameter and length. A group injection process is defined at the injector inlet. Particles with diameters ranging between 10 and 40 µm are injected using the Rosin–Rammler distribution. The HVAF process can partially melt particles during their flight within the nozzle, although the melting is very limited. Thus, the density of the MCrAlY is kept constant, for simplicity and is estimated at a value of 7196.78 kg/m3. It is worth mentioning that not all MCrAlY properties remain constant with temperature variation, such as the specific heat values, for which the temperature-dependent variations used are listed in Table 2.
In the moving flow, the particles are exposed to a drag force and their resulting motion is described as [15]:
m d v P d t = 1 2 C D ρ g A P v g v P v g v P
where m is the particle mass, v P is the particle axial velocity, A P is the cross-sectional area of the particle and ρ g is the density of the gas. C D the drag coefficient is defined using the Morsi and Alexander drag model in this study. This model is commonly employed to calculate the drag coefficient for spherical particles across a wide range of Reynolds numbers: [16]:
C D = 24 R p 1 + 0.15 R p 0.687 + 0.42 1 + 4.25 × 10 4 R p 1.16         R p < 300,000 ,   M p > 0.4
where M p is the Mach number of particles.
In Equation (11), the Reynolds number of particles is given by:
R P = ρ g v g v P μ g d P .
Since the Biot number of the particles is less than 0.1, the temperature gradient inside the particle is negligible [17]. Hence, the energy equation simplifies to:
m C p p d T p d t = h A P T g T P
where T g and T P are the gas and particle temperatures, respectively, A P is the surface area of the particle and h is the heat transfer coefficient calculated by the Ranz–Marshal empirical equation [15]:
h ¯ d P λ g = N u ¯ = 2.0 + 0.6 P r 1 / 3 R p 1 / 2
where Nu is the Nusselt number and Pr is the gas-phase Prandtl number [18].

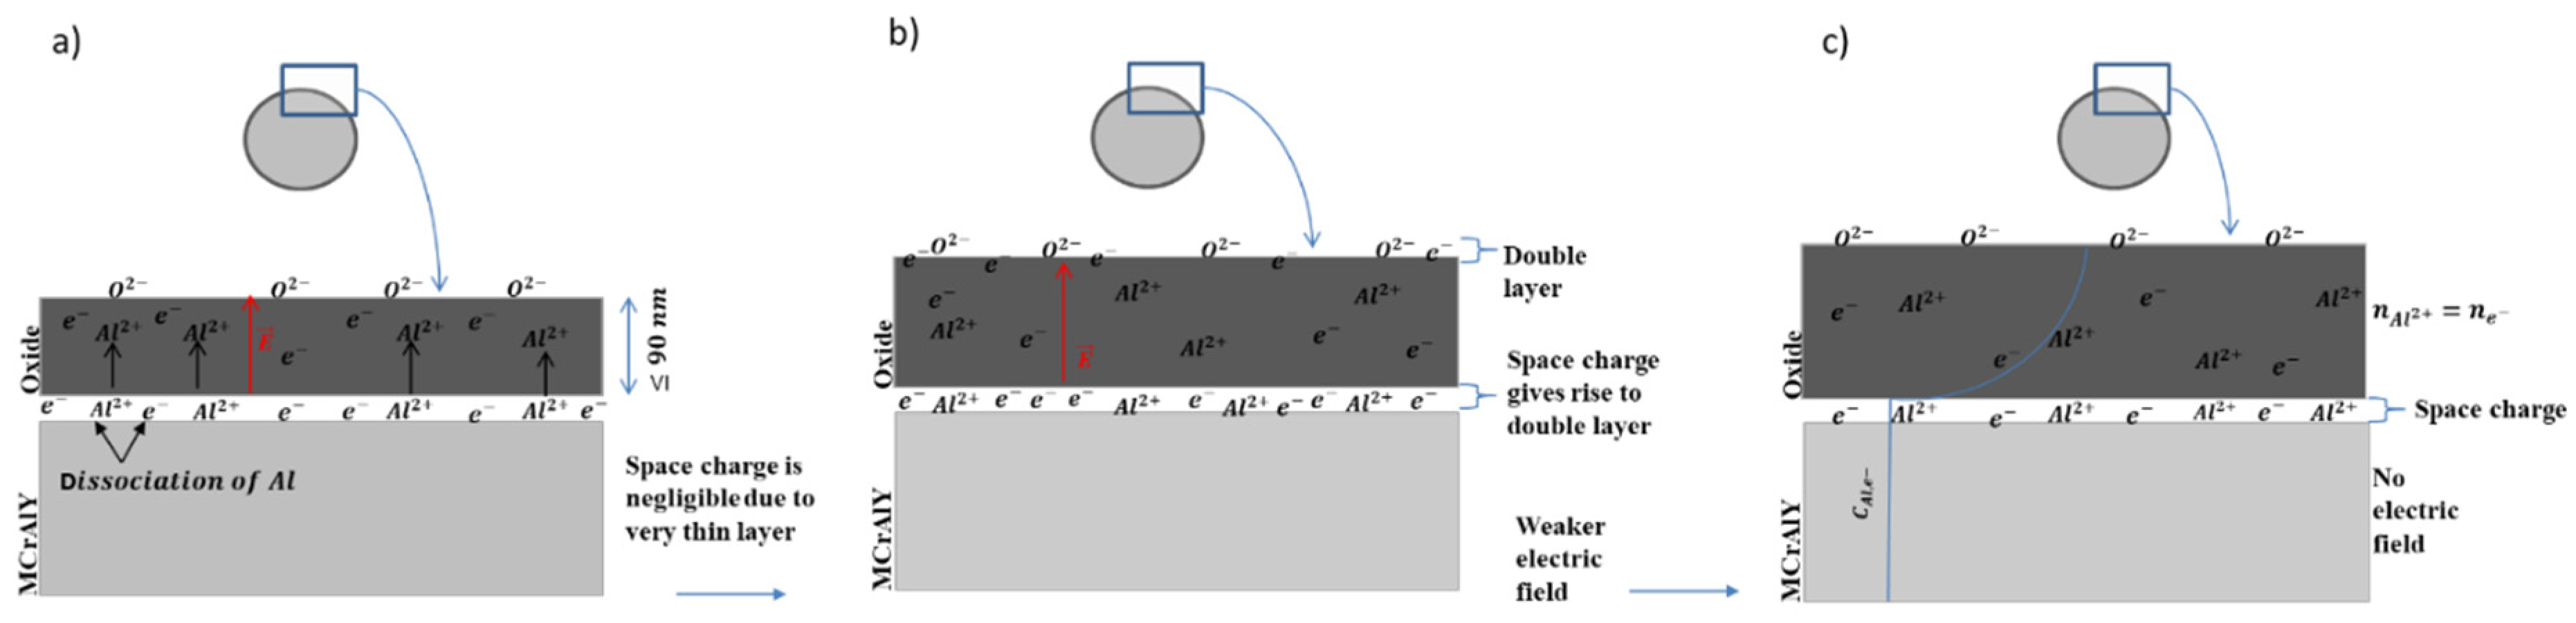
3.5. Oxidation Model

In the oxidation process, the aluminum metal at the metal-oxide interface first dissociates into aluminum cations A l 2 + and electrons   e , as illustrated in Figure 4a. The metal loses electrons to the neutral oxygen atoms of an oxygen molecule. The oxygen atom is subsequently reduced and forms oxygen ions. Thus, the A l 2 + cations travel interstitially through the oxide while the electrons join the interface by thermionic emission, as shown in the work presented by N. Cabrera and N. F. Mott [19]. In thermionic emission, electrons are emitted from a metal surface when sufficient heat energy is applied to overcome the set energy barrier (1.6 eV for aluminum) and escape through the formed oxide layer. The oxygen ions and the electrons at the oxide layer surface generate an electric potential V across the oxide thickness, as depicted in Figure 4a. Based on the surrounding flow temperature, pressure, and oxygen presence, different aluminum oxide thicknesses can form during the particle flight inside the high-speed HVAF flow.
In the formation stages of oxides, first, a very thin oxide film develops through the transport of cations and anions driven by a strong electric field E, as demonstrated in Figure 4a. Electrons diffuse easier than ions through thermionic emission. A double layer that contains aluminum cations and electrons then exists at each boundary of the film due to an uneven concentration of ions and electrons in its interior. The inequality of the ions and electrons also generates a space charge, which is referred to as a cloud of excess charges in a specific volume, such as a negative charge. In very thin film theory, however, the space charge is negligible [19]. Very thin films develop up to a critical thickness described by [19]:
X C r = V · a · q k T ,
where V is the voltage across the oxide, a is the atomic jump distance, q is the charge of the ion, T is the temperature and k is the Boltzmann constant. The critical thickness in this regime is estimated to be within the hundreds of angstroms ( 900 Å) [20].
Following the very thin oxide film development, the thin oxide layer formation then follows as the oxide becomes thicker, as illustrated in Figure 4b. During this stage, the electric field, E, responsible for atomic diffusion becomes weaker as the oxide thickness grows. The concentrations of ions and electrons are still unequal across the film. The space charge in this regime also has a minor influence on the oxidation. The thin film stage develops until the oxide thickness reaches hundreds of angstroms to 20,000 Å for an oxidation time of 104 sec approximately [21]. This limiting thickness is expressed as follows:
  L D = ( K k T 8 π n e ) 1 / 2 ,
where K is the dielectric constant, n is the concentration of interstitial ions or electrons, and e is the electronic charge.
By the time the thick film oxidation regime starts developing at X > L D , where X is the current oxide thickness, the concentration of interstitial ions is equal to the concentration of electrons, as illustrated in Figure 4c. More importantly, there is no resulting electric field beyond the double layer at this stage. The diffusion of cations and anions becomes thermally controlled and their motion follows heat transfer concentration gradients.
Due to the particle’s short travel time in the HVAF flow, only the very thin film regime is expected to develop following the Mott and Cabrera theory [22]. Under this process, the growth rate of the oxide layer can be computed using the following relation [10]:
d X d t = 2 A 0 exp W k T exp k 0 P o 2 k T ,  
where A 0 = n a ϑ Ω and k 0 = q 2 a k / ε , W is the energy barrier, Ω is the volume of oxide formed per ion, ϑ   is the attempt frequency for ion migration, q is the charge of the ion, a is the interatomic jump distance, n is the concentration of ions and k is a constant [6]. For the oxidation of pure aluminum,   A 0 = 2.5 × 10 6   Å / s , W = 1.6   e V and K 0 = 0.139   e V / T o r r [23]. The constants of Equation (17) for the oxidation of the MCrAlY are obtained based on the concentration of aluminum in the MCrAlY particle, which is estimated at 23. at%, providing   A 0 = 5.83 × 10 5   Å / s [20]. Hence, in the Mott/Cabrera theory, it is the diffusion of cations in the oxide layer that limits the oxide growth process and final thickness.
Oxidation is an exothermic reaction where the released heat is confined at the surface of the particle [24]. The heat is related to the formation energy of aluminum oxide and is described by:
Q o x = A p ρ o x H o x d X d t   w h e r e   H o x = 0.125 × H A l 2 O 3 = 2.052 × 10 6   J / k g
where ρ o x is the density of oxidized material, H o x is the enthalpy of oxidation and d X d t is the rate of oxidation.
Since the oxidation process is an added internal source of energy, the energy conservation is given by:
E ˙ g E ˙ o u t = E ˙ s t o r a g e
where E ˙ g is the rate of energy generated within the system, E ˙ o u t is the rate of energy going out the system, and E ˙ s t o r a g e is the rate of energy stored within the system, providing:
h A P T g T P ( E ˙ o u t ) + A p ρ o x H o x d X d t ( E g ˙ ) = m C p P d T d t ,   T < T m e l t i n g
When the particle reaches its melting temperature, the energy equation, Equation (20), is modified to [25]:
A P T g T P + A p ρ o x H o x d X d t = m H m e l t i n g d f d t ,   T = T m e l t i n g
while when the particle temperature is above the melting temperature, the energy equation is re-written as:
h A P T g T P + A p ρ o x H o x d X d t = m C p P , l i q u i d d T d t ,   T > T m e l t i n g
where H o x is the enthalpy of oxidation, H m e l t i n g is the enthalpy of melting, C p p and C p P , l i q u i d are the specific heat in solid and liquid state, respectively, and f is the melting ratio ( 0 f 1 ).

4. Results and Discussions

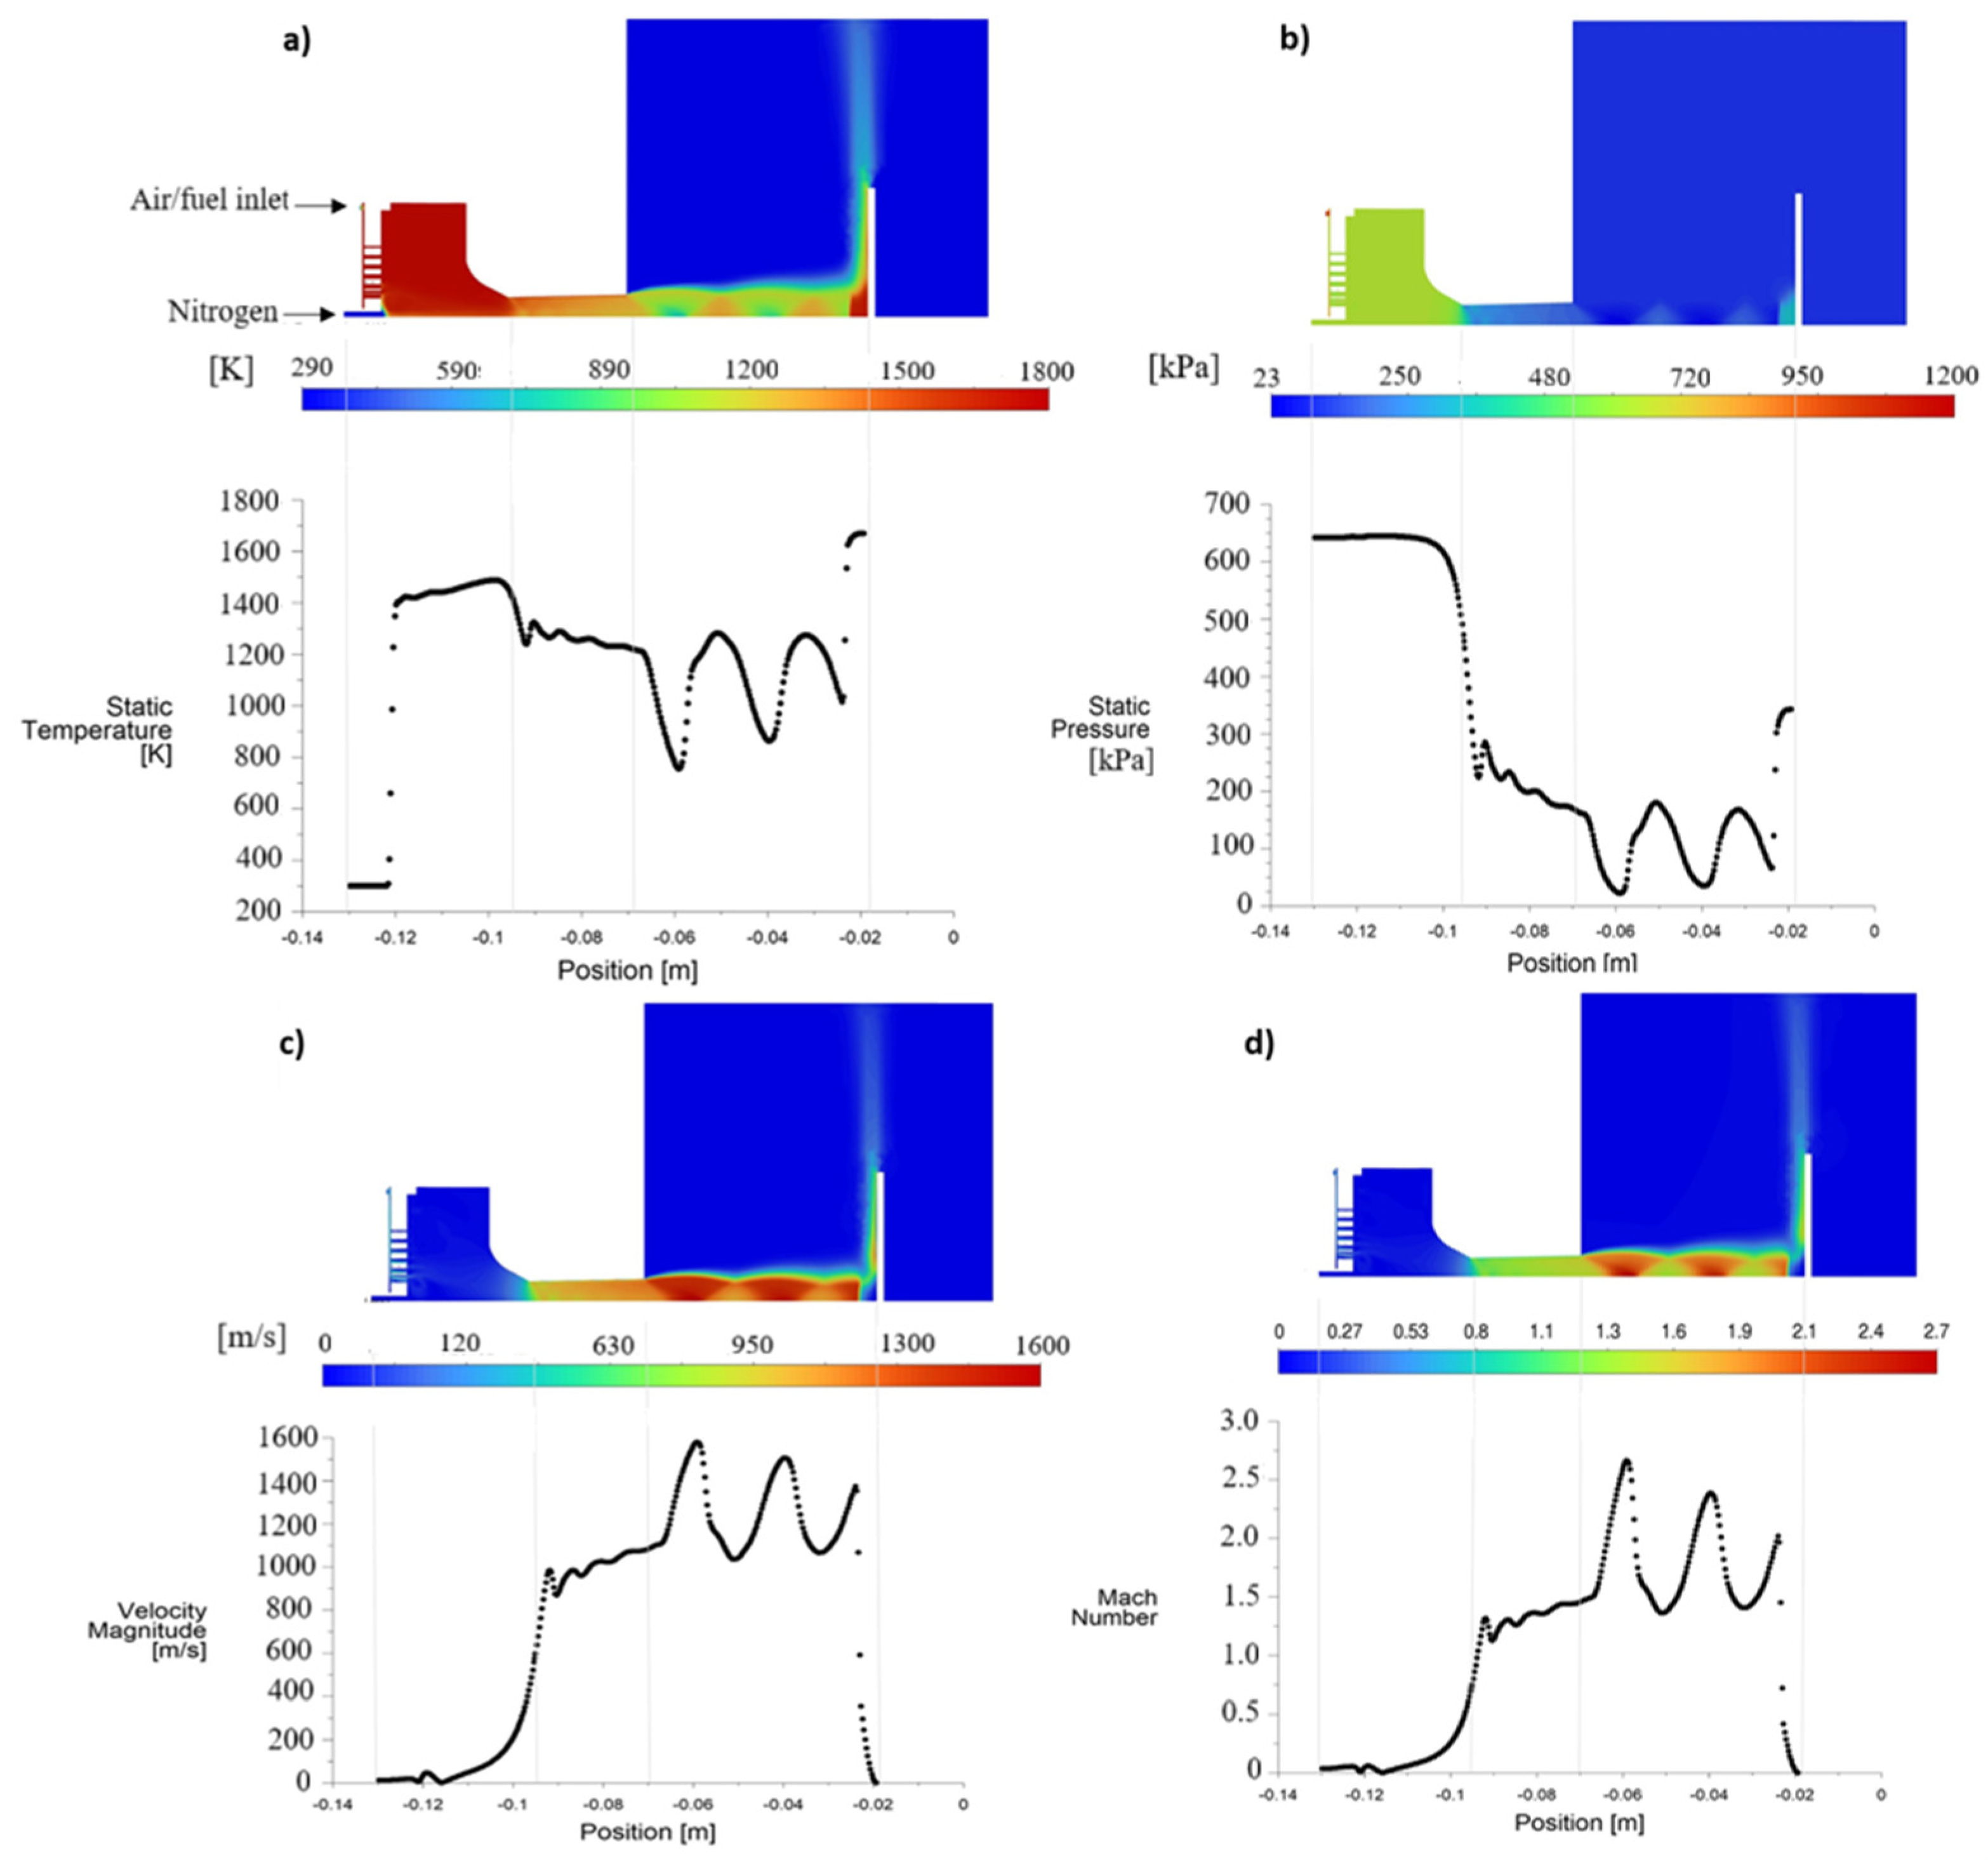
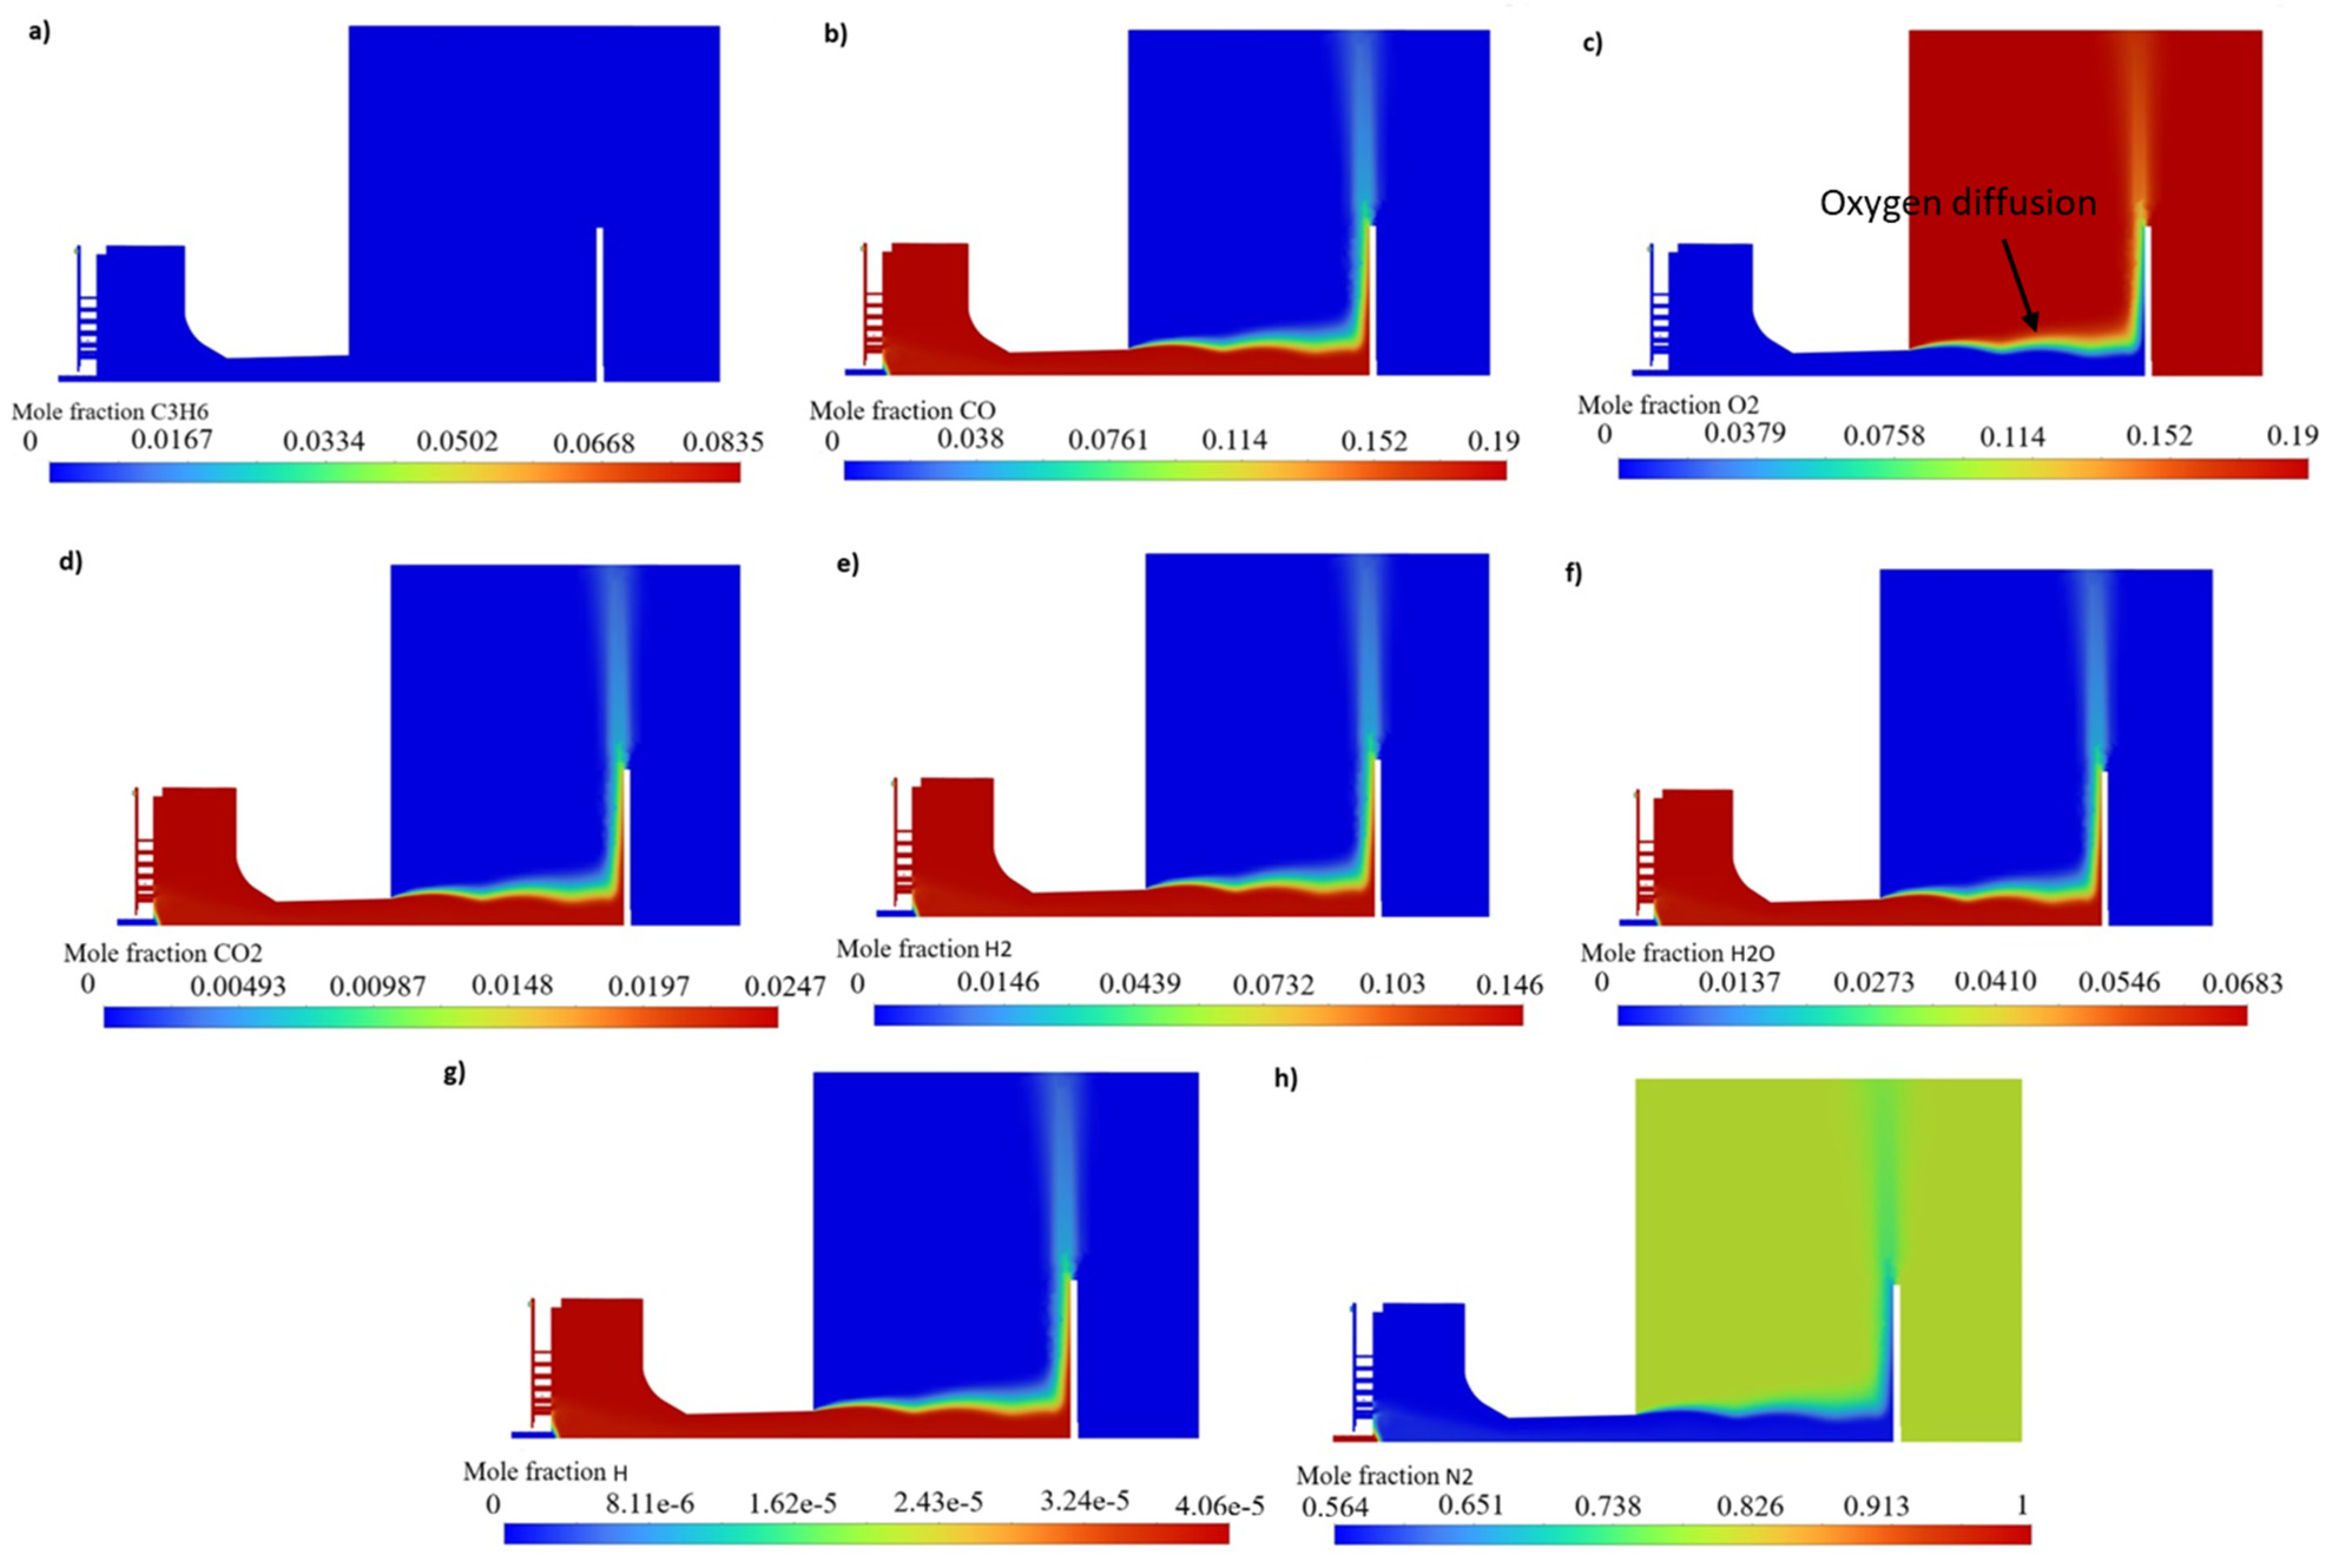
4.1. Gas Characteristics and Gas Components Mole Fraction

Figure 5 shows the contour results of the pressure, temperature, Mach number, and velocity of the gas flame throughout the modeled HVAF process and atmospheric domain. The maximum temperature in the gun is observed in the combustion chamber with a value of 1500 K (Figure 5a). The temperature decreases slowly to 1300 K in the divergent section of the nozzle. In the atmospheric region, diamond shocks/Mach cones develop, significantly disturbing the gas temperature values. These observed Mach cones are the result of the periodical under and overexpansion of the gas at the nozzle exit [26]. It is also noticed that the gas temperature varies both axially and radially, which can drastically influence the particle oxide growth given different particle traveling paths. In the combustion chamber up to the convergent section, the pressure is at its maximum and estimated at 640 kPa. The pressure magnitude drops in the divergent/expanding section and further in the atmospheric domain down to 230 kPa. This decrease in both pressure and temperature in the diverging section is caused by the partial conversion of the internal energy to kinetic energy. Hence, the gas velocity and Mach number increase in the divergent nozzle region to 1000 m/s and 1.3, respectively, as shown in Figure 5c,d [12]. Due to the low mass flow rate of the nitrogen carrier gas (18 L/min), its diffusion in the driving combustion gases is minimal inside the chamber, as observed in Figure 5a, which greatly affects the particles’ trajectories and consequently their temperature. A drastic increase in temperature and pressure to approximately 1700 K and 400 kPa, respectively, is seen when the flame reaches stagnation parameters at the substrate surface [27].
In addition, the mole fraction of the gas components such as oxygen, propylene, carbon monoxide, etc. is also investigated to better understand the chemical reaction occurring during combustion, Figure 6. The premixed propylene and oxygen react immediately after entering the chamber. While the oxygen is completely consumed, the remaining mole fraction of propylene does not oxidize completely inside the nozzle and transforms into other products (Figure 6a,b). Other products such as CO, H, H2, etc. start to form during combustion and their mole fraction rises in the combustion chamber. At the nozzle exit, the forced diffusion of ambient air into the flame, caused by the abrupt turbulent variation in the flow properties across the shock waves leads to a small increase in oxygen concentration at the boundary of the main flow, as shown in Figure 6c. Another important product to highlight in fuel-rich combustion is carbon monoxide (CO). Present in a high mole fraction in fuel-rich, CO tends to coat the particles and prevent further reaction between the oxygen and the particle surface, reducing the oxidation growth process [28]. The theoretical framework proposed by Mott and Cabrera solely accounts for the mole fraction of oxygen, neglecting the presence of carbon monoxide, such that its influence on oxide growth has been neglected in the current study.

4.2. Particle Oxidation

In thermal spray processes, particles are not of uniform size and commonly vary following a Gaussian distribution curve. The present study focuses on the oxidation of particles within the size range of 10–40 µm. Hence, particles with diameters of 10 µm, 20 µm, 30 µm, and 40 µm are selected, in the current numerical model, and injected into the HVAF flow for oxidation investigation.
The analysis of particle oxidation is evaluated in detail across three sections of the numerical model: (i) the chamber, (ii) the nozzle, and (iii) the atmospheric domain. The oxidation process is intricately linked to the partial pressure of oxygen, characterized by static pressure, mole fraction of oxygen, and particle temperature, as demonstrated by the results presented in Figure 7. In the presence of gas turbulence, smaller particles are carried away from the colder central flow, which can have significant implications for heat transfer and energy transfer processes as shown in Figure 7a [29,30]. It is important to recognize that oxygen is a significant catalyst in the particle oxidation process; without oxygen, the oxidation process cannot take place.
Figure 7b traces the oxygen partial pressure ( P o 2 ) history surrounding the particles along their path inside and outside the nozzle. According to the data presented in Figure 7b, the oxygen pressure in the chamber is notably low, P o 2 = 0.58 Torr, extending from the convergent region up to the midpoint of the divergent section.
The particle’s temperature is greatly dependent on its size. Smaller particles have a relatively larger surface area to volume ratio, which allows them to be easily heated to higher temperatures than their larger counterparts (Figure 7c) [31]. Smaller particles (modeled as 10 µm) reach a maximum temperature of 1500 K. It is important to note that the remaining particles, those of 20, 30, and 40 µm diameter traveling throughout the domain, are in a solid state which is consistent with experimental findings of this study, as further presented in the next Section 5. The solid-state of the particles offers the advantage of a denser and less porous coating [11]. The resulting particle oxidation rate is presented in Figure 7d. The small partial pressure of oxygen combined with the low temperature in the chamber and the nozzle’s convergent and divergent section sets the oxidation rate in a range of 5 to 103 Å/s. The MCrAlY particle oxidation rate accelerates when the oxygen pressure surrounding the particles and the adjacent gas temperature increases. The increase in oxygen pressure ( P o 2 ) is mainly observed in the atmospheric domain (outside the nozzle), as shown in Figure 7b, and is equivalent to approximately 140, 120, 100, and 90 Torr in the order of increasing particle size, respectively. The small fluctuations of the partial pressure of oxygen at the beginning of the external domain result from the variations in the mole fraction of oxygen. Even though certain particles (20, 30, 40 µm) maintain constant temperature in the atmospheric domain, as shown in Figure 7c, the drop of the surrounding oxygen pressure decreases, consequently, their oxidation rate near the substrate dropped to 7280 Å/s, 892 Å/s, and 90 Å/s for particles with 20, 30, 40 µm diameter, respectively.
Figure 7e shows the development of the oxide thickness for each modeled particle size. A smaller particle, i.e.,10 µm, exhibits thicker oxide with a thickness of approximately 115 Å followed by the 20 µm particle size with an oxide thickness of 19.9 Å. A 30 µm particle size has an oxide thickness of 3.9 Å. The oxidation of the largest particle, i.e., 40 µm, is almost negligible and reaches only 0.21 Å. The relation between the particle size and oxide thickness is strongly linked to the particle’s trajectories, as observed in Figure 7a. Small particles deviate from the nozzle centerline while larger particles remain near the center [27]. A relationship between particle velocity and its degree of oxidation also exists [31]. Longer particle residence time within the flow (smaller in-flight velocity) induces thicker oxide formation. Figure 8 compares the in-flight velocity of particles with different diameters. It has been observed that particles of smaller diameter exhibit a greater velocity than their larger counterparts. Although small particles have a larger in-flight velocity, their path deviation due to turbulence keeps them longer in the flow, which explains the larger resulting oxide thickness.

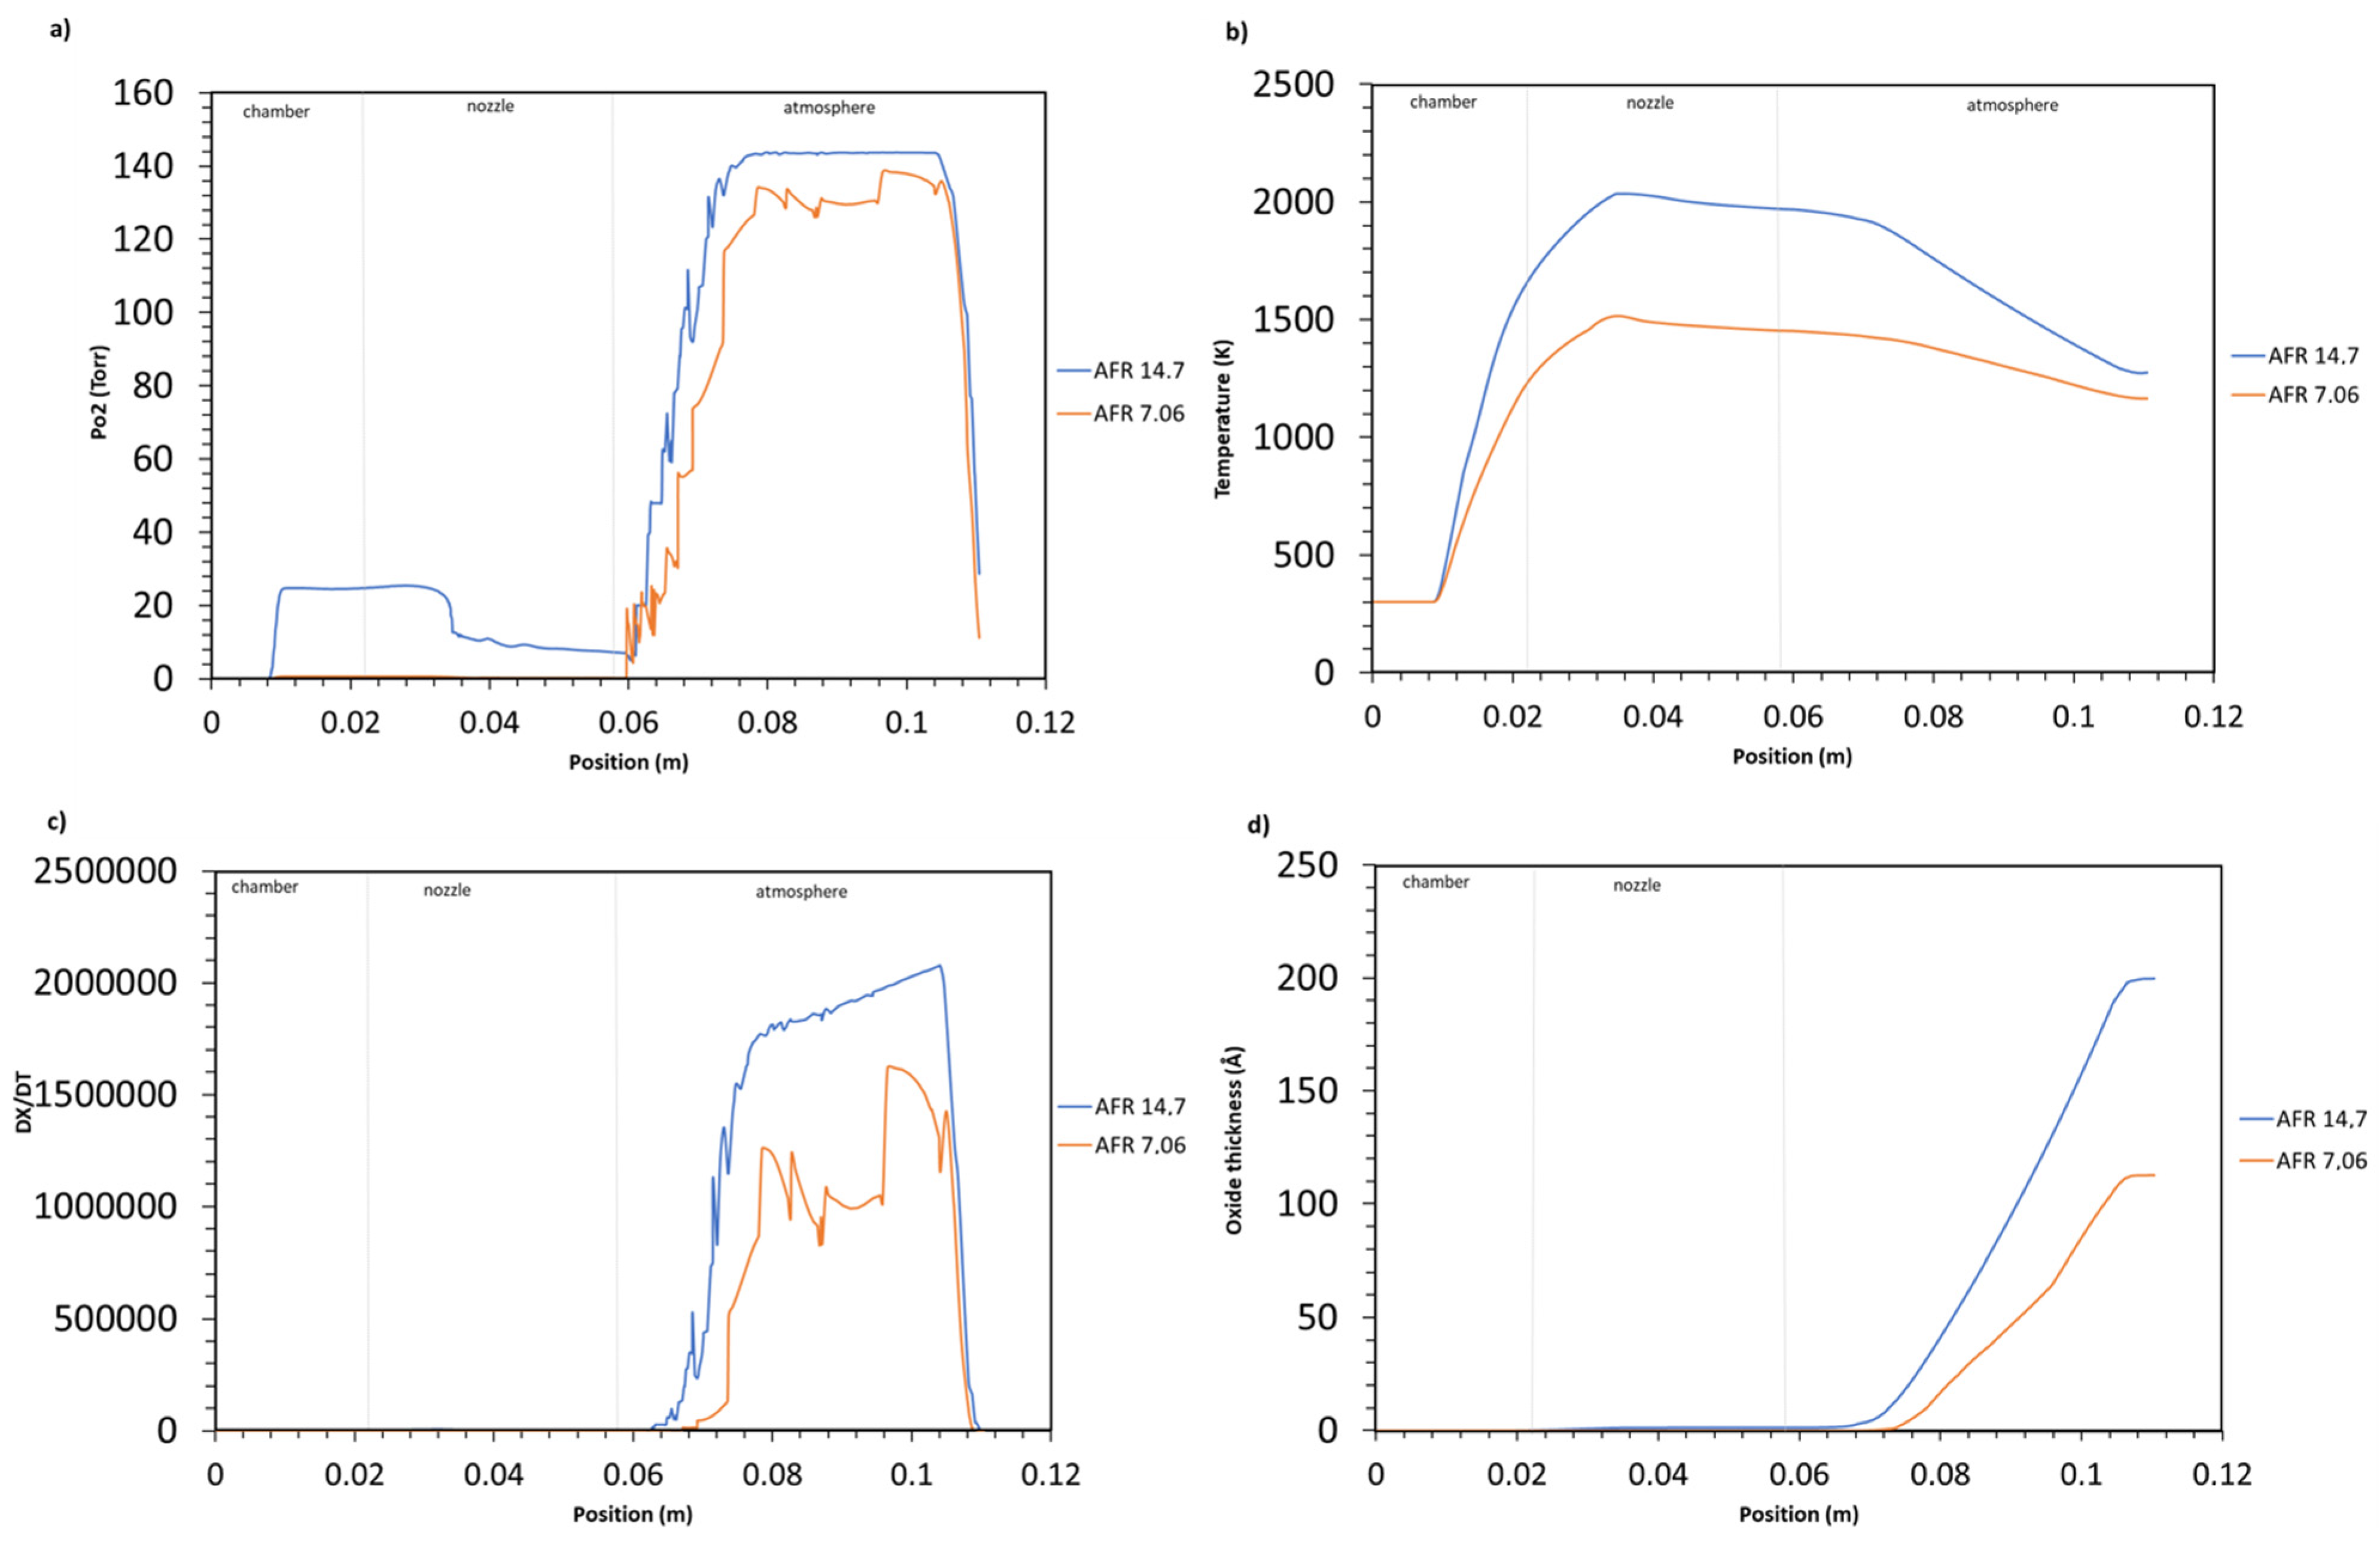
4.2.1. Air/Fuel Ratio Influence on Oxide Growth

Spray parameters have a direct impact on the in-flight behavior of the particles and thus their oxidation. In this study, the influence of the equivalence ratio or air/fuel ratio (AFR) on the degree of oxidation is investigated. Figure 9 shows the gas characteristics disparities along the centerline at two different air/fuel ratios namely at 7.06 (utilized in the experimental set-up) and 14.7. The air/fuel ratio at 14.7 using propylene as fuel represents the stoichiometric combustion process i.e., there is no excess of air or fuel. It is concluded that at the stoichiometric reaction, the flame temperature is higher, as shown in Figure 9a. The flame leaves the chamber at a temperature of 1930 K for an air/fuel ratio of 14.7 and 1450 K for an air/fuel ratio of 7.06 (similar behavior was obtained in [28]). It increases slightly further in the nozzle before dropping to 1695 K and 1189 K at an AFR of 14.7 and 7.06, respectively. The temperature increases before reaching the substrate, reaching approximately 2200 K at an AFR of 14.7 and 1600 K at an AFR of 7.06. Additionally, the gas velocity is higher in the stoichiometric case, peaking at 1800 m/s, compared to only 1500 m/s observed at an AFR of 7.06. In contrast, the pressure in both cases remains nearly identical, with only minor variations that are not significantly influential as shown in Figure 9c.
Figure 10 compares the oxidation history of a 10 µm particle size traveling within the flows characterized by an AFR of 7.06 and 14.7. While the oxide results for an AFR at 7.06 were extensively presented in Figure 7, they are again shown in Figure 10 to provide a proper comparison to the 14.7 AFR results.
The 10 µm particle size traveling inside stoichiometric combustion reaction flow, i.e., AFR of 14.7, displays higher oxygen partial pressure, as observed in Figure 10a. The pressure increases in the combustion chamber to approximately 20 Torr and remains stable throughout the chamber and 1/3rd of the nozzle, after which a sudden decline in oxygen partial pressure is observed up to the nozzle exit. In the atmosphere, the entrained air in addition to the trajectory deviation of the particle leads to the abrupt increase in oxygen partial pressure surrounding the 10 µm particle. The difference in particle temperature as it travels in both modeled AFR flows is illustrated in Figure 10b. The hot jet at an AFR of 14.7 allows for a higher particle temperature. Excess fuel (AFR 7.06) tends to cool down the gas and reduces the temperature by absorbing the heat released from the combustion reaction [28]. The combination of high particle temperature and oxygen mole fraction generates an oxide thickness of 199 Å at AFR of 14.7 in contrast to 115 Å at AFR of 7.06.

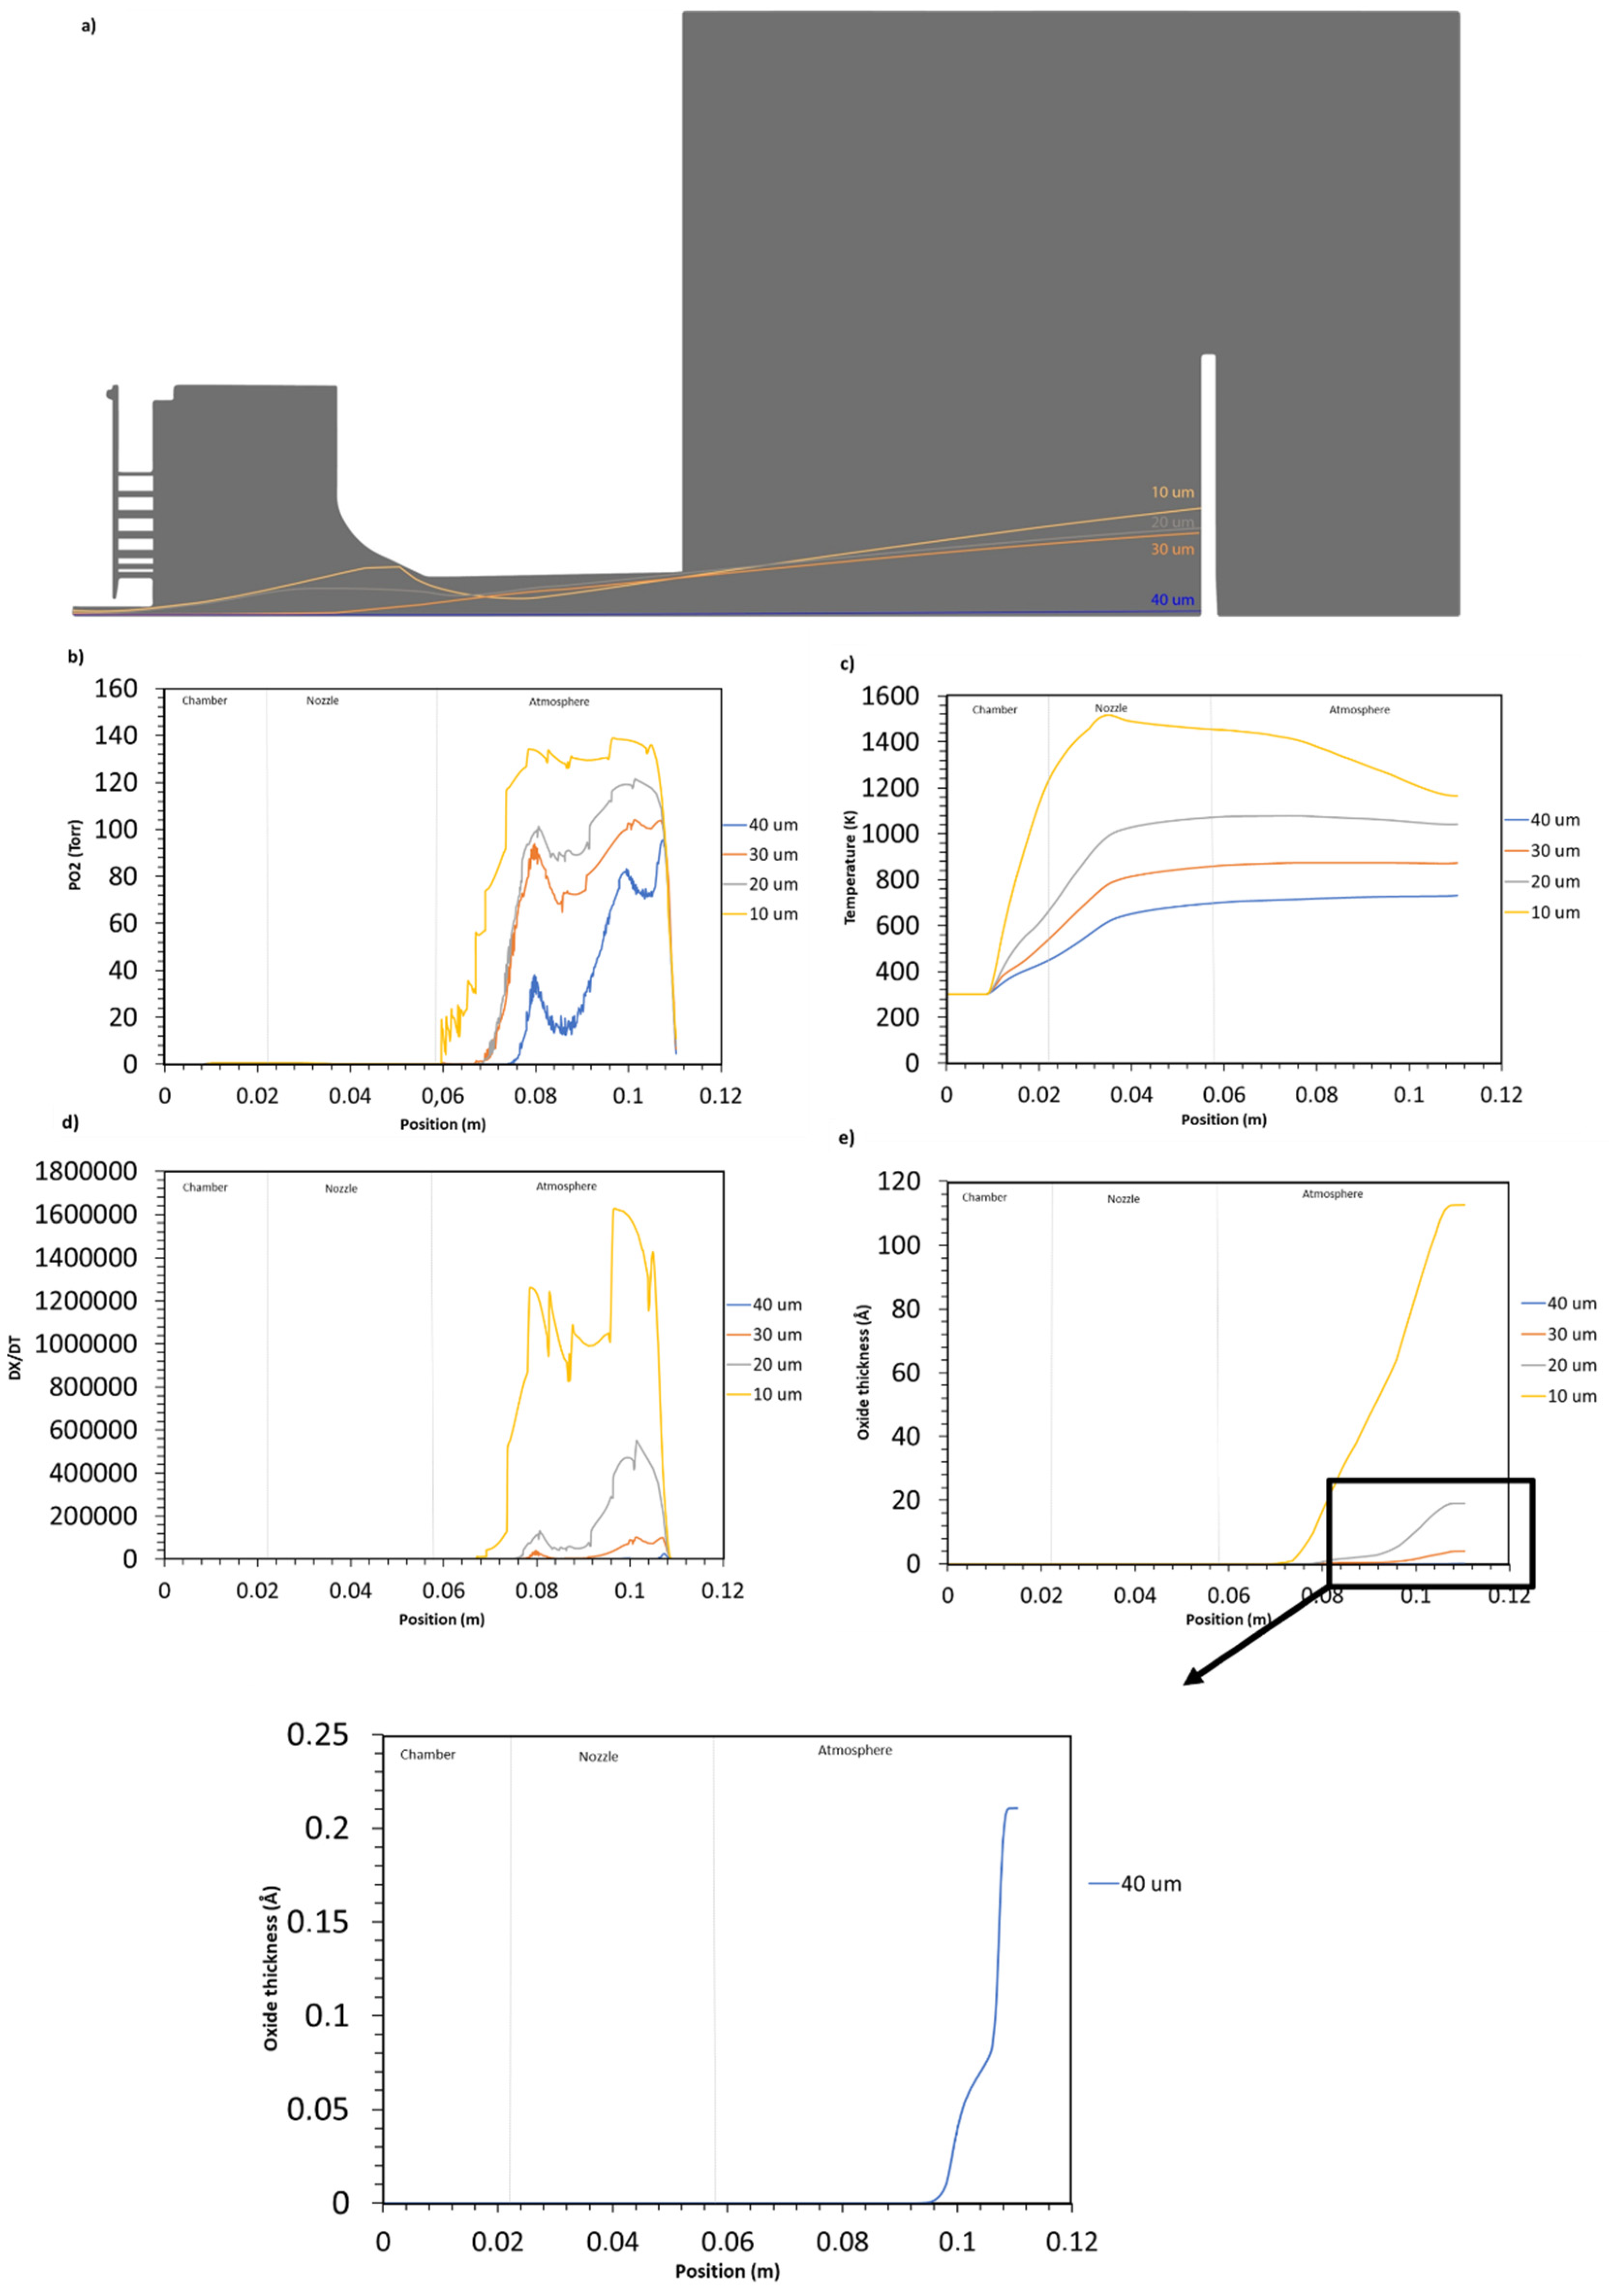
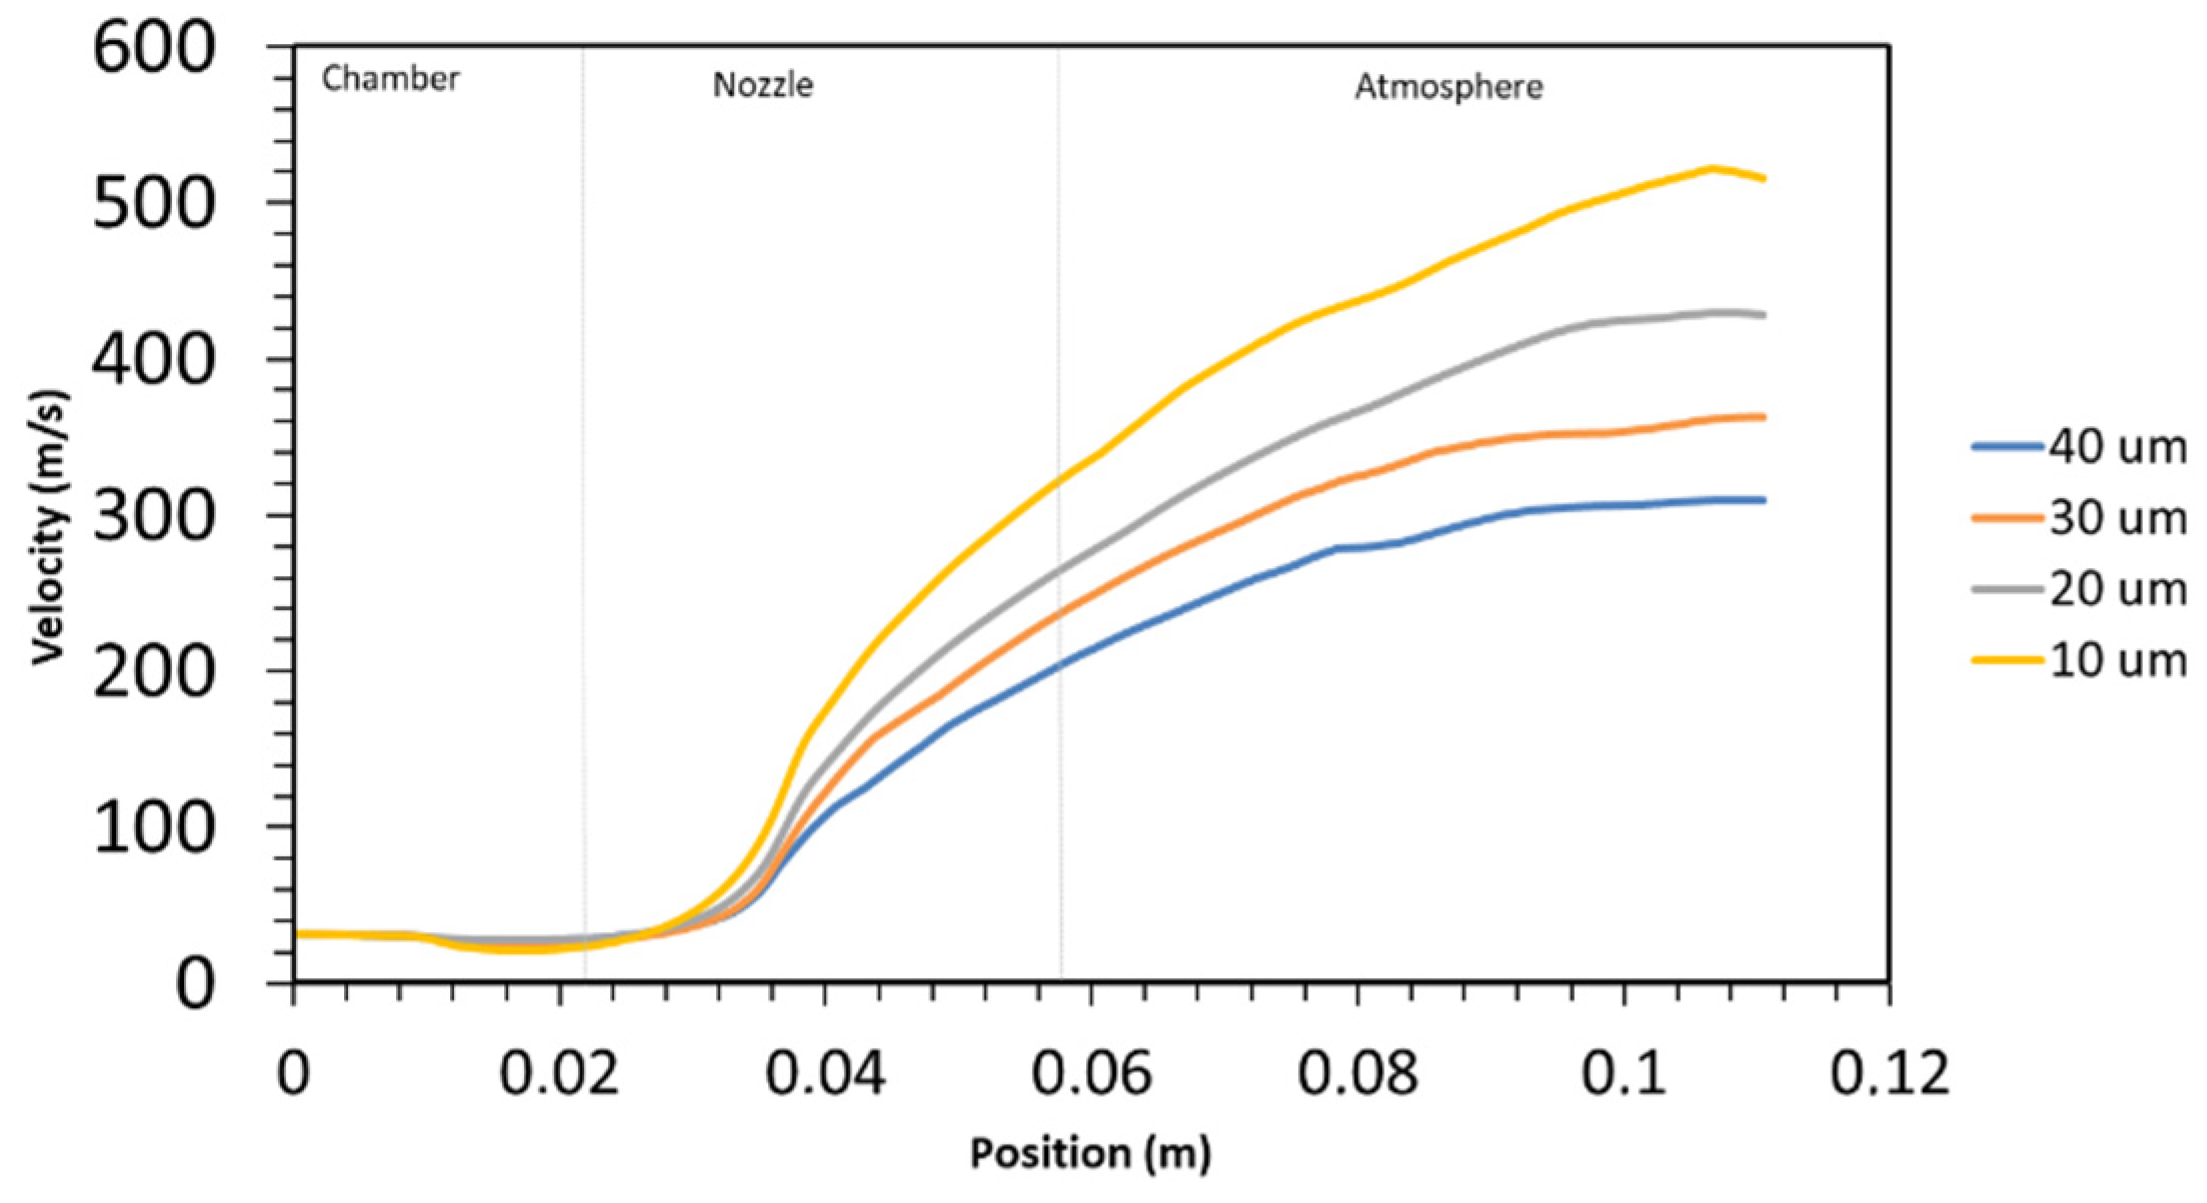
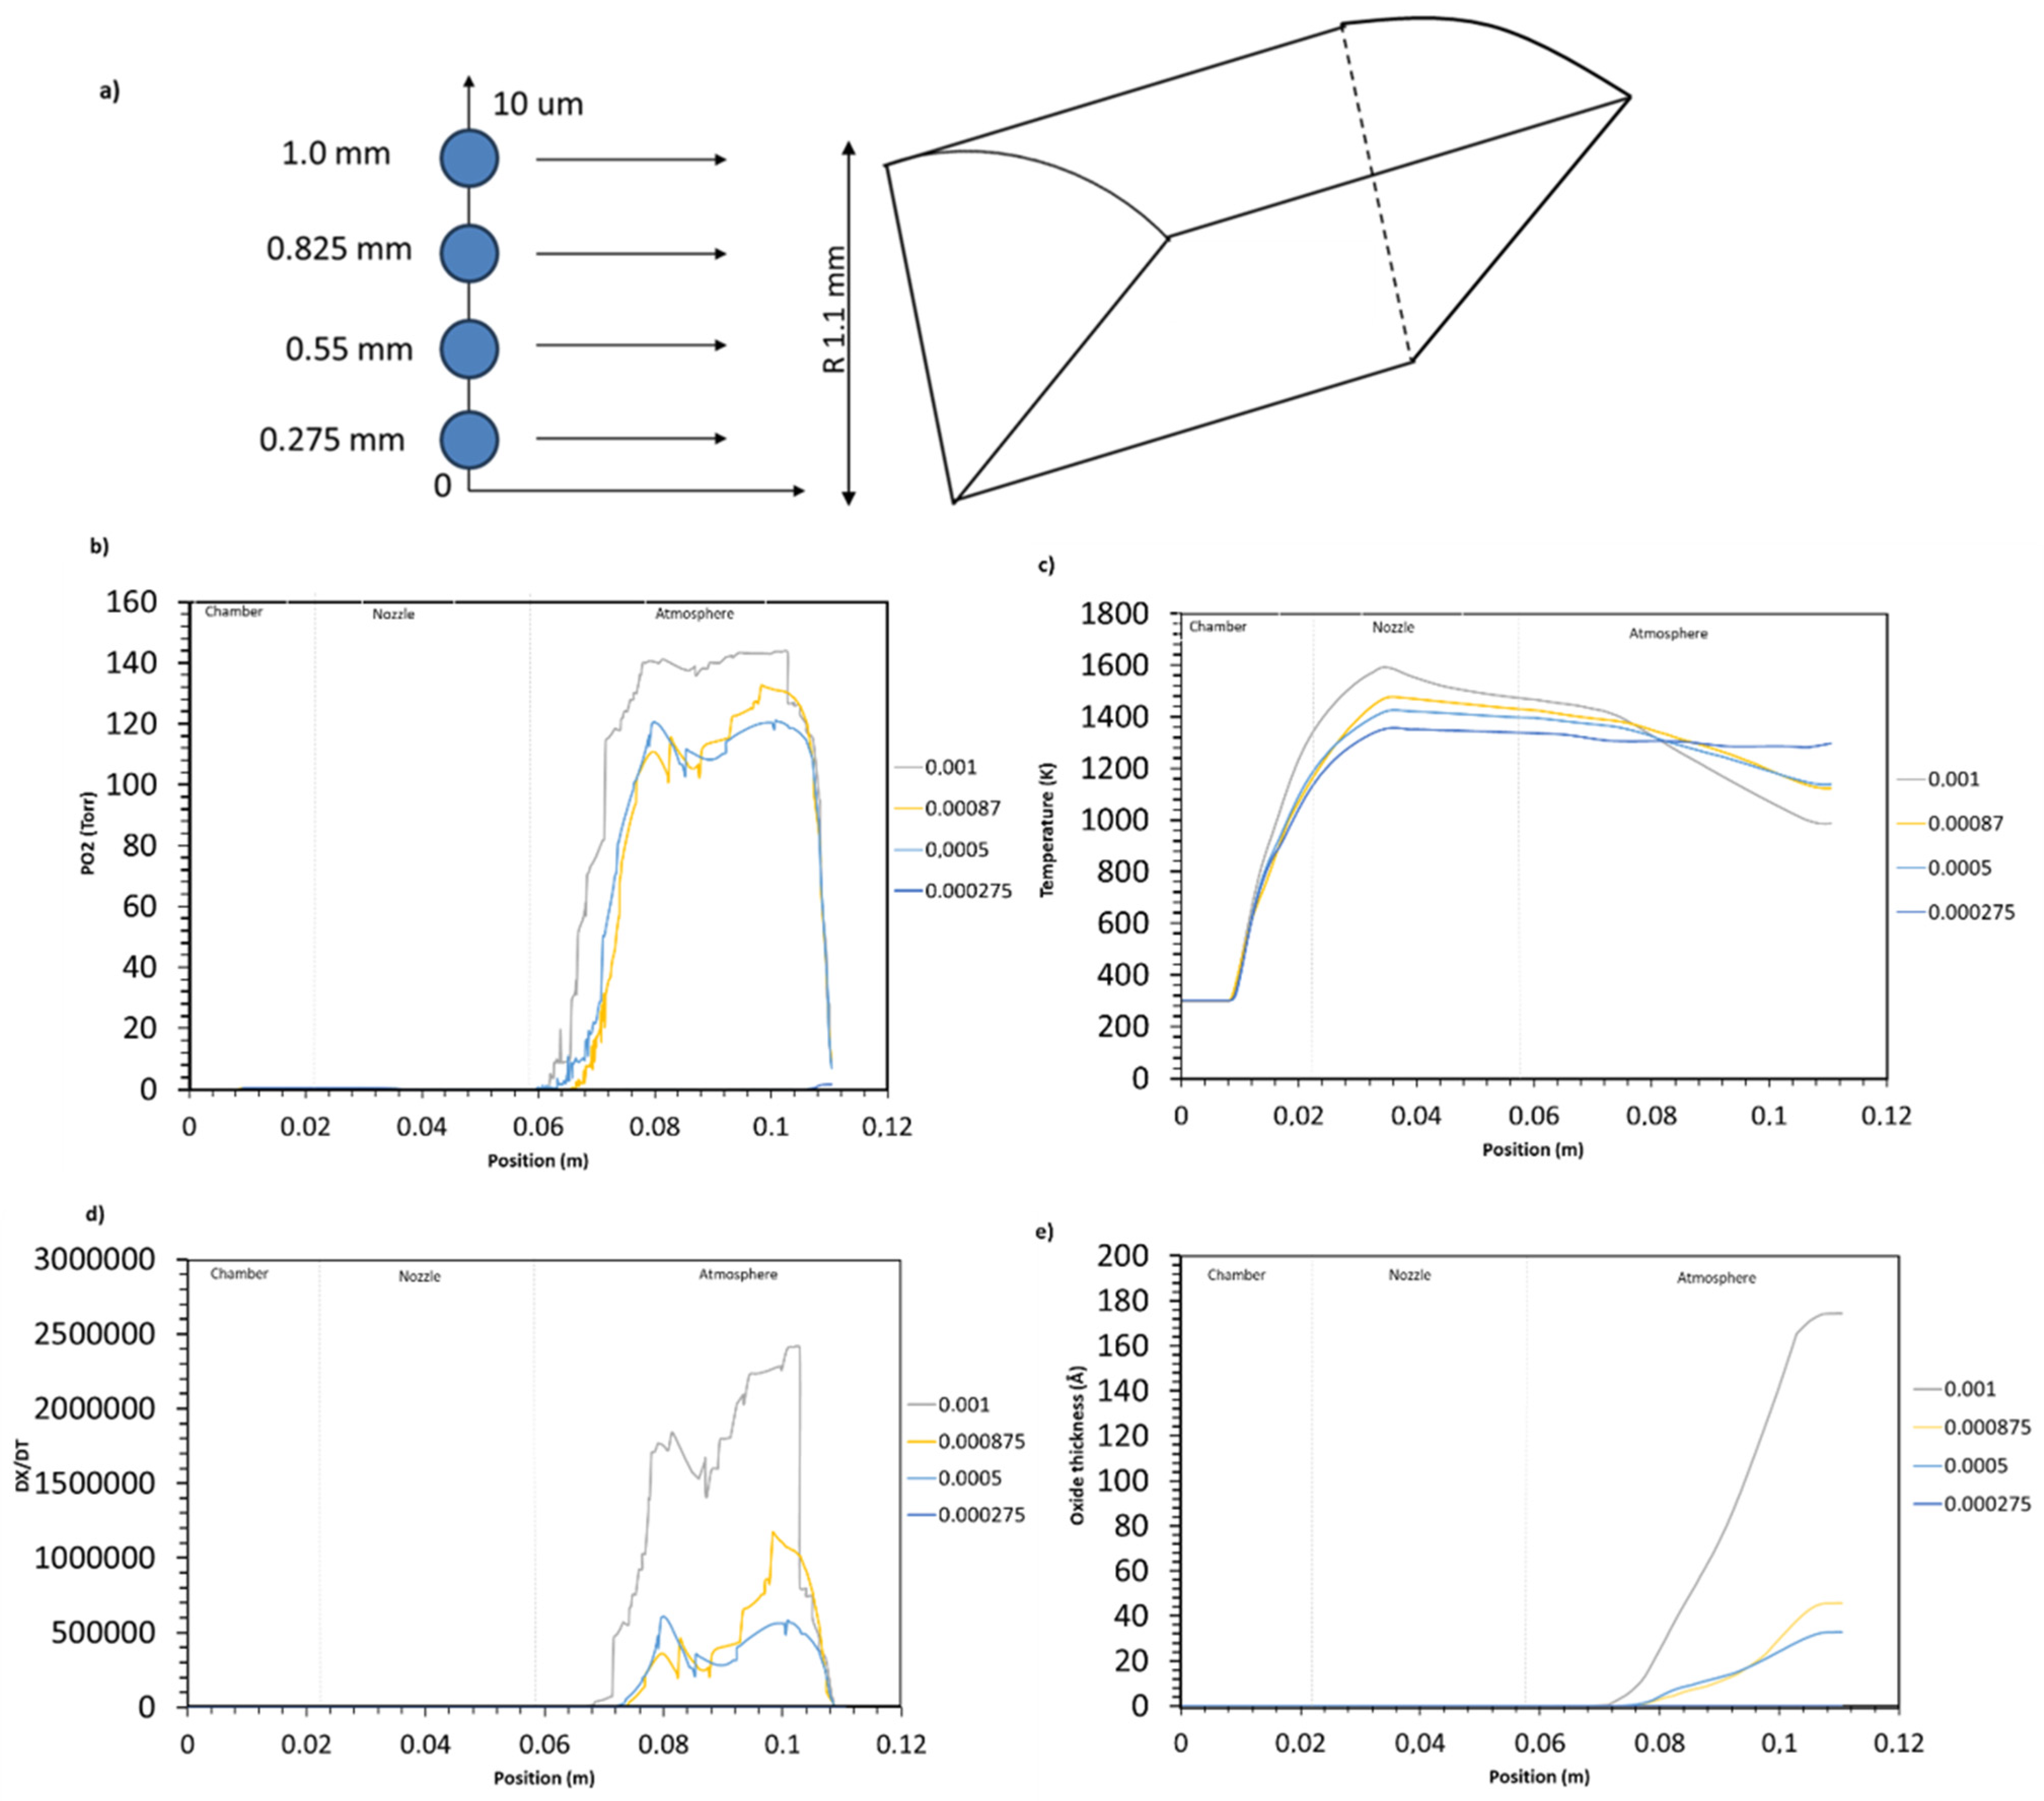
4.2.2. Influence of Particle Injection Location on Oxidation

In addition to the air-to-fuel ratio, the injection point is a parameter that plays a crucial role in determining the temperature and velocity of particles, both of which in turn significantly affect the oxidation process and eventually the coating microstructural properties which have been studied extensively [32,33]. Specifically, a higher particle temperature leads to a more compact coating, albeit at the risk of oxidation, which represents a trade-off that must be carefully considered. The effect of the injection point on the oxidation is studied next and the results are presented in Figure 11. As illustrated in Figure 11a, four different injection locations are set for a 10 µm particle, i.e., 0.275, 0.55, 0.875, and 1.0 mm. Figure 11b shows the partial pressure of the oxygen profile surrounding each injected 10 µm particle.
As shown in Figure 11b, the further the particle injection point location is with respect to the centerline of the gun, the more the particle is exposed to oxygen [34]. Thus, the particle released at 1.0 mm (at the periphery of the injector radius) is surrounded by P O 2 = 140 Torr. The particle temperature, as depicted in Figure 11c, is also strongly dependent on the injection location. The particle temperature increases with the deviation position from the centerline due to the radial distribution of the flow temperature field. Hence, the closer the injection to the centerline of the gun the lower is the oxidation rate and resulting oxide thickness. Thus, the tested injection locations lead to an oxide thickness of 0.0008 Å, 32 Å, 45 Å, and 174 Å, going from the closest to furthest position location from the centerline, respectively. Therefore, to reduce the degree of oxidation of particles during their flight in the HVAF process, the injector can be optimized to avoid/minimize the particle divergence from the injector tube centerline.

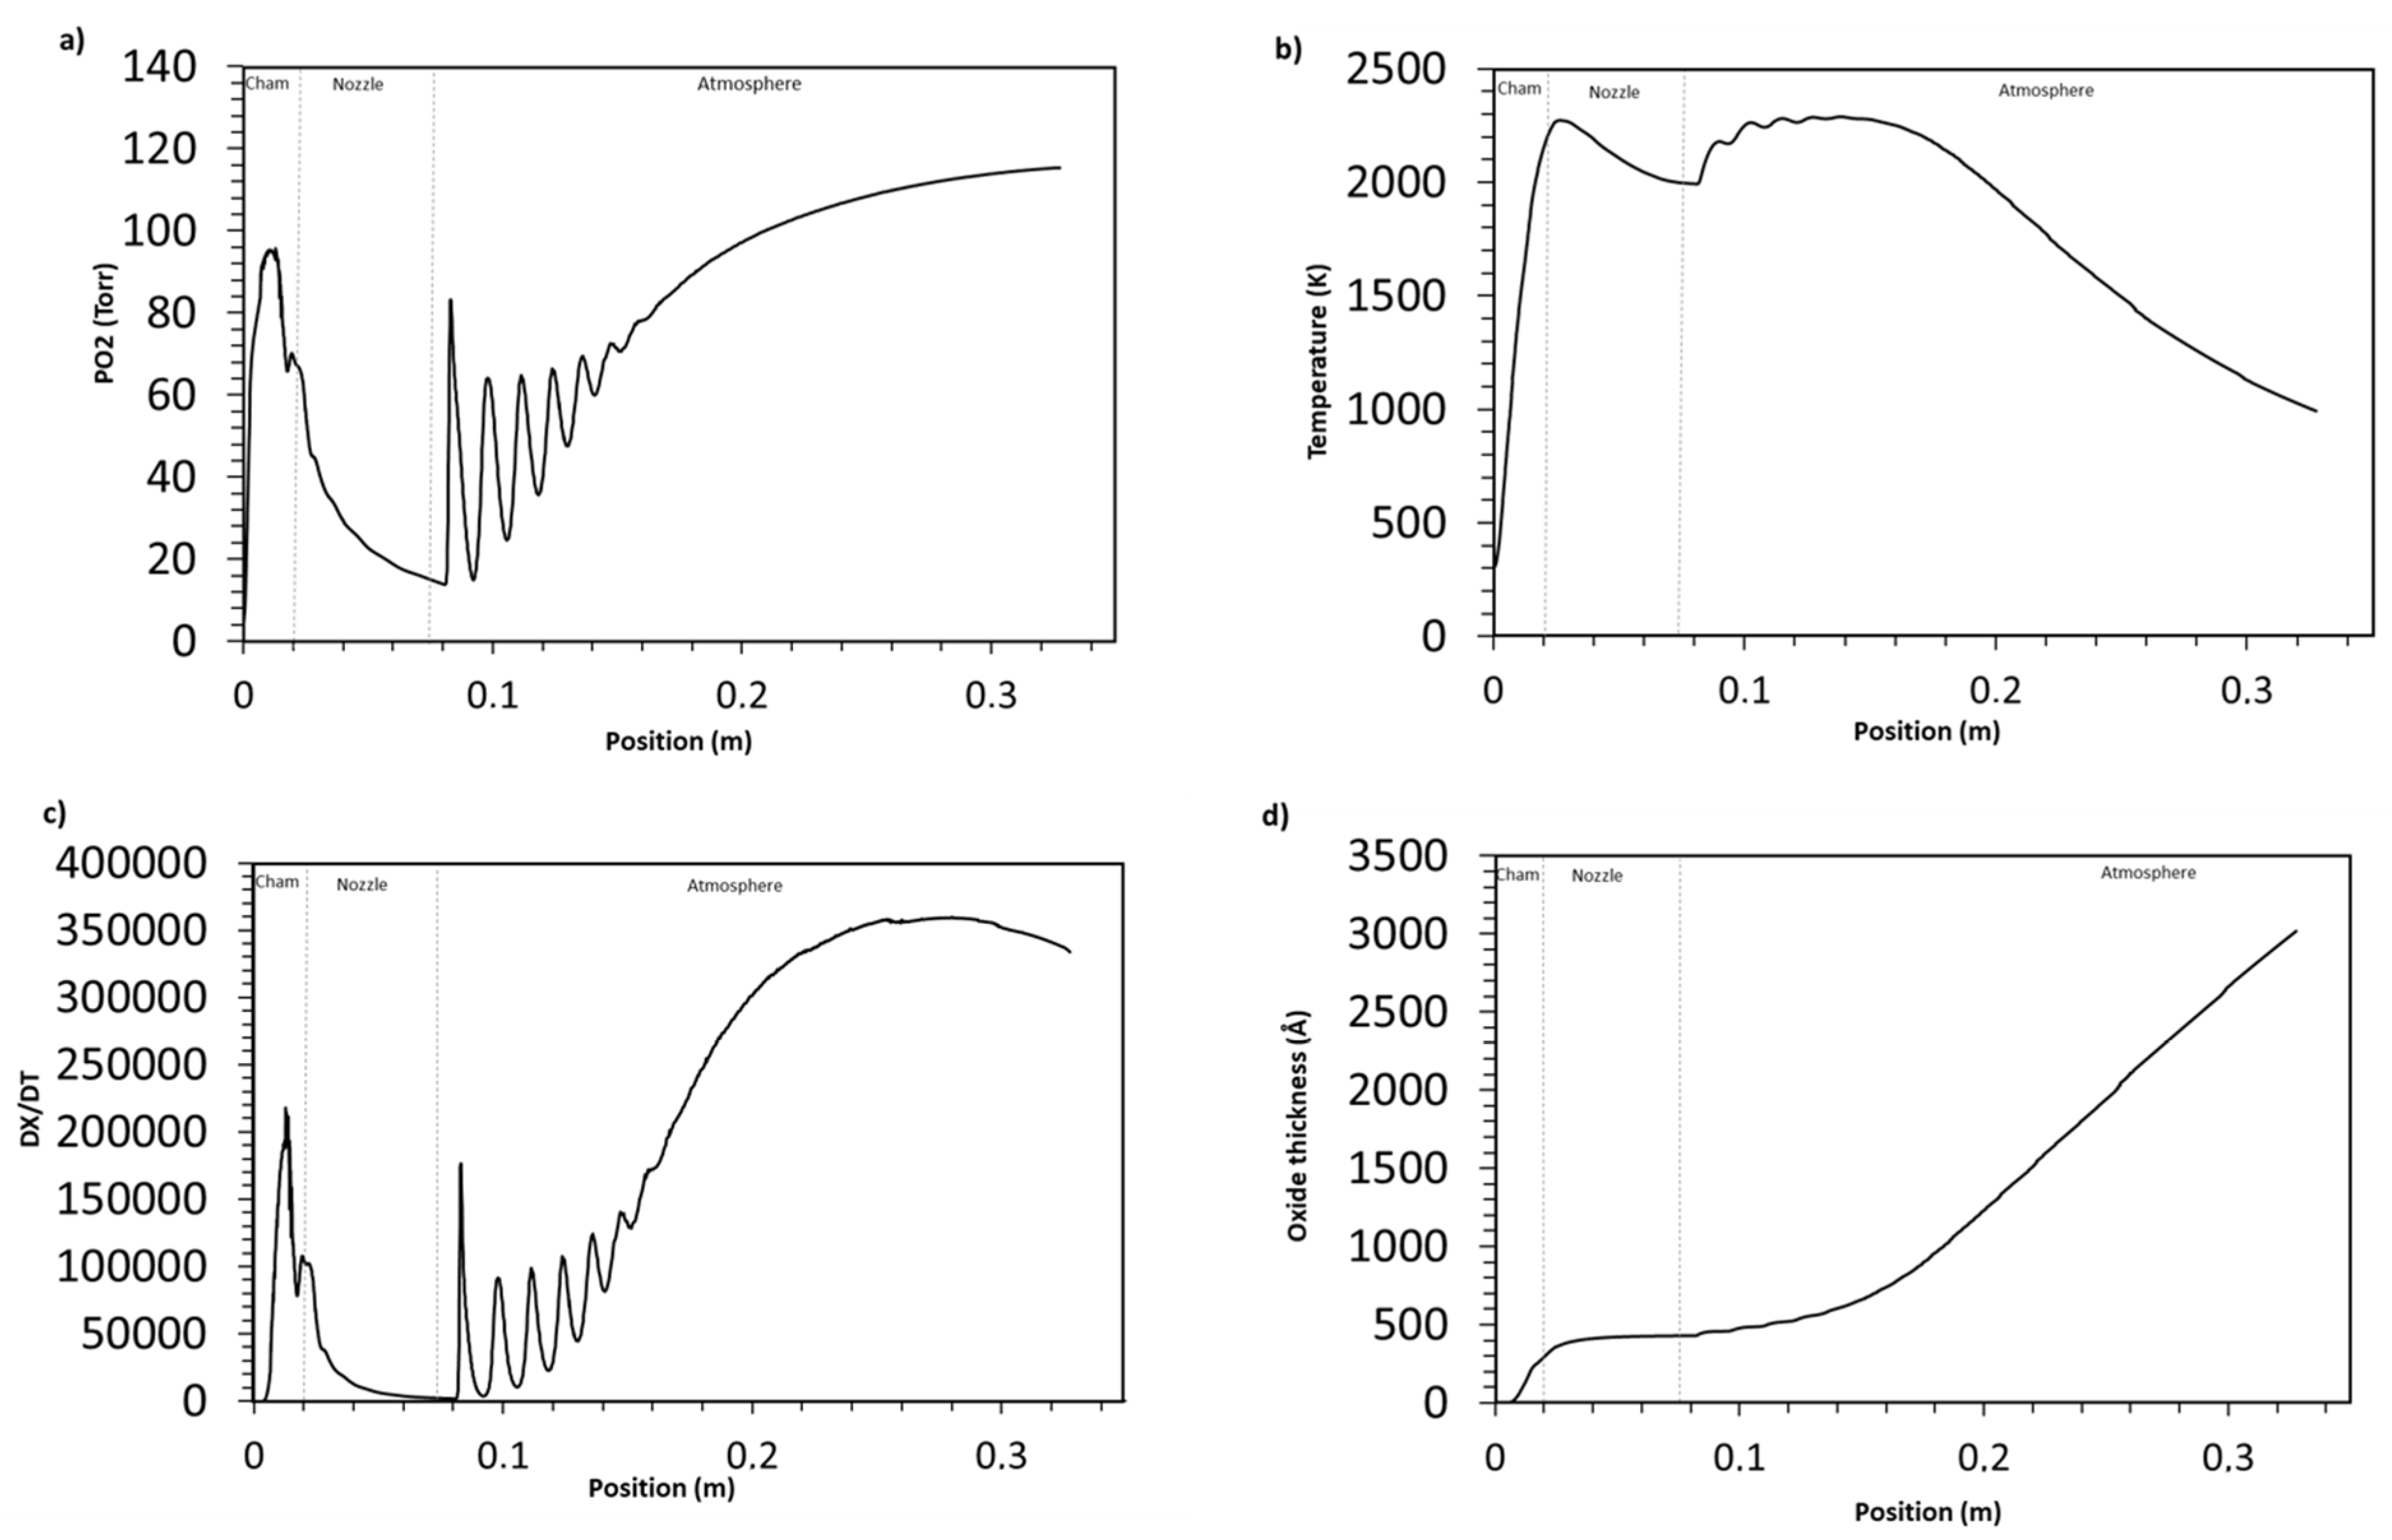
4.2.3. Oxidation in High Velocity Oxy-Fuel Process (HVOF)

Gas Flow Characteristics

The current section aims to compare the oxidation behavior of a 10 µm particle traveling in the HVAF and HVOF processes. The research endeavor seeks to consolidate the choice of the optimal thermal spray process for high-end applications. To conduct the comparative simulation, a diamond jet DJ2700 HVOF gun (Oerlikon Metco, Westbury, NY, USA), as illustrated in Figure 12, has been employed from a different study along the numerical setup and mesh [35]. The spray parameters utilized in the model are outlined in Table 3 and chosen based on previous studies’ optimal spray parameters [35].
The gas characteristics of the HVOF gun are presented in Figure 13. The predicted pressure chamber is 535 kPa, as illustrated in Figure 13a. From the diverging section to the exit, the pressure drops from 334 kPa to 33 kPa. The chamber pressure in HVOF is slightly lower than the HVAF where it was estimated to be 640 kPa. The flame velocity, as highlighted in Figure 13b, reaches its highest magnitude in the diverging region of the gun with a value of approximately 2000 m/s compared to 1600 m/s in HVAF. The high gas speed leads to higher propulsion of the particles, which eventually favors the creation of a stronger adhesion process to the substrate and lower in-flight time inside the potentially oxidizing flow. However, the substitution of the oxidizer from air to pure oxygen in HVOF results in a notable increase in flow temperature within the combustion chamber. According to the findings illustrated in Figure 13c, the HVOF exhibits a temperature of 3440 K, making it approximately 1500 K hotter than HVAF. The temperature of the gas decreases progressively from the diverging section to the atmospheric domain, with a range of values spanning from 2180 K to 1240 K. This phenomenon is accompanied by the emergence of diamond shocks at the nozzle exit. Figure 13d shows the mole fraction of O2 throughout the gun. Oxygen is mainly present in the fuel and oxygen inlets with approximately 0.68 mole fraction. The latter decreases rapidly to almost zero in the remaining length of the gun. A progressive increase in oxygen is seen at around 80 mm away from the nozzle exit. This phenomenon is related to the diffusion of oxygen from the surroundings to the inside of the main flow. Additionally, the larger SOD needed in HVOF depositions also favors oxidation processes due to the longer exposure of the particles to the surrounding air.

Particle Oxidation Process

As depicted in Figure 14, an examination of the oxidation behavior within the HVOF gun reveals that the P O 2 = 90 Torr in the combustion chamber, owing to the use of pure oxygen and a leaner mixture. However, as the oxygen is consumed, this pressure decreases gradually from the midpoint of the chamber to the exit point and eventually stabilizes at approximately P O 2 = 19 Torr, as shown in Figure 14a. At the atmospheric domain, a gradual increase in oxygen is observed reaching P O 2 = 120 Torr. In conjunction, the particle within the chamber is heated to 2300 K as a result of high combustion heat release. As the particle travels towards the nozzle, the temperature gradually decreases to approximately 2000 K. In the first few millimeters of the atmospheric region, a reasonable upswing in temperature is discernible, owing to the formation of Mach cones. The particle temperature drops later as the SOD increases, as illustrated in Figure 14b. Consequently, with high partial pressure of oxygen and temperature in the chamber and atmospheric domain, the oxidation rate presented in Figure 14c is at its peak in these two zones with approximately 230,000 Å/s and 370,000 Å/s, respectively. Figure 14d shows the oxide growth thickness throughout the HVOF gun. The process of aluminum oxide formation commences at the center of the chamber. Upon exiting the chamber, the oxide layer measures 400 Å in thickness. The growth of the oxide stabilizes in the nozzle owing to a reduction in the partial pressure of oxygen and temperature. However, an additional increase in the thickness of the oxide layer occurs in the atmospheric domain, attributed to the diffusion of oxygen within the flame. Consequently, the particle is enveloped by an oxide layer measuring 3000 Å in thickness when impacting the substrate surface. Hence, the HVOF leads to 18.5% more oxide growth than the HVAF process.

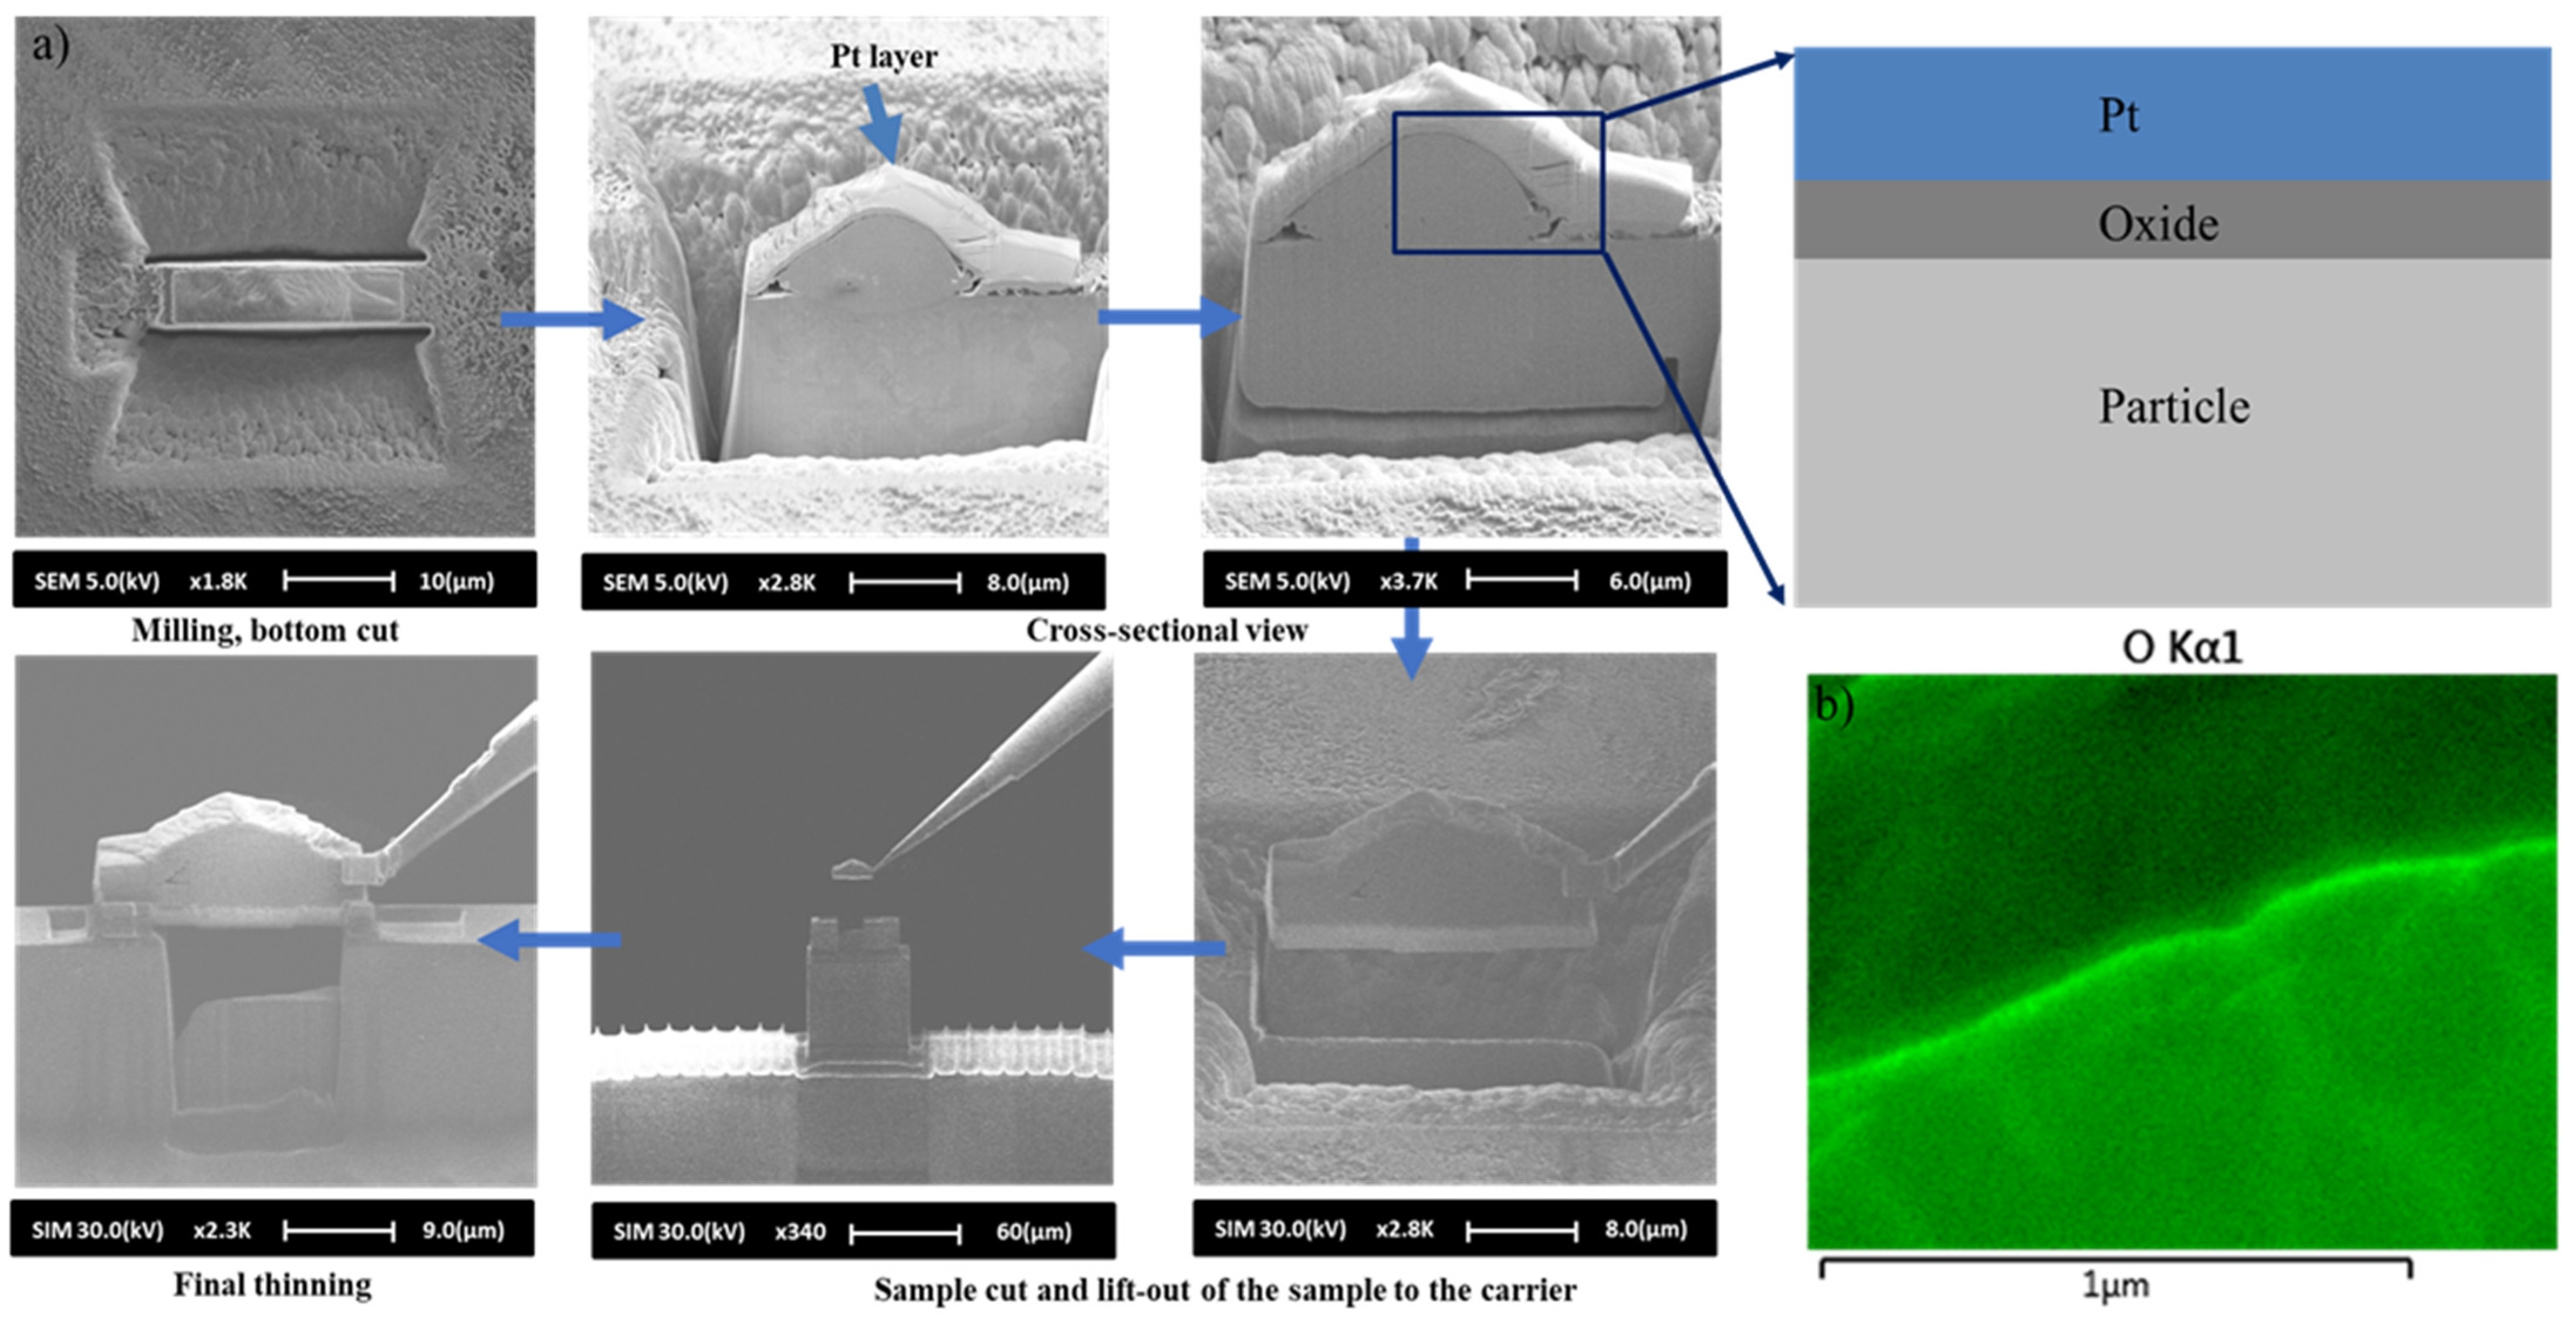
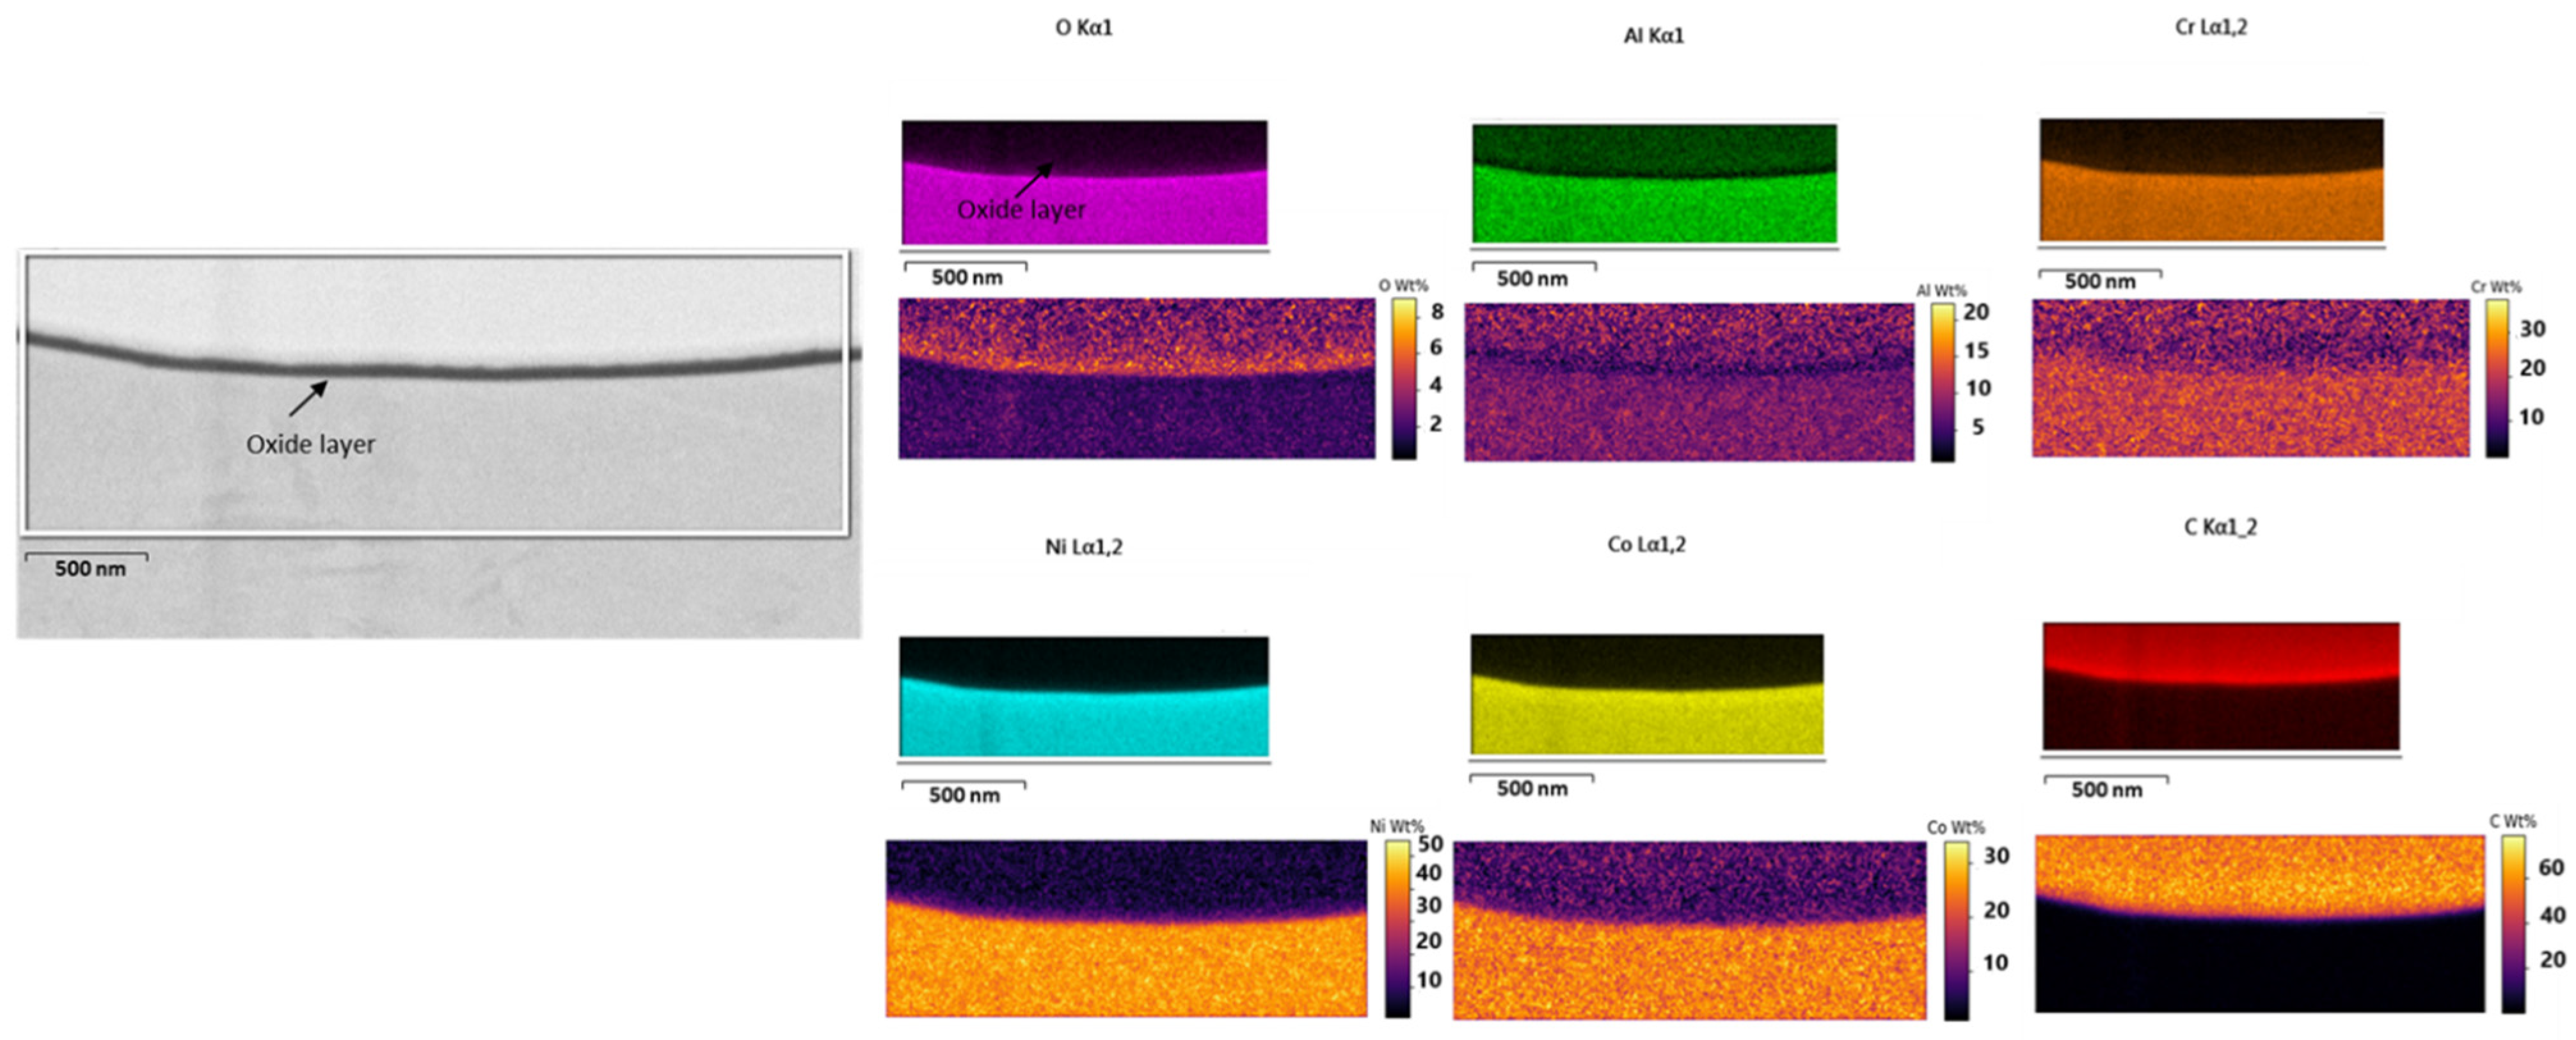
5. Experimental Validation

To validate the developed oxidation model, single isolated deposited particles are analyzed using Transmission Electron Microscopy (Su 9000Ⅱ, Tokyo, Japan). The analysis is used to measure the oxide thickness of a 10 µm particle size deposited using the HVAF process. The collected particle is first coated with a platinum (Pt) layer which acts as a protective layer against the destructive effects of the gallium (Ga) ions in the electron beam, as illustrated in Figure 15. The coated particle is afterward cut transversally by FIB/SEM (NX 5000, Tokyo, Japan). The FIB/SEM generates focused Ga ions that are accelerated and concentrated on the particle sample. The high-energy gallium ions cause sputtering and milling on both sides of the Pt deposition region, leading to a decline in the surrounding sample surface, as highlighted in Figure 15a.
The TEM results show the formation of a uniform oxide layer around the particle with a thickness of approximately 200–250 Å (Figure 15b). In addition, no oxide nodules were detected in the particle, indicating that the oxygen uptake is concentrated mainly at the outer oxide shell surrounding the particle, which is also mentioned in the study by Wu et al. [12]. Nodules refer to the entrapped oxide within a particle that occurs due to convection. Additionally, the feedstock powder before spray was also studied. An initial oxide layer was detected, and its thickness was measured to be approximately 100 Å using the same technique. The results of the experimental particle oxide thickness before and after traveling in the HVAF flow validate an oxide thickness growth of 100 Å to 150 Å, thereby confirming the current study’s numerical prediction.
This study has identified several factors that influence the growth of the oxide thickness. The numerical model used in the study falls within the range of magnitudes observed in the experimental results. However, it is imperative to note that further statistical powder analysis is required, as opposed to solely relying on a single particle to ensure accurate results. Furthermore, the elements of oxygen and aluminum are found during a distribution SEM analysis in the oxide layer. This demonstrates that the oxide formed is an aluminum oxide and further validates the assumptions made in the development of the numerical model and oxide growth theory as depicted in Figure 16. In addition to the particle analysis, Figure 17 shows a coating formed by the HVAF process, which identifies the presence of unmelted particles, confirming the solid-state and/or semi-solid-state deposition process of the HVAF method and further validating the assumption of constant particle density.

6. Conclusions

A predictive model has been formulated and developed to estimate the level of oxidation of MCrAlY particles in the HVAF and HVOF processes. The study findings reveal several key insights:
-
It is evident that the degree of oxidation for in-flight particles is contingent upon their size, with smaller particles (10 µm) exhibiting higher rates of oxidation 1.6 ×   10 6 Å/s vs. 1.853 × 10 4   Å / s for the largest particle (40 µm).
-
In fuel-rich combustion, the oxidation process takes place primarily within the atmospheric domain from the oxygen turbulent diffusion into the main flow.
-
A strong correlation has been observed between particle oxidation and spray parameters. The oxide layer thickens as the air-fuel ratio increases. The higher air-fuel ratio increases the oxygen content and the flame temperature.
-
The injection point location along the radial length of the injector influences the oxidation. The oxide thickness increases drastically with the increase in particle deviation from the centerline: 8 × 10 4   Å ,   32   Å ,   45   Å , and 170 Å for particles injected at 0.275 mm, 0.55 mm, 0.825 mm, and 1 mm, respectively.
-
The degree of oxidation is also altered by different spray processes. The HVOF process, with its hotter jet, produces a thicker particle oxide layer than does the HVAF; an increase of 18.5% is detected.
-
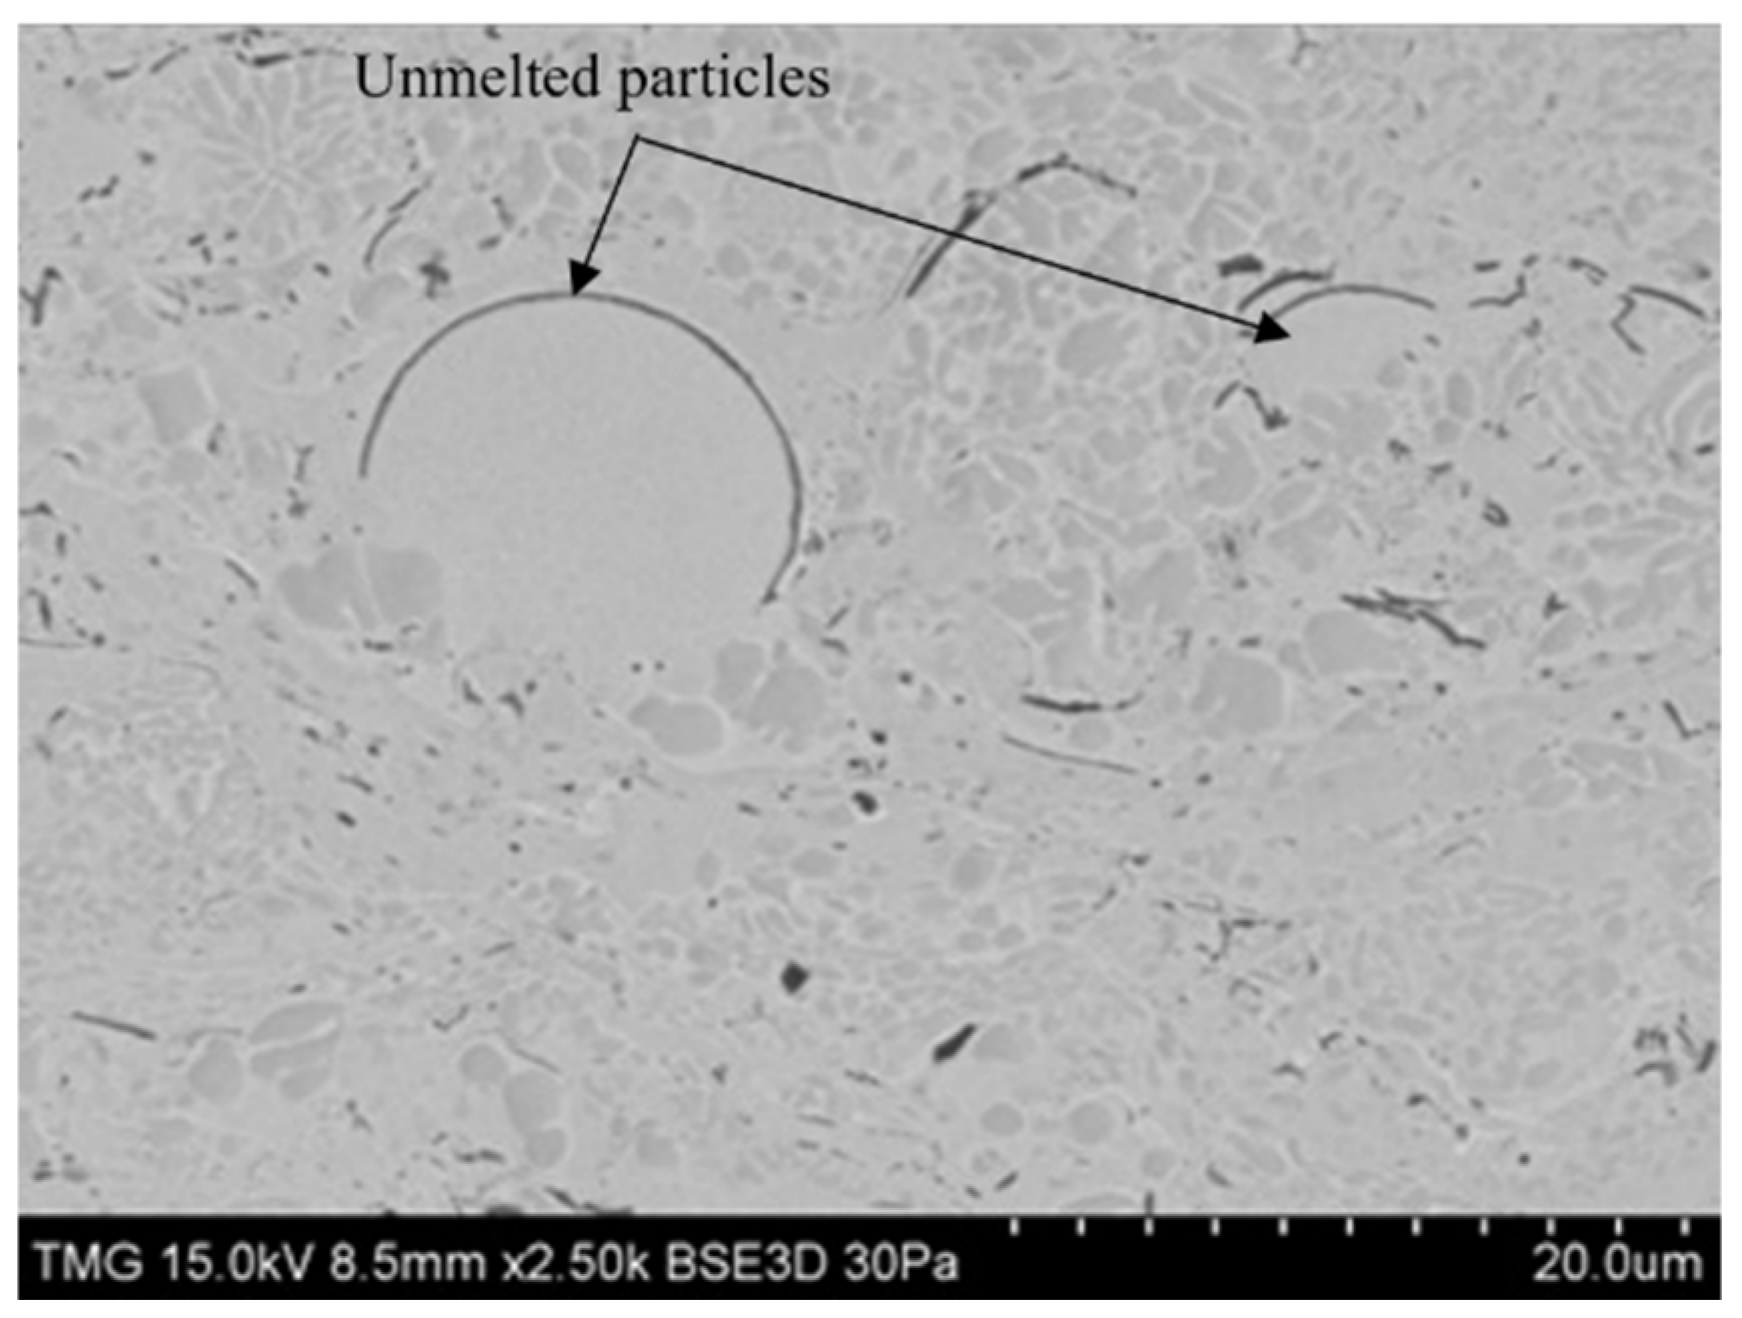
Experimental analysis, conducted via FIB/SEM, has revealed that a 10 µm collected particle possesses an oxide thickness of 200 Å with an initial layer of 100 Å, validating the developed numerical model, by confirming a very thin oxide layer growth process.

Author Contributions

Conceptualization, S.A.B.D., A.N., A.D. and C.M.; Methodology, S.A.B.D., A.N., A.D., C.M. and R.A.; Software, S.A.B.D., A.N., A.D. and R.A.; Validation, S.A.B.D., A.N., A.D., C.M. and R.A.; Formal analysis, S.A.B.D., A.N., A.D., C.M. and R.A.; Investigation, S.A.B.D. and A.N.; Writing—original draft, S.A.B.D. and A.N.; Writing—review & editing, S.A.B.D., A.N., A.D., C.M. and R.A.; Visualization, A.N.; Supervision, A.N., A.D. and C.M.; Project administration, C.M.; Funding acquisition, A.D. and C.M. All authors have read and agreed to the published version of the manuscript.

Funding

This research was funded by the Natural Sciences and Engineering Research Council of Canada (NSERC), grant number 416376807.

Institutional Review Board Statement

Not applicable.

Informed Consent Statement

Not applicable.

Data Availability Statement

Data is contained within the article.

Acknowledgments

The authors acknowledge the support of Pratt and Whitey Canada and US, CRIAQ and TECNAR. They are grateful to Rijvij Chandrakar, Department of Mining and Materials Engineering, University of McGill for the provision of the FIB/SEM analysis.

Conflicts of Interest

The authors declare no conflict of interest.

Abbreviations

List of Symbols
XcrCritical thickness (Å)
A0Model constant (Å s−1)
LDDebye length (Å)
CpSpecific heat (J kg K−1)
mMass (kg)
vpParticle velocity (m s−1)
ApThe surface area of the particle (m2)
CDDrag coefficient
RpReynolds number
TpParticle temperature (K)
hHeat transfer coefficient (W m−2 K−1)
NuNusselt number
Pr Prandlt number
ΔHoxHeat of oxidation (J kg−1)
TmeltingMelting temperature (K)
ΔHmeltingLatent of heat (J kg−1)
fMelting ratio
PPressure (Pa)
Po2Partial pressure of oxygen (Torr)
QModel constant (eV)
uVelocity (m s−1)
ΔtTime (sec)
kThermal conductivity (W m−1 K−1)
koModel constant (eV Torr−0.5)
BiBiot number
ρDensity (kg m3)
λThermal conductivity (W m−1 K−1)
ΓTotal energy (internal + kinetic)
µCoefficient of viscosity (N m−2 s−1)
τDeviator stress tensor
XOxide thickness (Å)
List of Abbreviations
AFRAir-fuel ratio
FIBFocus ion beam
TEMTransmission electron microscope
SEMScanning electron microscope
EDSDispersive x-ray spectroscopy
DPMDiscrete phase model
List of Subscripts
pParticle
gGas
i, jCo-ordinate indices
oxOxide

References

  1. Khamsepour, P.; Moreau, C.; Dolatabadi, A. Numerical Simulation of the Effect of Particle and Substrate Preheating on Porosity Level and Residual Stress of As-sprayed Ti6Al4V Components. J. Therm. Spray Technol. 2022, 31, 70–83. [Google Scholar] [CrossRef] [PubMed]
  2. Yin, S.; Cavaliere, P.; Aldwell, B.; Jenkins, R.; Liao, H.; Li, W.; Lupoi, R. Cold spray additive manufacturing and repair: Fundamentals and applications. Addit. Manuf. 2018, 21, 628–650. [Google Scholar] [CrossRef]
  3. Molak, R.M.; Araki, H.; Watanabe, M.; Katanoda, H.; Ohno, N.; Kuroda, S. Effects of Spray Parameters and Post-spray Heat Treatment on Microstructure and Mechanical Properties of Warm-Sprayed Ti-6Al-4V Coatings. J. Therm. Spray Technol. 2017, 26, 627–647. [Google Scholar] [CrossRef]
  4. Singh, H.; Kumar, M.; Singh, R. An overview of various applications of cold spray coating process. Mater. Today Proc. 2022, 56, 2826–2830. [Google Scholar] [CrossRef]
  5. Wang, H.-T.; Li, C.-J.; Yang, G.-J.; Li, C.-X. Cold spraying of Fe/Al powder mixture: Coating characteristics and influence of heat treatment on the phase structure. Appl. Surf. Sci. 2008, 255, 2538–2544. [Google Scholar] [CrossRef]
  6. Varis, T.; Lagerbom, J.; Suhonen, T.; Raami, L.; Terho, S.; Laurila, J.; Peura, P.; Vuoristo, P. Effect of heat treatments on the wear resistance of HVAF and HVOF sprayed tool steel coatings. Surf. Coatings Technol. 2023, 462, 129508. [Google Scholar] [CrossRef]
  7. Saltykov, P.; Fabrichnaya, O.; Golczewski, J.; Aldinger, F. Thermodynamic modeling of oxidation of Al–Cr–Ni alloys. J. Alloys Compd. 2004, 381, 99–113. [Google Scholar] [CrossRef]
  8. Lu, J.; Zhang, H.; Chen, Y.; Zhao, X.; Guo, F.; Xiao, P. Effect of microstructure of a NiCoCrAlY coating fabricated by high-velocity air fuel on the isothermal oxidation. Corros. Sci. 2019, 159, 108126. [Google Scholar] [CrossRef]
  9. Zakeri, A.; Bahmani, E.; Aghdam, A.S.R.; Saeedi, B. A comparative study on the microstructure evolution of conventional and nanostructured MCrAlY powders at high-temperature. Surf. Coatings Technol. 2020, 389, 125629. [Google Scholar] [CrossRef]
  10. Dai, S.L.; Delplanque, J.-P.; Lavernia, E.J. Microstructural Characteristics of 5083 Al Alloys Processed by Reactive Spray Deposition for Net-Shape Manufacturing. Met. Mater. Trans. A 1998, 29, 2597–2611. [Google Scholar] [CrossRef]
  11. Zeoli, N.; Gu, S.; Kamnis, S. Numerical simulation of in-flight particle oxidation during thermal spraying. Comput. Chem. Eng. 2008, 32, 1661–1668. [Google Scholar] [CrossRef]
  12. Wu, N.-C.; Yang, F.; Sun, W.-H.; Yang, G.; Liang, Y.; Zhang, S.-D.; Wang, J.-Q. In-Flight Oxidation of Fe-Based Amorphous Particle During HVAF Spraying: Numerical Simulation and Experiment. J. Therm. Spray Technol. 2023, 32, 2187–2201. [Google Scholar] [CrossRef]
  13. Fauchais, P.; Vardelle, A. Thermal Sprayed Coatings Used Against Corrosion and Corrosive Wear. In Advanced Plasma Spray Applications; Jazi, H.S., Ed.; IntechOpen: Rijeka, Croatia, 2012; Chapter 1. [Google Scholar] [CrossRef]
  14. Analysis, I.; Gordon, S.; Cleveland, A.; Mcbride, B.J. NASA Reference Computer Program for Calculation Complex Chemical Equilibrium Compositions and Applications. Available online: https://ntrs.nasa.gov/citations/19950013764 (accessed on 4 February 2023).
  15. Gao, X.; Li, C.; Xu, Y.; Chen, X.; Han, X. Effects of Fuel Types and Process Parameters on the Performance of an Activated Combustion High Velocity Air-Fuel (AC-HVAF) Thermal Spray System. J. Therm. Spray Technol. 2021, 30, 1875–1890. [Google Scholar] [CrossRef]
  16. Clift, R.; Grace, J.R.; Weber, M.E. Bubbles, drops, and particles. Dry. Technol. 1978, 11, 263–264. [Google Scholar]
  17. Wu, N.; Li, T.; Lian, J. Numerical Investigation of Hvaf-Sprayed Fe-BASED Amorphous Coatings. Mater. Technol. 2022, 56, 677–688. [Google Scholar] [CrossRef]
  18. Crowe, C.T.; Schwarzkopf, J.D.; Sommerfeld, M.; Tsuji, Y. Multiphase Flows with Droplets and Particles; CRC Press: Boca Raton, FL, USA, 2011. [Google Scholar]
  19. Cabrera, N.; Mott, N.F. Theory of the oxidation of metals. Rep. Prog. Phys. 1949, 12, 163–184. [Google Scholar] [CrossRef]
  20. Lin, Y.; Zhou, Y.; Lavernia, E.J. A Numerical Study of Oxidation Behavior During Reactive Atomization and Deposition. Met. Mater. Trans. B 2004, 35, 1173–1185. [Google Scholar] [CrossRef]
  21. Perry, E.J. Triphenylmethyl Radical Formation on Silver. Ph.D. Thesis, McGill University, Montreal, QC, Canada, 1951. [Google Scholar]
  22. Zeng, Z.; Sakoda, N.; Tajiri, T.; Kuroda, S. Structure and corrosion behavior of 316L stainless steel coatings formed by HVAF spraying with and without sealing. Surf. Coatings Technol. 2008, 203, 284–290. [Google Scholar] [CrossRef]
  23. Dignam, M.J.; Fawcett, W.R.; Böhni, H. The Kinetics and Mechanism of Oxidation of Superpurity Aluminum in Dry Oxygen I. Apparatus Description and the Growth of ‘Amorphous’ Oxide. J. Electrochem. Society 1966, 113, 656. [Google Scholar] [CrossRef]
  24. Ahmed, A.M.; Rangel, R.H.; Sobolev, V.V.; Guilemany, J.M. In-fight oxidation of composite powder particles during thermal spraying. Int. J. Heat Mass Transf. 2001, 44, 4667–4677. [Google Scholar] [CrossRef]
  25. Li, M.; Christofides, P.D. Modeling and control of high-velocity oxygen-fuel (HVOF) thermal spray: A tutorial review. J. Therm. Spray Technol. 2009, 18, 753–768. [Google Scholar] [CrossRef]
  26. Baik, J.-S.; Kim, Y.-J. Effect of nozzle shape on the performance of high velocity oxygen-fuel thermal spray system. Surf. Coatings Technol. 2008, 202, 5457–5462. [Google Scholar] [CrossRef]
  27. Srivatsan, V.R.; Dolatabadi, A. Simulation of particle-shock interaction in a high velocity oxygen fuel process. J. Therm. Spray Technol. 2006, 15, 481–487. [Google Scholar] [CrossRef]
  28. Liu, F.; Li, Z.; Fang, M.; Hou, H. Numerical analysis of the activated combustion high-velocity air-fuel spraying process: A three-dimensional simulation with improved gas mixing and combustion mode. Materials 2021, 14, 657. [Google Scholar] [CrossRef] [PubMed]
  29. Yang, X.; Eidelman, S. Numerical analysis of a high-velocity oxygen-fuel thermal spray system. J. Therm. Spray Technol. 1996, 5, 175–184. [Google Scholar] [CrossRef]
  30. Joshi, S.V.; Sivakumar, R. Particle behaviour during high velocity oxy-fuel spraying. Surf. Coatings Technol. 1991, 50, 67–74. [Google Scholar] [CrossRef]
  31. Cheng, D.; Xu, Q.; Lavernia, E.J.; Trapaga, G. The effect of particle size and morphology on the in-flight behavior of particles during high-velocity oxyfuel thermal spraying. Met. Mater. Trans. B 2001, 32, 525–535. [Google Scholar] [CrossRef]
  32. Li, M.; Christofides, P.D. Computational study of particle in-flight behavior in the HVOF thermal spray process. Chem. Eng. Sci. 2006, 61, 6540–6552. [Google Scholar] [CrossRef]
  33. Li, M.; Shi, D.; Christofides, P.D. Diamond Jet Hybrid HVOF Thermal Spray: Gas-Phase and Particle Behavior Modeling and Feedback Control Design. Ind. Eng. Chem. Res. 2004, 43, 3632–3652. [Google Scholar] [CrossRef]
  34. Jiang, H.-R.; Li, M.-L.; Wei, X.-S.; Ma, T.-C.; Dong, Y.; Ying, C.-X.; Liao, Z.-Y.; Shen, J. Numerical Investigation of In-Flight Behavior of Fe-Based Amorphous Alloy Particles in AC-HVAF Thermal Spray Process. J. Therm. Spray Technol. 2019, 28, 1146–1159. [Google Scholar] [CrossRef]
  35. Jadidi, M.; Moghtadernejad, S.; Dolatabadi, A. Numerical Modeling of Suspension HVOF Spray. J. Therm. Spray Technol. 2016, 25, 451–464. [Google Scholar] [CrossRef]
Figure 1. (a) SEM image of a MCrAlY particle (b) MCrAlY particle material composition.
Coatings 15 00215 g001
Figure 2. (a) HVAF spray gun structure, (b) Details of the graphite ignition sheet.
Coatings 15 00215 g002
Figure 3. (a) Computational domain and meshing details. (b) Numerical component dimensions.
Coatings 15 00215 g003
Figure 4. Schematic of the oxidation mechanism for the formation of different oxide thicknesses: (a) Very thin film (b) Thin film and (c) Thick film. The electric field and space charge concepts are also illustrated.
Coatings 15 00215 g004
Figure 5. Gas properties along the centerline: (a) Static temperature (K), (b) Static pressure (kPa), (c) Velocity magnitude (m/s), and (d) Mach number. A correlation map for each flow characteristic is provided along the modeled domain.
Coatings 15 00215 g005
Figure 6. Mole fraction of different gas elements in the HVAF process (a) Mole fraction of C3H6, (b) Mole fraction of CO, (c) Mole fraction of O2, (d) Mole fraction of CO2, (e) Mole fraction of H2, (f) Mole fraction of H2O, (g) Mole fraction of H, and (h) Mole fraction of N2.
Coatings 15 00215 g006
Figure 7. (a) Particle trajectories throughout the domain (b) Partial pressure of oxygen, (c) Temperature, (d) Oxidation rate, and (e) Oxide thickness for different particle size.
Coatings 15 00215 g007
Figure 8. In-flight velocity magnitude for different particle sizes.
Coatings 15 00215 g008
Figure 9. Gas characteristics along the centerline for an AFR of 14.7 and 7.06: (a) Temperature, (b) Velocity (c) Pressure.
Coatings 15 00215 g009
Figure 10. (a) Partial pressure of oxygen, (b) Temperature, (c) Oxidation rate, and (d) Oxide thickness of a 10 µm particle at a AFR of 14.7 and 7.06.
Coatings 15 00215 g010
Figure 11. Particle injection point influence on in-flight oxidation: (a) 10 µm particle size injected at four different radial locations in the carrier gas stream, (b) Partial pressure of oxygen, (c) Particle temperature, (d) Oxidation rate, and (e) Oxide thickness.
Coatings 15 00215 g011
Figure 12. Schematic of the HVOF [35].
Coatings 15 00215 g012
Figure 13. Gas characteristics in HVOF process: (a) Static pressure, (b) Velocity magnitude, (c) Static temperature and (d) Mole fraction of O2.
Coatings 15 00215 g013
Figure 14. (a) Partial pressure of oxygen, (b) Temperature, (c) Oxidation rate and (d) Oxide thickness of a 10 µm particle in the HVOF process. The same characteristics are provided for the HVAF for comparison purposes and added as inserts.
Coatings 15 00215 g014
Figure 15. Procedure for preparing a TEM sample of a single isolated 10 µm MCrAlY particle: (a) lifted-out sample and (b) oxide measurement.
Coatings 15 00215 g015
Figure 16. Scanning electron microscope (SEM) analysis and element mapping of an oxide layer formed by HVAF using studied parameters indicating the presence of aluminum oxide.
Coatings 15 00215 g016
Figure 17. Cross-sectional characteristics of a coating formed by HVAF utilizing the studied operating parameters within the current work. The unmelted particles are highlighted.
Coatings 15 00215 g017
Table 1. Operating parameters.
Parameters m ˙ a i r (kg/s) m ˙ f u e l (kg/s)Nitrogen Flow Rate (L/min)SOD (cm)Air-Fuel Ratio (AFR)Outlet Pressure (atm)
Values0.023320.0033185.087.061
Table 2. Specific heat, C P , of the MCrAlY powder at different temperatures.
Temperature °KCP J/kg.K
366469
533536
644574
755607
866640
1042703
1134749
1255804
1366856
Table 3. Spray parameters in the HVOF process.
ParametersFuel Flow Rate (g/s)Oxygen Flow Rate (g/s)Nitrogen Flow Rate (g/s)Particle Initial Velocity (m/s)
Values2.666.640.3136.2
Disclaimer/Publisher’s Note: The statements, opinions and data contained in all publications are solely those of the individual author(s) and contributor(s) and not of MDPI and/or the editor(s). MDPI and/or the editor(s) disclaim responsibility for any injury to people or property resulting from any ideas, methods, instructions or products referred to in the content.

