Article

Optimization of Coarse Aggregate Size Distribution for Preplaced Aggregate Cement Paste Coating Concrete

1
Department of Civil Engineering, Foshan University, Foshan 528011, China
2
Research Institute for Applied Mechanics, Kyushu University, Fukuoka 819-0395, Japan
*
Author to whom correspondence should be addressed.
Coatings 2025, 15(2), 200; https://doi.org/10.3390/coatings15020200
Submission received: 10 January 2025 / Revised: 28 January 2025 / Accepted: 6 February 2025 / Published: 7 February 2025
(This article belongs to the Special Issue Novel Cleaner Materials for Pavements)

Abstract

:
The novel casting method of preplaced aggregate cement paste coating (PACPC) concrete is helpful in solving engineering problems. The effects of aggregate particle size distribution and W/C on groutability, mechanical properties, and cement efficiency were investigated through experimental and theoretical analysis. The results showed that, with the increase in the proportion of aggregate with finer size, the groutability first decreased and then increased, while the compressive strength and cement efficiency first increased and then decreased. Widening the particle size distribution increased the aggregate packing density by 12.3%, the compressive strength by 12.7%, and the cement efficiency by 30.3% but decreased the groutability by 3.5%. The packing density of the aggregate skeleton was found to be a governing parameter of the performances of PACPC. As the groutability of grouted preplaced aggregate is generally contradictory to the strength, a proper balance should be struck between the fresh and hardened performance.

1. Introduction

Traditional concrete casting procedures include concrete mixing, pouring, vibration, smoothing, maintenance, and other steps [1]. The pouring step is more complicated, and a lot of manual assistance is required in the pouring process [2]. In some remote mountainous areas, there is a lack of large concrete mixing stations. Concrete mixer trucks are required to carry out long-distance transport. This wastes a lot of construction time and manpower, which seriously increases economic costs and time costs [3]. In addition, long-distance transportation, high-altitude pumping operations, and inevitable residue at the bottom of the concrete tank after unloading cause a waste of cement [4].
To solve these problems, this study proposes a novel casting method and produces preplaced aggregate cement paste coating (PACPC) concrete [5]. The key point of this novel concrete casting method is the “separation of cement paste and aggregate”, that is, mixing cement paste and aggregate separately. Coarse aggregate and fine aggregate are placed and mixed as densely packed mixed aggregate. When casting the PACPC concrete, the mixed aggregate is first placed into the mold as an aggregate skeleton, and then, the cement paste is poured onto and coats the aggregate mix in the mold. The cement paste then gradually fills the voids between the aggregate skeleton. Based on the aggregate packing density, the amount of cement paste used can be precisely controlled to maximize the cement efficiency (strength/cement ratio). The specific steps of the novel casting method are as follows:
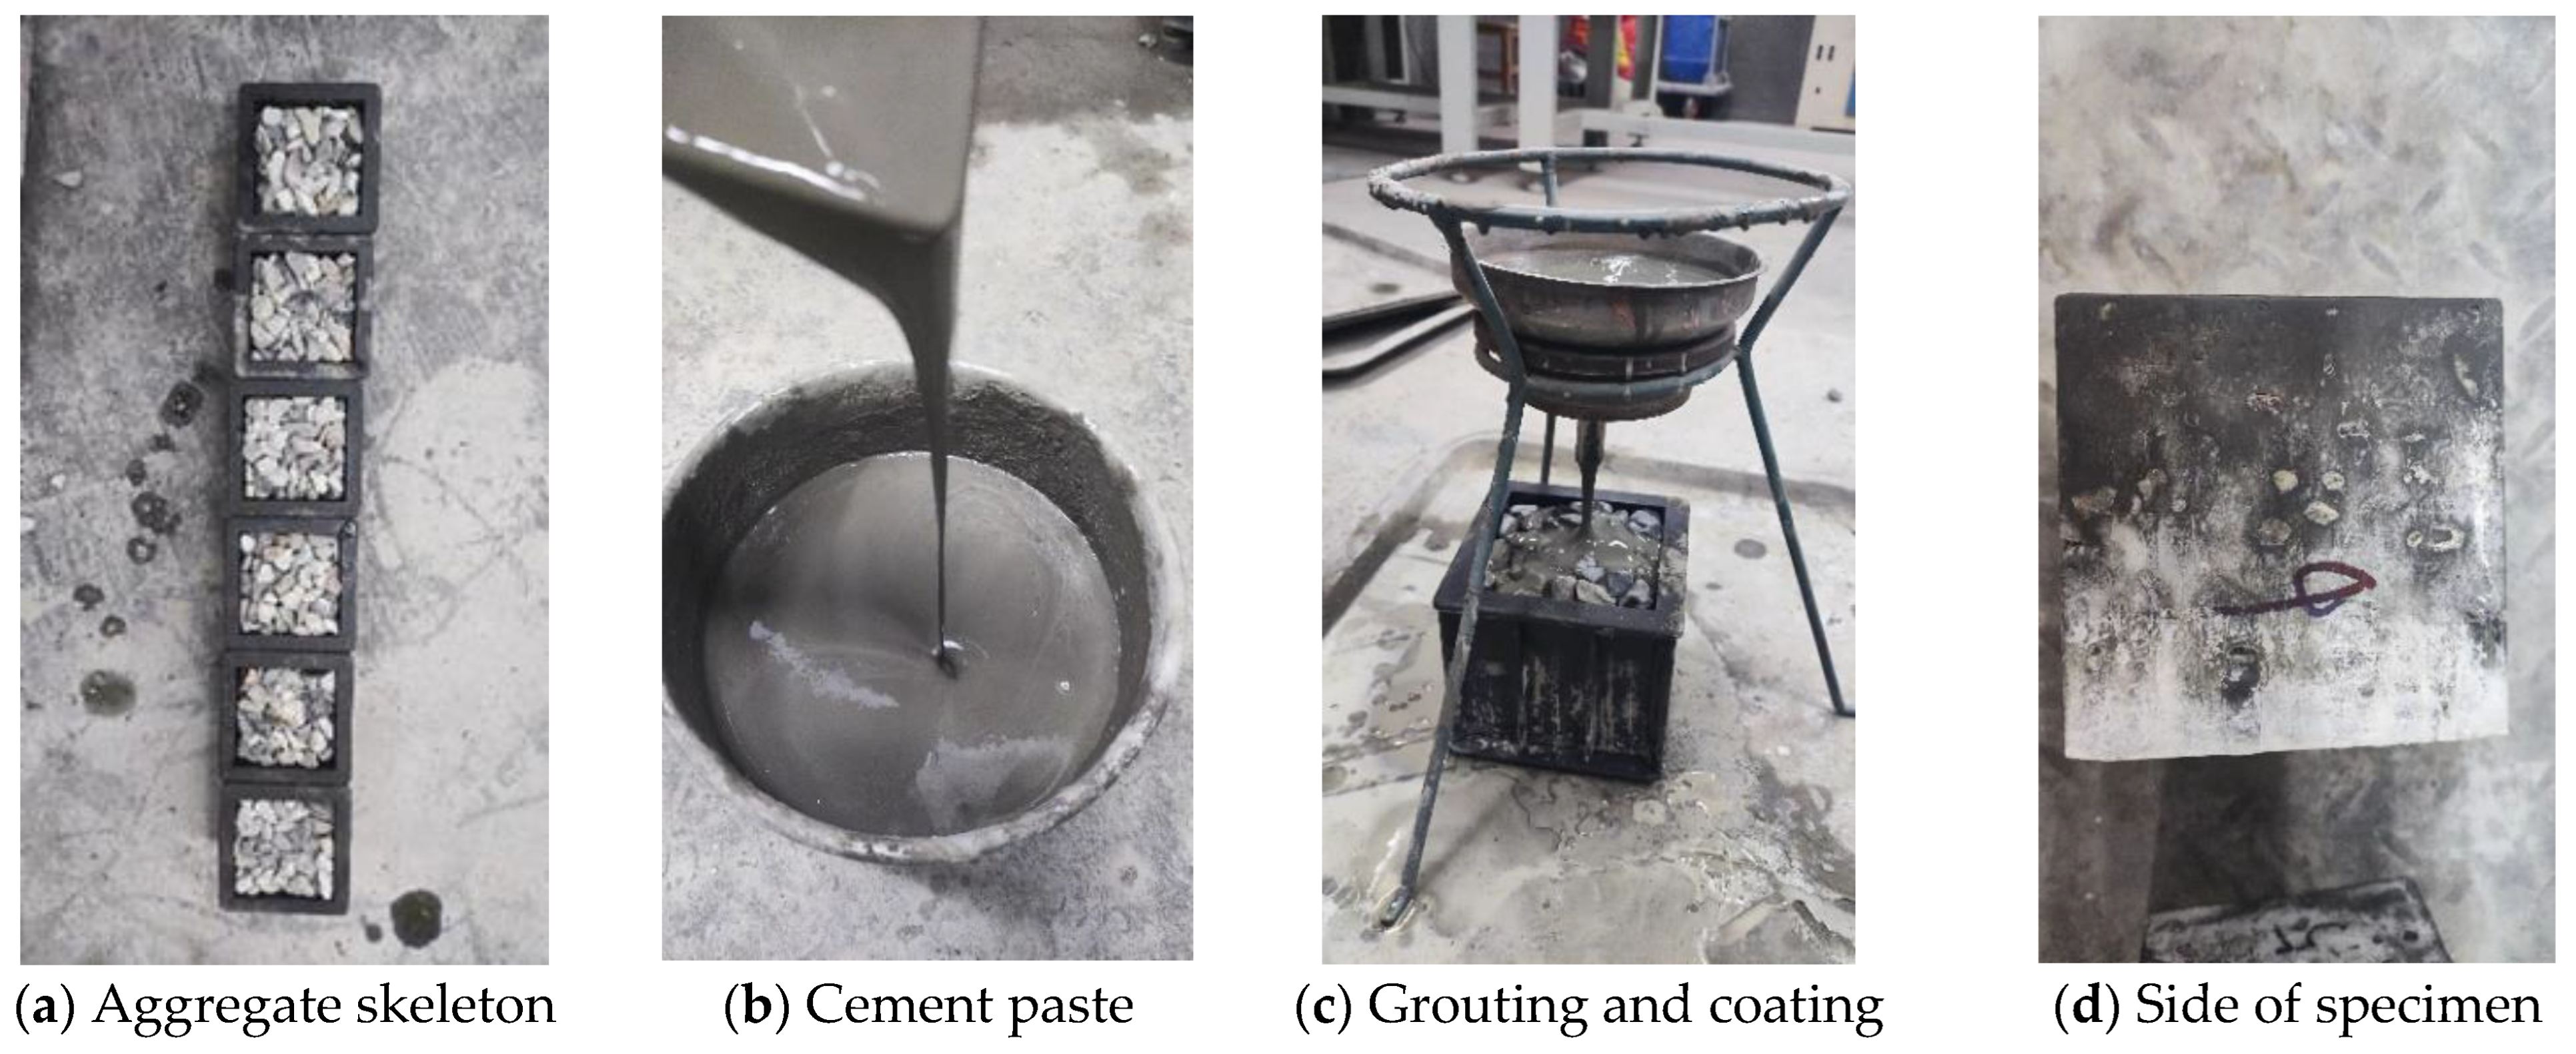
  • Production of the aggregate skeleton
The continuous grade of particle size has a great influence on the performance of concrete [6,7,8,9]. Mechanical sieving is used to divide the continuously graded aggregate into four size ranges: A, B, C, and D. A is 5~10 mm, B is 10~16 mm, C is 16~20 mm, and D is 20~25 mm. The aggregate with each size range is weighed, and then they are evenly mixed in the concrete mixer. The mixed aggregate is placed in the mold to build up the aggregate skeleton, as shown in Figure 1a. This aggregate skeleton can be vibrated and compacted according to the requirements.
  • Production of cement paste
The cement paste was mixed according to Chinese standard GB/T 1346-2001. The cement is mixed in the mixer for 30 s, and then the water and water reducer are added to the cement and mixed for 120 s to produce cement paste, as shown in Figure 1b.
  • Grouting and coating
The mold filled with aggregate is placed on the ground. The cement paste is vertically poured onto the aggregate through a funnel and then penetrates into the voids between the aggregate skeleton and coats the aggregate mix. The time for the paste to penetrate into the aggregate mixture is recorded as grouting time. Then, the mold filled with aggregate and cement paste is placed on the shaking table to shake for 10 s when the bubbles inside the mold are eliminated, as shown in Figure 1c.
  • Demolding
The PACPC concrete produced according to the above procedures (1) to (3) is placed in the lab and demolded after 24 h, as shown in Figure 1d. After demolding, the specimens are stored in a chamber regulated at 24 ± 2 °C until strength testing at a 28-day age.
Unlike conventional concrete, whose aggregate and cement paste are mixed together in a concrete mixer, the PACPC concrete separately mixes the aggregate and cement paste. To maintain sufficient groutability of cement paste (the ability of the cement paste to fill the voids between the aggregate skeleton), the PACPC concrete does not contain fine aggregate. According to the packing density of the aggregate, the amount of cement paste used can be accurately controlled to maximize the cement efficiency (strength/cement ratio). Compared with the traditional casting method [10,11,12,13,14], this novel casting method can simplify the pouring process. For remote construction sites where there is a lack of nearby concrete mixing plants, this novel casting method can solve the problems (such as loss of workability, loss of cohesiveness, setting, and hardening) and save the time and cost arising from long-distance concrete transportation [15,16]. In the construction of tall buildings, this novel casting method can avoid pipe blocking and excessive heat generation during pumping and reduce waste during transportation [17,18,19,20,21,22,23].
Up to now, there have only been a few similar studies on this novel casting method or on PACPC concrete. Kong et al. [24] put forward the heuristic design of filled cement-based composite material (ICC) in order to reduce environmental impact. Chu [5] demonstrated the feasibility and superiority of filled cement-based composites over conventional concrete by reducing costs and CO2 content and improving performance. In this study, the effects of coarse aggregate size distribution and the water–cement ratio on the groutability, mechanical properties, and cement efficiency of PACPC concrete were evaluated, which helped develop this novel casting method and the application of PACPC concrete in this paper.

2. Raw Materials, Test Methods, and Mix Design

2.1. Raw Materials

The cement was PO 42.5 grade ordinary Portland cement with a density of 3127 kg/m3. Its main properties and chemical composition are shown in Table 1 and Table 2, respectively. Its scanning electron microscope (SEM) image with magnification of 2000 (Mag = 2.00 KX) is shown in Figure 2. As can be seen from the SEM image, the particle shape is irregularly polyhedral, and the particle size is mainly between 10 and 60 μm. The aggregate was limestone with particle sizes of 5–10 mm, 10–15 mm, 15–20 mm, and 20–25 mm. Its density was measured to be 2616 kg/m3. The water-reducing agent was polycarboxylic-based agent featured by a water-reducing rate of 30%.

2.2. Test Methods

For the test following standards, the results from different samples of the same mix were checked to meet the allowable limitation of deviation. For the test without standard to follow, the deviation was checked as follows: when the test result of one specimen exceeds ±15% of the average value, this single result is discarded, and the average value of the remaining two specimens is taken as the final compressive strength; when the test result of two or more specimens exceeds ±15% of the average value, the result is considered unacceptable, and the test is repeated until the deviation is within allowable limit. The above-mentioned information has been provided in the revised manuscript.

2.2.1. Aggregate Packing Density

In this test, the packing density of mixed aggregates in the concrete mix is measured as the maximum solid concentration under different water amounts [16]. In this circumstance, the aggregates are closely packed. The aggregate mass M and the mold volume V are recorded, and the packing density ρ of the aggregate is calculated by Equation (1).
P = ( M a g g r e g a t e / ρ a g g r e g a t e ) / V
P is aggregate packing density, M a g g r e g a t e is aggregate mass, ρ a g g r e g a t e is aggregate density, and V is mold volume. The result of each aggregate mix is determined according to the average value of three samples.

2.2.2. Flow of Cement Paste

The flow of cement paste is determined according to GB/T 50080-2016 “Standard for Performance Test Methods of Ordinary Concrete Mix”. The time for the concrete mix to spread and reach 25 cm scale line is recorded to indicate the ability of the paste to flow. The result of each cement paste mix is determined as the average value from three times.

2.2.3. Flowability of Cement Paste

In this study, the time for cement paste to pass a funnel was measured to indicate the flowability. For the funnel, the upper and lower diameters of the cone are 152 mm and 4.76 mm, respectively. The height of the funnel is 305 mm. The result of each cement paste mix is determined as the average value from three times.

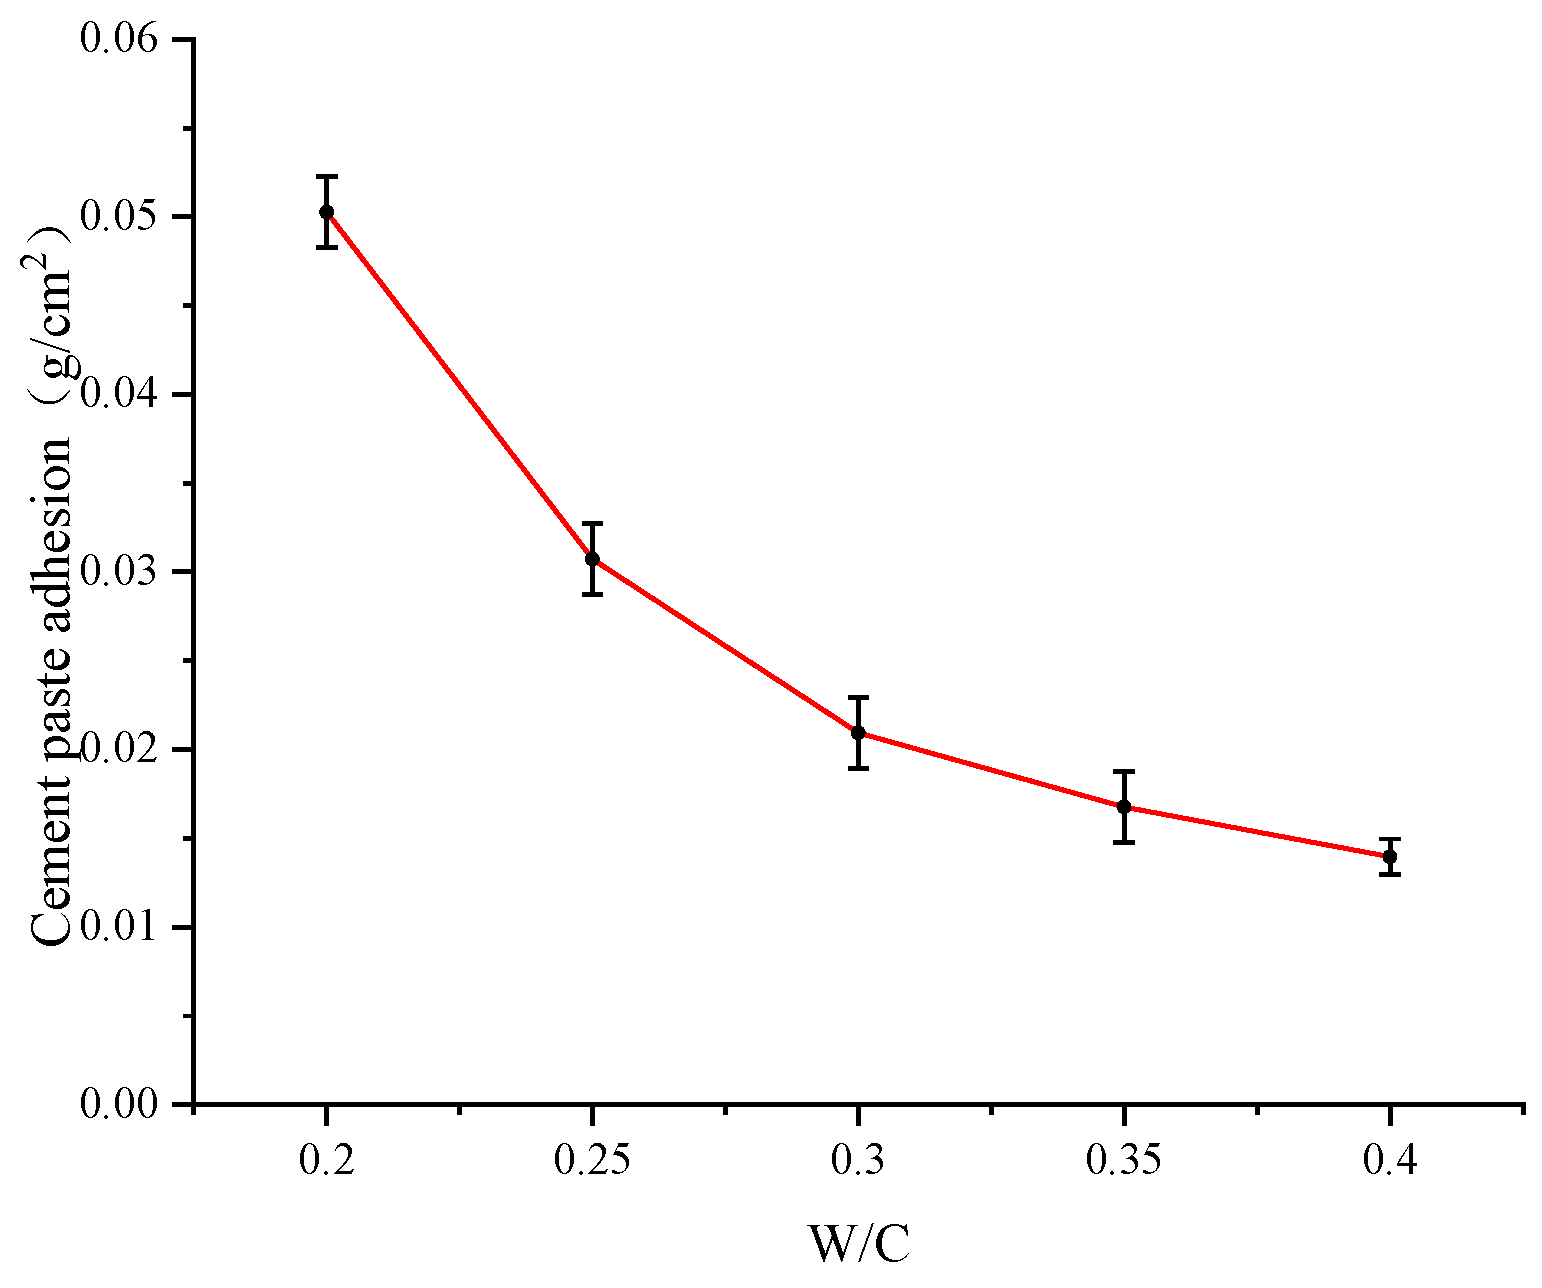
2.2.4. Adhesiveness of Cement Paste

The adhesiveness of cement paste indicates the ability to adhere to the aggregate surface. The test procedures follow Kwan and Li [25]. A stone rod with a diameter of 2.5 cm and a length of 20 cm is used for the adhesiveness test. The adhesiveness test is completed within 5 min after the sample is stirred. After the stone rod is moistened, it is inserted into the newly mixed cement paste sample at a depth of 10 cm, and the stone rod is slowly pulled out after 30 s. The ratio of the increased mass to the surface area of the stone rod indicates the adhesiveness. The result of each cement paste mix is determined as the average value from three times.

2.2.5. Ultrasonic Pulse Velocity

Ultrasonic pulse velocity test was carried out using a concrete ultrasonic detector. The test is conducted as per Chinese standard CECS02-2005, “Technical Regulations for Testing Concrete Strength by Ultrasonic Rebound Comprehensive Method”. A higher ultrasonic pulse velocity indicates a lower void volume in the concrete mix. The result of each concrete mix is determined according to the average value of three samples.

2.2.6. Groutability

Groutability is the ability of cement paste to fill the voids between aggregate skeletons in the PACPC concrete. Numerically, the groutability is indicated by the grouting rate, which is quantified by the percentage of the cement paste to fill the voids between aggregate. The procedures for measuring the groutability are as follows. Fill the mold with the aggregate. Place a Markov funnel above the mold. Pour 250 mL cement paste into the funnel, and maintain the height of the cement paste in the funnel unchanged so as to ensure that the discharging rate of cement paste from the funnel remains basically unchanged. The discharging rate is determined by measuring the volume of cement paste discharging from the funnel during a unit of time. The cement paste in the funnel is dropped onto the mold until the cement paste overflows from the edge of the mold. At this time, the penetration speed of the cement paste is lower than the discharge speed of the cement paste flowing from the bottom of the funnel. The time from the beginning of the discharge to the overflowing of the cement paste in the mold is recorded as grouting time t. The grouting rate µ can be calculated by Equation (2)
µ = t × v/(V × (1 − P)),
µ: grouting rate; t: grouting time; v: cement paste discharging rate; V: mold volume; P: the packing density of the aggregate. The test was carried out only once for each concrete paste mix.

2.2.7. Compressive Strength

The concrete cube compressive strength test and the deviation check of the results were conducted according to BS EN 12390-3:2009. Three 100 mm × 100 mm × 100 mm cube specimens were used for compressive tests. The instrument used is RFP-03 intelligent loading measurement machine. The loading rate was 0.65 MPa/s. The compressive strength value is determined according to the average value of the test results of the three specimens.

2.2.8. Cement Efficiency

The cement efficiency is the ratio of the strength of concrete to the mass of cement consumed per unit volume of concrete. It indicates the contribution and effectiveness of cement to strength. It can be calculated through Equation (3).
E c e m e n t = S / M c e m e n t ,
E c e m e n t indicates cement efficiency, S indicates compressive strength, and M c e m e n t indicates the cement content consumed per unit volume of concrete.

2.3. Mix Design

Table 3 lists the mix design of dense skeleton grout concrete samples in this study. The water/cement ratio was constant at 0.30, and the water reducer dosage was constant at 1% of the mass of the cement. These mix parameters were commonly used values to produce normal- and high-strength concrete in construction industry. Because the grouting rate (the percentage of the cement paste to fill the voids between aggregate) was unknown before mixing, the cement paste volume (the total volume of cement, water, and water reducer) was not predetermined but was calculated from the groutability testing results. Generally, the high packing density of the aggregate skeleton resulted in a difficult grouting of the cement paste and resulted in a lower cement paste volume, as shown in Table 3. There were a total of 38 mixes in this study. Three specimens were produced for testing for each mix. Four types of coarse aggregate with continuous gradation particle size and five types of W/C ratios were selected as independent variables to analyze the groutability, mechanical properties, and cement efficiency. The packing density of the aggregate skeleton is changed by adjusting the proportion of aggregate with different particle sizes. The four coarse aggregates were 5–10 mm, 10–15 mm, 15–20 mm, and 20–25 mm, respectively. The W/C ratios were 0.20, 0.25, 0.30, 0.35, and 0.40, respectively. Two aggregate particle sizes (15–20 mm coarse aggregate and 20–25 mm coarse aggregate) were first used for cement efficiency (strength/cement ratio) analysis and recorded as 2D. After obtaining the optimal cement efficiency ratio of 2D-6, the third aggregate (10–15 mm coarse aggregate) was added based on the 2D-6 ratio and recorded as 3D. After the optimal cement efficiency ratio 3D-4 group is obtained, the fourth aggregate (5–10 mm coarse aggregate) is added based on the 3D-4 mix ratio and recorded as 4D to obtain the optimal cement efficiency ratio 4D-2. Finally, based on the particle size distribution of coarse aggregate in group 4D-2, the W/C ratios were set as 0.20, 0.25, 0.30, 0.35, and 0.40, respectively, to determine the W/C with the highest cement efficiency. The storage of the raw materials and testing, casting, and curing of the specimens were conducted in lab with humidity above 90% and temperature of 20 ± 3 °C.

3. Results and Discussion

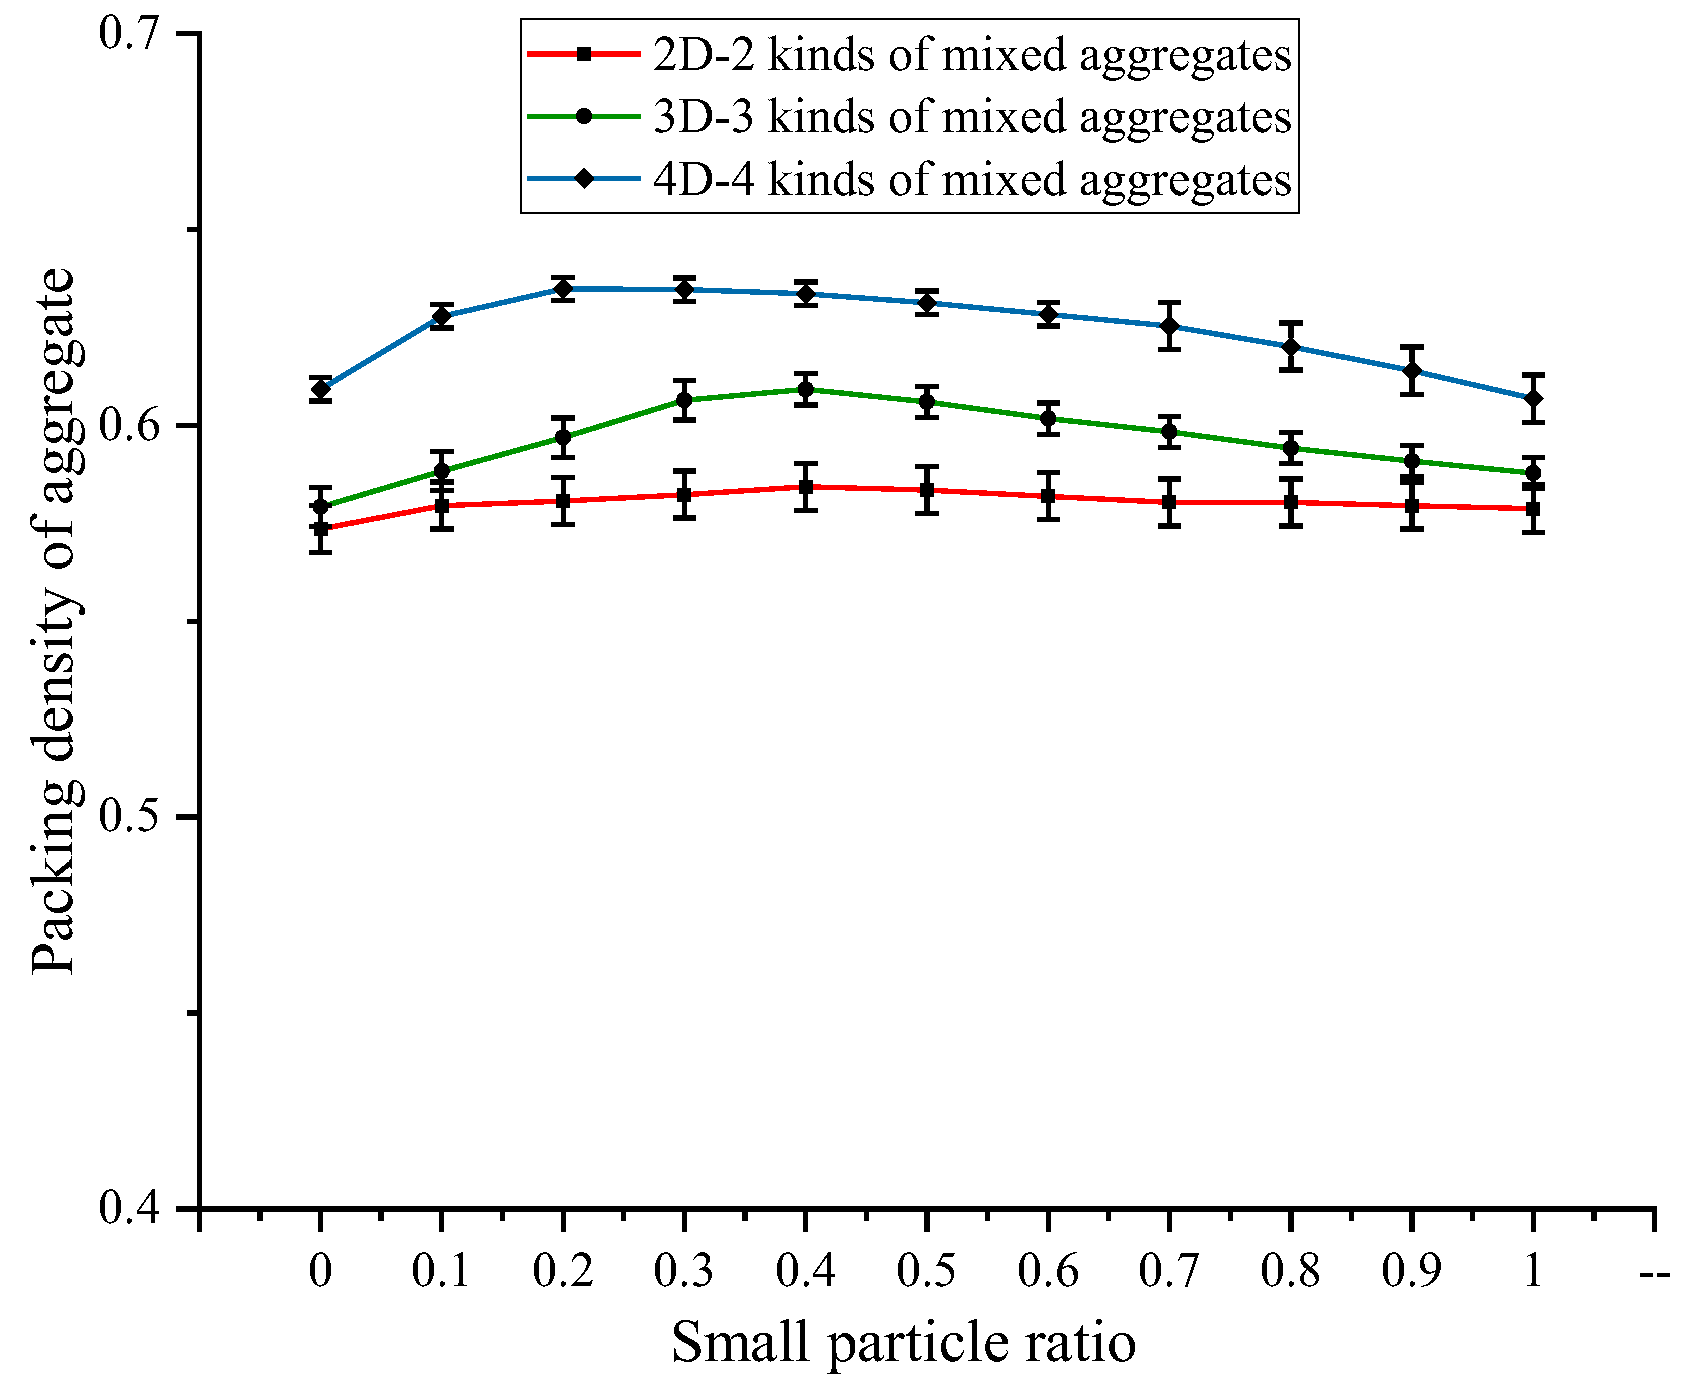
3.1. The Packing Density of Aggregate

In Figure 3, the small particle ratio refers to the ratio of particles with smallest range of size to the whole particles, and the nD refers to n particle size ranges: 2D curve represents aggregates with two particle size ranges of 15–20 mm and 20–25 mm, 3D curve represents aggregates with three particle size ranges of 10–15 mm, 15–20 mm and 20–25 mm, and 4D curve represents aggregates with four particle size ranges of 5–10 mm, 10–15 mm, 15–20 mm, and 20–25 mm. When the mixed aggregate was filled into the mold without vibration, the aggregate was in a non-closed packing state (similar to natural packing), and the packing density of the mixed aggregate increased with the increase in the small particle ratio. And the wider the distribution of aggregate particle size, the higher the packing density of mixed aggregate was. The 2D curve changed gently, while the 3D and 4D curves changed significantly.
The vibration of the mixed aggregate after filling the mold significantly increased the packing density, and the aggregate became a relatively close packing state, as shown in Figure 4. The packing density of the mixed aggregate first increased and then decreased with the increase in the small particle ratio. In addition, the packing density of mixed aggregate increased with the aggregate particle size types. The minimum packing density of mixed aggregate occurred in aggregate mix 2D (only two aggregate particle sizes), and the maximum packing density occurred in aggregate mix 4D. The highest packing density occurred when the ratio of aggregate particle size was 5–10 mm:10–15 mm:15–20 mm:20–25 mm = 0.200:0.320:0.192:0.288.
In theory, the minimum porosity can be achieved by adopting the optimal particle size distribution (PSD) curve [26,27,28,29], which is displayed in the solid line in Figure 5. Fuller and Thompson [30] first proposed the idea of drawing an ideal particle size distribution curve for concrete aggregates in 1907 and advocated the Fuller grading curve, as shown in Equation (4). For different aggregates, it is necessary to recalibrate the Fuller grading curve. The Fuller grading theory was mainly summarized on the basis of experiments and was mainly used to produce concrete with a compressive strength of less than 30 MPa. On this basis, Andreasen and Andersen [31] proposed the A-A curve in 1930. However, the A-A curve model did not consider the smallest particle size in the aggregate mix; thereafter, Funk and Dinger [32] further improved and modified the A-A curve. The minimum particle size (Dmin) in the concrete mix was introduced into the model, and the modified A-A curve could be expressed based on Equation (5).
Because the distribution modulus q is usually determined by qualitative experience according to the type of aggregate or the way of mixing, there was no recognized method or standard specification to determine the value [33].
P ( D ) = ( D / D m a x ) q ,
P(D) is the percentage of total solids less than particle size D, D is particle size, D m a x is the maximum particle size in the aggregate mix, and q is the distribution modulus.
P ( D ) = D q D m i n q D m a x q D m i n q ,
D m i n is the minimum particle size of the aggregate mix.
There is no standard or industry-recognized method to determine the value. Due to the inaccuracy of the q value, there may be an error in indicating the optimum packing. Experimental verification by Dinger and Funk showed that when the aggregate is assumed to be a three-dimensional sphere, the aggregate mix will reach the most tightly packed state when the q value is 0.37. In this study, q = 0.37 was taken, and the optimal particle size curve calculated by Equation (5) is shown in Figure 5. According to the optimal particle size curve, the optimal distribution of aggregate particle size content was 5–10 mm:10–15 mm:15–20 mm:20–25 mm = 0.200:0.300:0.230:0.280, and the optimal distribution of aggregate particle size was 5–10 mm:10–15 mm:15–20 mm:20–25 mm = 0.200:0.320:0.192:0.288. This optimal distribution is displayed in Figure 5.

3.2. Flowability and Viscosity of Cement Paste
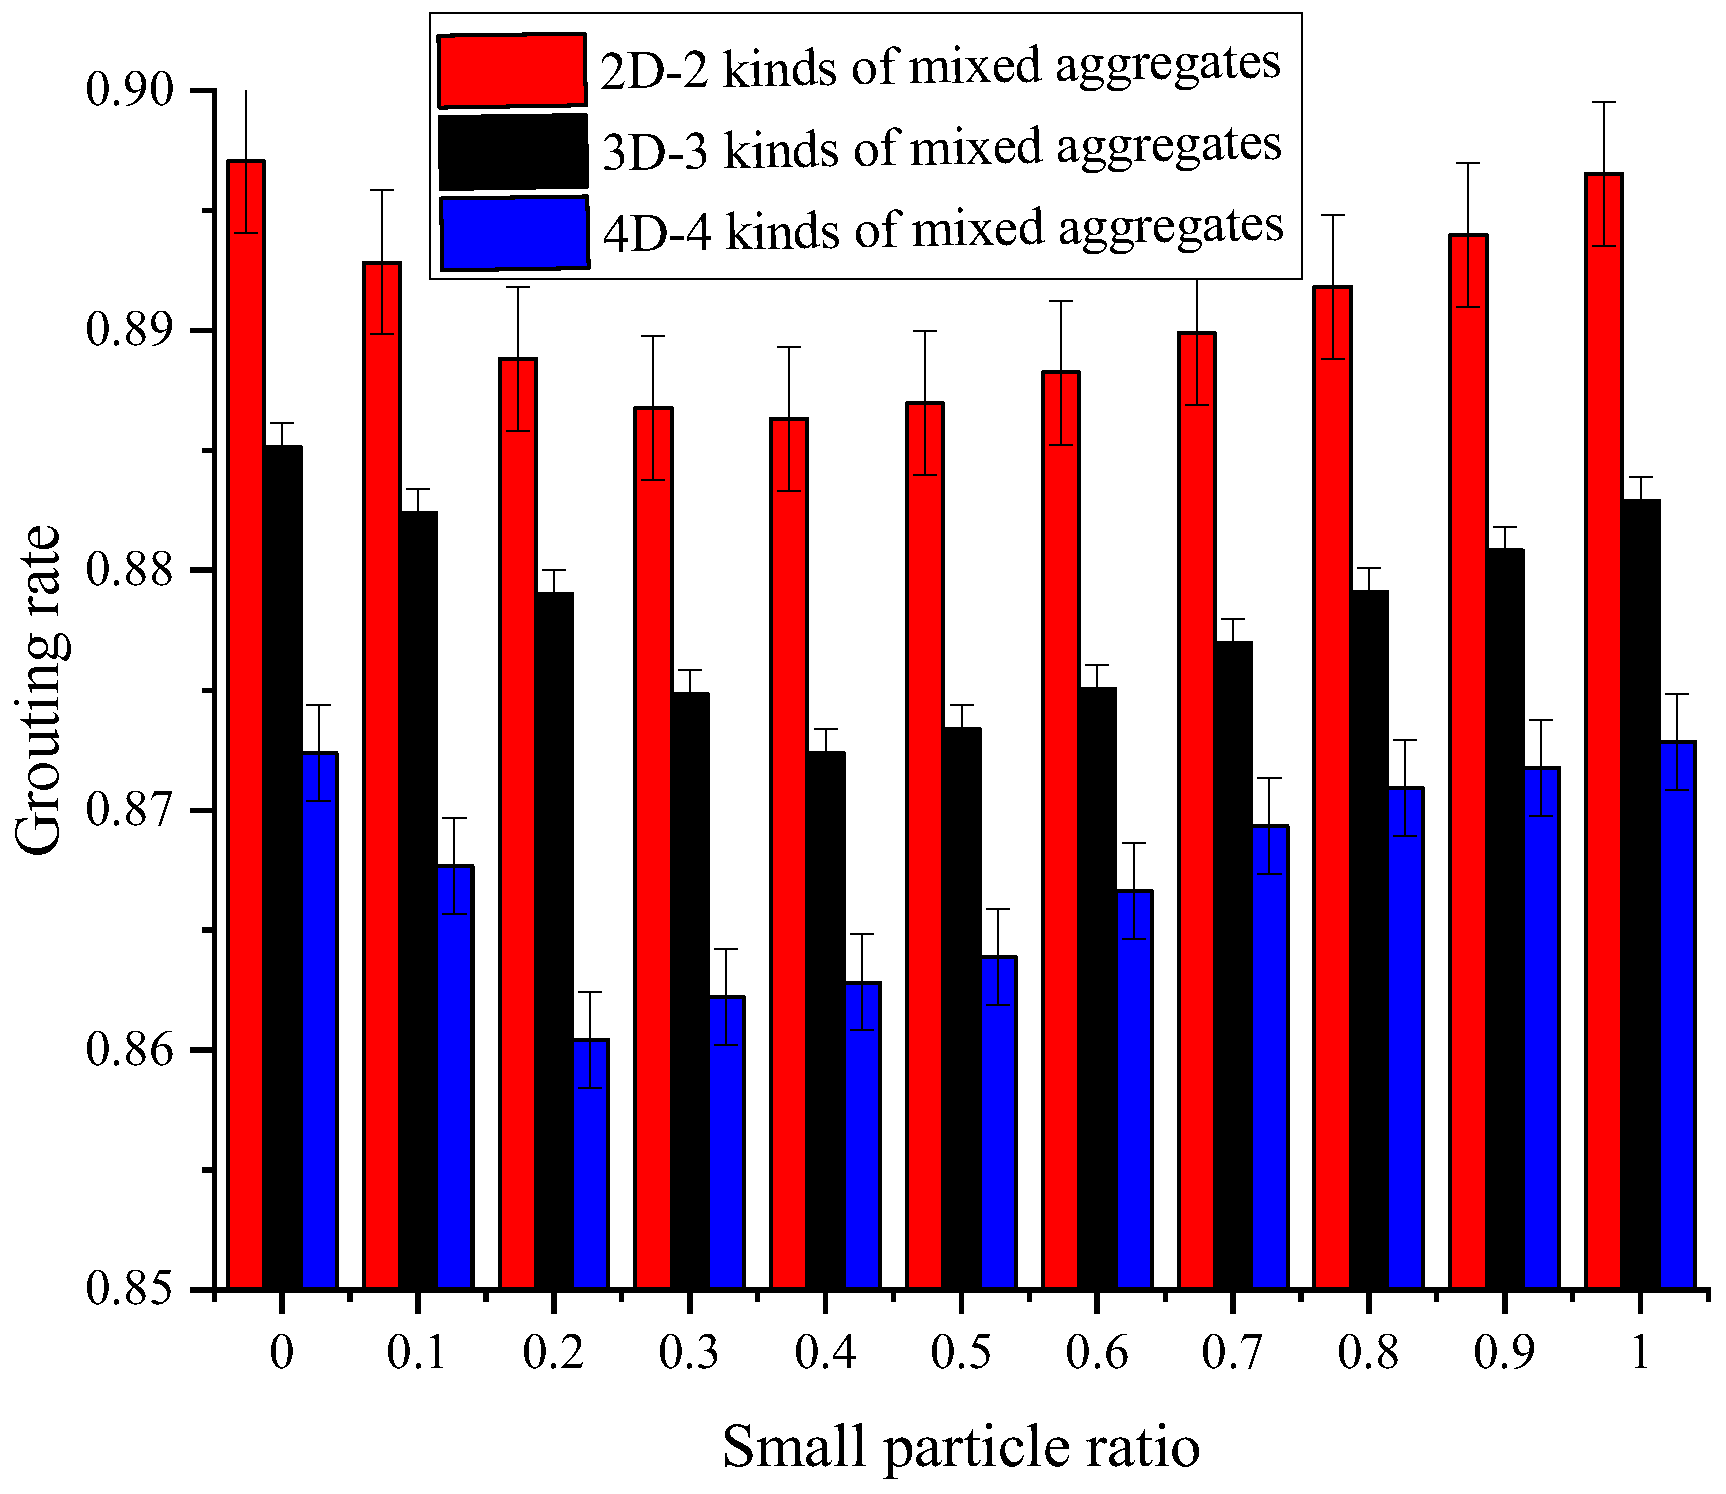
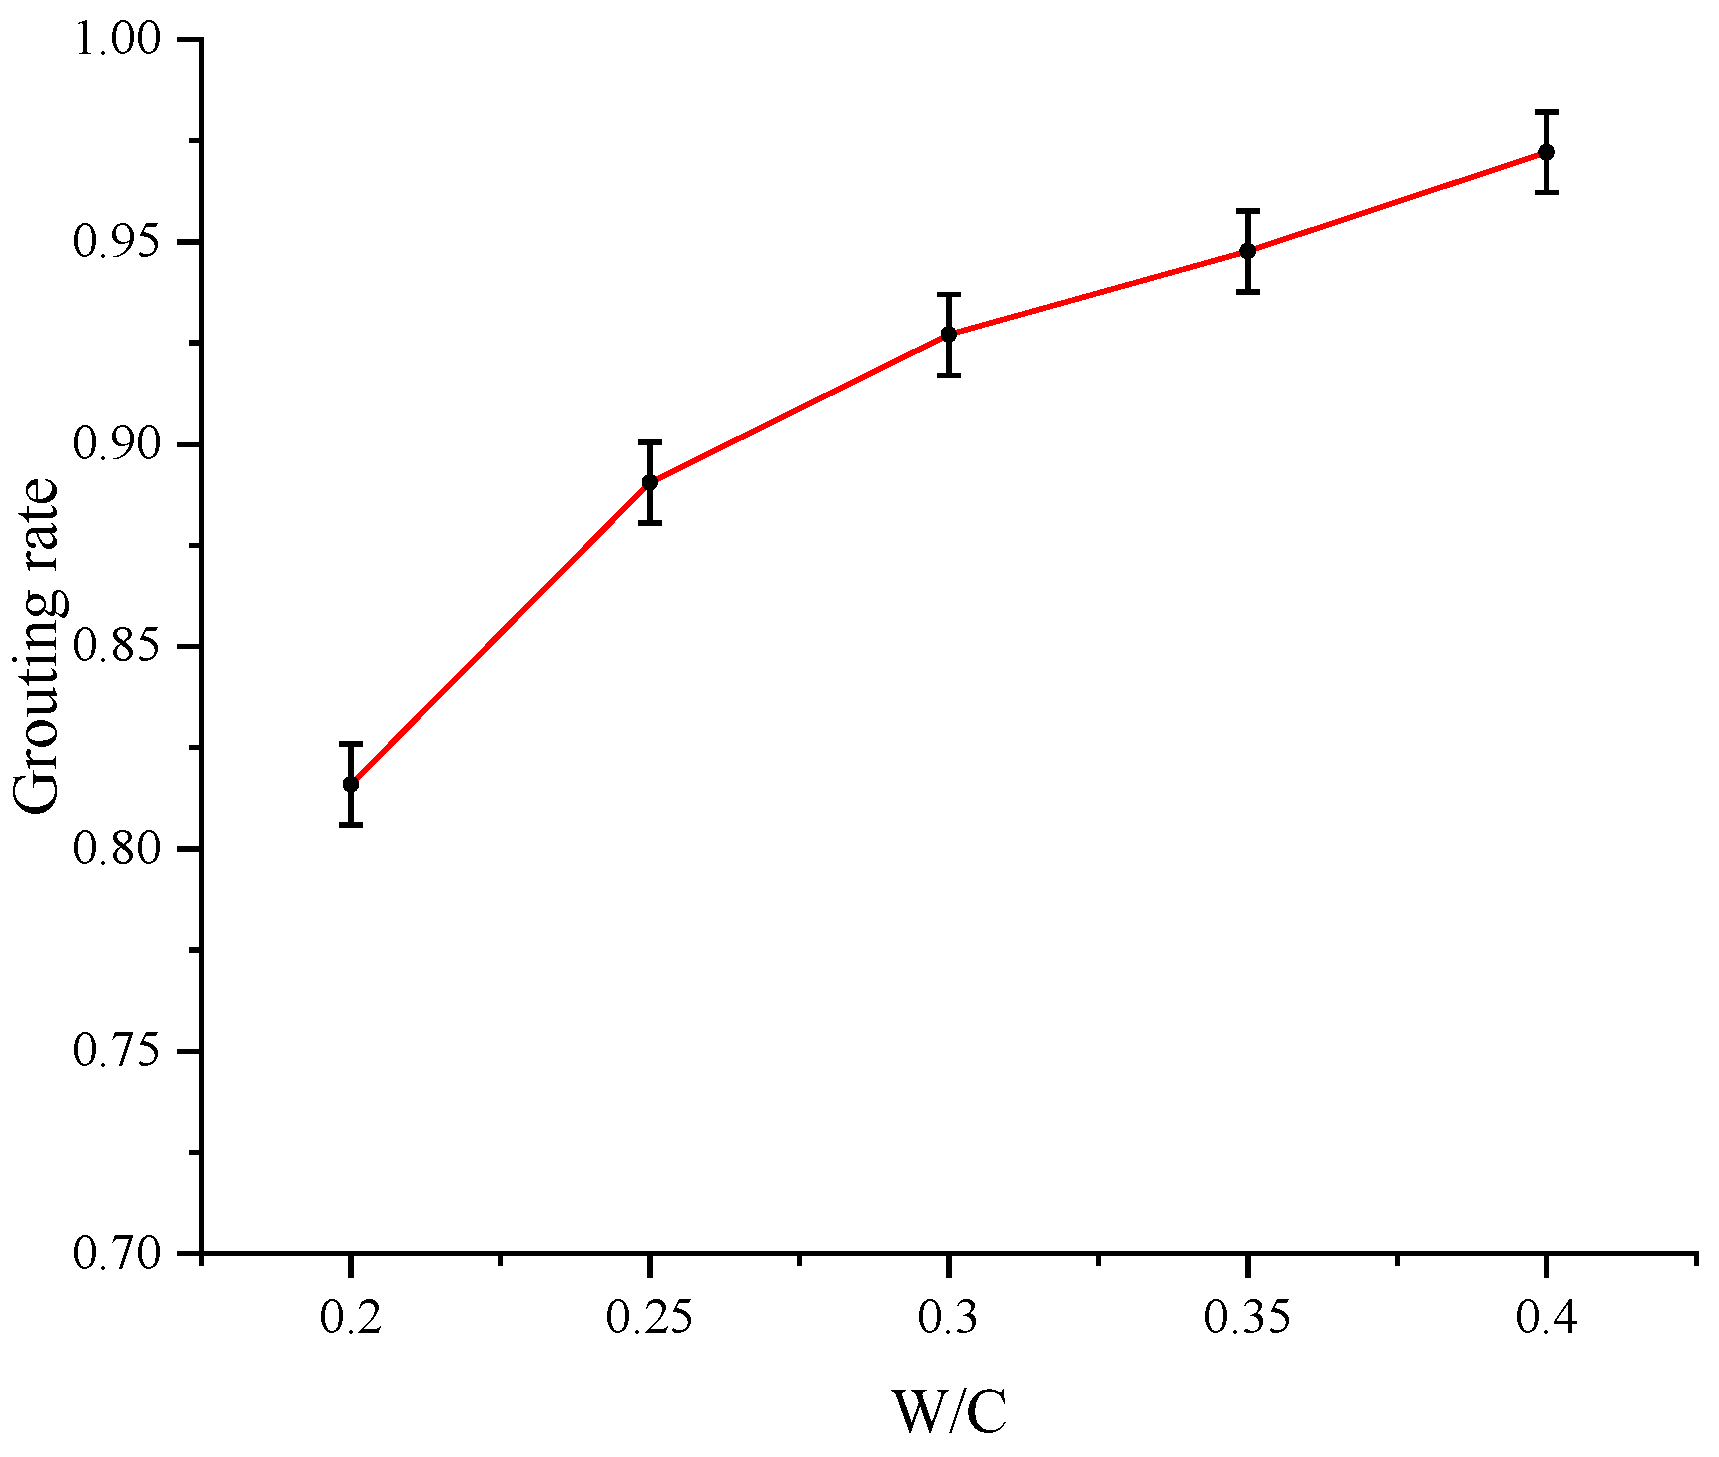
It can be seen from Figure 6, Figure 7 and Figure 8 that both the time for the cement paste to flow to 25 cm and the adhesiveness decreased with the W/C ratio. The flowability of cement paste increased with the W/C ratio, and the adhesiveness of cement paste decreased with the W/C ratio. Moreover, the flowability and adhesiveness of cement paste changed rapidly with the W/C ratio in the range of 0.20–0.30 and changed slowly with the W/C ratio in the range of 0.30–0.40. As can be seen from Figure 9, the density of cement paste decreased with the increase in W/C ratio, while the flowability of cement paste increased with the increase in W/C ratio. Therefore, for cement paste, the higher the W/C ratio, the smaller the density, the better the flowability, and the worse the adhesiveness.

3.3. Grouting Rate

It can be seen from Figure 10 that the grouting rate was related to the small particle ratio. The grouting rate first decreased and then increased with the small particle ratio. This was because the void size between aggregates played an important role in the groutability of the aggregate skeleton. When the small particle ratio was lower than 0.40, the packing density increased with the small particle ratio, which generally resulted in a narrower path for the cement paste to go through and, therefore, lowered grouting rate; when the small particle ratio was higher than 0.40, the packing density decreased with the small particle ratio, which generally resulted in a wider path for the cement paste to go through and therefore higher grouting rate. In the case of four-particle-size aggregates (4D), the grouting rate was generally low because of the high packing density of the aggregate, which resulted in small gaps between the aggregates and made it difficult for the cement paste to penetrate. As a result, the grouting rate stayed at about 87%.
As can be seen from Figure 11, under the same aggregate particle size distribution, the higher the W/C ratio, the higher the grouting rate. The flowability of cement paste increased with the W/C ratio, and the adhesiveness of cement paste decreased with the W/C ratio. In the case of the same void between aggregates, the higher the flowability of cement paste, the lower the adhesiveness, and the larger the volume of passing cement paste in unit time, i.e., the higher the grouting rate of cement paste.
The results showed that for the aggregate, the higher the packing density of the aggregate skeleton, the smaller the void between the aggregate, the lower the grouting rate, and the worse the groutability of the aggregate skeleton. For cement paste, the higher the W/C ratio, the shorter the grouting time, and the higher the grouting rate, the better the groutability of cement paste. Therefore, in order to offer the cement paste a high groutability, a relatively high W/C and a relatively low packing density of the aggregate are advocated.

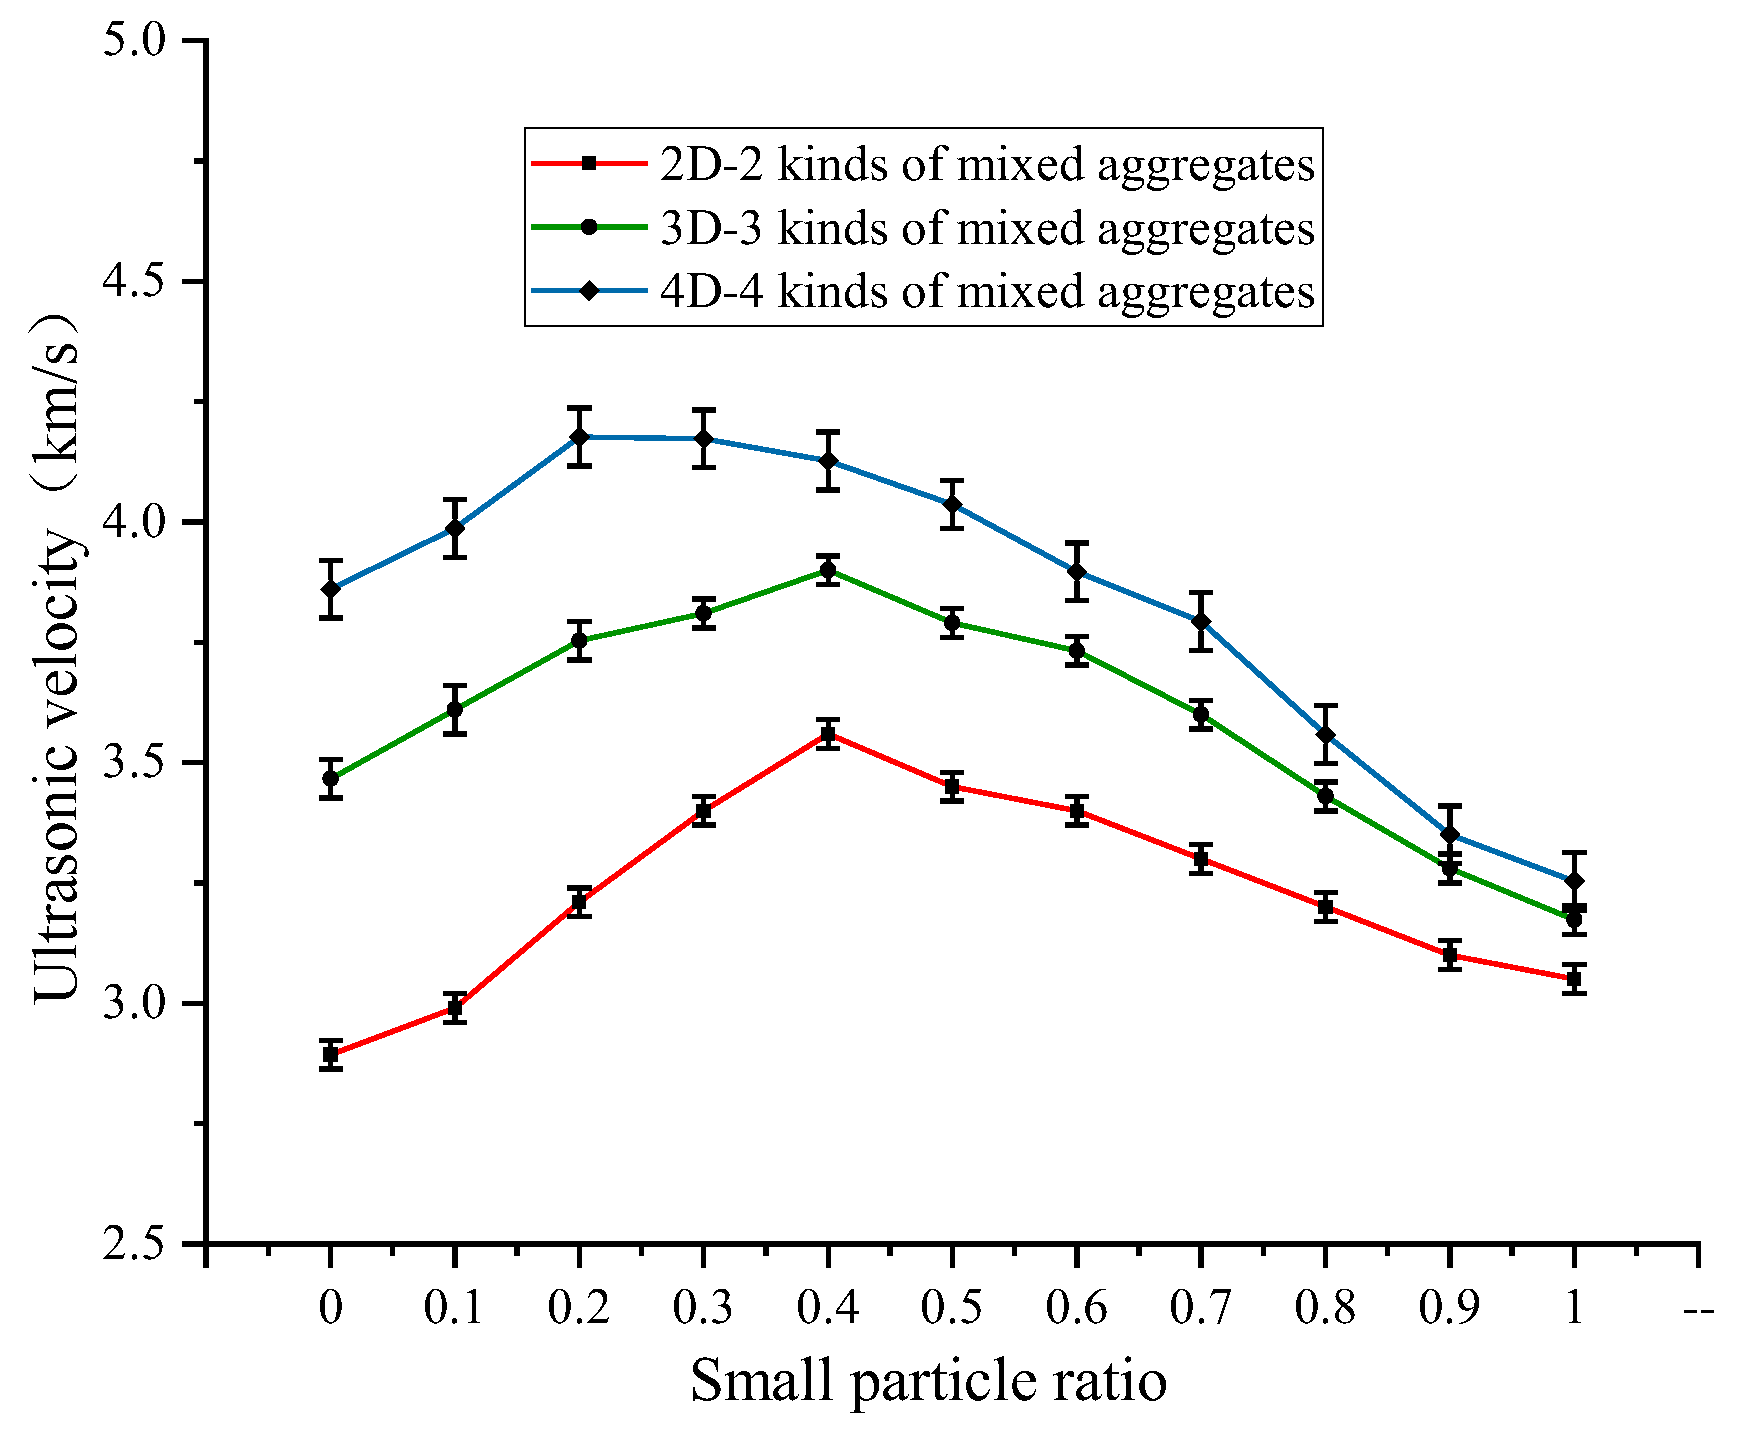
3.4. Ultrasonic Velocity

It can be seen from Figure 12 and Figure 13 that the ultrasonic velocity of concrete adopting the novel casting method depended on the small particle ratio and W/C ratio. The ultrasonic velocity of concrete first increased and then decreased with the small particle ratio. The wider the distribution of aggregate particle size, the higher the ultrasonic velocity. This can be explained by the change in the packing density of aggregate. As shown in Figure 10, the packing density of aggregate first increased and then decreased with the small particle ratio. Therefore, the higher the aggregate packing, the denser the inner structure of concrete [34], and the higher the ultrasonic velocity of concrete. When the particle size of aggregate in concrete remained unchanged, the ultrasonic velocity of concrete decreased with the increase in W/C ratio. This higher W/C ratio increased the water content and, consequently, void content, which resulted in a lower ultrasonic velocity.

3.5. Strength

It can be seen from Figure 14 and Figure 15 that the strength of concrete in the novel casting method was related to the mass proportion of aggregates of different particle sizes and the W/C of cement paste, and the changing trend was almost the same as the ultrasonic velocity of concrete. When the W/C was fixed at 0.30, the concrete strength increased slightly first and then decreased with the increase in the small particle ratio. The strength of the concrete was related to the size distribution of graded aggregates. The wider the size distribution of aggregates, the higher the strength of concrete. As shown in the figure, in the case of only two particle size aggregates (2D) of 15–20 mm and 20–25 mm, the strength of concrete gradually increased with the small particle ratio up to 0.4. and turned to decrease with the further increase in small particle size.
The packing density of aggregates first increased and then decreased, which is in agreement with Matos et al. [35]. In the case of 2D, 3D, and 4D, the maximum packing and highest strength occurred at D4, D3 to D4, and D2 to D3, respectively. The aggregate particle size distribution in 4D was the widest, the overall packing density in 4D was the largest, and the overall strength in 4D was consequently the largest. In the case of 4D, the highest packing density occurred at particle size ranges of 5–10 mm:10–15 mm:15–20 mm:20–25 mm = 0.300:0.280:0.168:0.252. It was found that the highest strength also occurred under this circumstance of particle size ranges. When the proportion of mixed aggregate particle size was unchanged, the strength of concrete decreased with the increase in W/C ratio, and the change of strength was more obvious when the W/C was between 0.25 and 0.40. This decrease in strength could be up to 30%. This is because the larger the W/C ratio, the lower the cement content per unit volume for hydration and the lower the strength. However, in the range of 0.20–0.25, the strength change was not obvious. This was because when the W/C ratio was 0.20, the cement paste had poor groutability and could not completely fill the aggregate skeleton. Since there was a high volume of voids in the concrete, the strength of the concrete at a W/C ratio of 0.20 did not change significantly compared to the counterpart at a W/C ratio of 0.25.

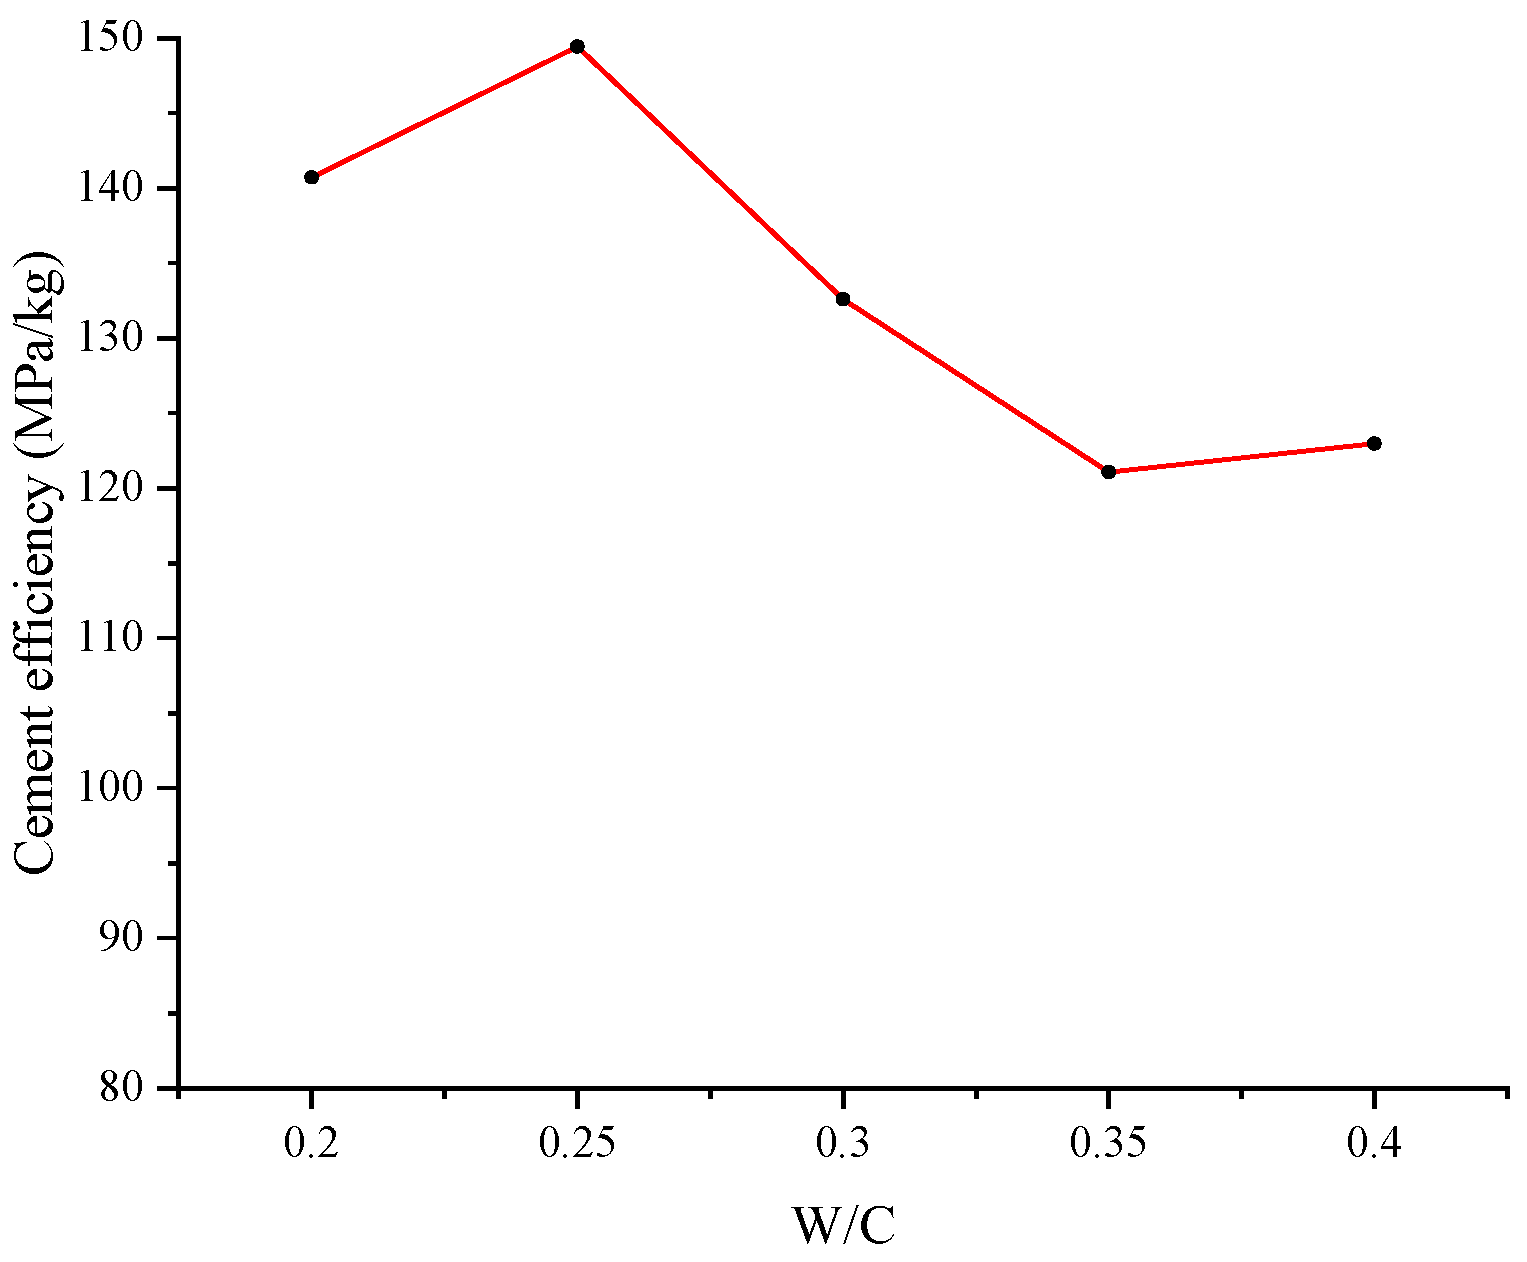
3.6. Cement Efficiency

As shown in Figure 16 and Figure 17, the cement efficiency was related to the aggregate particle size range and the W/C of the cement paste. As can be seen from Figure 16, when the W/C was fixed at 0.30, the cement efficiency increased first and then decreased with the increase in the mass proportion of small-particle sizes. The wider the distribution of the aggregate particle size, the higher the cement efficiency. When there were only two aggregate particle size ranges (2D), the cement efficiency was low and changed relatively insignificantly with the small particle ratio. In the case of 3D, when aggregate with a smaller particle size was added to the optimal 2D aggregate mixes, the packing density increased, and thus, the cement efficiency increased. When the small particle ratio exceeded 0.40, the packing density of aggregate began to decrease, and the strength of concrete also decreased, resulting in a lower cement efficiency.
Similarly, the cement efficiency of 4D first increased and then decreased with the small particle ratio. At the same small particle ratio, the cement efficiency of 4D was always higher than that of 3D, which could be explained by a higher packing density of the aggregate mix. In the case of 4D, the highest cement efficiency occurred at a ratio of particle size ranges 5–10 mm:10–15 mm:15–20 mm:20–25 mm = 0.200:0.320:0.192:0.288. Figure 17 displays the variation of cement efficiency with the W/C ratio in the case of 4D, adopting optimum aggregate size ranges for the highest packing density. Generally, the cement efficiency first increased and then decreased with the W/C ratio. This is because when the W/C ratio was higher than 0.25, the decrease in strength due to a higher W/C ratio was proportionally higher than the decrease in cement content, and therefore, the cement efficiency decreased with the W/C ratio. When the W/C ratio was lower than 0.25, the cement paste was rather dry, and the groutability significantly decreased with the decrease in the W/C ratio. This lower groutability would leave behind a large void volume and result in a low strength. The highest occurred at a W/C ratio of 0.25 and reached 99.5 MPa/kg.

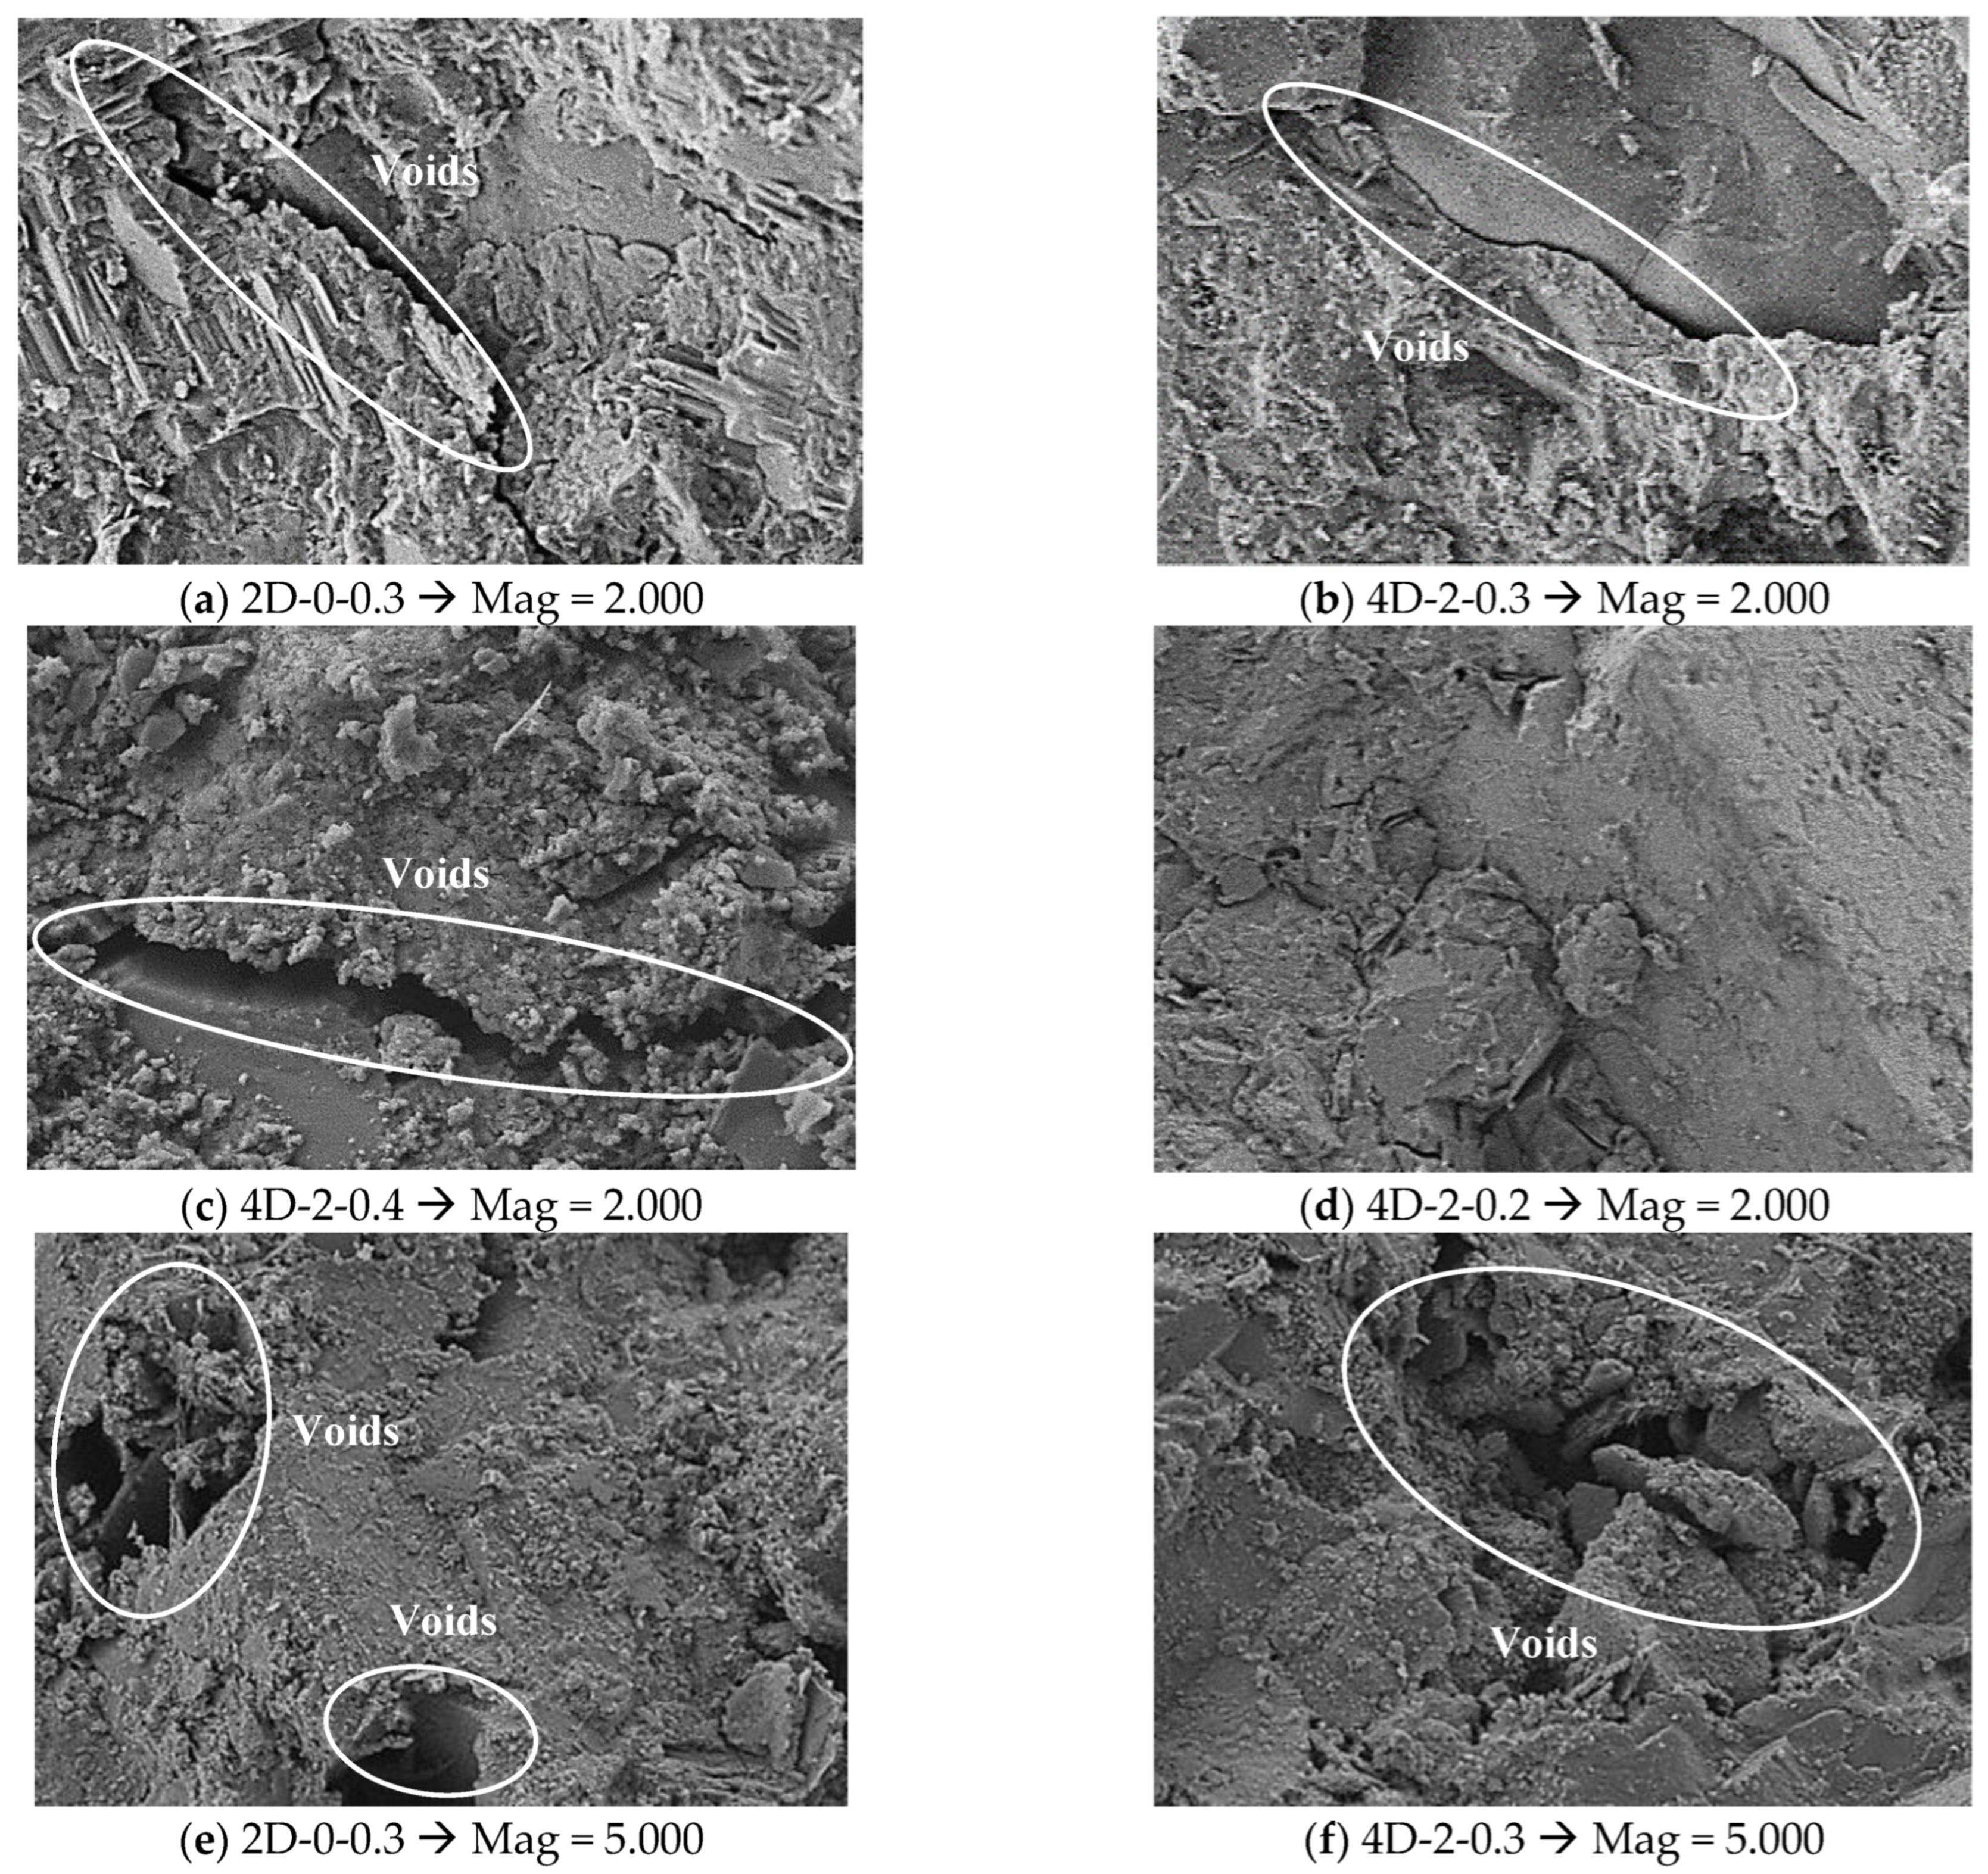
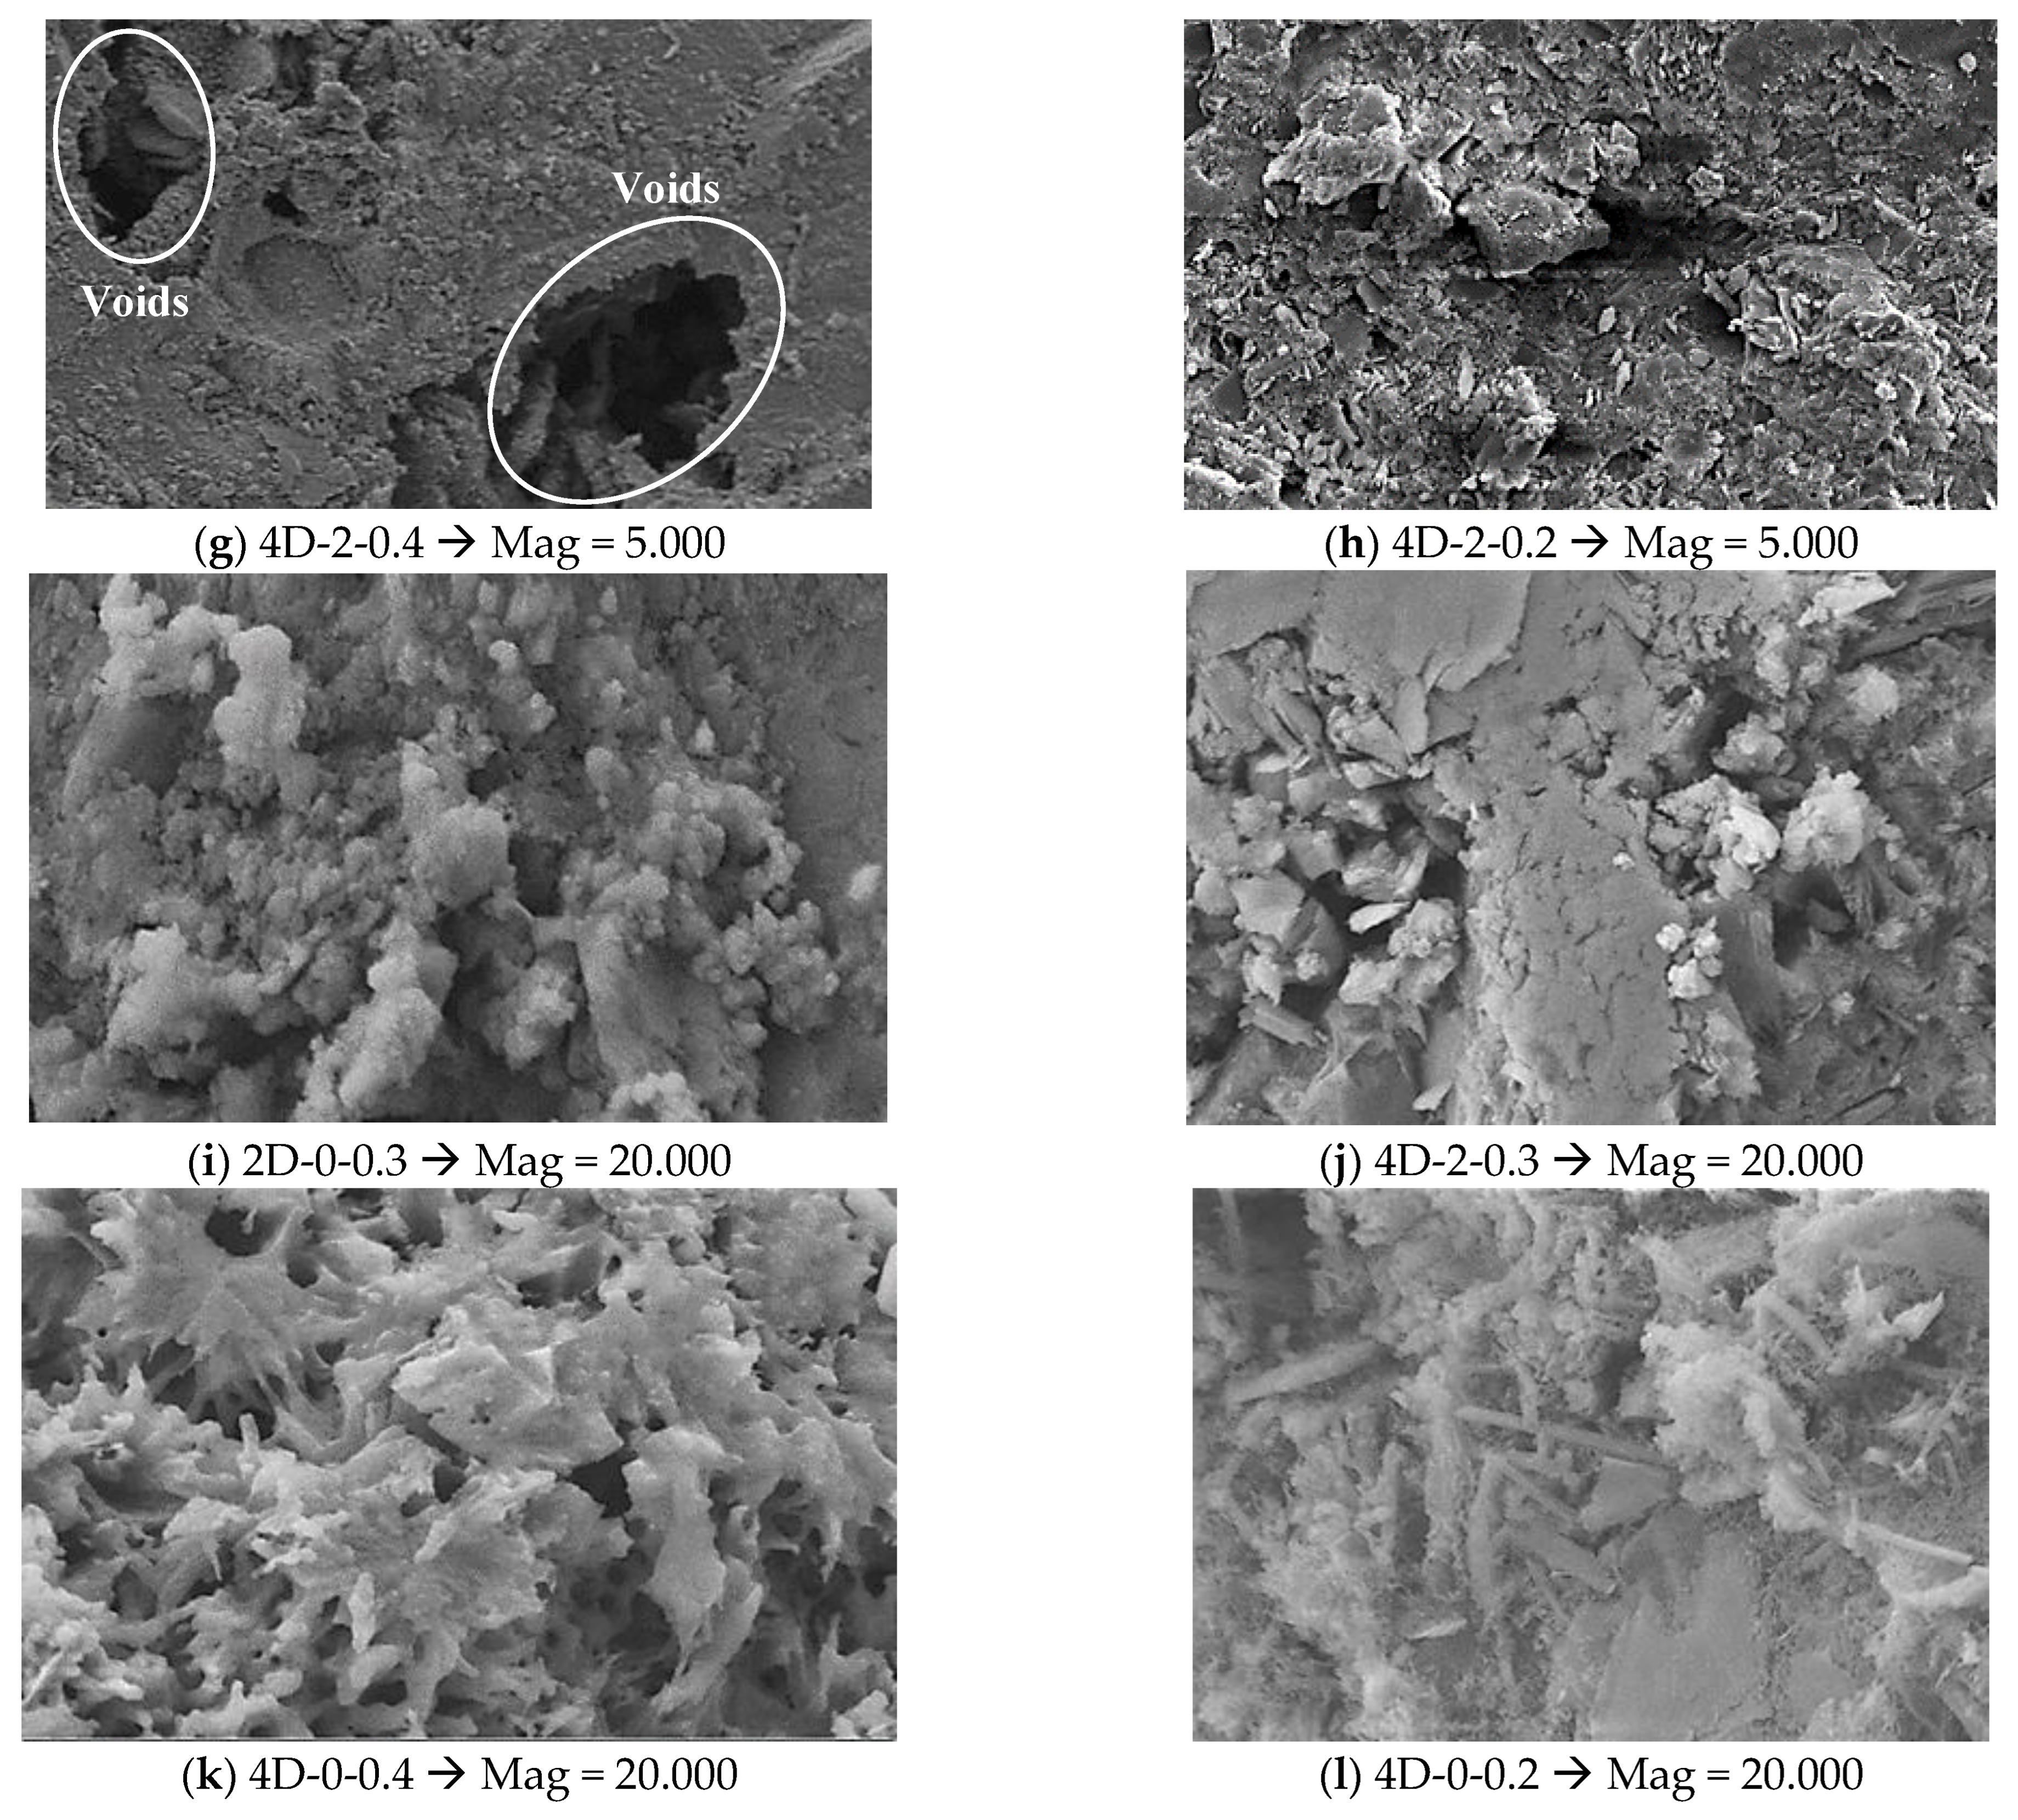
3.7. Scanning Electron Microscope

The concrete mixes with aggregate with the lowest and highest packing density at the same W/C ratio (2D-0-0.3 and 4D-2-0.3) and with the highest packing density at the lowest and highest W/C ratio (4D-2-0.2 and 4D-2-0.4) were selected for SEM observation at 2000, 5000, and 20,000 magnification times. Figure 18a–d show the 2000-times electron microscope photos of the interfacial transition zone between aggregate and cement paste of concrete mixes with different aggregate packing densities. It can be observed from Figure 18c that obvious cracks existed at the interface between aggregate and cement paste of concrete mix with a high W/C ratio. This indicated poor bonding between the cement paste–aggregate transition zone. It can be observed from Figure 18d that the crack of the interface between aggregate and cement of mix with a low W/C ratio was smaller than that of the counterpart with a high W/C ratio. This indicated better bonding between the cement paste–aggregate transition zone. Results demonstrated that the W/C ratio had a great influence on the bonding of cement paste and aggregate. The higher the W/C ratio, the worse the bonding effect. Within the mix parameters covered in this study, the effect of the W/C ratio is more significant than the effect of the packing density of aggregate.
Through 5000 times SEM observation displayed in Figure 18e–h, there were voids and gaps unevenly distributed in the hardened cement paste. Through the 20,000-times SEM observation displayed in Figure 18i–l, the gel-like material C-S-H and voids between C-S-H were found in the interfacial transition zone. At a low W/C ratio, a large amount of C-S-H and a small amount of Ca(OH)2 crystals and AFt crystals were also generated. These flake Ca(OH)2 crystals and acicular ettringite crystals effectively filled the pores of the gel-like products and resulted in a denser microstructure. This filling effect is able to significantly improve the interfacial transition zone. It explained the reason that the strength of concrete increased as the W/C decreased [36].

3.8. Mercury Intrusion Porosimetry

Figure 19 shows the cumulative pore volume and pore size distribution of the PACPC concrete. The pore diameter in the mix was mainly around 100 nm and 100 µm. A higher W/C ratio resulted in larger pore size, which adversely affected the performance of concrete. The calculation results of the total porosity of concrete with different W/C ratios are tabulated in Table 4. Results showed that the total porosity increased with the W/C ratio. An increase in the W/C ratio from 0.2 to 0.3 increased the total porosity from 9.5% to 12.3%; a further increase in the W/C ratio to 0.4 further increased the total porosity to 16.8%.

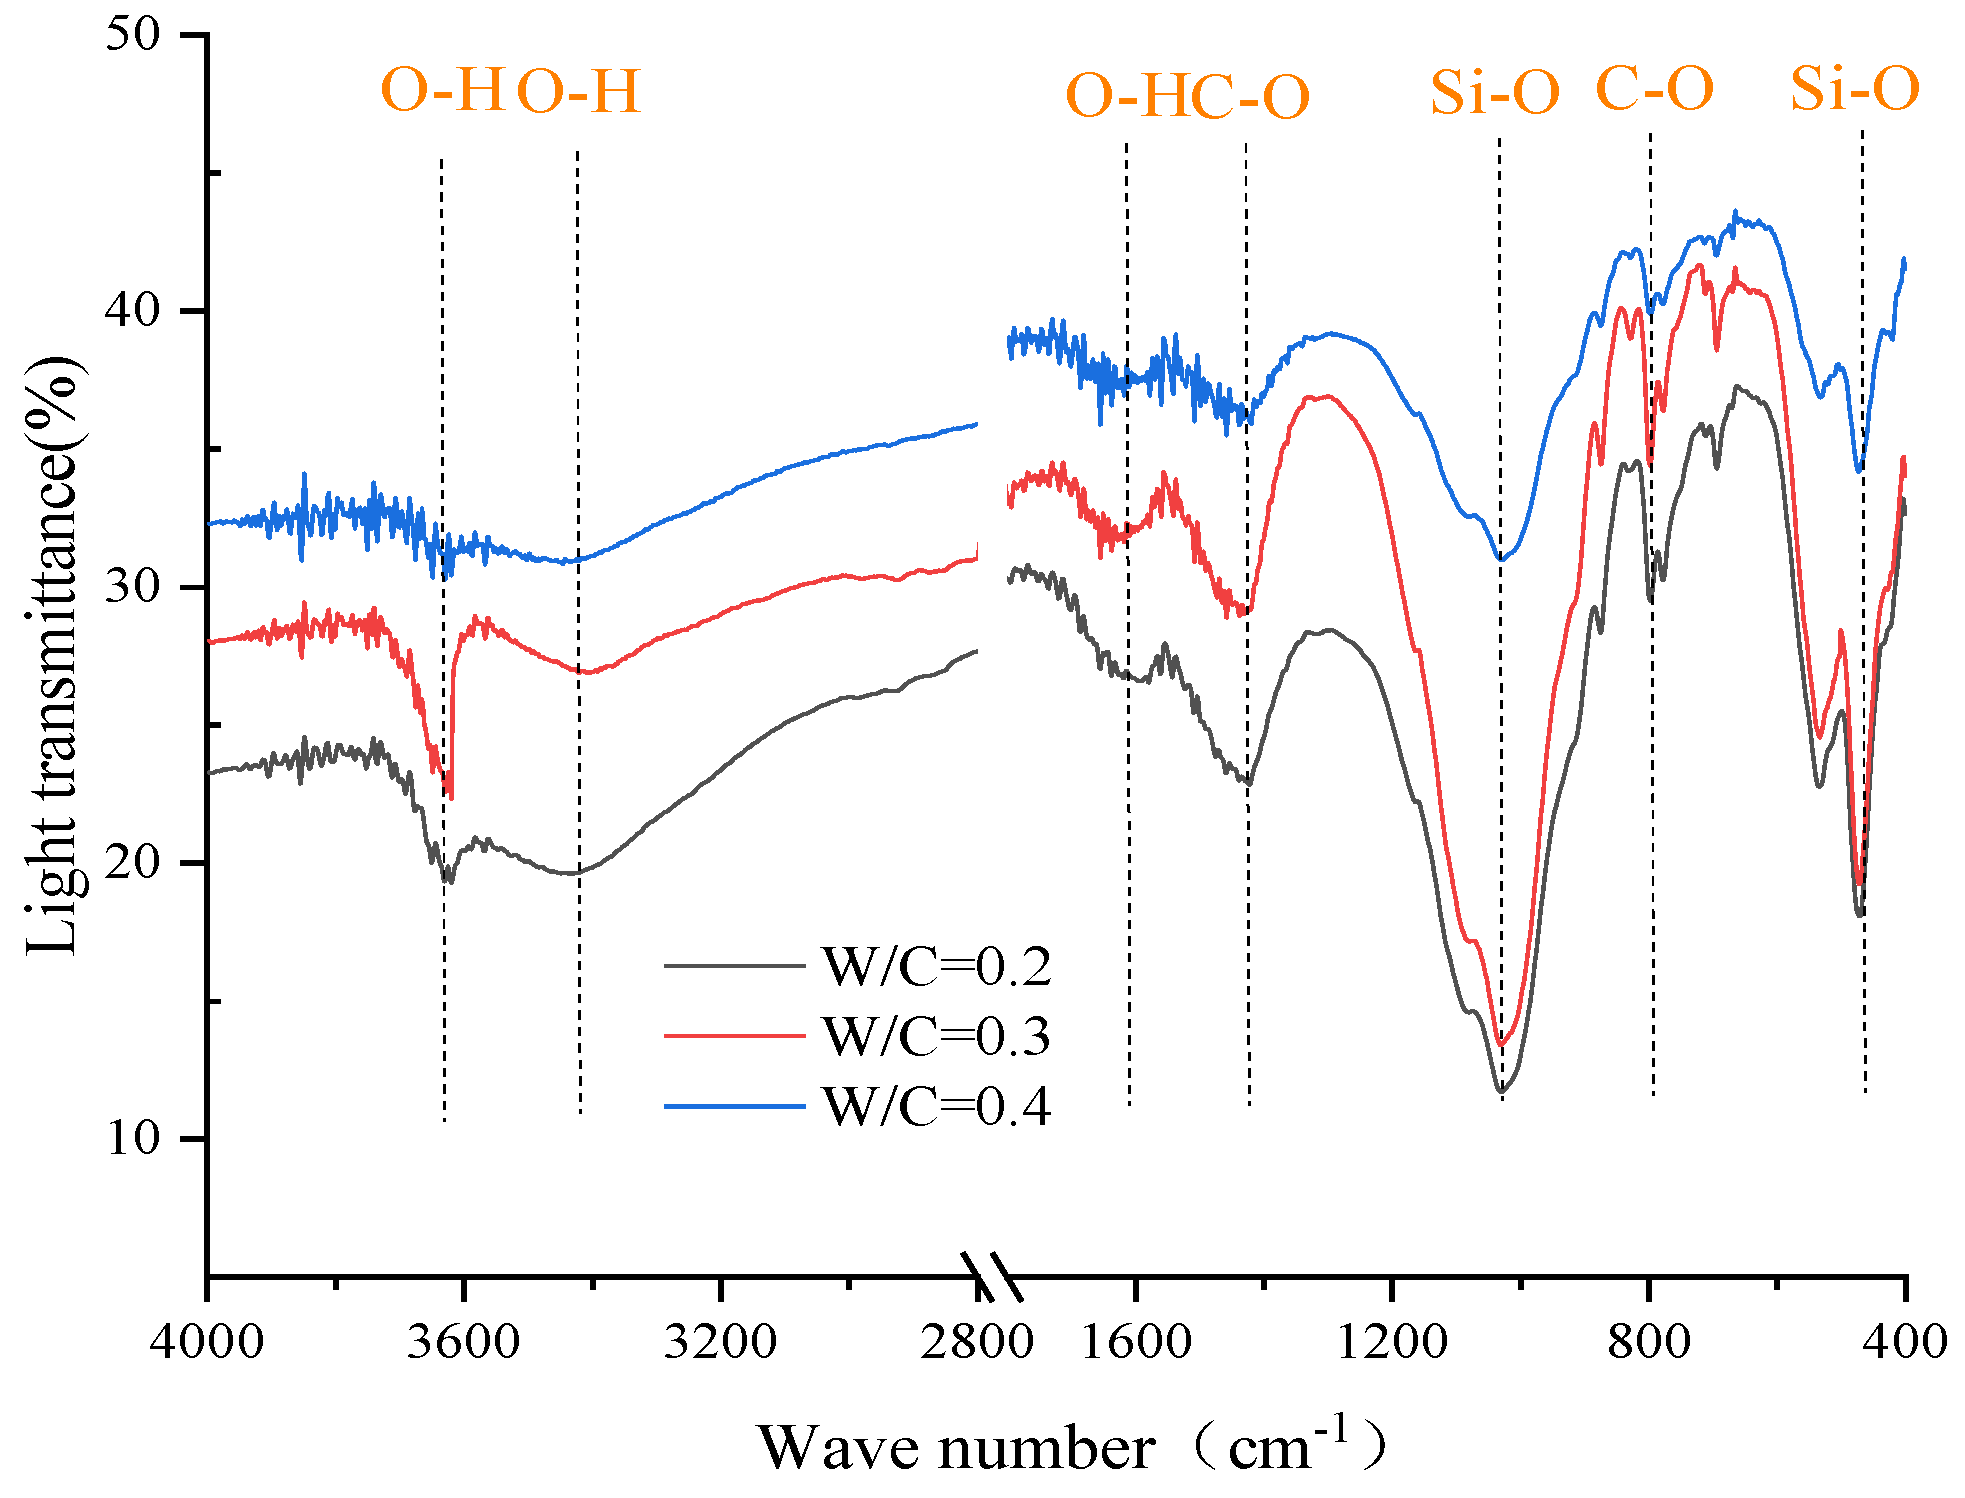
3.9. Fourier Transform Infrared Spectrometer

As is indicated in Figure 20, the wave number corresponding to the characteristic peak of C-S-H gel (Si-O bond), CO32− (C-O bond), C-S-H crystal, and O-H bond of Ca(OH)2 were near 975 cm−1 and 451 cm−1, 1435 cm−1 and 880 cm−1, 3440 cm−1 and 1630 cm−1, and 3640 cm−1 [37], respectively. The results showed that the characteristic peak of C-S-H gel decreased with the W/C ratio. When the W/C was 0.2, the characteristic peak of the C-S-H gel was the strongest. When the ratio of water to cement was 0.4, the characteristic peak of the C-S-H gel was the weakest. An increase in cement content promoted the formation of C-S-H gel, which improved the capillary structure inside the concrete and the bonding between aggregate and cement paste. This explains why the strength and durability properties, such as carbonization resistance, sulfate ion resistance, chloride ion penetration, and drying shrinkage of PACPC concrete, were higher at a low W/C ratio [38].

3.10. Applicability of Results to Preplaced Fiber Concrete

The PACPC concrete is also called two-stage concrete [39] or prepacked concrete [40]. Similar to the casting procedures of PACPC concrete, the preplaced fiber concrete has the fiber preplaced in the mold before cement paste grouting and coating. Therefore, the effects of packing density, which varied through different size distributions of aggregate in this study, on both the fresh and hardened performances are generally applicable to preplaced fiber concrete. It is noteworthy to mention that the grouting of cement paste into preplaced fiber concrete is likely carried out under pressure because preplaced fiber concrete contains a high volume of fibers [41]. With the adoption of pressure, a dense solid skeleton could be applied to preplaced fiber concrete to enhance the compressive and flexural strengths, shear resistance, stiffness, ductility, and energy absorption [42]. It is the authors’ viewpoint that the findings from the PACPC concrete can be generally applied to the preplaced fiber concrete. As the groutability of preplaced fiber concrete is worse than that of PACPC concrete due to the existence of fiber, paste filling under pressure may be necessary to ensure a sufficiently high grouting rate. Further study on the adoption of pressure in paste grouting and coating to PACPC concrete or preplaced fiber concrete with a dense aggregate skeleton is recommended.

4. Conclusions

The effect of coarse aggregate particle size distribution on the groutability, mechanical properties, and cement efficiency of PACPC concrete was studied. Compared to the existing literature, this study carried out a new type of concrete casting method based on the optimization of coarse aggregate size distribution, proposed the concept and method to quantify the groutability of concrete cast by the new method, and adopted an effective utilization rate of cement to compare the sustainability of the concrete cast by a new method and the concrete cast by a traditional method. The influence mechanism was analyzed through macro and micro aspects. The mixes with the highest compressive strength and the highest cement efficiency were obtained. The main findings are summarized as follows:
  • The groutability depended on the aggregate particle size distribution and cement ratio. The wider the particle size distribution of aggregate mix, the higher the packing density, the smaller the void between the aggregate mix, and the worse the groutability of PACPC concrete. Therefore, the groutability first decreased and then increased with the increase in the small particle ratio. The higher the W/C of cement paste, the better the flowability, the worse the adhesiveness, and the better the groutability of PACPC concrete. The maximum grouting rate could be up to 97.5%;
  • Affected by the packing density of aggregate, the strength and ultrasonic velocity of concrete both increased first and then decreased with the increase in the small particle ratio. Moreover, the wider the particle size distribution, the larger the ultrasonic velocity and concrete strength. The maximum increase in strength could be up to 16.7%;
  • The cement efficiency was affected by aggregate particle size distribution and cement ratio. With the increase in small particle ratio and W/C ratio, the cement efficiency first increased and then decreased. The wider the distribution of particle size of aggregate, the higher the cement efficiency. The effective utilization rate of cement could be up to 150 MPa/kg;
  • A high compressive strength of the PACPC concrete did not necessarily mean a high cement efficiency. For the highest compressive strength, the optimum particle size distribution was 5–10 mm:10–15 mm:15–20 mm:20–25 mm = 0.300:0.280:0.168:0.252; for the highest cement efficiency, the optimum particle size distribution was 5–10 mm:10–15 mm:15–20 mm:20–25 mm = 0.200:0.320:0.192:0.288.
For the PACPC concrete, the groutability is inversely related to the strength. Therefore, the engineers should strike a balance between fresh and hardened performance. To achieve high construction feasibility and speed, the packing density of aggregate should be low to provide a path for the penetration of the cement paste; to achieve a high strength, the packing density of aggregate should be high to provide a dense aggregate skeleton. Once both the groutability and strength meet the requirements, a mix with the highest cement efficiency is advocated to meet sustainable development. The findings obtained in this study help to improve the workability, strength, and sustainability of the PACPC, which solves engineering problems such as difficulties in long-distance transportation of concrete, lack of mixing plants in remote areas, difficulty in optimizing aggregate mix, and easy pipe blockage during high-altitude pumping.

Author Contributions

Conceptualization, D.D.; methodology, J.C.; validation, J.C.; formal analysis, J.C.; investigation, J.C.; data curation, D.D.; writing—original draft, J.C. and W.W.; writing—review and editing, J.C. and D.D.; visualization, J.C.; supervision, J.C.; project administration, J.C. and D.D.; funding acquisition, J.C.; software, W.W. All authors have read and agreed to the published version of the manuscript.

Funding

Guangdong Natural Science Foundation (Project Nos. 2022A1515010404 and 2024A1515011894).

Institutional Review Board Statement

Not applicable.

Informed Consent Statement

Not applicable.

Data Availability Statement

The original contributions presented in this study are included in the article. Further inquiries can be directed to the corresponding author.

Conflicts of Interest

The authors declare no conflicts of interest.

References

  1. Wang, Z.; Wu, Y.F. Improvement of mechanical properties of high-volume recycled powder concrete by a novel compression casting method. Constr. Build. Mater. 2025, 458, 139485. [Google Scholar] [CrossRef]
  2. Luo, Y.F.; Liu, L.F.; Peng, C.B.; Shen, R.J. Application of concrete pouring construction technology in building engineering. Chin. Archit. Decor. 2022, 17, 113–115. [Google Scholar]
  3. Alateah, A.H. Graphene concrete: Recent advances in production methods, performance properties, environmental impact and economic viability. Case Stud. Constr. Mater. 2023, 19, e02653. [Google Scholar] [CrossRef]
  4. Wang, Y.J. Causes and Prevention of Waste of Concrete and Cement in Construction. Guangdong Water Resour. Hydropower 2002, 1, 27–28. [Google Scholar]
  5. Chu, S.H. Development of Infilled Cementitious Composites (ICC). Compos. Struct. 2021, 267, 113885. [Google Scholar] [CrossRef]
  6. Troemner, M.; Lale, E.; Cusatis, G. Lattice discrete particle model simulations of energetic size effect and its implications for shear design specifications of reinforced concrete squat walls. Eng. Struct. 2025, 322, 119085. [Google Scholar] [CrossRef]
  7. Wang, R.; Ajalova, A.; Kolan, S.R.; Hoffmann, T.; Chen, K.; Tsotsas, E. Representation of aggregates from their two-dimensional images for primary particles of different sizes. Powder Technol. 2025, 451, 120465. [Google Scholar] [CrossRef]
  8. Liu, H.; Chen, M.; Zhang, Q.; Jiang, X.; Liu, X. A stochastic particle model for aggregate morphology and particle size distributions under coagulation process. Appl. Math. Model. 2025, 138, 115791. [Google Scholar] [CrossRef]
  9. Song, Q.X. Study on Performance of Large Particle Size Discontinuous Graded Hydraulic Asphalt Concrete. Master’s Thesis, Xi’an University of Technology, Xi’an, China, 2022. [Google Scholar]
  10. Wang, Q.; Yang, D.; Chen, D. Study on the mechanical properties of MiC formworks with different material components. Buildings 2023, 13, 2977. [Google Scholar] [CrossRef]
  11. Sun, W.; Guo, Q.; Xu, W.; Lou, T.; Li, H. Novel 3D FRP systems used for casting and reinforcing low-carbon concrete elements. Eng. Struct. 2025, 326, 119590. [Google Scholar] [CrossRef]
  12. Liang, J.C. Research on Concrete Construction Technology in Civil engineering. Heilongjiang Sci. 2022, 13, 36–38. [Google Scholar]
  13. Wang, Y.; Li, J.; Shi, Y. Study on influencing factors of hydraulic engineered cementitious composites layer bonding performance. Materials 2023, 16, 6693. [Google Scholar] [CrossRef]
  14. Zhao, Y.M. Construction technology and management of precast concrete pile Foundation. Brick Tile 2022, 1, 156–157. [Google Scholar]
  15. He, G.X. Analysis of construction technology and quality control strategy of cast-in-place concrete in construction projects. Urban Archit. 2021, 18, 126–128. [Google Scholar]
  16. Liu, J.L. Discussion on concrete pouring construction technology of building engineering. Brick Tile 2021, 6, 198+200. [Google Scholar]
  17. Abbas S, Faisal A, Khan M A, Nehdi M L, Hameed R, Shaukat S, Systematic state-of-the-art review on precast concrete pipes. Results Eng. 2025, 25, 103826. [CrossRef]
  18. Wang, Y.Z.; Xue, S.L.; Wang, Y.; Li, Q.; Liao, Z.F. Application of grouting technology in the treatment of building crack leakage. Urban Build. Space 2022, 29, 325–326. [Google Scholar]
  19. Ye, Z.X. Discussion on grouting technology in building pile foundation construction. Sichuan Build. Mater. 2022, 48, 93–94. [Google Scholar]
  20. Li, J.Z. Analysis of grouting treatment in building civil engineering. Build. Mater. Dev. Orientat. 2022, 20, 34–36. [Google Scholar]
  21. da Silveira Júnior, J.G.; de Moura Cerqueira, K.; de Araújo Moura, R.C.; de Matos, P.R.; Rodriguez, E.D.; de Castro Pessôa, J.R.; Tramontin Souza, M. Influence of time gap on the buildability of cement mixtures designed for 3D printing. Buildings 2024, 14, 1070. [Google Scholar] [CrossRef]
  22. Li, L.; Li, B.; Wang, Z.; Zhang, Z.B.; Alselwi, O. Effects of hybrid PVA–steel fibers on the mechanical performance of high-ductility cementitious composites. Buildings 2022, 12, 1934. [Google Scholar] [CrossRef]
  23. Feng, Y.J. Regional and global impact of russia-ukraine conflict. J. Foreign Aff. Univ. 2022, 39, 72–96+6–7. [Google Scholar]
  24. Kong, Y.K.; Kurumisawa, K.; Chu, S.H. Infilled cementitious composites (ICC)—A comparative life cycle assessment with UHPC. J. Clean. Prod. 2022, 377, 134051. [Google Scholar] [CrossRef]
  25. Kwan AK, H.; Li, Y. Effects of fly ash microsphere on rheology, adhesiveness and strength of mortar. Constr. Build. Mater. 2013, 42, 137–145. [Google Scholar] [CrossRef]
  26. Hernandez, F.; Oteiza, I.; Villanueva, L.D. Experimental analysis of toughness and modulus of rupture increase of sisal short fiber reinforced hemihydrated gypsum. Compos. Struct. 1992, 22, 123–137. [Google Scholar] [CrossRef]
  27. Razavi, O.; Vajargah, A.K.; Oort, E.; Aldin, M.; Govindarajan, S. Optimum particle size distribution design for lost circulation control and wellbore strengthening. J. Nat. Gas Sci. Eng. 2016, 35, 836–850. [Google Scholar] [CrossRef]
  28. Bouzar, B.; Mamindy-Pajany, Y. Manufacture and characterization of carbonated lightweight aggregates from waste paper fly ash. Powder Technol. 2022, 406, 117583. [Google Scholar] [CrossRef]
  29. Lim, Y.K.; Kim, Y.K.; Yune, C.Y.; Lee, S.W. A study on the optimum particle size distribution of the drainable base in mountain road for the prevention of the pavement damage by uplift seepage pressure. Int. J. Eng. 2011, 13, 21–29. [Google Scholar]
  30. Fuller, W.B.; Thompson, S.E. The laws of proportioning concrete. Trans. Am. Soc. Civ. Eng. 1907, 59, 67–143. [Google Scholar] [CrossRef]
  31. Iman, M.; Kamal, H.K. Effect of particle-size distribution and specific surface area of different binder systems on packing density and flow characteristics of cement paste. Cem. Concr. Compos. 2017, 78, 120–131. [Google Scholar]
  32. Funk, J.E.; Dinger, D.R. Predictive Process Control of Crowded Particulate Suspensions; Springer: Boston, MA, USA, 2013. [Google Scholar]
  33. Husken, G.; Brouwers, H.J.H. A new mix design concept for earth-moist concrete: A theoretical and experimental study. Cem. Concr. Res. 2008, 38, 1246–1259. [Google Scholar] [CrossRef]
  34. Sun, X.; Xu, H.; Zheng, X.; Qin, X.; Guo, T.; Gao, J. Microscopic effect and mechanism of spray polyurea modifier on the asphalt binder: Experimental characterization and molecular dynamics simulations. Polymer 2024, 316, 127807. [Google Scholar] [CrossRef]
  35. Matos, P.R.; Sakata, R.D.; Gleize PJ, P.; Brito, J.D.; Repette, W.L. Eco-friendly ultra-high performance cement pastes produced with quarry wastes as alternative fillers. J. Clean. Prod. 2020, 269, 122308. [Google Scholar] [CrossRef]
  36. Liu, C.H.; Chen, J.J. High temperature degradation mechanism of concrete with plastering layer. Materials 2022, 15, 398. [Google Scholar] [CrossRef]
  37. Zheng, S.B.; Chen, J.J.; Guan, X.Z. Effects of fines content on durability of high-strength manufactured sand concrete. Materials 2023, 16, 522. [Google Scholar] [CrossRef]
  38. Qureshi, H.J.; Alyami, M.; Nawaz, R.; Hakeem, I.Y.; Aslam, F.; Iftikhar, B.; Gamil, Y. Prediction of compressive strength of two-stage (preplaced aggregate) concrete using gene expression programming and random forest. Case Stud. Constr. Mater. 2023, 19, 02581. [Google Scholar] [CrossRef]
  39. Ichino, H.; Kuwahara, N.; Beppu, M.; Williamson, E.B.; Himi, A. Effects of the shape, size, and surface roughness of glass coarse aggregate on the mechanical properties of two-stage concrete. Constr. Build. Mater. 2024, 411, 134296. [Google Scholar] [CrossRef]
  40. Kaplan, G.; Öz, A.; Bayrak, B.; Aydın, A.C. The effect of geopolymer slurries with clinker aggregates and marble waste powder on embodied energy and high-temperature resistance in prepacked concrete: ANFIS-based prediction model. J. Build. Eng. 2023, 67, 105987. [Google Scholar] [CrossRef]
  41. Yas, M.H.; Kadhum, M.M.; Al-Dhufairi WG, B. Development of an engineered slurry-infiltrated fibrous concrete: Experimental and modelling approaches. Infrastructures 2023, 8, 19. [Google Scholar] [CrossRef]
  42. Murali, G.; Abid, S.R.; Amran, M.; Vatin, N.I.; Fediuk, R. Drop weight impact test on prepacked aggregate fibrous concrete-an experimental study. Materials 2022, 15, 3096. [Google Scholar] [CrossRef]
Figure 1. Photos showing the process of the novel casting method.
Coatings 15 00200 g001
Figure 2. SEM image of cement particles.
Coatings 15 00200 g002
Figure 3. Variation of the packing density of aggregate without vibration with a small particle ratio.
Coatings 15 00200 g003
Figure 4. Variation of packing density of aggregate with vibration with small particle ratio.
Coatings 15 00200 g004
Figure 5. Two optimal particle size distribution curves.
Coatings 15 00200 g005
Figure 6. Time reaching 25 cm radius at varying W/C ratios.
Coatings 15 00200 g006
Figure 7. Cement paste adhesiveness at varying W/C ratios.
Coatings 15 00200 g007
Figure 8. Cement paste flow time at varying W/C ratios.
Coatings 15 00200 g008
Figure 9. Cement paste density at varying W/C ratios.
Coatings 15 00200 g009
Figure 10. Grouting rate with small particle ratio.
Coatings 15 00200 g010
Figure 11. Grouting rate at varying W/C ratios.
Coatings 15 00200 g011
Figure 12. Ultrasonic velocity with small particle ratio.
Coatings 15 00200 g012
Figure 13. Ultrasonic velocity at varying W/C ratios.
Coatings 15 00200 g013
Figure 14. Compressive strength with a small particle ratio.
Coatings 15 00200 g014
Figure 15. Compressive strength at varying W/C ratios.
Coatings 15 00200 g015
Figure 16. Cement efficiency with a small particle ratio.
Coatings 15 00200 g016
Figure 17. Cement efficiency with W/C ratio.
Coatings 15 00200 g017
Figure 18. SEM images of concrete mix.
Coatings 15 00200 g018aCoatings 15 00200 g018b
Figure 19. Pore condition of PACPC concrete.
Coatings 15 00200 g019
Figure 20. FTIR test results of preset aggregate grout concrete with different W/C ratios.
Coatings 15 00200 g020
Table 1. Basic physical and chemical properties of cement.
Water for Standard Consistency
/%
Specific Surface Area
/m2/kg
Setting Time
/min
Flexural Strength
/MPa
Compressive Strength
/MPa
Initial SettingFinal
Setting
3 d28 d3 d28 d
2732045600≥4≥6.5≥22.0≥42.5
Table 2. Main chemical composition of cement.
Chemical Composition (%)CaOSiO2MgOAl2O3Fe2O3K2OLOINa2OOther
cement60.2024.533.325.013.850.281.850.170.79
Table 3. Concrete mix design.
W/C
Ratio
n Aggregate Size nD5–10 mm Coarse
Aggregate (kg/m3)
10–15 mm Coarse
Aggregate (kg/m3)
15–20 mm Coarse
Aggregate (kg/m3)
20–25 mm Coarse
Aggregate (kg/m3)
Cement
(kg/m3)
Water
(kg/m3)
Water Reducer
(kg/m3)
0.302D00.00.00.01660.6636.1190.86.4
2D10.00.0166.11494.5627.2188.26.3
2D20.00.0332.11328.4625.5187.66.3
2D30.00.0498.21162.4623.1186.96.2
2D40.00.0664.2996.3620.1186.06.2
2D50.00.0830.3830.3621.3186.46.2
2D60.00.0996.3664.2623.7187.16.2
2D70.00.01162.4498.2626.0187.86.3
2D80.00.01328.4332.1626.0187.86.3
2D90.00.01494.5166.1627.2188.26.3
2D100.00.01660.60.0628.4188.56.3
0.303D00.00.0664.2996.3620.1186.06.2
3D10.0166.1597.8896.7614.1184.26.1
3D20.0332.1531.4797.1601.4180.46.0
3D30.0498.2465.0697.4587.1176.15.9
3D40.0664.2398.5597.8583.0174.95.8
3D50.0830.3332.1498.2587.8176.35.9
3D60.0996.3265.7398.5594.1178.25.9
3D70.01162.4199.3298.9599.2179.86.0
3D80.01328.4132.8199.3605.4181.66.1
3D90.01494.566.499.6610.3183.16.1
3D100.01660.60.00.0614.9184.56.1
0.304D00.0664.2398.5597.8583.0174.95.8
4D1166.1597.8358.7538.0555.2166.65.6
4D2332.1531.4318.8478.2544.7163.45.4
4D3498.2465.0279.0418.5545.0163.55.5
4D4664.2398.5239.1358.7546.6164.05.5
4D5830.3332.1199.3298.9550.1165.05.5
4D6996.3265.7159.4239.1554.5166.35.5
4D71162.4199.3119.6179.3558.9167.75.6
4D81328.4132.879.7 119.6566.7170.05.7
4D91494.566.439.959.8575.9172.85.8
4D101660.60.00.00.0586.5176.05.9
0.204D2332.1531.4318.8478.2630.0126.06.3
0.254D2332.1531.4318.8478.2587.8146.95.9
0.304D2332.1531.4318.8478.2544.7163.45.4
0.354D2332.1531.4318.8478.2498.2174.45.0
0.404D2332.1531.4318.8478.2471.1188.44.7
Table 4. Total porosity of grouting concrete with different W/C ratios.
W/C0.20.30.4
Total porosity of concrete (%)9.512.316.8
Disclaimer/Publisher’s Note: The statements, opinions and data contained in all publications are solely those of the individual author(s) and contributor(s) and not of MDPI and/or the editor(s). MDPI and/or the editor(s) disclaim responsibility for any injury to people or property resulting from any ideas, methods, instructions or products referred to in the content.

