Article

Research on the Weakening Process at the Interface of Bonded-Layer Composite Structures Using Ultrasonic Longitudinal Waves

1
School of Mechanical and Electronic Engineering, Jingdezhen Ceramic University, Jingdezhen 333403, China
2
Jiangxi Changxing Aviation Equipment Co., Ltd., Jingdezhen 333403, China
*
Author to whom correspondence should be addressed.
Coatings 2025, 15(2), 151; https://doi.org/10.3390/coatings15020151
Submission received: 14 January 2025 / Revised: 27 January 2025 / Accepted: 28 January 2025 / Published: 30 January 2025

Abstract

:
The interface weakening process of bonded-layer composite structures is calculated, simulated, and experimentally investigated using ultrasonic longitudinal waves. Firstly, the reflection coefficients of echoes are calculated theoretically. Subsequently, a time-domain simulation model of bonded-layer composite structures is established. The propagation law of ultrasonic waves in bonded-layer composite structures is obtained. The relationship between different bonding interface states and the ultrasonic reflection characteristics are investigated through ultrasonic experiments on bonded composite structures. The theoretical calculation, simulation, and experimental results are as follows: when the bonding strength of the bonding layer changes from weak to strong, the amplitude of the first echo gradually decreases, the amplitude of the second echo progressively increases, and the amplitude of the third echo is basically unchanged; when the bonding strength of the upper interface changes from weak to strong, the amplitudes of the first and the second echoes are same as in the previous variation whereas the amplitude of the third echo slightly increases; when the bonding strength of the lower interface changes from weak to strong, the amplitudes of the first and the third echoes remain essentially unchanged, but the amplitude of the second echo progressively increases in the experiment compared with the theoretical calculation and simulation. In addition, the time of the first echo remains broadly unchanged, and the times of the second and the third echoes gradually decrease under all conditions.

1. Introduction

Composite structural materials have the advantages of a uniform interfacial stress distribution, reduced fatigue strength in their structural components, and the ability to prevent the galvanic corrosion of metals [1,2,3,4]. They have been widely used in aerospace, the automotive industry, precision instruments [5,6,7], and other fields. Most composite materials are bonded by adhesives, and the performance of these adhesives has an important influence on the bonding interface of composite materials. With an increase in the service time of the bonded layer, the bonding interface of the bonded layer becomes prone to fatigue aging [8], poor adhesion [9], porosity [10], local debonding [11], and other defects, which seriously affect the integrity of the bonded-layer composite structures [12] as well as their mechanical properties [13,14]. Therefore, it is of great significance to carry out non-destructive testing and assessments of the quality of bonded layers [15,16]. In this paper, the composite structures of EPDM and carbon fiber bonded by an epoxy resin are taken as the research object. This structure is mainly used for manufacturing structural components of aircraft and spacecraft; not only can it improve the performance of the structural components, but it can also enhance the overall performance and safety of aircraft and spacecraft.
Scholars have used a variety of computational, simulation, and experimental ultrasonic research methods to explore the interfacial properties of bonded-layer composite structures. In terms of computation and simulation, a transfer matrix method was proposed to deal with multilayer structures [17]. The reflection coefficient equation used to study multilayer bonded structures was derived by using the improved global matrix method, while the correlation between the reflection coefficient and the bond strength of multilayer bonded structures at different frequencies and incidence angles was simulated using the ultrasonic oblique incidence method [18]. Qiu et al. [19] employed the vertical incidence method to theoretically explore the interdependence between the reflection and transmission coefficients of the interface of a bonded structure, as well as the resonance frequency. The longitudinal wave reflection coefficient and transmission coefficient, based on the transfer matrix method, were also derived, and the influence of the incident angle and frequency on the longitudinal wave reflection and transmission characteristics was analyzed by comparing the calculated results with the experimental data [20]. Kumar et al. [21] used the transfer matrix method to verify the link between adhesive strength and interface failure; after that, the possibility of evaluating adhesive strength based on the amplitude of the reflection signal and the shift in the resonance peak in the reflection spectrum was determined through a comparison with the theoretical results. A time-domain simulation model of composite material bonding structures with thick adhesive layers was established using the non-contact ultrasonic reflection method in underwater immersion conditions. The regular offset characteristics between the weakened state of the bonding interface and the reflection characteristics were revealed through a comparison with the experimental results [22].
In summary, research on the bonding characteristics of composites has focused on the weakening process of the bonding layer, not the interface weakening process. However, in practical applications the debonding of the adhesive usually occurs at the interface rather than in the body. Therefore, not only the bonding layer weakening but also the interface weakening needs to be taken into account to evaluate the bonding quality of the composite material. In this paper, the composite structures of EPDM and carbon fibers bonded by epoxy resin are taken as the research object. The vertical reflection method is adopted to theoretically calculate, simulate, and experimentally analyze the composite structure of the bonding layer to study the propagation characteristics of ultrasonic waves. In the theoretical calculation, the echo reflection coefficient is derived from the equations used to determine the ultrasonic reflection coefficient and transmission coefficient. In the simulation, a connected layer is introduced between the bonding layer and the composite material to represent the interface. The elasticity modulus of the connected layer is changed to simulate the interface weakening process. In the experiment, a connected layer, which is a thin epoxy resin, is introduced to the upper or lower surface of the cured bonding layer. The curing process of the connected layer is detected to replace the weakening process of the interface in reverse.

2. Theoretical Calculation of Ultrasonic Wave Propagation

2.1. Theoretical Calculation Model

The propagation paths of ultrasonic waves in bonded-layer composite structures are illustrated in Figure 1. The ultrasonic waves are vertically incident in the form of plane waves, propagating downwards perpendicularly from the carbon fiber layer. When the ultrasonic waves reach the interfaces connecting different layers, due to the differences in acoustic impedance between the media, the ultrasonic wave is reflected and transmitted at the interfaces. Echo A is from the lower interface of carbon fiber, echo B is from the lower interface of epoxy resin, echo C is from the lower interface of EPDM, and echo D is from the lower interface of connected layer. Pim and Prm (m = 1, 2, 3) represent the incident amplitudes and sound pressure echoes in the m-th layer medium, respectively. Prmn denotes the amplitude of the sound pressure of the echo originating from the m-th layer and incident into the n-th layer (m = 1, 2, 3, 4; n = 1, 2, 3). Throughout the entire process, the scattering and absorption attenuation of the ultrasonic waves were not considered. Since the lower interface of the EPDM is air and the acoustic impedance of the air is close to 0, the ultrasonic wave undergoes total reflection at the lower interface of EPDM, i.e., Pi3 = Pr3 and Pi4 = Pr4.

2.2. Theoretical Calculation Derivation

The velocity of longitudinal waves in an isotropic homogeneous medium is expressed as follows [23]:
C L = ( 1 ν ) E ( 1 + ν ) ( 1 2 ν ) ρ
where E is the elastic modulus of the solid medium, ρ is the density, ν is the Poisson’s ratio, and CL is the longitudinal wave velocity. As can be seen from Equation (1), the paper assumes that both ρ and ν remain unchanged during the curing process of the adhesive.
According to the equations for the reflection coefficient and transmission coefficient [24], the acoustic impedance Z is positively correlated with the elastic modulus E. In the bonding layer strengthening process, the reflection coefficient of echoes A, B, and C can be calculated as follows:
r 1 1 = P r 1 P i 1 = Z 2 Z 1 Z 2 1 + Z 1 r 2 1 = P r 21 P i 1 = P r 21 P r 2 P r 2 P i 2 P i 2 P i 1 = 2 Z 1 Z 2 + Z 1 Z 3 1 Z 2 Z 3 1 + Z 2 2 Z 2 Z 2 + Z 1 r 3 1 = P r 31 P i 1 = P r 31 P r 32 P r 32 P r 3 P r 3 P i 3 P i 3 P i 2 P i 2 P i 1 = 2 Z 1 Z 2 + Z 1 2 Z 2 Z 3 1 + Z 2 2 Z 3 1 Z 3 1 + Z 2 2 Z 2 Z 2 + Z 1
where r11, r21, and r31 represent the reflection coefficient of echoes A, B, and C, respectively; Z1 is the acoustic impedance of the carbon fiber; Z2 is the acoustic impedance of the bonding layer; Z3 is the acoustic impedance of the EPDM.
Over the course of the upper interface weakening process, the reflection coefficient of echoes A, B, C and D can be deduced as follows:
r 1 2 = P r 1 P i 1 = Z 2 2 Z 1 Z 2 2 + Z 1 r 2 2 = P r 21 P i 1 = 2 Z 1 Z 2 2 + Z 1 Z 3 2 Z 2 2 Z 3 2 + Z 2 2 2 Z 2 2 Z 2 2 + Z 1 r 3 2 = P r 31 P i 1 = 2 Z 1 Z 2 2 + Z 1 2 Z 2 2 Z 3 2 + Z 2 2 Z 4 Z 3 2 Z 4 + Z 3 2 2 Z 3 2 Z 3 2 + Z 2 2 2 Z 2 2 Z 2 2 + Z 1 r 4 2 = P r 41 P i 1 = 2 Z 1 Z 2 2 + Z 1 2 Z 2 2 Z 3 2 + Z 2 2 2 Z 3 2 Z 4 + Z 3 2 2 Z 4 Z 4 + Z 3 2 2 Z 3 2 Z 3 2 + Z 2 2 2 Z 2 2 Z 2 2 + Z 1
where r12, r22, r32, and r42 represent the reflection coefficient of echoes A, B, C, and D, respectively; Z22 is the acoustic impedance of connected layer 1; Z32 is the acoustic impedance of the bonding layer; Z4 is the acoustic impedance of the EPDM.
During the lower interface weakening process, the reflection coefficient of echoes A, B, C, and D can be derived as follows:
r 1 3 = P r 1 P i 1 = Z 2 Z 1 Z 2 + Z 1 r 2 3 = P r 21 P i 1 = 2 Z 1 Z 2 + Z 1 Z 3 3 Z 2 Z 3 3 + Z 2 2 Z 2 Z 2 + Z 1 r 3 3 = P r 31 P i 1 = 2 Z 1 Z 2 + Z 1 2 Z 2 Z 3 3 + Z 2 Z 4 Z 3 3 Z 4 + Z 3 3 2 Z 3 3 Z 3 3 + Z 2 2 Z 2 Z 2 + Z 1 r 4 3 = P r 41 P i 1 = 2 Z 1 Z 2 + Z 1 2 Z 2 Z 3 3 + Z 2 2 Z 3 3 Z 4 + Z 3 3 2 Z 4 Z 4 + Z 3 3 2 Z 3 3 Z 3 3 + Z 2 2 Z 2 Z 2 + Z 1
where r13, r23, r33, and r43 represent the reflection coefficient of echoes A, B, C, and D; Z33 is the acoustic impedance of connected layer 2.

2.3. Theoretical Calculation Results and Analysis

The echo reflection coefficient curves for the duration of the body-strengthening process are shown in Figure 2a. As the bonding layer was strengthened, its elastic modulus E increased, which led to an increase in the longitudinal wave velocity, and the acoustic impedance also increased. Therefore, the acoustic impedance Z2 of the bonding layer gradually increased, but the acoustic impedance Z1 of the carbon fiber was always constant. However, the acoustic impedance of the bonding layer when it was fully cured was lower than that of the carbon fiber. The acoustic impedance Z1 of the carbon fiber was 4.245 g/cm2s, and the acoustic impedance Z2 of the bonding layer when it is fully cured was 3.186 g/cm2s. Thus, with an increase in the elastic modulus E, the differences between the acoustic impedance of the bonding layer and that of the carbon fiber diminished, resulting in a decrease in the reflection coefficient of echo A. It can be seen that as the elastic modulus E increased, the reflection coefficient of echo B also increased, as shown to the calculation results of r21 in Equation (2). It is evident that the reflection coefficient of echo C underwent insignificant variation when considering r31 in Equation (2).
The echo reflection coefficient curves of the upper interface weakening process are depicted in Figure 2b. When the elastic modulus E of connected layer 1 increased, the absolute difference in acoustic impedance between it and the carbon fiber diminished, leading to a decrease in the reflection coefficient of echo A. In light of the calculation results of Equation (3), as the elastic modulus E increased, the reflection coefficient of echo B also increased and the reflection coefficient of echo C increased. However, the reflection coefficient of echo D gradually decreased.
Figure 2c illustrates the echo reflection coefficient curves during the lower interface weakening process. The acoustic impedance of the carbon fiber and that of the bonding layer remained constant. From r13 in Equation (2), it can be inferred that the reflection coefficient of echo A remained unchanged. In light of r23, r33, and r43 in Equation (4), it can be observed that as the elastic modulus E of connected layer 2 increased, the reflection coefficient of echo B progressively declined, while the change in the reflection coefficient of echo C was minimal. Conversely, the reflection coefficient of echo D correspondingly increased.
The reflection coefficient curves of echo A under different conditions are shown in Figure 3a. It can be observed that the reflection coefficients of echo A during the bonding layer strengthening process and the upper interface weakening process exhibit similar trends, decreasing as the elastic modulus rises. In contrast, the reflection coefficient of echo A remained largely unchanged during the lower interface weakening process. When the elastic modulus increased to 6 GPa, the reflection coefficients of all three cases converged. The initial elastic moduli on either side of the interface, which generate echo A, are identical and changed consistently during the bonding layer strengthening process and the weakening process of the upper interface. Equation Z2 = Z22 can be obtained from this information. Furthermore, Z1 remained unchanged; therefore equation r11 = r12 can be obtained from Equations (2) and (3), i.e., the reflection coefficient curves of echo A during the two processes are the same. During the lower interface weakening process, the elastic moduli of the materials on both sides of the interface for echo A remained constant, resulting in no change in Z1 and Z2. Hence, a constant reflection coefficient for echo A is displayed, which is calculated by r13 in Equation (4). When the elastic modulus reached 6 GPa, equation Z2 = Z22 could be acquired, meaning that r11, r12, and r13 are equivalent, which explains why the reflection coefficients of the three processes are identical.
Figure 3b displays the reflection coefficient curves of echo B under various conditions. It can be seen that the reflection coefficients of echo B increased as the elastic modulus E increased during the bonding layer strengthening process and the upper interface weakening process. Conversely, during the lower interface weakening process, the reflection coefficient of echo B gradually decreased. This is because the acoustic impedance Z2 increased with the increase in elastic modulus E during the bonding layer strengthening process. Similarly, in the upper interface weakening process, the acoustic impedance Z22 of connected layer 1 also showed the same variation as Z2, which led to a gradual increase in the reflection coefficient of echo B, as indicated by r21 and r32. Nevertheless, the reflection coefficient of echo B gradually declined during the lower interface weakening process, as shown by r33.
The reflection coefficient curves of echo C under different conditions are depicted in Figure 3c. It is evident that the reflection coefficients of echo C reveal minor variations in the bonding layer strengthening process and lower interface weakening process. In contrast, the reflection coefficient of echo C significantly increased with the increase in elastic modulus during the upper interface weakening process, and all three reflection coefficients converged when the elastic modulus reached 6 GPa. This is because the acoustic impedance Z2 of the bonding layer and the acoustic impedance Z33 of connected layer 2 both tend to increase with the elastic modulus. According to r31 in Equation (2) and r43 in Equation (4), these changes resulted in minimal alterations in the reflection coefficient of echo C. However, on the basis of r42 in Equation (3), the reflection coefficient of echo C observably increased with the augmentation of acoustic impedance Z32 during the upper interface weakening process. When the elastic modulus reached 6 GPa, connected layer 1 or connected layer 2 and the bonding layer can be considered as essentially the same material, meaning that r31, r42, and r43 are equivalent; this explains why the reflection coefficients of the three cases become identical at this point.

3. Finite Element Simulation of Bonded-Layer Composite Structures

3.1. Establishment of Finite Element Simulation Model

Figure 4 depicts time-domain simulation models of bonded-layer composite structures obtained using finite element software COMSOL 6.1. The structure of the bonding layer strengthening process is illustrated in Figure 4a; 3 mm carbon fiber, 2 mm epoxy resin, and 3 mm EPDM were used. The thicknesses were selected according to the structural form of the thick adhesive layer composite material [22]. A 30 mm × 0.3 mm thin connected layer 1 was added to the upper interface of the bonding layer to simulate the interface between the carbon fiber and the bonding layer shown in Figure 4b. Similarly, Figure 4c shows a 30 mm × 0.3 mm thin connected layer 2 to mimic the interface between the bonding layer and the EPDM. The interfacial weakening process was simulated by varying the elastic modulus of the connected layer and maintaining the elastic modulus of the bonding layer at its fully cured value. Corresponding material parameters were added, as shown in Table 1. Elastic mechanics, a transient physical field, and a solid mechanics physical interface were used to simulate the interaction between sound and solid. The width and the height of the signal excitation source were set to 3 mm and 0.1 mm, respectively. In addition, the center frequency was set to 3 MHz. To ensure the accuracy of the finite element simulation in ultrasonic propagation, the mesh size needs to be less than the smallest wavelength in all domains [25], so the grid size was set to 0.094 mm. The time step was set to T0/15. After setting the relevant parameters, the calculation was carried out. At the same time, the time-domain diagram was plotted. The following time-domain signal does not take into account the attenuation of the scattering and absorption of the ultrasonic wave in the medium.

3.2. Time-Domain Analysis of Bonded-Layer Composite Structures

When the adhesive was fully cured, its elastic modulus E reached a maximum value of 6 GPa. By varying the elastic modulus of the adhesive and conducting finite element simulations, time-domain diagrams can be obtained, as shown in Figure 5. Consequently, echo A from the lower interface of the carbon fiber, echo B from the lower interface of the bonding layer, and echo C from the lower interface of EPDM are displayed in Figure 5a. In addition to echoes A, B, and C, echo D from the lower interface of connected layer 1 is presented in Figure 5b. Similarly, echoes A, B, and C are accompanied by echo D from the lower interface of connected layer 2 in Figure 5c. After extracting the amplitudes of echoes A, B, C, and D from Figure 5, all amplitudes were normalized and the corresponding times for these echoes were plotted. This produced Figure 6 and Figure 7. Specifically, Figure 6 compares the echoes’ amplitudes, while Figure 7 compares their times. Additionally, both figures incorporate data for the elastic moduli of 3 GPa and 5 GPa for comparative purposes.
As can be seen from Figure 5a and Figure 6a, the amplitude of echo A gradually decreased, the amplitude of echo B slowly increased, and the amplitude of echo C changed very little during the bonding layer strengthening process. In Figure 5b and Figure 6b, the amplitude of echo A progressively decreased, while those of echo B and echo C gradually increased. Additionally, the amplitude of echo D, originating from the lower interface of connected layer 1, diminished during the weakening of the upper interface. The amplitude of echo A remained largely unchanged during the lower interface weakening process. However, the amplitude of echo B progressively decreased. Echo C experienced minimal variation in its amplitude. However, the amplitude of echo D, emanating from the lower interface of connected layer 2, increased in a gradual manner, as illustrated in Figure 5c and Figure 6c. These simulation results are consistent with the theoretical calculations.
As shown in Figure 7a, the echo time of A remained essentially unchanged, while the echo time of B gradually decreased, as did the echo time of C, for the duration of the bonding layer strengthening process. Figure 7b demonstrates that the echo time of A remained relatively stable during the upper interface weakening process, whereas the echo time of D, originating from the lower interface of the connected layer 1, progressively decreased. Similarly, the echo time of B also exhibited a slow decline, and the echo time of C continued to progressively decrease. As shown in Figure 7c, the echo times of A and B remained substantially unchanged during the lower interface weakening process. The echo time of D, originating in the lower interface of connected layer 2, gradually reduced. The echo time of C also progressively declined.
The equation used for measuring acoustic speed, utilizing the ultrasonic reflection method, is given as follows [26]:
t = 2 d C L
Combining Equations (1) and (5) yields another equation, which can be expressed as follows:
t = 2 d ( 1 + ν ) ( 1 2 ν ) ρ ( 1 ν ) E
here, t is the echo time; d is the thickness of the medium.
It can be observed from Equation (6) that when the density, thickness, Poisson’s ratio, and elastic modulus of the carbon fiber layer were kept constant, the echo time of A was unchanged. For the bonding layer or the connected layer, the echo time declined due to the increase in the elastic modulus E. The density, thickness, and Poisson’s ratio remained unchanged, which resulted in a decrease in the echo time of B. The echo time of C decreased due to the reduction in echo duration within the bonding layer or the connected layer.
Table 1 shows the Young’s modulus, Poisson’s ratio, density, and longitudinal sound speed for all three media. As the thicknesses of the three media are known, it is straightforward to compute the theoretical echo times according to Equation (6) and obtain the simulated echo time from Figure 7. The error is equal to the difference between the simulated echo time and the theoretical echo time divided by the theoretical echo time, as presented in Table 2. It can be seen that the errors are within 10%, which verifies the feasibility of the simulation.

3.3. Echo Amplitudes Under Different Simulation Conditions

As illustrated in Figure 8, the comparison diagrams of echo amplitudes were derived under different conditions through analyzing the simulations across the three processes. The following simulation results are in agreement with the theoretical calculations.
Figure 8a illustrates the variation in the amplitude of echo A under varying conditions. Notably, during both the bonding layer strengthening process and the upper interface weakening process, the amplitudes of echo A underwent a gradual decline. Conversely, during the lower interface weakening process, the amplitude of echo A remained largely unchanged. However, when the elastic modulus increased to 6 GPa, the amplitudes converged to a similar level across all three processes.
Figure 8b depicts the amplitude variations in echo B under different conditions. As is evident from the figure, the amplitudes of echo B progressively increased during the bonding layer strengthening process and the upper interface weakening process. Conversely, the amplitude of echo B gradually diminished during the lower interface weakening process.
Figure 8c presents the amplitude changes in echo C under varying conditions. It can be observed that the amplitudes of echo C remained relatively stable during both the bonding layer strengthening process and the lower interface weakening process. However, for the duration of the upper interface weakening process, the amplitude of echo C slightly increased. Notably, when the elastic modulus increased to 6 GPa, the amplitudes of all three ultrasonic waves converged to the same level.

4. Ultrasonic Inspection Experiment Using Bonded-Layer Composite Structures

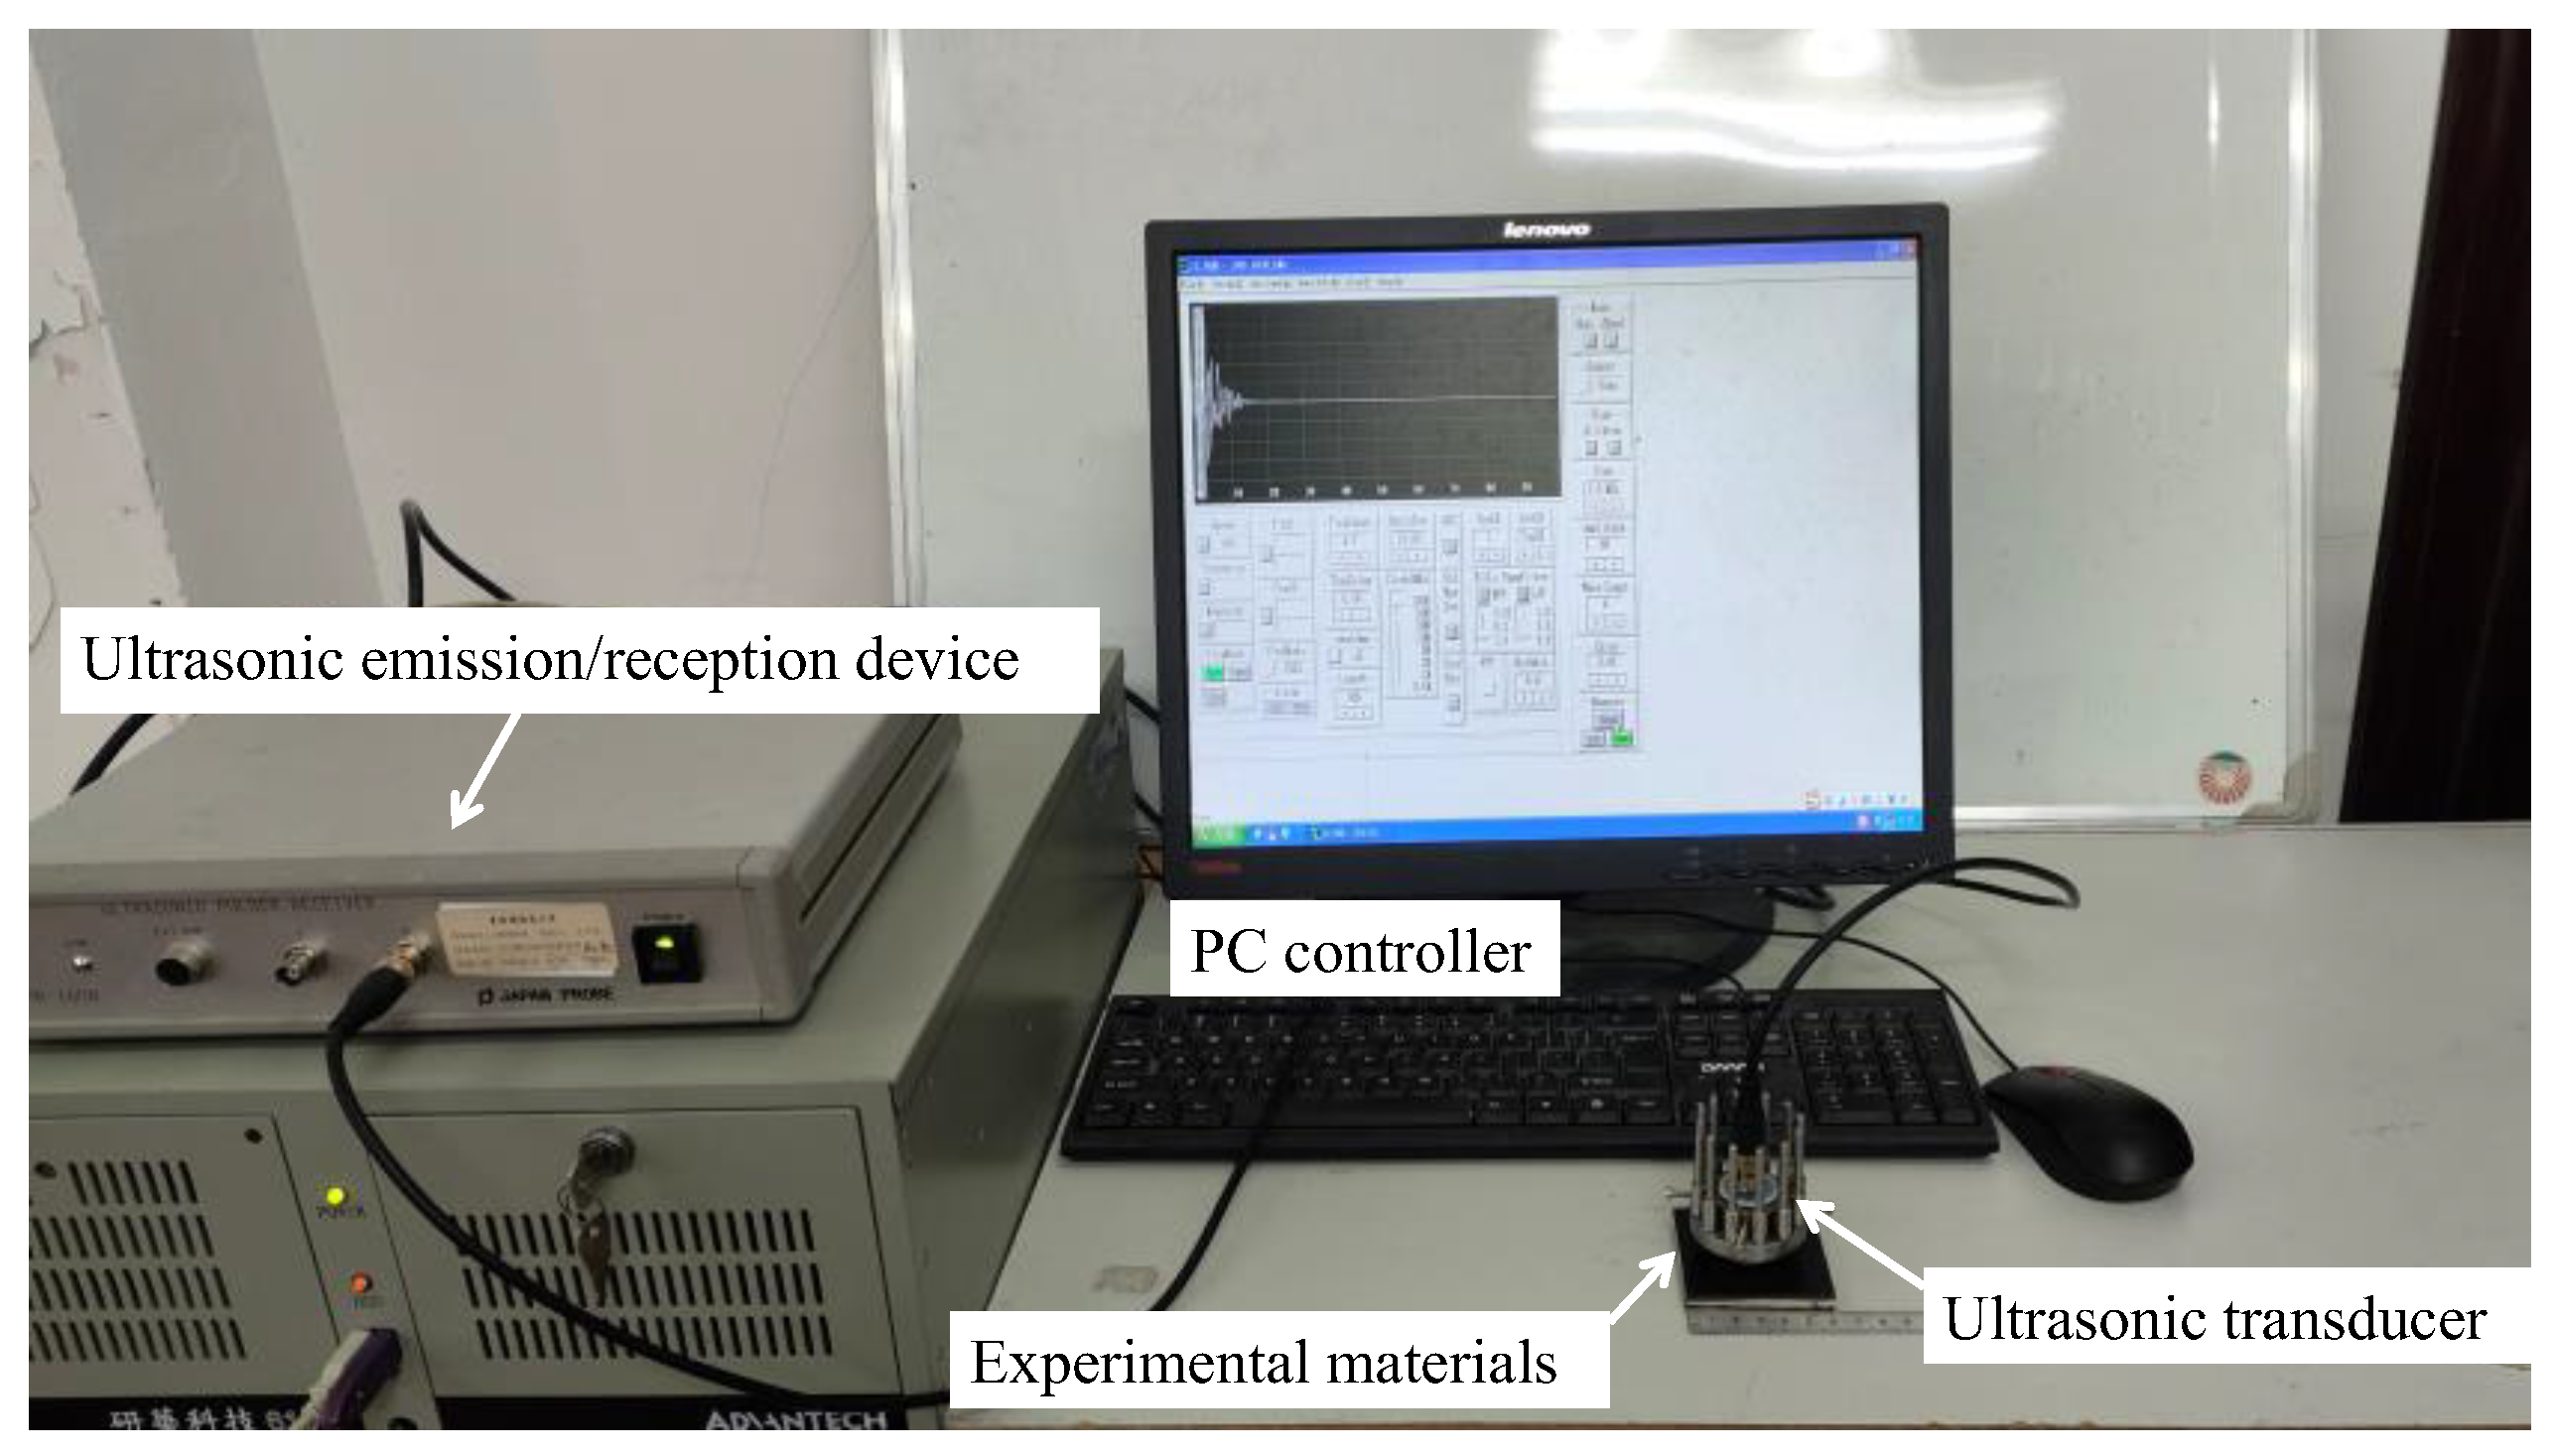
4.1. Equipment and Methods

A composite structure bonding mold was used to prepare a bonded-layer composite structure with a specific thickness. Taking into account the effect of environmental factors on the bonding agent [27,28], the experiment was conducted in a controlled environment with stable temperature and humidity levels. In order to remain consistent with the simulation results, the vertical reflection method was used to measure the ultrasonic propagation process in the material. The experimental device of the bonded-layer composite structure is shown in Figure 9; ultrasonic waves were excited and received by an ultrasonic transmitter/receiver. The ultrasonic signals reflected from the specimen were amplified by a signal amplifier to ensure they could reach the computer. In the detection process, water was added as a couplant to the upper interface of the carbon fiber; then, a 3 MHz ultrasonic probe was placed on the area where the coupling agent was applied. The relevant parameter buttons on the computer were adjusted to obtain the time-domain signals of bonded-layer composite structures. This experiment was conducted over a long period of time; the bonding layer was considered to be completely cured when the amplitude of all the echo signals no longer changed. The resulting curing time was found to be 24 h [29,30].

4.2. Experimental Schemes and Results Analysis for the Testing of Bonded-Layer Composite Structures

In this experiment, multiple strategies were employed to acquire bonded-layer composite structure specimens, specifically in scenarios involving the bonding layer strengthening process, the upper interface weakening process, and the lower interface weakening process. The experimental scheme for the bonding layer strengthening process is as follows: carbon fiber composite material and EPDM, both with dimensions of 60 mm × 60 mm, were bonded using epoxy resin adhesive to create a bulk-reinforced bonded-layer composite structure specimen, as illustrated in Figure 10. The specimen comprised three layers: a 3 mm layer of carbon fiber composite material, a 2 mm [31] layer of epoxy resin, and a 3 mm layer of EPDM.
The experimental scheme for the upper interface weakening process involved first preparing a composite structure composed of a 3 mm layer of EPDM and a 2 mm layer of cured epoxy resin serving as the bonding layer. Subsequently, approximately 0.3 mm of epoxy resin was applied to create a connecting layer, named connected layer 1, on the top surface of the bonding layer. Then, 3 mm of carbon fiber was composited on the connected layer, resulting in a bonded-layer composite structure with a weakened upper interface. In the experiment, the curing process of connected layer 1 was employed in reverse to simulate the upper interface weakening process.
Similarly, the experimental scheme for the lower interface weakening process involved the following steps: firstly, a composite structure consisting of a 3 mm layer of carbon fiber and a 2 mm layer of cured epoxy resin was prepared. Subsequently, a connected layer of approximately 0.3 mm thickness of epoxy resin, named connected layer 2, was applied on the upper surface of the EPDM. Then, the EPDM, with connected layer 2 already applied, was bonded to the composite structure, resulting in a bonded-layer composite structure with a weakened lower interface. The curing process of connected layer 2 was utilized in reverse to mimic the lower interface weakening process.
Samples cured for 2 h, 4 h, 8 h, 12 h, and 24 h were tested, yielding time-domain signal diagrams under different conditions, as shown in Figure 11. As the curing time of the epoxy resin increased, echoes A, B, and C became discernible. However, echo C was indistinguishable in the time-domain diagram after 2 h of curing. During the upper interface weakening process, the time at which echo D originated from the lower interface of connected layer 1 was similar to the time of echo A due to the thinness of connected layer 1, which resulted in echo D overlapping with echo A, as shown in Figure 11b. Similarly, during the lower interface weakening process, echo D originated from the lower interface of connected layer 2, overlapping with echo B, as shown in Figure 11c. The maximum amplitudes and times at which echoes A, B, and C originated following different curing times are shown in Figure 11. Since the time-domain diagrams for 2 h of curing cannot be used to distinguish echo C, the analysis was based on the data obtained after 4 h of curing. Comparison diagrams of echo amplitudes and echo times are shown in Figure 12 and Figure 13, respectively.
During the bonding layer strengthening process, as the curing time of the bonding layer increased, i.e., the adhesive strength of the bonding layer changed from weak to strong, the elastic modulus of the bonding layer gradually increased, as shown in Figure 12a. This caused the amplitude of echo A to decline and the amplitude of echo B to rise. However, the amplitude of echo C remained relatively unchanged. These experimental results are consistent with the theoretical calculations and simulation results. Notably, the amplitude of echo C in the experimental results was significantly lower than that of echoes A and B, contrary to the theoretical calculations and simulation results. This discrepancy is attributed to the fact that theoretical calculations and simulations do not account for scattering and absorption attenuation. The EPDM utilized in the experiments has viscoelastic properties, which result in the strong absorption and attenuation of ultrasonic waves; therefore, the amplitude of echo C in the experiment was lower [32,33].
As illustrated in Figure 12b, the upper interface curing process detection reveals that as the curing time of connected layer 1 increased, i.e., the elastic modulus of the upper interface increased, the amplitude of echo A progressively decreased and the amplitude of echo B gradually increased. However, echo C exhibited a relatively low degree of amplitude variation and its amplitude height was the lowest compared with the theoretical calculations and simulation results. The reason for this is also the scattering and absorption attenuation of ultrasonic waves by EPDM.
During the lower interface curing process, as the curing time of connected layer 2 increased, i.e., the elastic modulus of the lower interface gradually increased, the amplitude of echo A remained basically unchanged, and the amplitude of echo C also remained relatively small, as depicted in Figure 12c. Nevertheless, the amplitude of echo B exhibited a gradual increase, in contrast to the theoretical calculation and simulation, where it progressively decreased. Consequently, there was an overlap between echo B and echo D, which originated from the lower interface of connected layer 2, leading to a gradual increase in the amplitude of echo B that is influenced by connected layer 2.
The time of echo A in the bonding layer strengthening process remained relatively constant, whereas the times of echoes B and C exhibited a decreasing tendency, as shown in Figure 13a. This is attributed to the increase in the elastic modulus of the bonding layer due to the prolonged curing time, which subsequently led to an increase in longitudinal wave velocity within the bonding layer. Consequently, the times of echoes B and C gradually decreased. Similarly, the time variations in echoes A, B and C during the upper interface weakening process and the lower interface weakening process, as shown in Figure 13b,c were the same as those observed during the bonding layer strengthening process. This similarity is attributed to the increase in the elastic modulus of the connected layers. These experimental results are consistent with the simulation outcomes.

4.3. Echo Amplitudes Under Different Conditions in the Experiment

Figure 14a shows the amplitude variations in echo A under different conditions. It is discernible that the amplitudes of echo A gradually diminished during the bonding layer strengthening process and the upper interface weakening process. Conversely, the amplitude of echo A remained essentially stable during the lower interface weakening process. However, upon the completion of curing, the amplitudes of echo A under different conditions converged to similar levels; this trend was also observed in the theoretical calculation and simulation.
As the curing time increased, it became obvious that the amplitudes of echo B gradually increase under different conditions. Notably, the amplitude of echo B was observed to grow slowly during the lower interface weakening process, which differs from the calculation and simulation results. This is attributed to the influence of echo D, which originated from the lower interface of connected layer 2. Consequently, there is an inconsistency between the results of the experiment, the simulation, and the theoretical calculation. Nonetheless, when fully cured, the amplitudes of echo B still converged to similar levels.
As shown in Figure 14c, it can be observed that the amplitudes of echo C remained basically unchanged under the three conditions. However, there was a slight increase in the amplitude during the upper interface weakening process. Due to the scattering and absorption attenuation that occurred during the experiment, the simulated and experimental echo C heights were not consistent, but the trend of change was consistent.

5. Conclusions

In this paper, the adhesive properties of bonded-layer composite structures were investigated via the ultrasonic vertical incidence method. The ultrasonic propagation characteristics of bonded-layer composite structures were studied through theoretical calculations, finite element simulation, and ultrasonic experiments, with the composite structure bonded with carbon fibers and EPDM being used as the research object. The following conclusions were obtained:
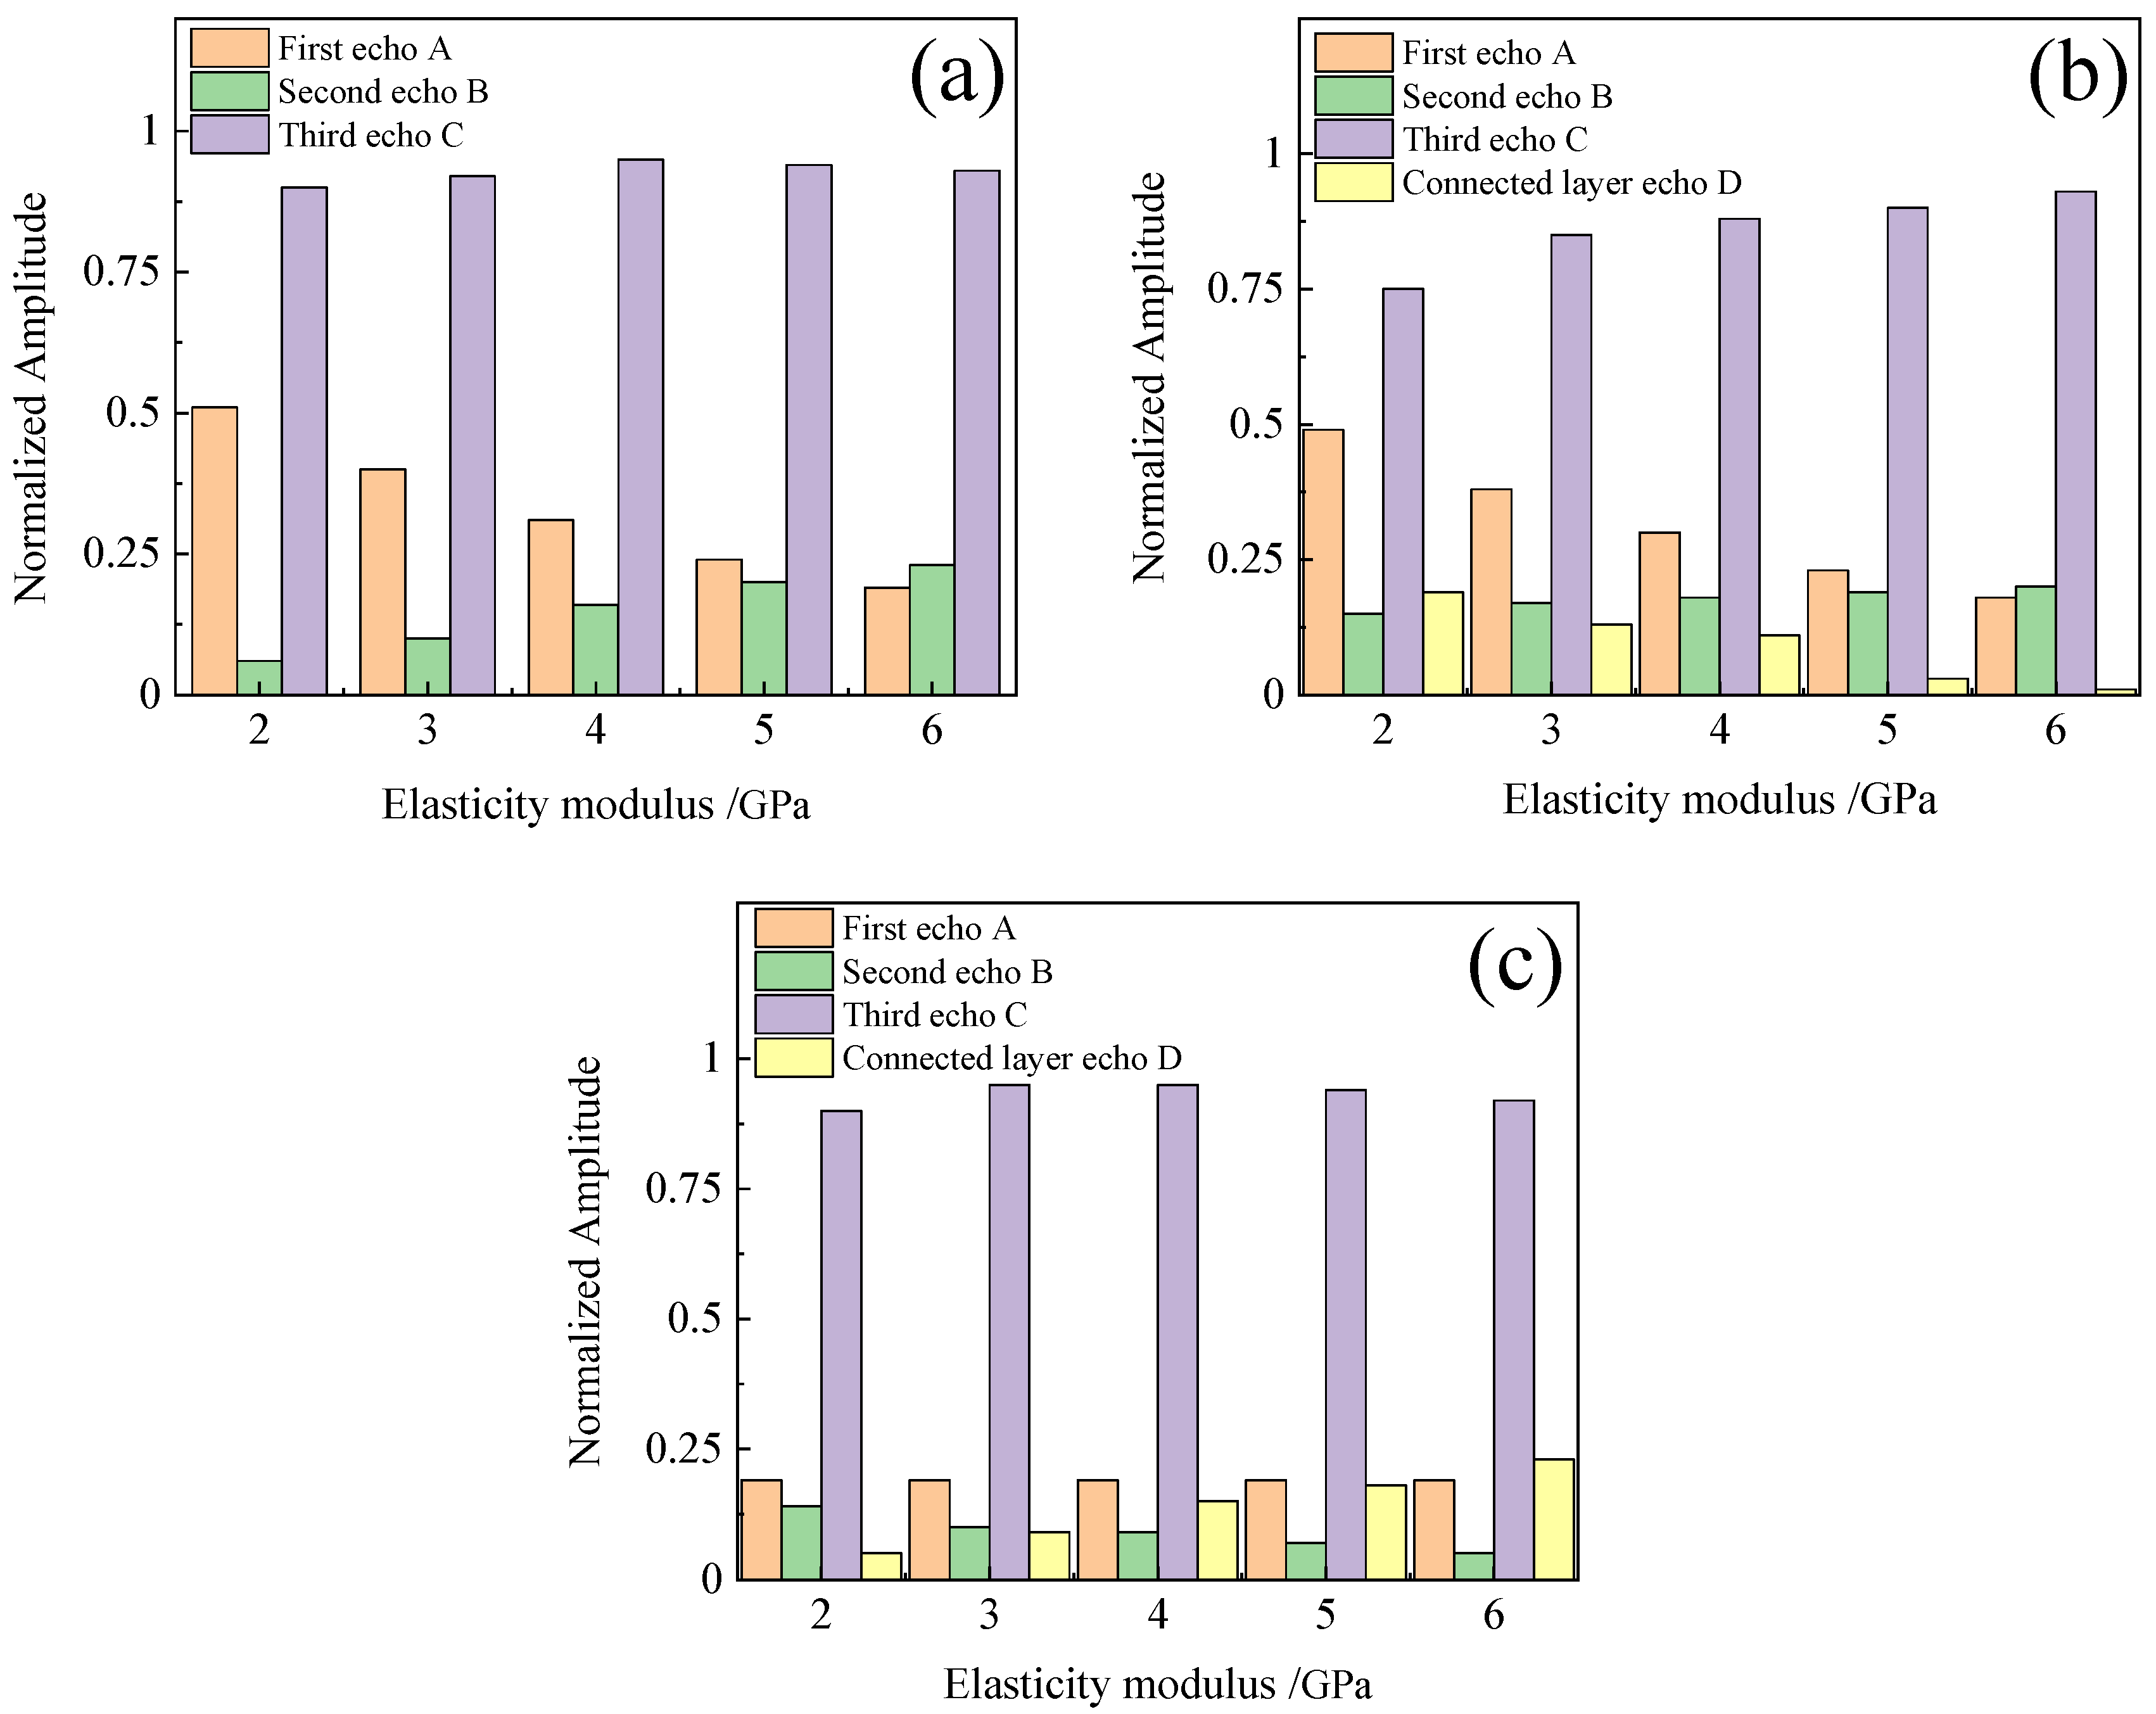
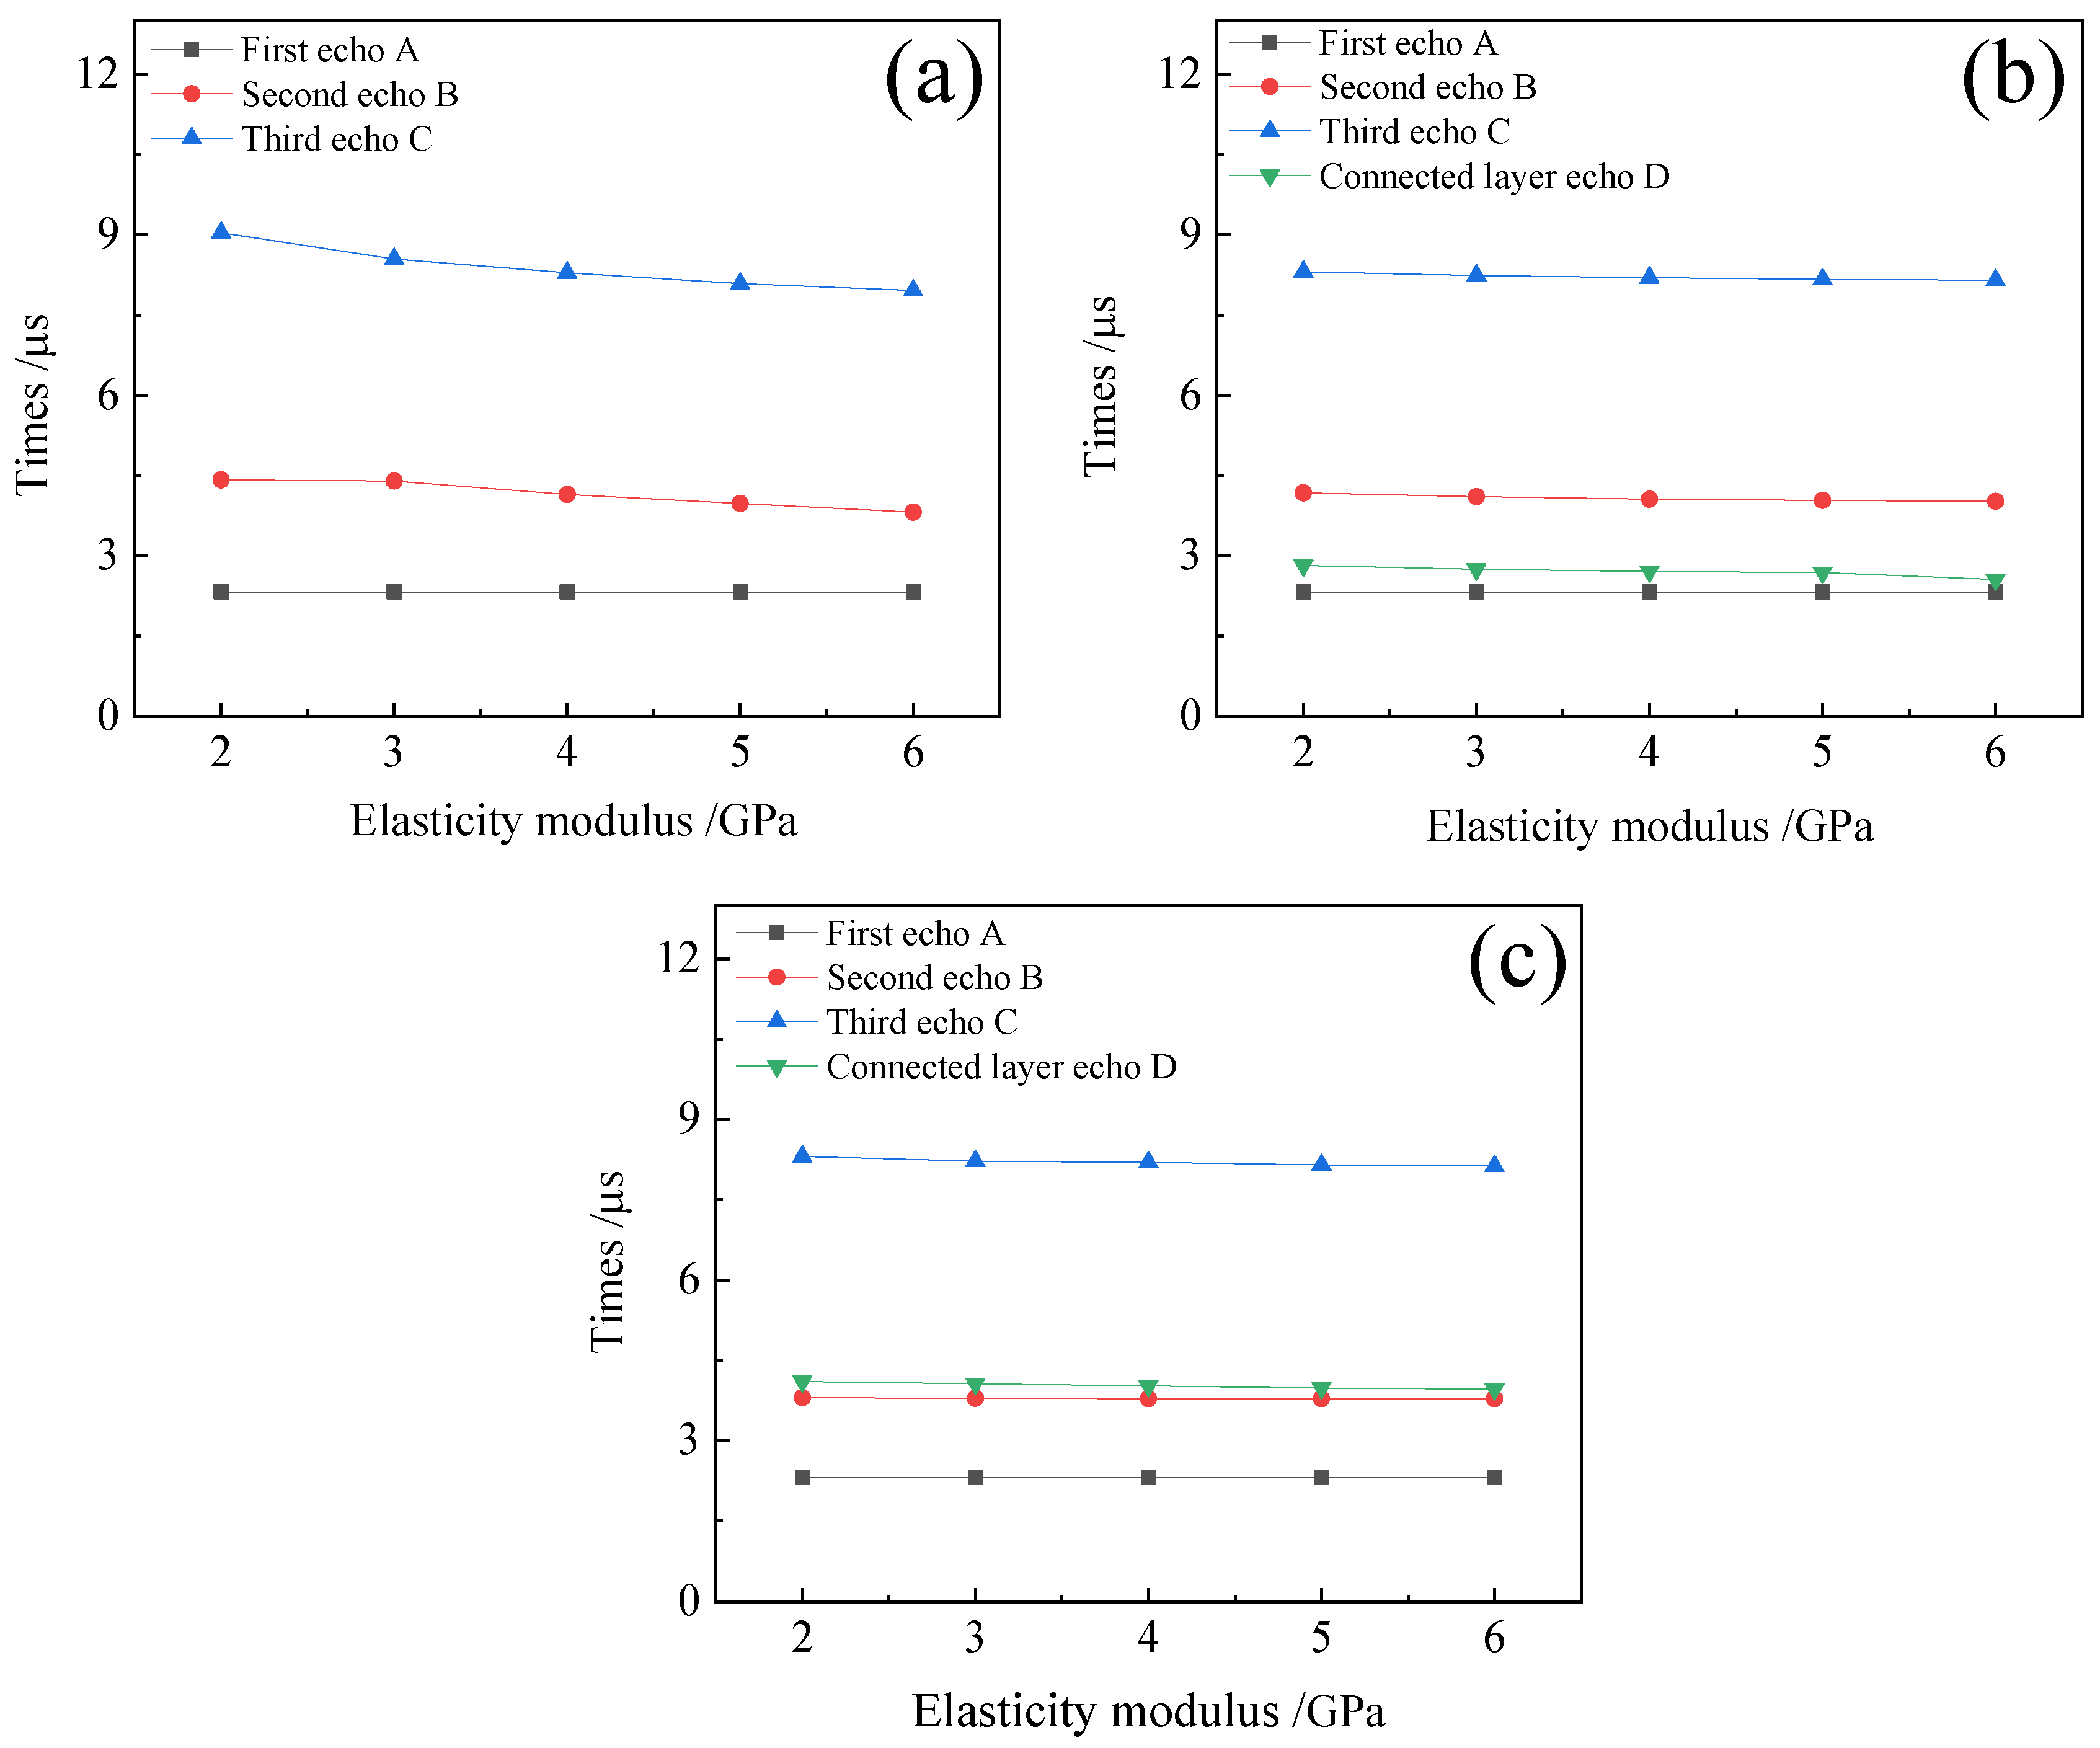
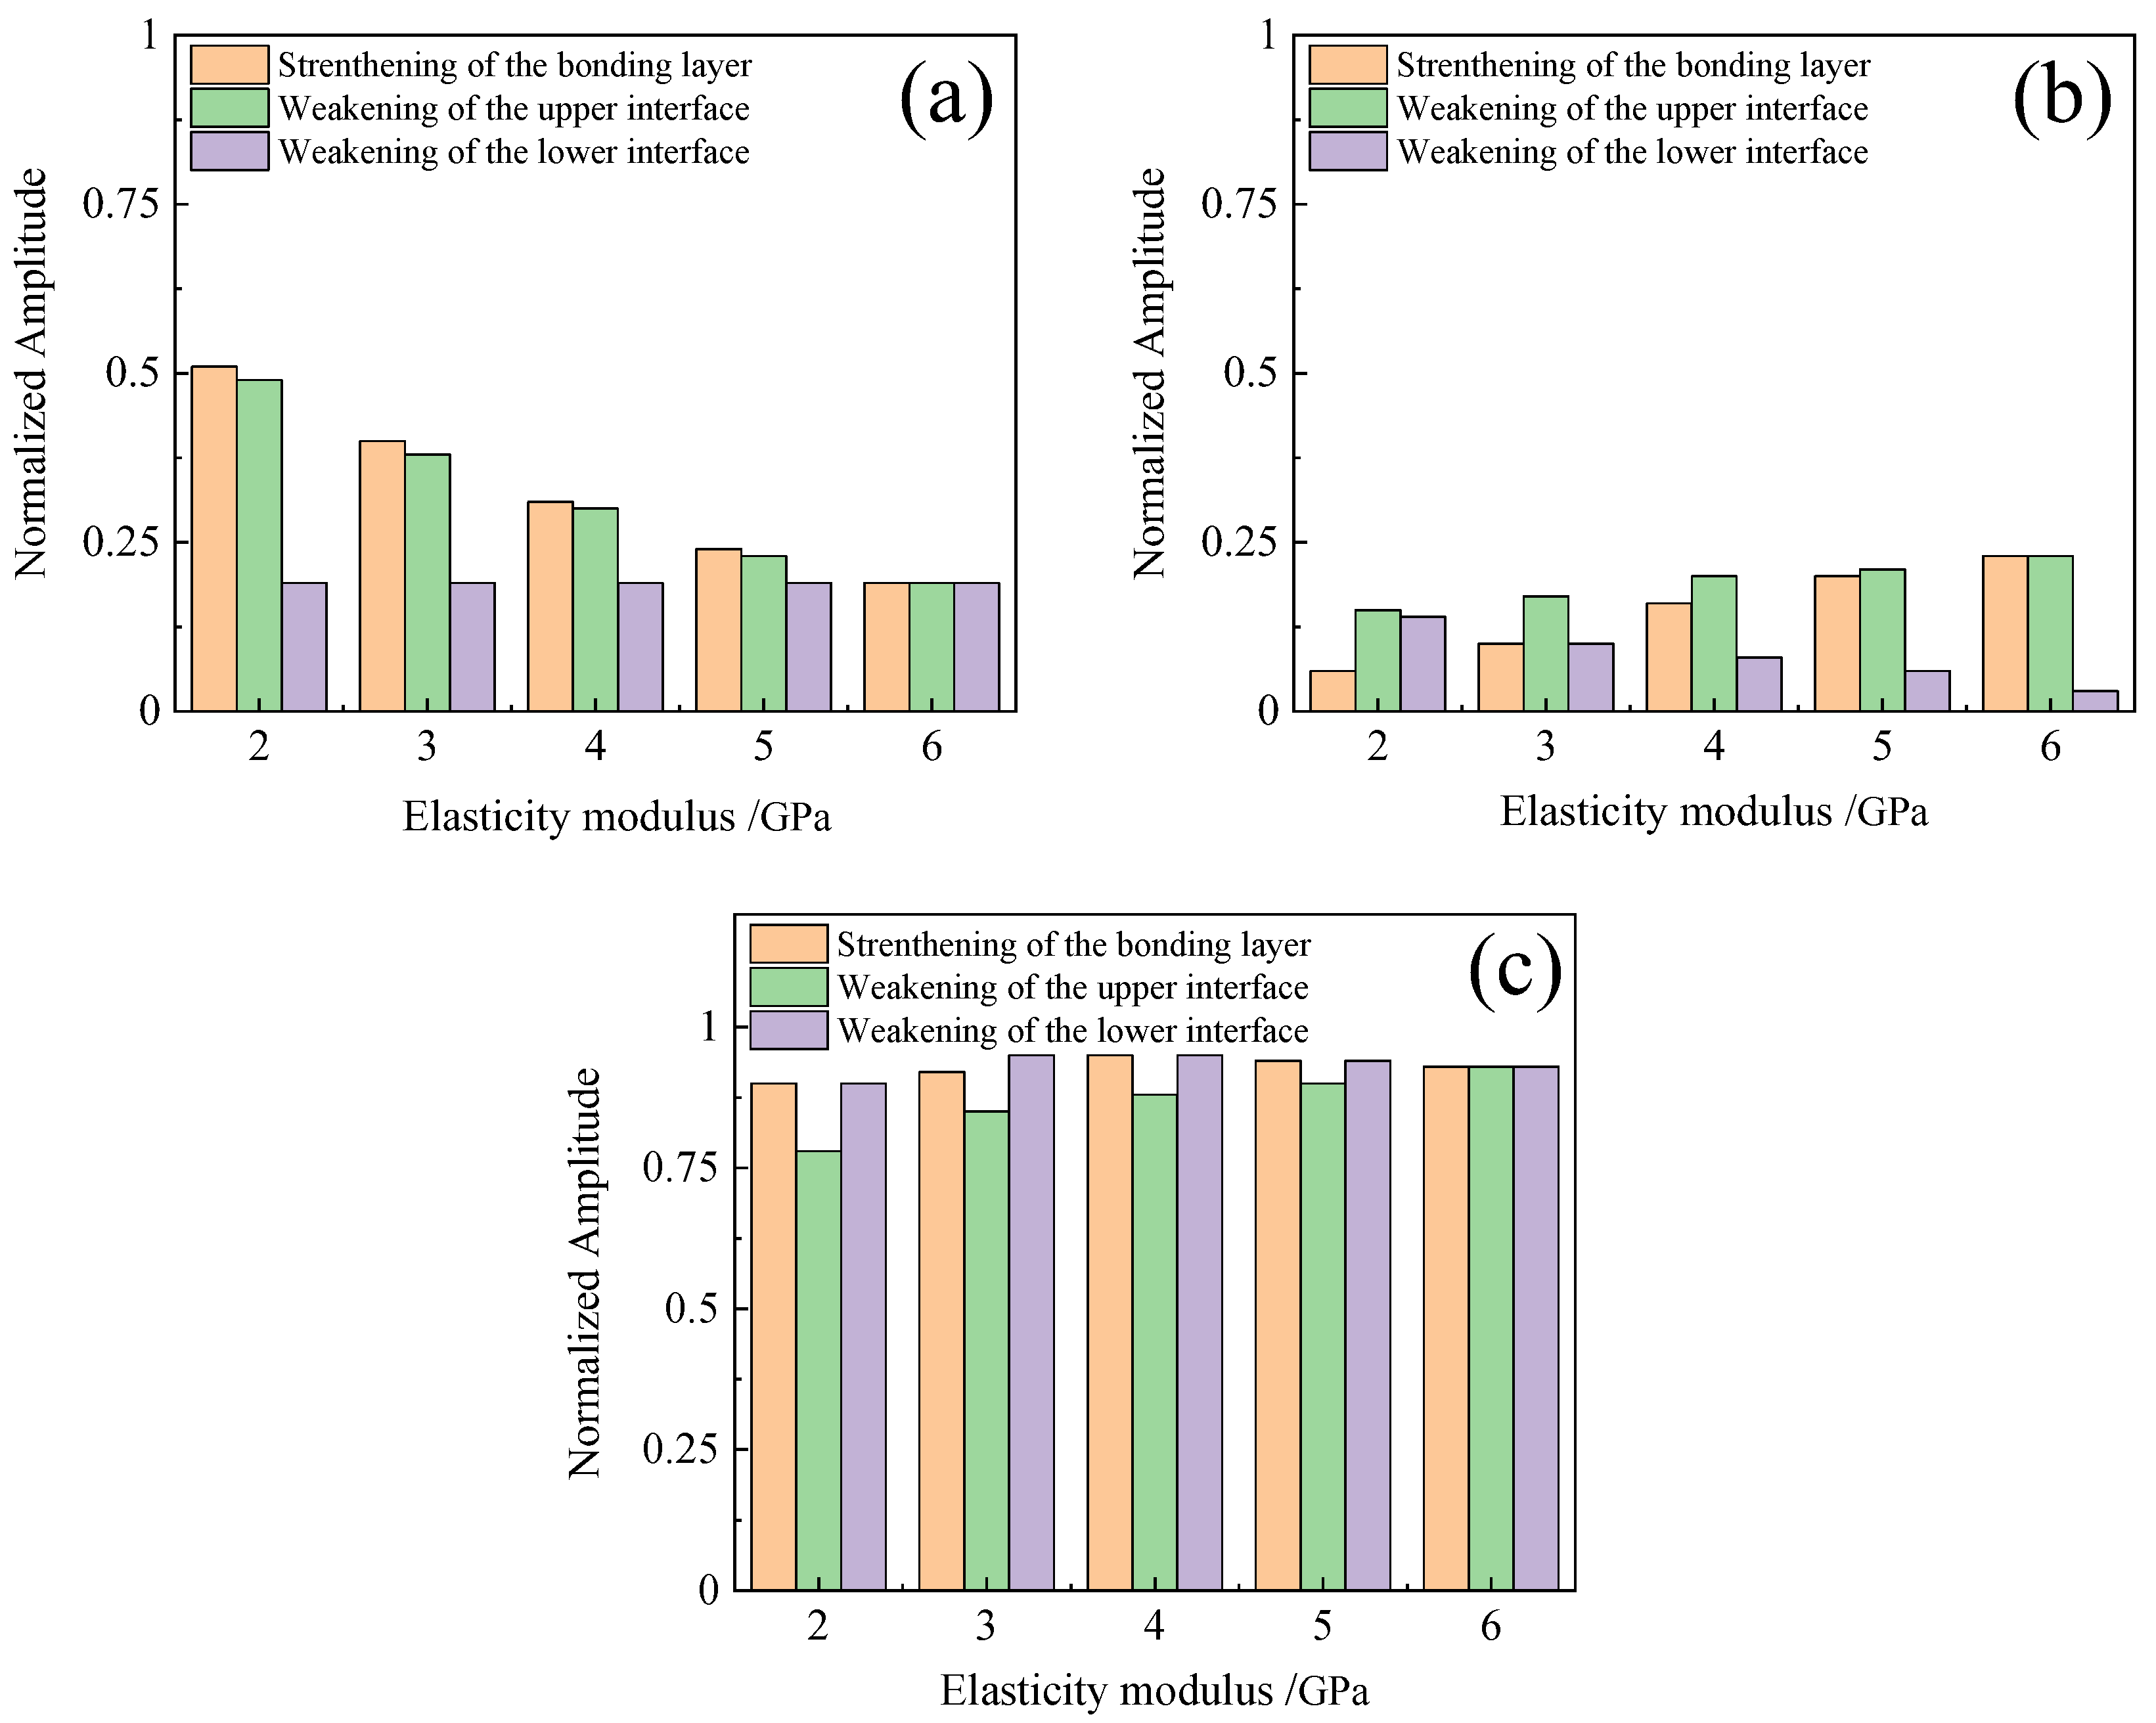
  • When the bonding strength of the bonding layer changed from weak to strong, the amplitude of the first echo slowly declined, the amplitude of the second echo gradually increased, and the amplitude of the third echo remained basically unchanged. The time of first echo remained basically unchanged, and the times of the second and third echoes gradually decreased.
  • When the bonding strength of the upper interface changed from weak to strong, the amplitude of the first echo gradually decreased, the amplitude of the second echo increased, and the amplitude of the third echo slightly increased. The times of the three echoes exhibited a similar trend as that observed in Conclusion 1.
  • When the bonding strength of the lower interface changed from weak to strong, the amplitude of the first and third echoes remained basically unchanged. The amplitude of the second echo gradually reduced in the theoretical calculation and the simulation, but increased during the experiment due to the fact that the second echo overlapped with the echo originating from the interface under the connected layer. In addition, the time variations in the three echoes were the same as those mentioned above.
  • The individual trends in the amplitude changes for the first, second, and third echoes remained consistent across the theoretical calculations, simulations, and experiments, except for the second echo in the lower interface weakening experiment, which exhibited an opposite trend to that observed in other experiments. It is noteworthy that the amplitudes of the third echo in all experiments were relatively lower compared to those obtained through theoretical calculations and simulations.

Author Contributions

F.B.: software, methodology, investigation, and writing. L.G.: review and editing. X.W.: review and validation, supervision, and funding acquisition. X.L.: review and investigation. G.S.: investigation. C.M.: review. G.T.: review. All authors have read and agreed to the published version of the manuscript.

Funding

This research was funded by the National Natural Science Foundation of China, grant number 52265020.

Institutional Review Board Statement

Not applicable.

Informed Consent Statement

Not applicable.

Data Availability Statement

The data presented in this study are available on request from the corresponding author.

Conflicts of Interest

Author Chengwen Ma was employed by the company Jiangxi Changxing Aviation Equipment Co., Ltd. The remaining authors declare that the research was conducted in the absence of any commercial or financial relationships that could be construed as a potential conflict of interest.

References

  1. Fan, S.J.; Zhang, J.M.; Wang, B.; Chen, J.P.; Yang, W.D.; Liu, W.P.; Li, Y. A deep learning method for fast predicting curing process-induced deformation of aeronautical composite structures. Compos. Sci. Technol. 2023, 232, 109844. [Google Scholar] [CrossRef]
  2. Dong, Y.F.; Li, Y. A review on the mechanical property evaluation and optimization design of fabric rubber composite structure. Compos. Part C 2022, 8, 100289. [Google Scholar] [CrossRef]
  3. SJ, A.; Natarajan, A. Review on the advancements and relevance of emerging joining techniques for aluminium to polymers/carbon fibre-reinforced polymer lightweight hybrid structures. Proc. Inst. Mech. Eng. Part L J. Mater. Des. Appl. 2022, 236, 2394–2435. [Google Scholar] [CrossRef]
  4. Wang, X.G.; Wang, J.X.; Shen, G.L.; Li, X.G.; Huang, Z.C. Research on interface bonding characteristics of layered medium using ultrasonic oblique incidence. Compos. Struct. 2022, 295, 11573. [Google Scholar] [CrossRef]
  5. Li, P.X.; Wang, X.G.; Li, X.G.; Shen, G.L.; Ma, C.W.; Huang, Z.C.; Su, S.Y. Evaluating interfacial bonding quality of multilayered structure based on ultrasonic testing technology. Meas. Sci. Technol. 2023, 34, 095117. [Google Scholar] [CrossRef]
  6. Li, M.X.; Wang, X.M.; An, Z.W. Ultrasonic detection and evaluation of adhesive interface properties. Appl. Acoust. 2013, 32, 190–198. [Google Scholar]
  7. Yang, X.; Zhang, M.; Zhan, L.; Ma, B.; Wu, X.; Liu, C.; Xiang, H. Effects of curing defects in adhesive layers on carbon fiber–quartz fiber bonded joint performance. Polymers 2024, 16, 1406. [Google Scholar] [CrossRef] [PubMed]
  8. Scarselli, G.; Corcione, C.; Nicassio, F.; Maffezzoli, A. Adhesive joints with improved mechanical properties for aerospace applications. Int. J. Adhes. Adhes. 2017, 75, 174–180. [Google Scholar] [CrossRef]
  9. Jasiūnienė, E.; Mažeika, L.; Samaitis, V.; Cicėnas, V.; Mattsson, D. Ultrasonic non-destructive testing of complex titanium/carbon fibre composite joints. Ultrasonics 2019, 95, 13–21. [Google Scholar] [CrossRef] [PubMed]
  10. Srinivasan, D.V.; Idapalapati, S. Review of debonding techniques in adhesively bonded composite structures for sustainability. Sustain. Mater. Technol. 2021, 30, e00345. [Google Scholar] [CrossRef]
  11. Budhe, S.; Banea, M.D.; Barros, S.; Silva, L.F. An updated review of adhesively bonded joints in composite materials. Int. J. Adhes. Adhes. 2017, 72, 30–42. [Google Scholar] [CrossRef]
  12. Vykintas, S.; Bengisu, Y.; Elena, J. Adhesive bond quality classification using machine learning algorithms based on ultrasonic pulse-echo immersion data. J. Sound Vib. 2023, 546, 117457. [Google Scholar] [CrossRef]
  13. Chen, Y.P.; Zhao, M.; Ma, S.Y.; Wu, Z.J.; Wu, H.Q.; Ma, Y.L. Effect of longitudinal guided wave modal transformation on damage identification at pipeline damage locations. Eng. Mech. 2016, 33, 215–221. [Google Scholar]
  14. Zhang, K.; Zhou, Z.; Zhou, J.; Sun, G. Characteristics of laser ultrasound interaction with multi-layered dissimilar metals adhesive interface by numerical simulation. Appl. Surf. Sci. 2015, 353, 284–290. [Google Scholar] [CrossRef]
  15. Moreno, M.S.; Cela, J.L.; Vicente, J.M.; Vecino, J.G. Adhesively bonded joints as a dissipative energy mechanism under impact loading. Appl. Math. Model. 2015, 39, 3496–3505. [Google Scholar] [CrossRef]
  16. Qi, H.; Cai, L.M.; Pan, X.N.; Zhang, Y. Dynamic analysis of SH-type guided wave inside a strip medium for cylindrical holes. Eng. Mech. 2015, 32, 9–14. [Google Scholar] [CrossRef]
  17. Thomson, W.T. Transmission of elastic waves through a stratified solid medium. J. Appl. Phys. 1950, 21, 89–93. [Google Scholar] [CrossRef]
  18. Ai, C.A.; Liu, Y.; Xu, Z.G.; Li, J. Reflection characteristics of “sandwich” structures with weakened strength. J. Appl. Mech. 2013, 30, 179–183. [Google Scholar] [CrossRef]
  19. Qiu, Z.G.; Wu, B.; He, C.F. Research on bonding layer depth and frequency in weak interface of bonded structures. Insight Non Destr. Test. Cond. Monit. 2011, 53, 302–306. [Google Scholar] [CrossRef]
  20. Wu, B.; Ding, J.; He, C.; Liu, Z.; Zheng, M. Wave propagation in water-immersed adhesive structure with the substrates of finite thickness. NDT E Int. 2016, 80, 35–47. [Google Scholar] [CrossRef]
  21. Kumar, R.V.; Bhat, M.R.; Murthy, C.R. Some studies on evaluation of degradation in composite adhesive joints using ultrasonic techniques. Ultrasonics 2013, 53, 1150–1162. [Google Scholar] [CrossRef]
  22. Wu, B.; Song, X.H.; Gao, J.; Song, G.R.; Lv, Y.; He, C.F. Ultrasonic reflection characteristics of weakly bonded structures of thick adhesive laminated composites. J. Acoust. 2024, 49, 137–145. [Google Scholar] [CrossRef]
  23. Chen, D.; Xiao, H.F.; Lai, M.; Wang, S.C.; Xu, J.W. Numerical simulation of ultrasonic detection of nonmetallic inclusions inside metallic materials. J. Eng. Sci. 2015, 37, 942–949. [Google Scholar] [CrossRef]
  24. Chen, X.B.; Li, X.L.; Zhou, J.G. Ultrasonic Testing Technology; Aviation Industry Press: Beijing, China, 2021. [Google Scholar]
  25. Yang, H.Y.; Zhao, X.Y.; Wang, L. A review of data normalization methods. Comput. Eng. Appl. 2023, 59, 13–22. [Google Scholar] [CrossRef]
  26. Zheng, H.; Lin, S.Q. Ultrasonic Inspection; China Labor and Social Security Press: Beijing, China, 2008. [Google Scholar]
  27. Xu, Q.H. Study on the Effect of Humid and Hot Environments on the Mechanical Properties of CFRP-Al Honeycomb Sandwich Bonded Structures. Ph.D. Thesis, Jilin University, Jilin, China, 2022. [Google Scholar]
  28. Meng, H. Temperature Sensitivity Study of Mechanical Properties of Elastically Bonded Structures. Master’s Thesis, Jilin University, Jilin, China, 2022. [Google Scholar]
  29. Wei, B.X. Research on Co-Curing Characteristics of Carbon Fiber/Epoxy Resin and EPDM Composite System. Master’s Thesis, Harbin Institute of Technology, Harbin, China, 2020. [Google Scholar]
  30. Zhang, C.H.; Chen, Z.M.; Li, S.D. Preparation and performance test of low-temperature curing agent for epoxy resin. Thermosetting Resin. 2016, 31, 25–27. [Google Scholar] [CrossRef]
  31. Zhu, C.; Li, W.; Wang, H. Analysis of interlayer crack propagation and strength prediction of steel bridge deck asphalt pavement based on extended finite element method and cohesive zone model (XFEM–CZM) coupling. Coatings 2023, 13, 1973. [Google Scholar] [CrossRef]
  32. Sun, S.K.; Cheng, L.J.; Shi, L.J.; Qian, H.H.; Liu, G.; Zhao, W.B. Nondestructive testing of fabric reinforcing rubber composites. Elastomerics 2020, 30, 48–51. [Google Scholar] [CrossRef]
  33. Li, Y.Y.; Chang, J.J.; Huang, L.; Tang, Y.H. Comparative study on viscoelastic evaluation methods of polymer materials based on ultrasonic method. Materials 2019, 12, 2948. [Google Scholar] [CrossRef]
Figure 1. Schematic diagrams of ultrasonic propagation paths in bonded-layer composite structures: (a) the bonding layer strengthening process; (b) the upper interface weakening process; (c) the lower interface weakening process.
Coatings 15 00151 g001
Figure 2. Echo reflection coefficients diagrams in bonded-layer composite structures: (a) the bonding layer strengthening process; (b) the upper interface weakening process; (c) the lower interface weakening process.
Coatings 15 00151 g002
Figure 3. Echo reflection coefficient diagrams obtained under different conditions: (a) echo A; (b) echo B; (c) echo C.
Coatings 15 00151 g003
Figure 4. Time-domain simulation models of bonded-layer composite structures: (a) the bonding layer strengthening process; (b) the upper interface weakening process; (c) the lower interface weakening process.
Coatings 15 00151 g004
Figure 5. Time-domain diagrams of bonded-layer composite structures: (a) the bonding layer strengthening process; (b) the upper interface weakening process; (c) the lower interface weakening process.
Coatings 15 00151 g005
Figure 6. Comparison of echo amplitude in bonded-layer composite structures: (a) the bonding layer strengthening process; (b) the upper interface weakening process; (c) the lower interface weakening process.
Coatings 15 00151 g006
Figure 7. Comparison of echo times in bonded-layer composite structures: (a) the bonding layer strengthening process; (b) the upper interface weakening process; (c) the lower interface weakening process.
Coatings 15 00151 g007
Figure 8. Comparison diagrams of echo amplitudes under different COMSOL simulation conditions: (a) echo A; (b) echo B; (c) echo C.
Coatings 15 00151 g008
Figure 9. Picture of the ultrasonic detection experimental device.
Coatings 15 00151 g009
Figure 10. Prepared specimens of bonded-layer composite structures: (a) the bonding layer strengthening process; (b) the upper interface weakening process; (c) the lower interface weakening process.
Coatings 15 00151 g010
Figure 11. Time-domain diagrams of bonded-layer composite structures under different conditions: (a) the bonding layer strengthening process; (b) the upper interface weakening process; (c) the lower interface weakening process.
Coatings 15 00151 g011
Figure 12. Comparison diagrams of echo amplitudes in bonded-layer composite structures under different conditions: (a) the bonding layer strengthening process; (b) the upper interface weakening process; (c) the lower interface weakening process.
Coatings 15 00151 g012
Figure 13. Comparison diagrams of echo times in bonded-layer composite structures under different conditions: (a) the bonding layer strengthening process; (b) the upper interface weakening process; (c) the lower interface weakening process.
Coatings 15 00151 g013
Figure 14. Comparison diagrams of echo amplitudes under different conditions in the experiment: (a) echo A; (b) echo B; (c) echo C.
Coatings 15 00151 g014
Table 1. Parameters of simulation materials.
MaterialLongitudinal Wave Velocity (m/s)Density
(g/cm3)
Poisson’s RatioYoung’s Modulus (MPa)
Carbon fiber28301.5000.3487591
Epoxy resin27001.1800.326000
EPDM14401.3520.391430
Table 2. Sources of echoes and error analysis during the curing of the bonding layer.
EchoElastic ModulusTheoretical Echo TimeSimulated Echo TimeError
A12 GPa2.12 μs2.33 μs9.9%
B14.68 μs4.42 μs5.6%
C18.78 μs9.04 μs3.0%
A2 2.12 μs2.33 μs9.9%
B24 GPa3.94 μs4.15 μs5.3%
C2 8.04 μs8.29 μs3.0%
A3 2.12 μs2.33 μs9.9%
B36 GPa3.6 μs3.82 μs6.1%
C3 7.77 μs7.96 μs2.3%
Disclaimer/Publisher’s Note: The statements, opinions and data contained in all publications are solely those of the individual author(s) and contributor(s) and not of MDPI and/or the editor(s). MDPI and/or the editor(s) disclaim responsibility for any injury to people or property resulting from any ideas, methods, instructions or products referred to in the content.

