Article

Evaluation of Particle Deposition Characteristics in Bent Tubes at Different Dimple Locations

1
Laboratory of Energy Carbon Neutrality, School of Electrical Engineering, Xinjiang University, Urumqi 830047, China
2
Ruoqiang Energy Industry Research Institute, Engineering Research Center of Northwest Energy Carbon Neutrality, Ministry of Education, Ruoqiang 841800, China
3
Center of New Energy Research, School of Intelligence Science and Technology (School of Future Technology), Xinjiang University, Urumqi 830047, China
4
Key Laboratory of Plateau Oxygen and Living Environment of Xizang Autonomous Region, Xizang University, Lhasa 850000, China
*
Author to whom correspondence should be addressed.
Coatings 2025, 15(11), 1336; https://doi.org/10.3390/coatings15111336
Submission received: 22 October 2025 / Revised: 11 November 2025 / Accepted: 15 November 2025 / Published: 17 November 2025

Abstract

The deposition of particulate matter on rough pipe surfaces is critical in fields such as energy, chemical engineering, and air pollution control. This study employs a combined approach utilizing the Renormalized Group (RNG) k-ɛ model and the discrete phase model (DPM). The particle deposition characteristics in circular bent pipe channels with different dimple positions were investigated. To improve simulation fidelity, a model for particle-wall rebound was developed using user-defined function (UDF). The results indicate that the dimple structure influences the deposition location of particles. Particle deposition is minimal on the lower surface and leeward side of the dimple structure. For operating conditions where St ≤ 0.27, θ = 15° yields the optimal effect on enhancing the particle deposition rate, achieving a maximum increase of 18.2%. For conditions where St ≥ 0.461, the optimal angle is θ = 30°, resulting in a maximum deposition rate increase of 14.126%. The deposition rate of dimple structures varies depending on their installation location. In this study, the deposition rate was lowest at θ = 65°. The dimple structure can serve as a sacrificial element, providing protection for the rest of the bent pipe. In the future, channels incorporating this structure can be applied to removal or air purification equipment.

1. Introduction

In the past several years, the issue of particle diffusion and deposition in rough-walled channels has garnered widespread attention across various sectors, including energy, chemical engineering, petroleum, and atmospheric pollution control. A crucial issue is the build-up of particles in the curved part of the pipe [1]. Bent pipes are widely used in industrial processes for energy transfer and fluid transportation. However, fluid media are typically impure, often containing various aerosol particles or dust, commonly found in particulate removal and air purification equipment [2,3,4]. In these devices, enhanced particle deposition can improve removal efficiency. However, in heat transfer channels, particle deposition reduces heat exchange efficiency and may even corrode the walls, leading to blockages that compromise system stability and safety [5]. Therefore, in-depth research into particle deposition characteristics in rough curved wall channels is crucial for enhancing the operational efficiency and economic viability of related equipment.
Particle deposition is generally considered to consist of two steps: transport and adhesion. Particles are transported to the wall surface by airflow movement. Due to particle-wall interactions, particles may undergo states such as rebound, sliding, deposition, and resuspension, as illustrated in Figure 1. In turbulent pipe flow, the primary mechanisms for particle deposition are gravitational settling, turbulent deposition, Brownian diffusion, and turbulent diffusion [6,7,8,9].
Particle deposition in turbulent bent pipes has been the subject of much research up to this point, including both numerical simulation and experimental investigation. The deposition efficiency of particles in circular bent pipes at various Reynolds numbers (Re) was experimentally studied by Pui et al. [10]. Additionally, it was suggested that the deposition efficiency and the St had an exponential connection curve. Experimental research on particle deposition in industrial ventilation duct bends was carried out by Peters et al. [11]. Research findings indicate that when the curvature ratio ranges from 3 to 12, it has little effect on particle deposition. Li et al. [12] employed laser-Doppler velocimetry (LDV) for measurement. Experimental investigations of the deposition patterns on a bend’s inner wall under various circumstances were carried out. The research findings indicate that sedimentation patterns remain largely similar under varying parameter values. Subhojit Kadia et al. [13] conducted experiments to investigate changes in sediment transport along the flow line in three supercritical curved channels. Research findings indicate that when secondary flow develops along the direction of water flow, high-momentum fluid is directed toward the outer wall, while sediment is pushed toward the inner wall and transported downstream along this path. Wu et al. [14] constructed an experimental apparatus simulating the air supply ducts of high-speed trains. They quantitatively analyzed the impact of pivotal variables such as fluid velocity on deposition flux.
Due to the swift progress in numerical flow simulation techniques, researchers can effectively simulate fluid flow behavior and particle deposition phenomena in curved pipes, achieving significant results. Sun et al. [15] employed an Reynolds Stress Model (RSM) approach to investigate particle deposition and distribution locations within curved pipes. To further explain particle deposition brought on by bending, a novel idea of total deposition has been put forth. Guo et al. [16] used Lagrangian particle tracking and the RNG k-ε turbulence model to simulate gas–solid flow in a 90° curve. According to research, 90° square bends deposition rates are lower than 90° round bends. Moreover, the deposition location of particles is primarily influenced by the Stokes number. Seyfi et al. [17] simulated natural gas-particle flow in a 90° bend within an Eulerian-Lagrangian framework, employing the Shear Stress Transfer (SST) model to simulate fully developed turbulent gas flow. Yan et al. [18] employed Lagrangian particle tracking and unidirectional coupled Large Eddy Simulation (LES) to investigate particulate turbulent flow within a 90° elbow under a saturated electrostatic field. The research findings indicate that there is a direct correlation between the concentration of particles and their size, with larger particles exhibiting a higher concentration. Furthermore, these results indicate that the particle concentration is higher on the outer side of the curved pipe in comparison to the inner side. Lagrangian particle tracking methods were combined with direct numerical simulation by Yan et al. [19]. A study was conducted on statistically stationary turbulent flow with solid particles in the fully developed section of a 90° bend under moderate Reynolds number conditions. Research indicates that secondary flow significantly influences particle distribution and particle-wall collisions.
Through literature review, it has been found that numerous scholars have made concerted efforts in researching particle deposition in flow through curved pipes. Furthermore, particle deposition in pipelines of different geometric forms has been thoroughly studied (see Table 1). A numerical study on turbulent particle deposition in rough-walled bends was carried out by Ladino et al. [20]. They observed that particle deposition rates increased when large-scale roughness structures were present on both sides of the bent pipe. Erraghroughi et al. [1] employed the Eulerian-Lagrangian method to investigate particle deposition when inserting ribs into a 90° circular bend. Research findings indicate that the insertion position of ribs significantly affects particle behavior. Additionally, researchers can mitigate erosion in the curved sections of pipes by incorporating features such as ribs, grooves, ridges, and vortex chambers [21,22]. However, although the aforementioned studies have demonstrated the feasibility of regulating particle deposition by adding roughness elements, scholars have also explored effect dimple structures on flow and heat transfer in straight pipes. Nevertheless, research on their application for controlling particle deposition in curved pipes remains limited. The core challenge lies in the fact that curved pipes exhibit more complex flow field characteristics than straight pipes. Therefore, although previous studies have explored particle deposition in curved pipes, there has been no in-depth investigation into how dimple structures can be utilized to effectively regulate particle deposition within curved pipes. This study utilizes numerical simulation methods to examine the particle deposition behavior within a 90° circular bend containing dimple structures. A 3D multiphase flow model (employing an Eulerian-Lagrangian framework) incorporating turbulent pulsation correction and particle rebound effects has been established to accurately predict particle deposition behavior in complex channels featuring pitted structures. Additionally, detailed studies were conducted on the deposition characteristics of particles with different positions within the dimple structure and varying particle sizes within the channel. Particle deposition patterns, deposition rates, and the flow field inside the curved pipe were examined and discussed. Compared with previous studies, this research not only innovatively applies dimple structures to control particle deposition in curved pipes but also investigates the influence of different dimple positions on particle deposition.

2. Numerical Methodology

2.1. Continuous Phase

In this study, the turbulent continuous phase is solved using the Eulerian approach. Compared to the Lagrange method, the Euler method has a shorter computation time. The fluid is thought to be stable and incompressible. The following expressions are obtained by applying the finite volume approach to solve the continuity and momentum control equations:
u ¯ i x i = 0
u i ¯ t + u j ¯ u i ¯ x j = 1 ρ p ¯ x j + 1 ρ x j μ u i ¯ x j ρ u i u j ¯
The correctness of the Renormalized Group (RNG) k-ε model has been shown by Yakhot et al. [33] in simulating the Reynolds stress term. Kim et al. [34] revealed that the developed model generated secondary flow distributions and velocity streamlines in curved pipes when compared to experimental studies. The model offers good validity for particle deposition in curved pipelines, as shown by Lidino et al. [20]. RNG requires less computing power than the Reynolds Stress Model (RSM) and is more appropriate for flows with strong streamlines and separation. The RNG k-ε model and the LES method exhibit little difference in computational results [35]. However, the computational time for LES is approximately 30 to 100 times that of RNG [36,37]. Therefore, this study employs the RNG k-ε model. In the RNG model, the following formulae (Equations (3) and (4)) [1] provide the turbulent kinetic energy transport equation (k) and the turbulent dissipation rate transport equation (ε), and the turbulence model constants are shown in Table 2:
x i ρ k u ¯ i = x j α k μ e f f k x j + G k ρ ε
x i ρ ε u ¯ i = x j α ε μ e f f ε x j + C 1 ε ε k G k C 2 ε ρ ε 2 k
μ e f f = μ + μ t
μ t = ρ C μ k 2 / ε
C 2 ε = C 2 ε + C μ ζ 3 1 ζ / ζ 0 1 + β ζ 3
ζ = S k ε
S = 2 S i j S i j 1 / 2
In the equation, ζ0 = 4.38, β = 0.012.
Table 2. Turbulence model constants.
Parameter SymbolNameNumerical Value
CμTurbulent viscosity coefficient0.0845
C1εε Equation Production Item Coefficient1.42
C2εε Equation Dissipation Coefficient1.68
Furthermore, to predict particle deposition efficiency, accurately capturing the flow in the vicinity of the wall is essential. This study uses the Enhanced Wall Treatment (EWT) method, one of several near-wall treatment techniques provided by Fluent. EWT may be analyzed reaching the wall surface’s near-wall region. EWT combines the Two-Layer Model with enhanced wall functions. The Two-Layer Model partitions the boundary layer into a viscous sublayer and a core turbulent layer, with the boundary between the two layers determined by Rey (Equation (10)) [1].
Re y ρ y k μ
y represents the distance from the wall surface to the grid center, and Rey is calculated based on the wall distance. In fully turbulent regions, the RNG transport equations (described in Equations (3) and (4) above) are employed. Within the viscous influence zone, the momentum and turbulent kinetic energy (TKE) equations remain applicable. Nevertheless, the following formula is used to determine the turbulent viscosity and turbulent dissipation rate independently (Equations (11)–(14)) [1]:
μ t , 2 l a y e r = ρ C μ l μ k
ε = k 3 / 2 l ε
l μ = y C l 1 exp Re y / A μ
l ε = y C l 1 exp Re y / A ε
In this study, Ansys Fluent 2022R1 is used for simulation calculations. All simulations were conducted on the high-performance servers at Xinjiang University. This server has a total of 512 cores and 2 terabytes of memory. Each case employs 16 cores for computation (Intel® Xeon® Silver 4309Y CPU @ 2.80 GHz), with 256 GB of system memory. The control equations of the turbulent wind field have been subjected to numerical resolution through the implementation of the Finite Volume Method (FVM).
The computation uses a solver that is based on pressure, coupling of pressure and velocity using the SIMPLE method. The pressure equation is discretized using the PRESTO format. The k-ε transport equation and the momentum equation are solved using the second-order upwind method. Spatial discretization employs the flux difference method, while temporal discretization utilizes a multistep Runge-Kutta method. Set the convergence criterion for residuals to 10−6 and assess convergence by monitoring key metrics.

2.2. Discrete Phase Model

To better simulate particulate trajectory and wall adhesion within the bent channel under actual operating conditions, we developed a user-defined function (UDF) for particle collision rebound. If a particle’s velocity exceeds the critical collision velocity when it impacts the wall, it rebounds and continues moving through the channel. Otherwise, it deposits on the wall surface.
In the present study, particle trajectories in the Lagrangian reference frame are tracked using the random orbit model. Turbulence is simulated using a stochastic approach employing the statistical model of fluid turbulence and the instantaneous motion equations of particles. The particle size simulated in the computational conditions is relatively small, so the following presumptions are presented:
  • Under all simulation scenarios, the tracked particles are defined as rigid spheres with uniform diameter and constant density throughout the population.
  • The particle phase is diluted, and inter-particle collisions are neglected.
  • The particles are smooth spherical particles in a monodisperse system.
  • Due to the relatively high particle density and gas flow velocity, forces such as pressure gradient force, virtual mass force, and Brownian force are not considered.
Under these assumptions, and considering the drag force, gravitational force, and buoyancy force acting on particles within the flow field, a particle’s equation of motion may be represented as follows (Equation (15)) [30]:
m p d u p d t = F D + F G
where mp is the particle mass and up is the particle velocity.

2.2.1. Drag Force

The drag force FD is expressed as (Equations (16)–(18)) [38]:
F D = m p ( u i u i p ) τ p
τ p = d p 2 ρ p C c 18 μ 24 C d Re
Since the particles are thought to be spherical, the Cd is calculated using the spherical drag law.
C d = a 1 + a 2 Re r + a 3 Re r 2
Among these, a1, a2, and a3 are empirical constants for smooth spherical particles within different particle Reynolds number ranges.

2.2.2. Gravity and Buoyancy

When a particle is immersed in a fluid and subjected to gravity, the net gravitational force acting on particle FG is (Equation (19)) [38]:
F G = m p g ρ p ρ g ρ p

2.3. Turbulent Dispersion of Particles

The determination of the instantaneous fluid velocity is achieved through the utilisation of a discrete random walk (DRW) model. The impact of transient turbulent velocity variations on particle trajectories is taken into account in the DRW model. We calculate particle diffusion caused by fluid turbulence based on the instantaneous velocity induced by fluid velocity pulsations. To accurately simulate the diffusion process of particles, we introduce the turbulence timescale TL. This represents the duration for which turbulent pulsations in the fluid affect particle motion. The turbulence timescale is typically related to the energy (k) and dissipation rate (ε) of turbulence. The DRW model also takes into consideration the fluid’s discrete vortices and particle interactions. Furthermore, no assumption of isotropic vortices is made.
A critical sedimentation velocity model was created by Brach and Dunn [39] using the Johnson–Kendall–Roberts (JKR) model as a basis. Once particles make contact with the wall surface, this model can identify their motion status. When particles contact the wall surface, if their velocity exceeds the critical deposition velocity (ucr), they rebound; otherwise, they are captured by the wall. Building upon this foundation, a particle deposition model was developed and refined through the implementation of user-defined functions (UDF) to suit the requirements of this study.
The equation for ucr is as follows (Equation (20)) [30]:
u c r = [ 2 K / d p R 2 ] 10 / 7
where ucr denotes the critical deposition velocity, and R represents the motion recovery coefficient.
K is the effective stiffness parameter, given by (Equations (21)–(23)) [30]:
K = 0.51 [ 5 π 2 ( k s + k p ) 4 ρ p 1.5 ] 0.4
k s = ( 1 v s 2 ) / π E s
k p = ( 1 v p 2 ) / π E p
where vs = 0.28, vp = 0.13, Es = 215 Gpa, Ep = 192 Gpa.
The formula for R is as follows (Equation (24)) [39]:
R = 45.3 / ( 45.3 + u i n 0.718 )
The dimensionless dimension of deposition velocity for particles is represented here by V d + (Equations (25) and (26)) [30]:
V d + = V d u
V d = J C 0 = N d / t d / A N 0 / V = N d / t max N 0 / h
where Nd represents the number of deposited particles, and N0 denotes the total number of released particles.
The dimensionless wall distance, y+, is given by (Equation (27)) [1]:
y + = y u v
u* is the friction speed (Equation (28)) [40]:
u = τ w ρ g
The following formula is used to determine the particle deposition rate in the channel (Equation (29)) [16]:
η = N d N 0
Deposition efficiency is described by the Stokes number (St).
St is defined (Equation (30)) [16] as the ratio between the particle relaxation time τD and the system response time τs:
S t = τ D τ s = C c ρ p d p 2 / 18 μ D / 2 / U 0 = C c ρ p d p 2 U 0 18 μ D / 2
In the equation, λ = 6.9 × 10⁻⁸ m.

3. Case Description and Solution

3.1. Case Description

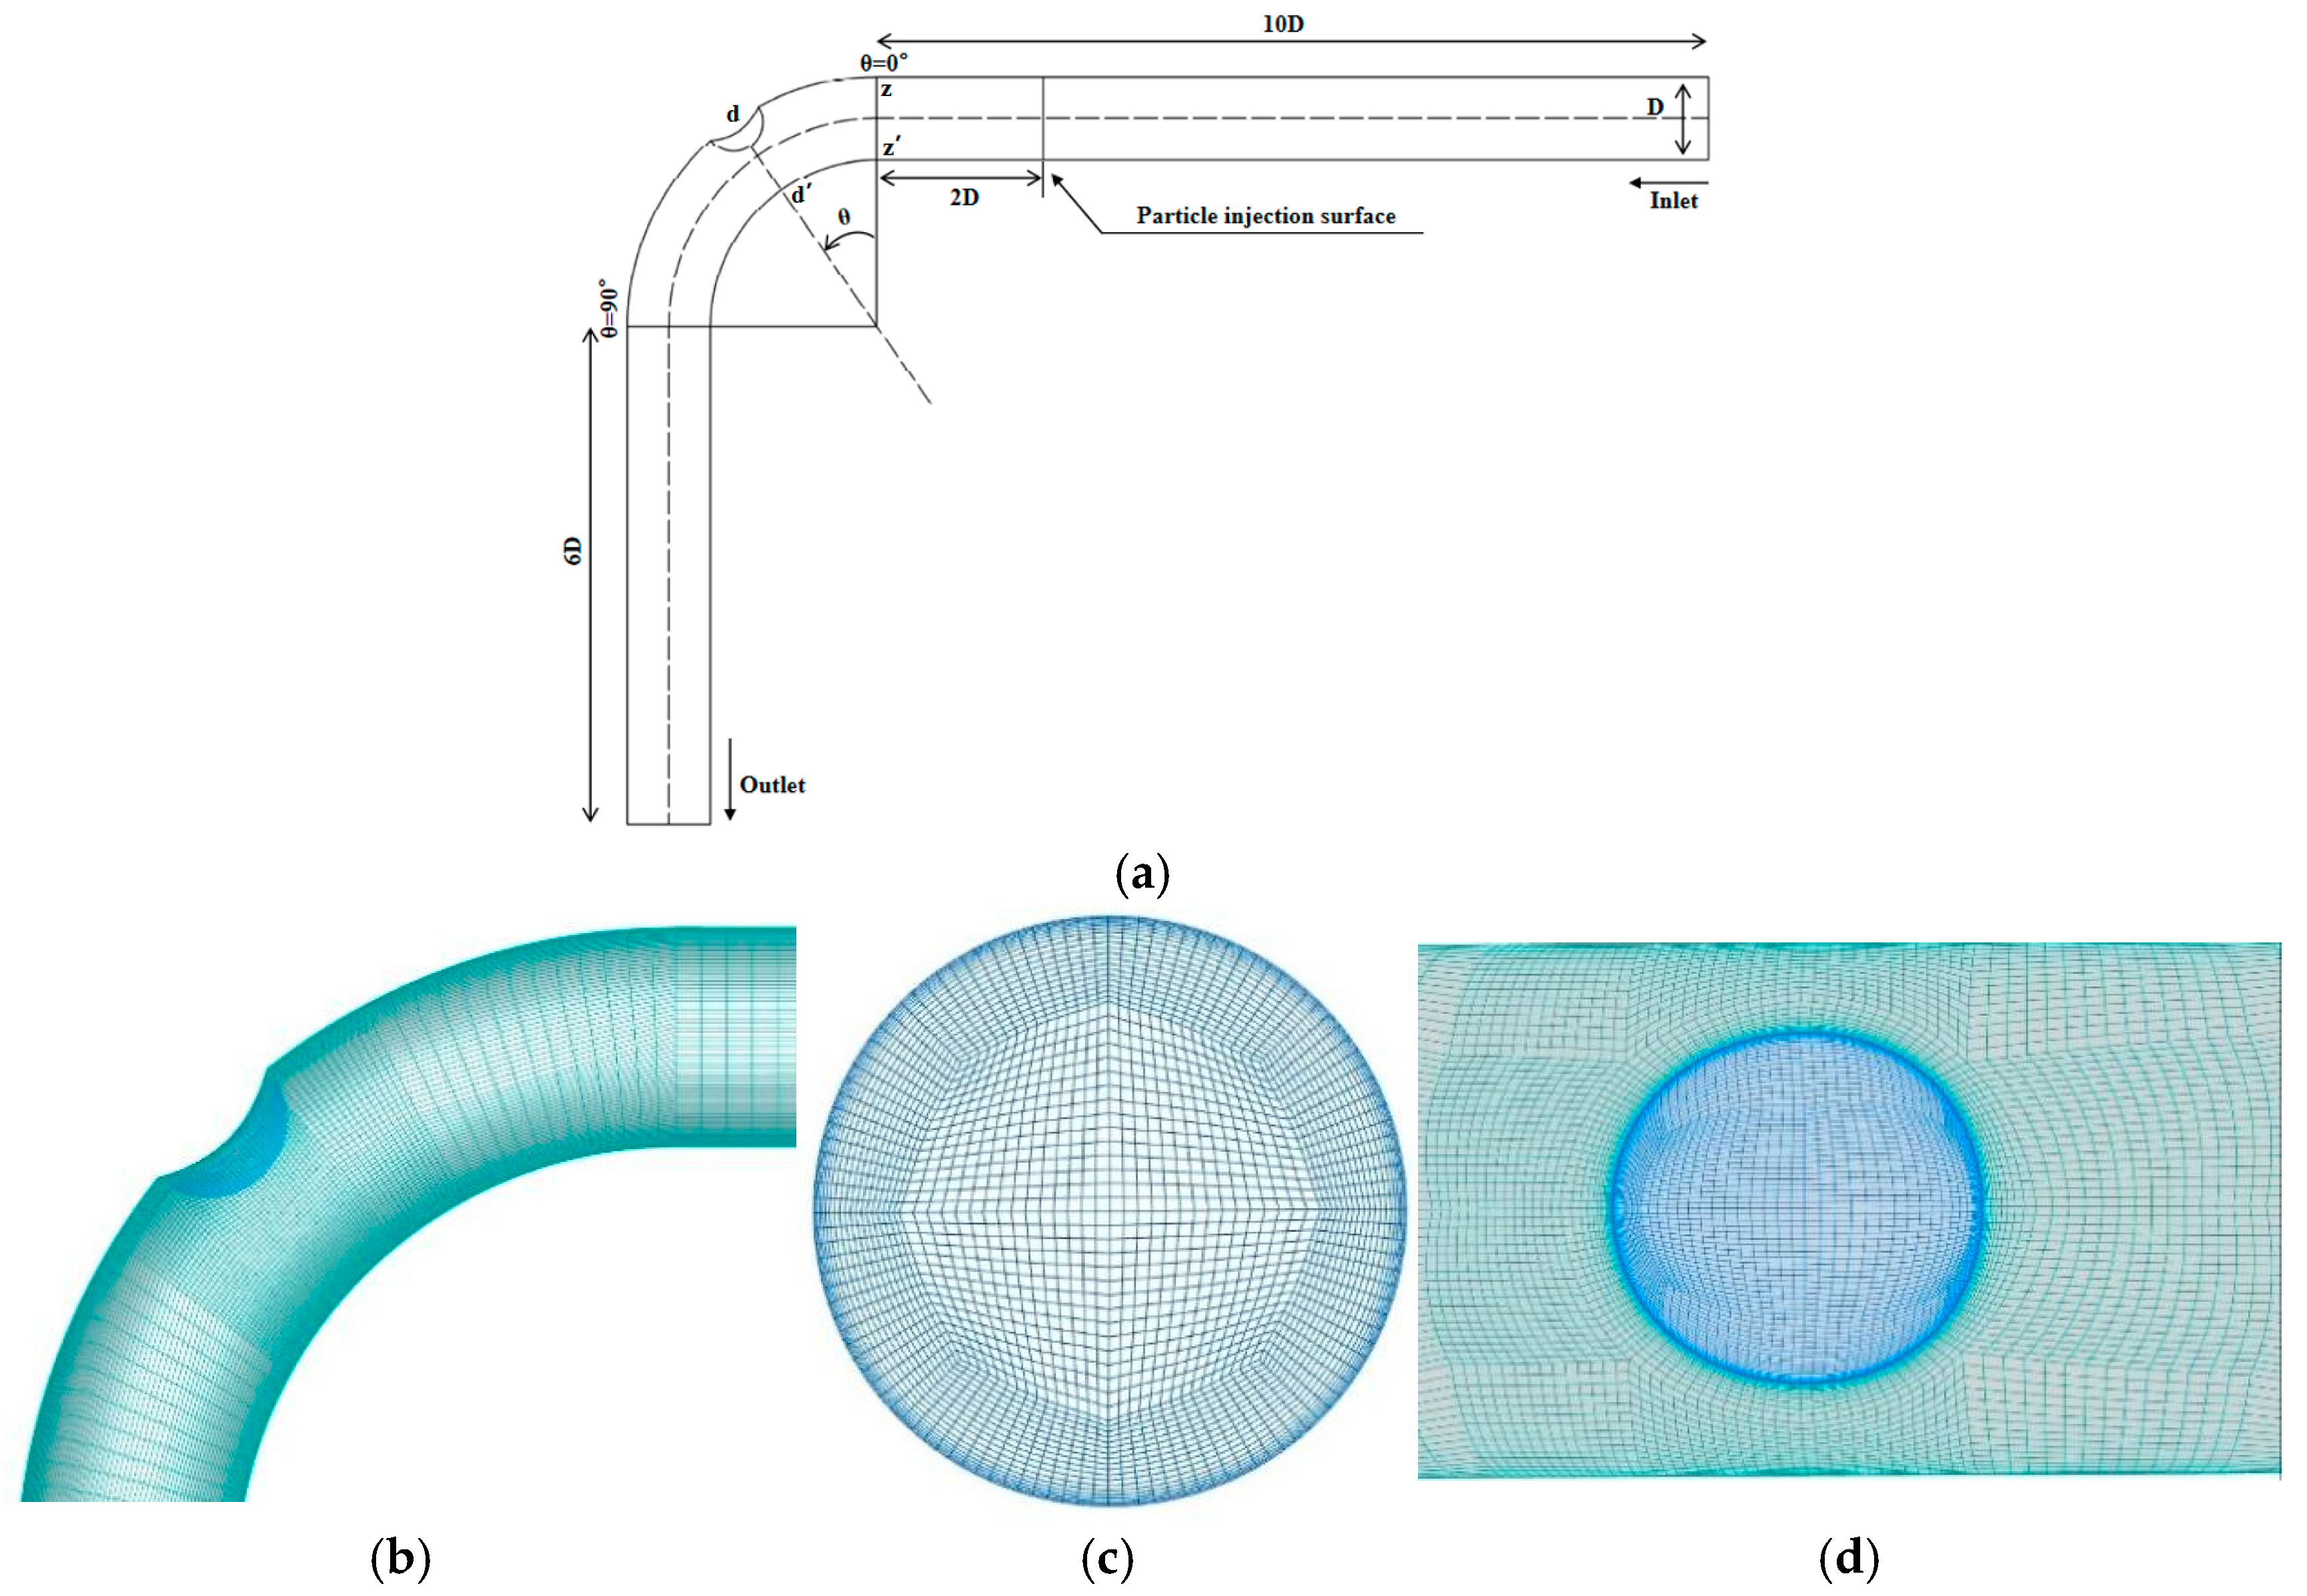
As shown in Figure 2, the diameter D of the circular bent tube channel is 8.51 mm. The outlet is designed with sufficiently long horizontal and vertical straight pipes (10D and 6D, respectively) to prevent backflow. At the bend section of the passage, there is a dimpled structure. The angle between the z-z’ section and the d-d’ section is defined as. Use θ = 0° denote the inlet of the bend section and θ = 90° to denote the outlet of the bend section. This study employed a total of 15 models, with smooth channel and dimple channels set at θ values of 10°, 15°, 20°, 25°, 30°, 35°, 40°, 45°, 50°, 55°, 60°, 65°, 70°, and 75°. Based on research into structured meshes and mesh independence, structured hexahedral meshes exhibit superior mesh quality, enabling more accurate and stable simulations. Therefore, this study employed ICEM to generate a structured mesh. As shown in Figure 2b–d, the mesh has been refined and densified in the regions near the walls.

3.2. Boundary Conditions

The inlet is a velocity inlet with a velocity of 17.2 m/s. The outlet is a pressure outlet with an air density of 1.225 kg/m3. The calculated Re is 10,000. The wall and dimple structures are assumed to be under no-slip conditions. Under each operating condition, 25,000 particles were released upstream at θ = 0° in the 2D domain. Particle size ranges from 1 to 9.5 μm, with corresponding St numbers between 0.013 and 1.03 (see Table 3). Additionally, a particle wall bounce UDF has been developed. Particles will deposit on the wall when they come into touch with it at a velocity lower than the critical velocity; otherwise, they will continue moving.

3.3. Structured Grids and Grid Independence Analysis

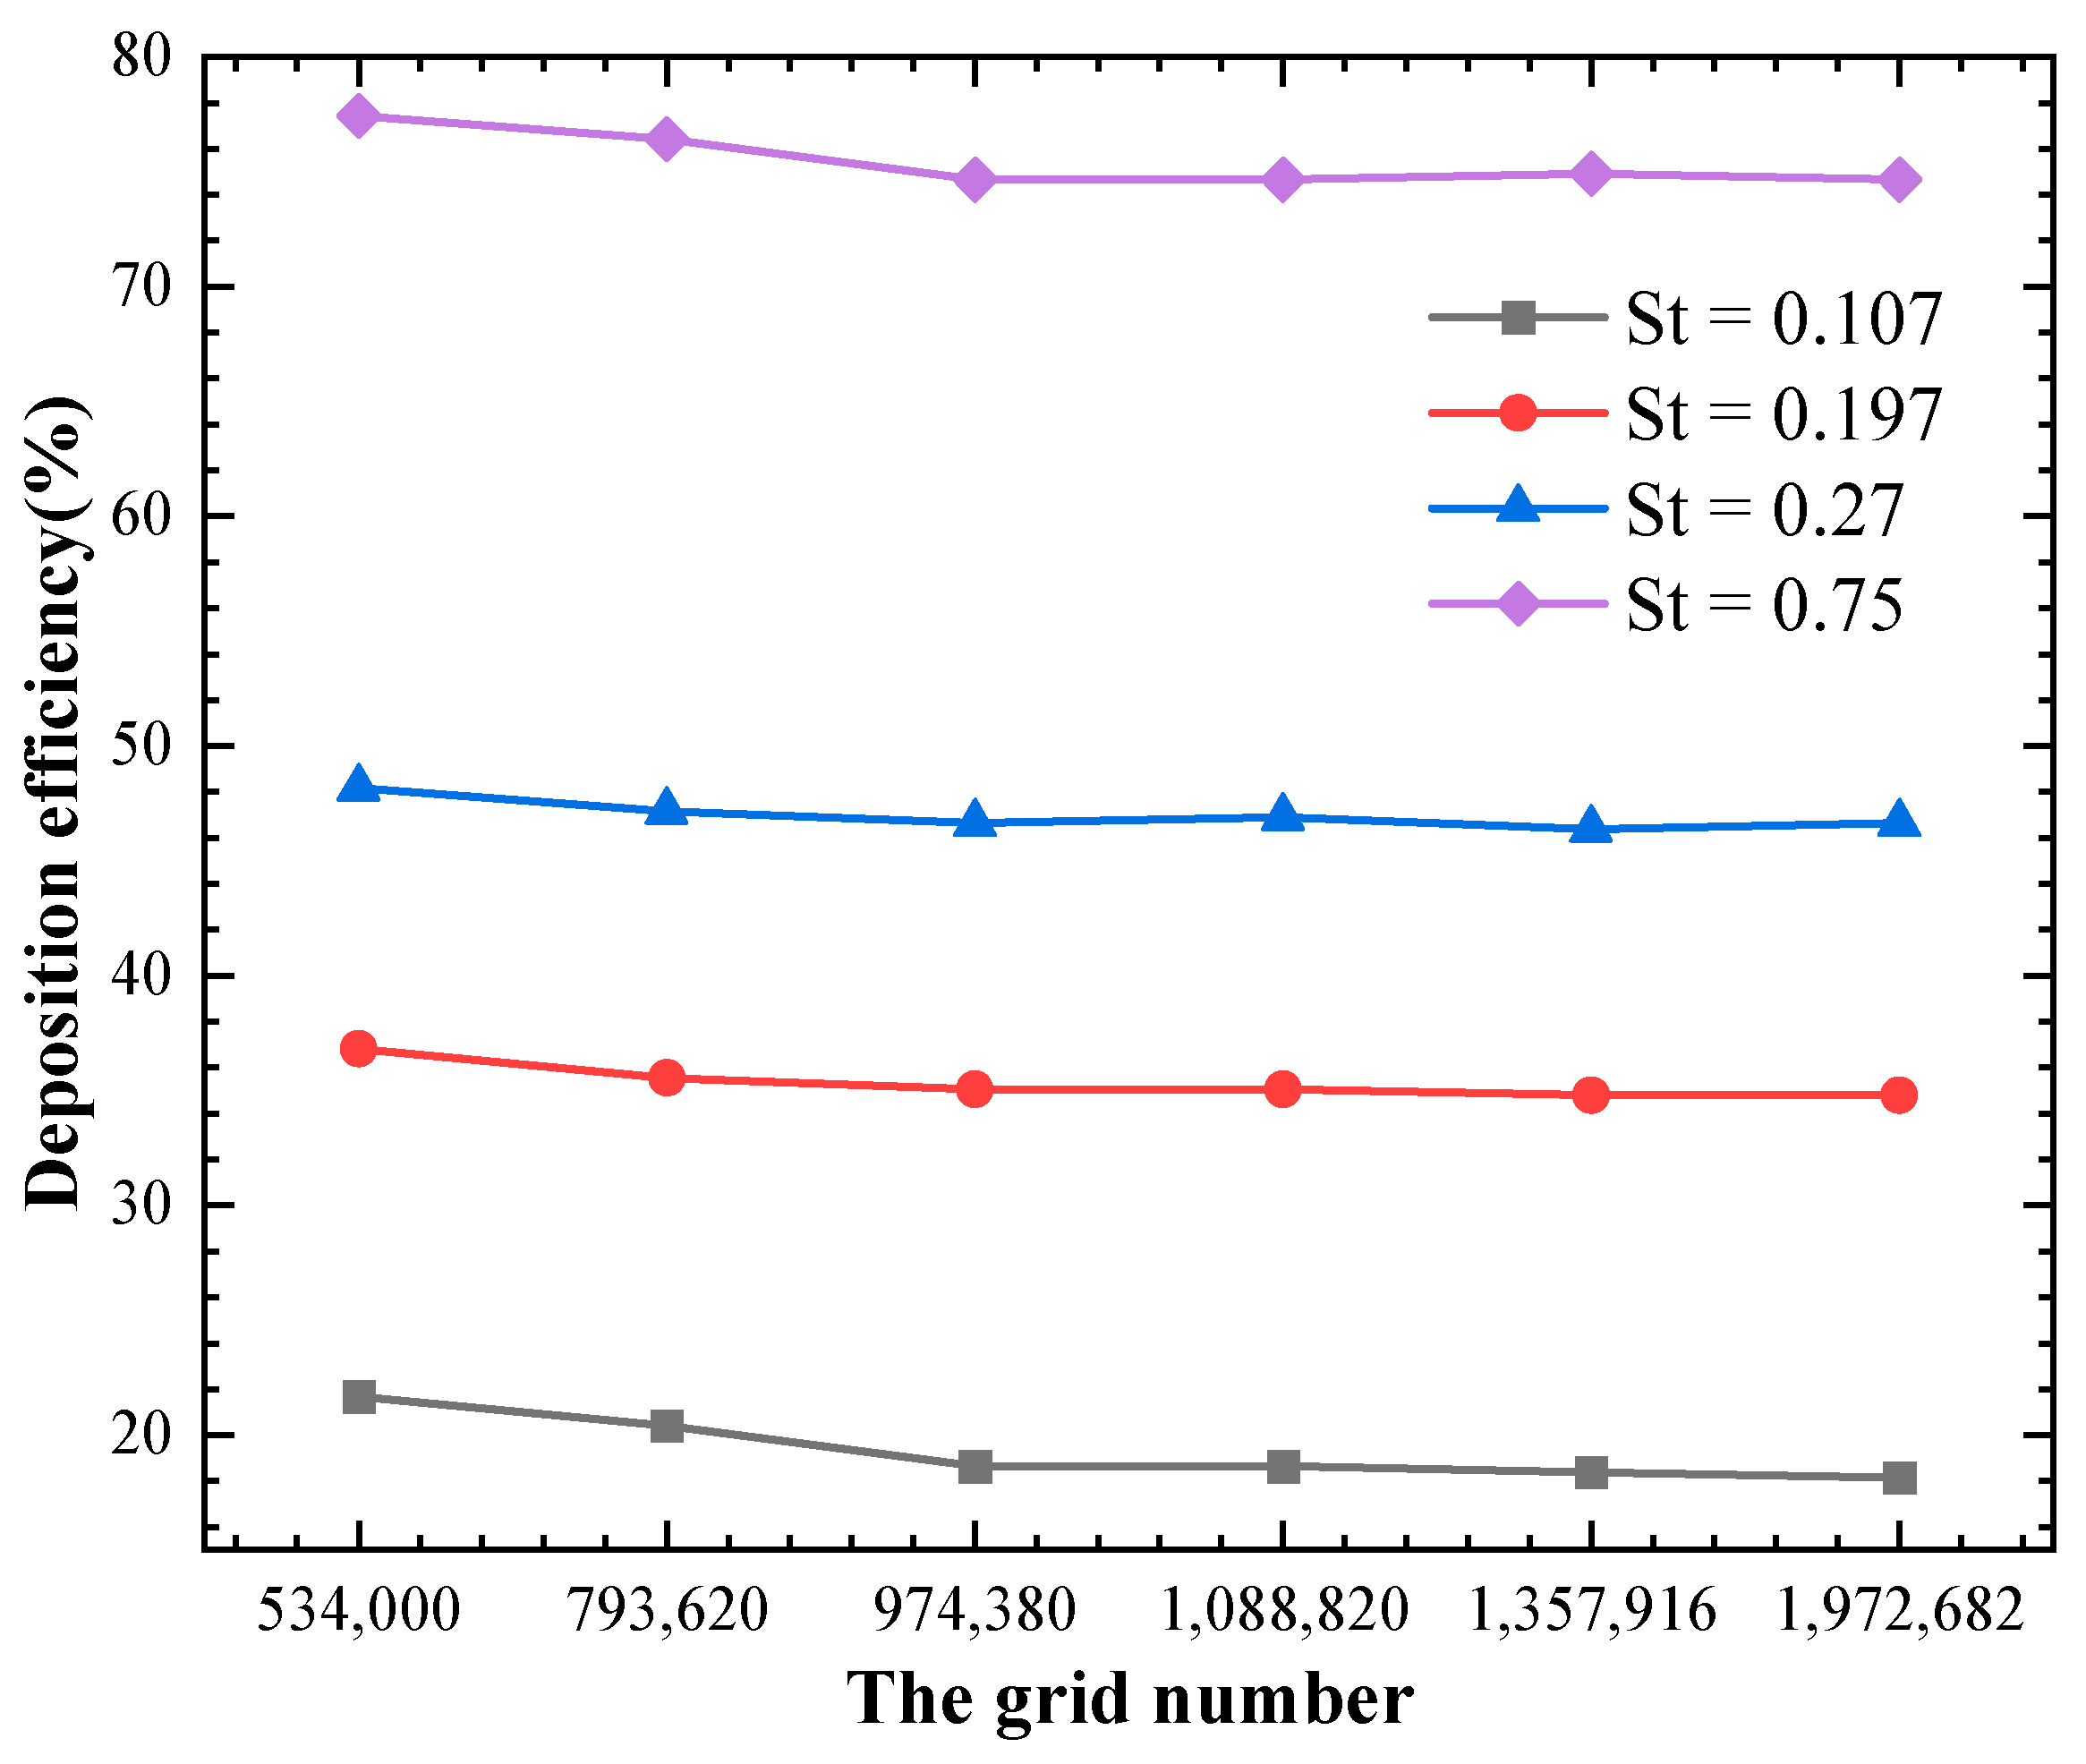
To ensure the quality of the mesh, we employed ICEM to perform hexahedral structural meshing of the channels. Since the EWT method is employed for the near-wall region in this study, the meshing requirements for the near-wall area are relatively stringent. In this study, the dimensionless distance y+ ≈ 1 was selected for the first layer of the grid, with a growth factor of 1.2. The distance of the first layer of the grid from the wall surface was 1.2 × 10⁻⁵, and the height of the first layer of the grid was 2 × 10⁻⁵. In this study, the grid quality exceeded 0.67, and the angles were all greater than 23°. The accuracy of the findings is influenced not only by the grid’s quality but also by the quantity of grid. To identify a more suitable number of grid cells, we conducted grid-independent validation, as shown in Figure 3. For different grid resolutions, we calculated the particle deposition rates separately and compared the results. When the grid size exceeds 974,380, the relative error between different grid sizes is less than 2%. The particle deposition rate in the pipeline stabilizes, and further grid refinement is unnecessary. To conserve computational resources, we selected a grid with 974,380 cells for the simulation.

4. Results and Discussion

4.1. Numerical Analysis

Turbulent Flow Validation

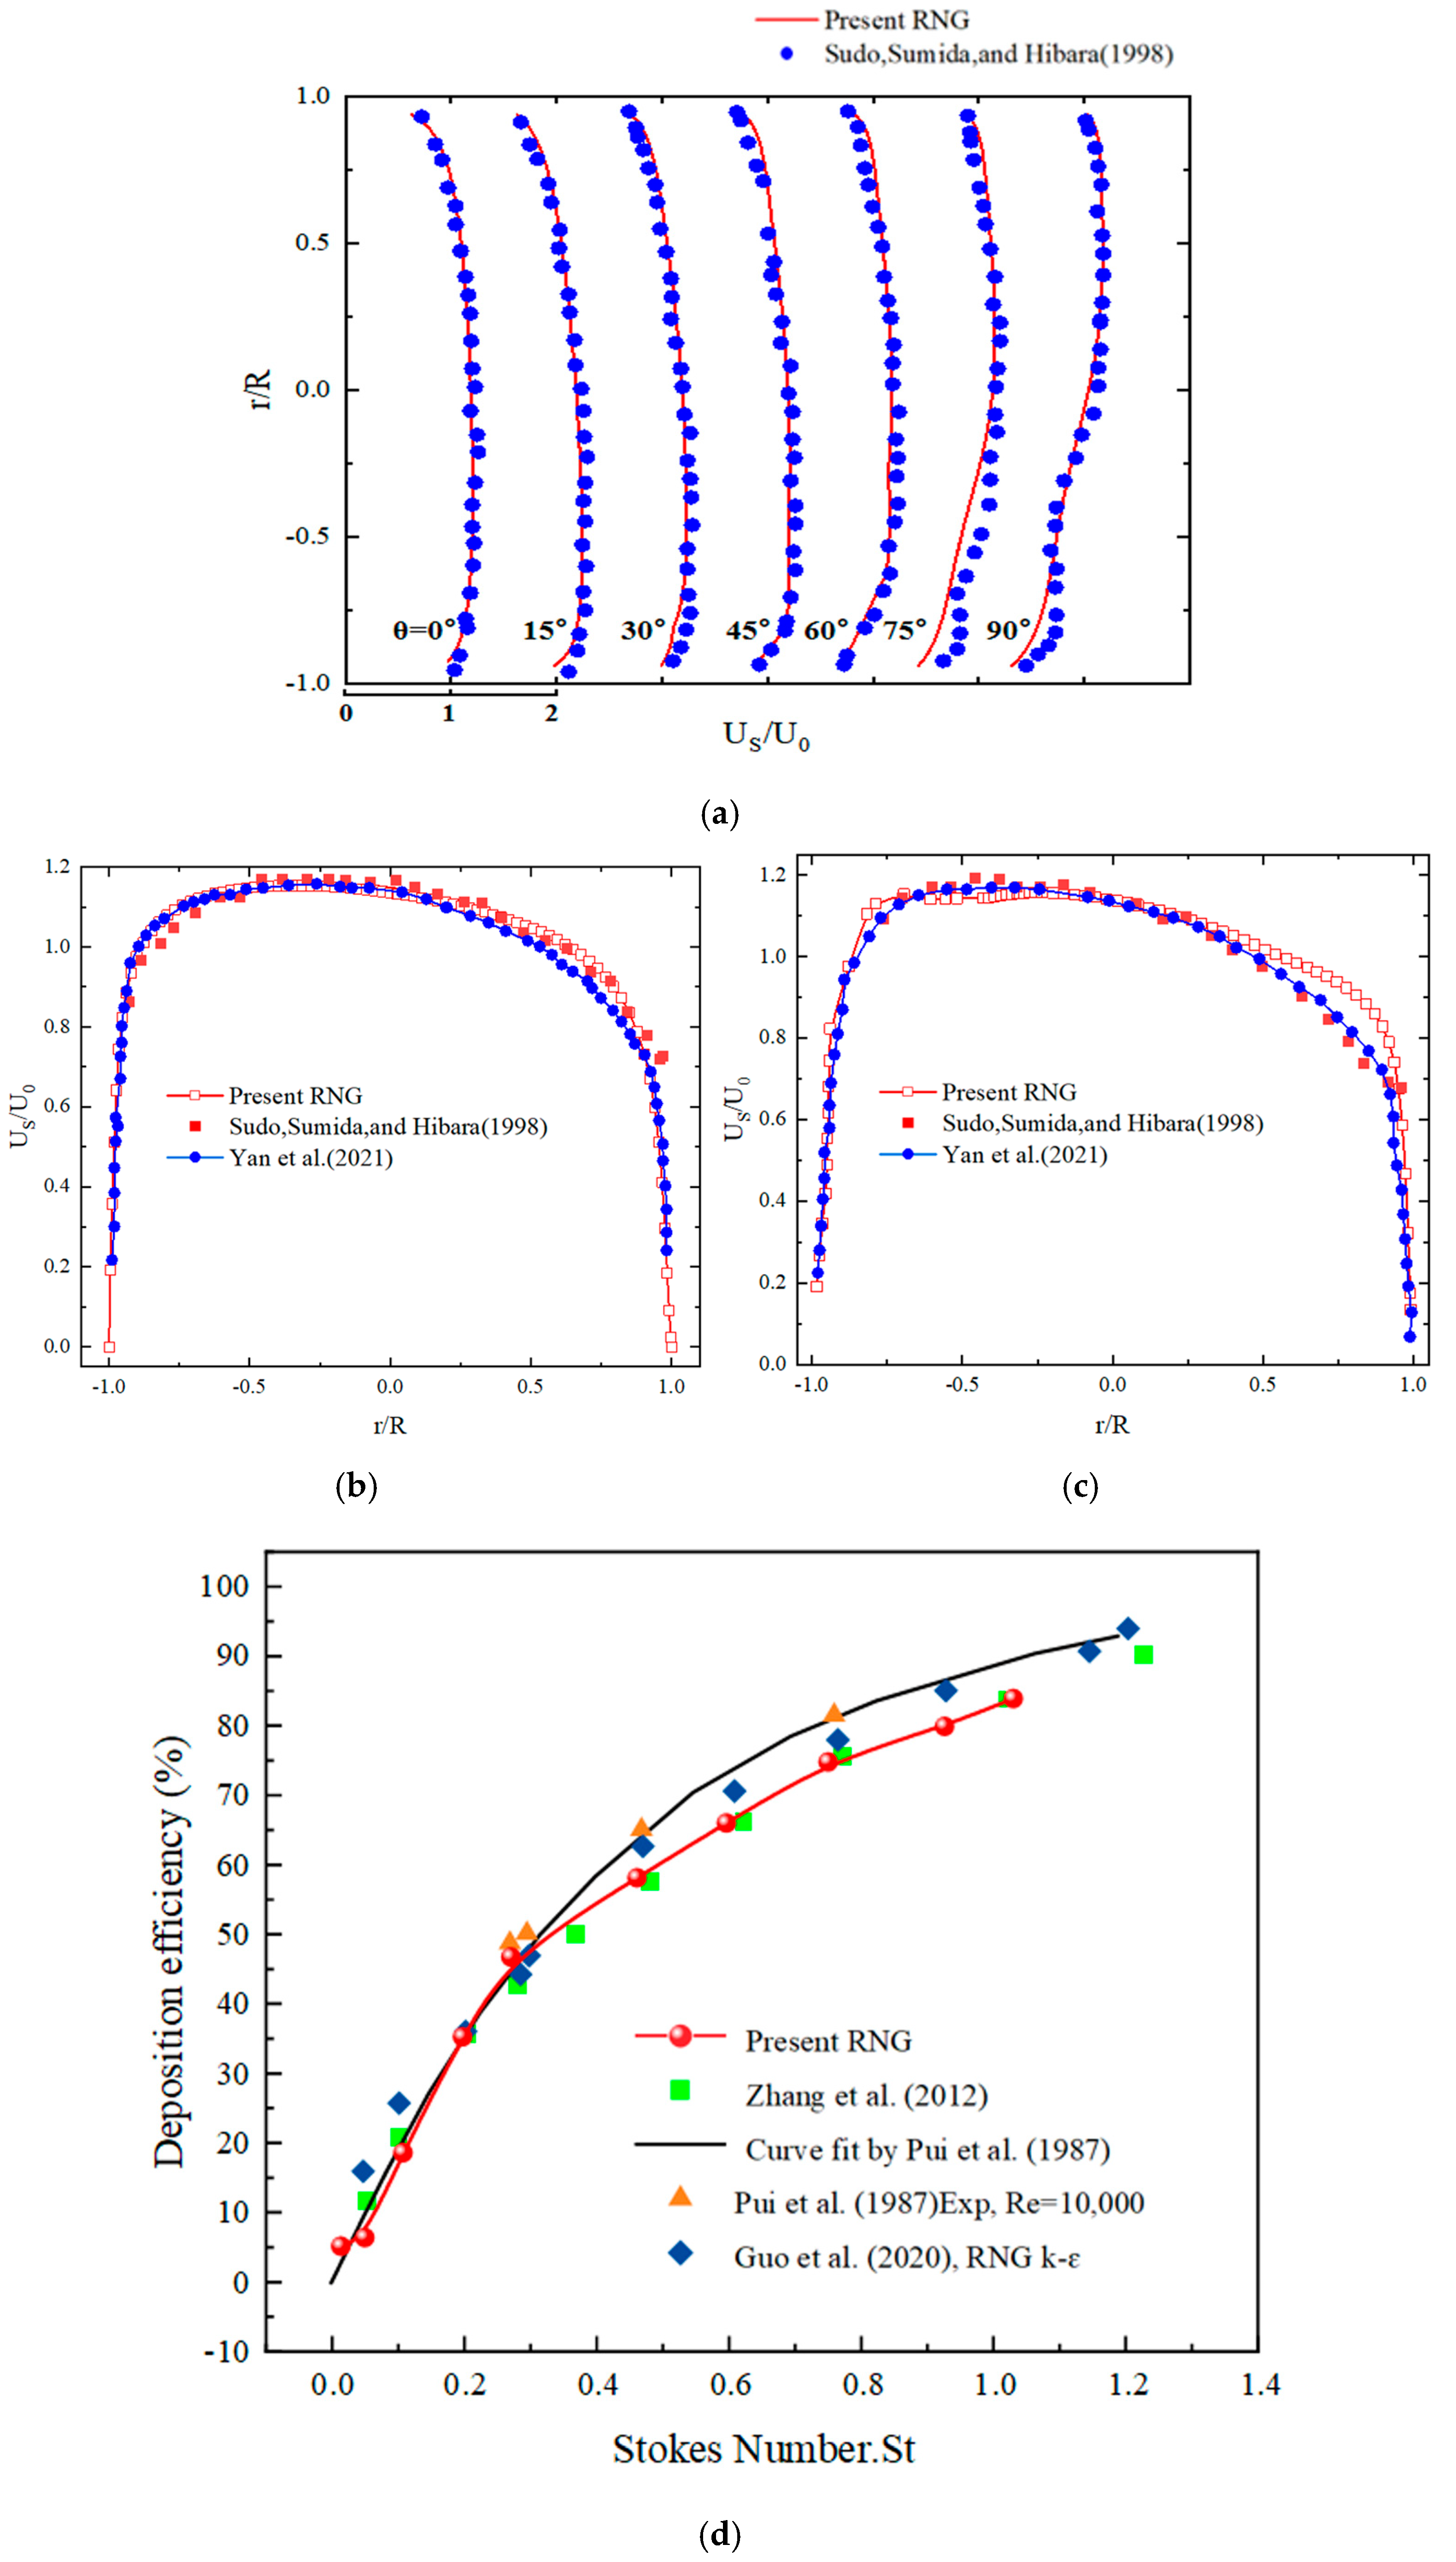
The flow field in the bent pipe was numerically verified to guarantee the study’s correctness. First, we validated the simulated flow field in the bent pipe, confirming the velocity distribution across cross-sections at different angles. The dimensionless average flow velocity at various cross-sections of the bent pipe used in this investigation is compared to the experimental results published by Sudo et al. [41] in Figure 4a. Figure 4b and c show comparisons between the experimental data from Sudo et al. and the LES findings from Yan et al. [18] at deflection angles of 0° and 45°, respectively. The parameters used are the inlet velocity U0 and the normalized mean velocity US. Following the completion of flow field numerical simulation validation, particle deposition validation must also be conducted. Using experimental data from Pui et al. [10] and numerical simulations from Zhang et al. [42] and Guo et al. [16], this work verified particle deposition in bent pipes. The impact of the St on particle deposition efficiency was also fitted by Pui et al.:
η = 1 10 0.962 S t × 100 %
As shown in Figure 4d, the results of this study exhibit good fit. By comparing the simulation results with experimental data or other researchers’ simulations, we found that the maximum relative discrepancy in the simulation results did not exceed 10%. This margin of error is considered reasonable for complex flow and particle deposition problems. Therefore, the numerical simulation results obtained in this study are reliable.

4.2. Turbulent Flow Field Analysis

Flow Field Analysis

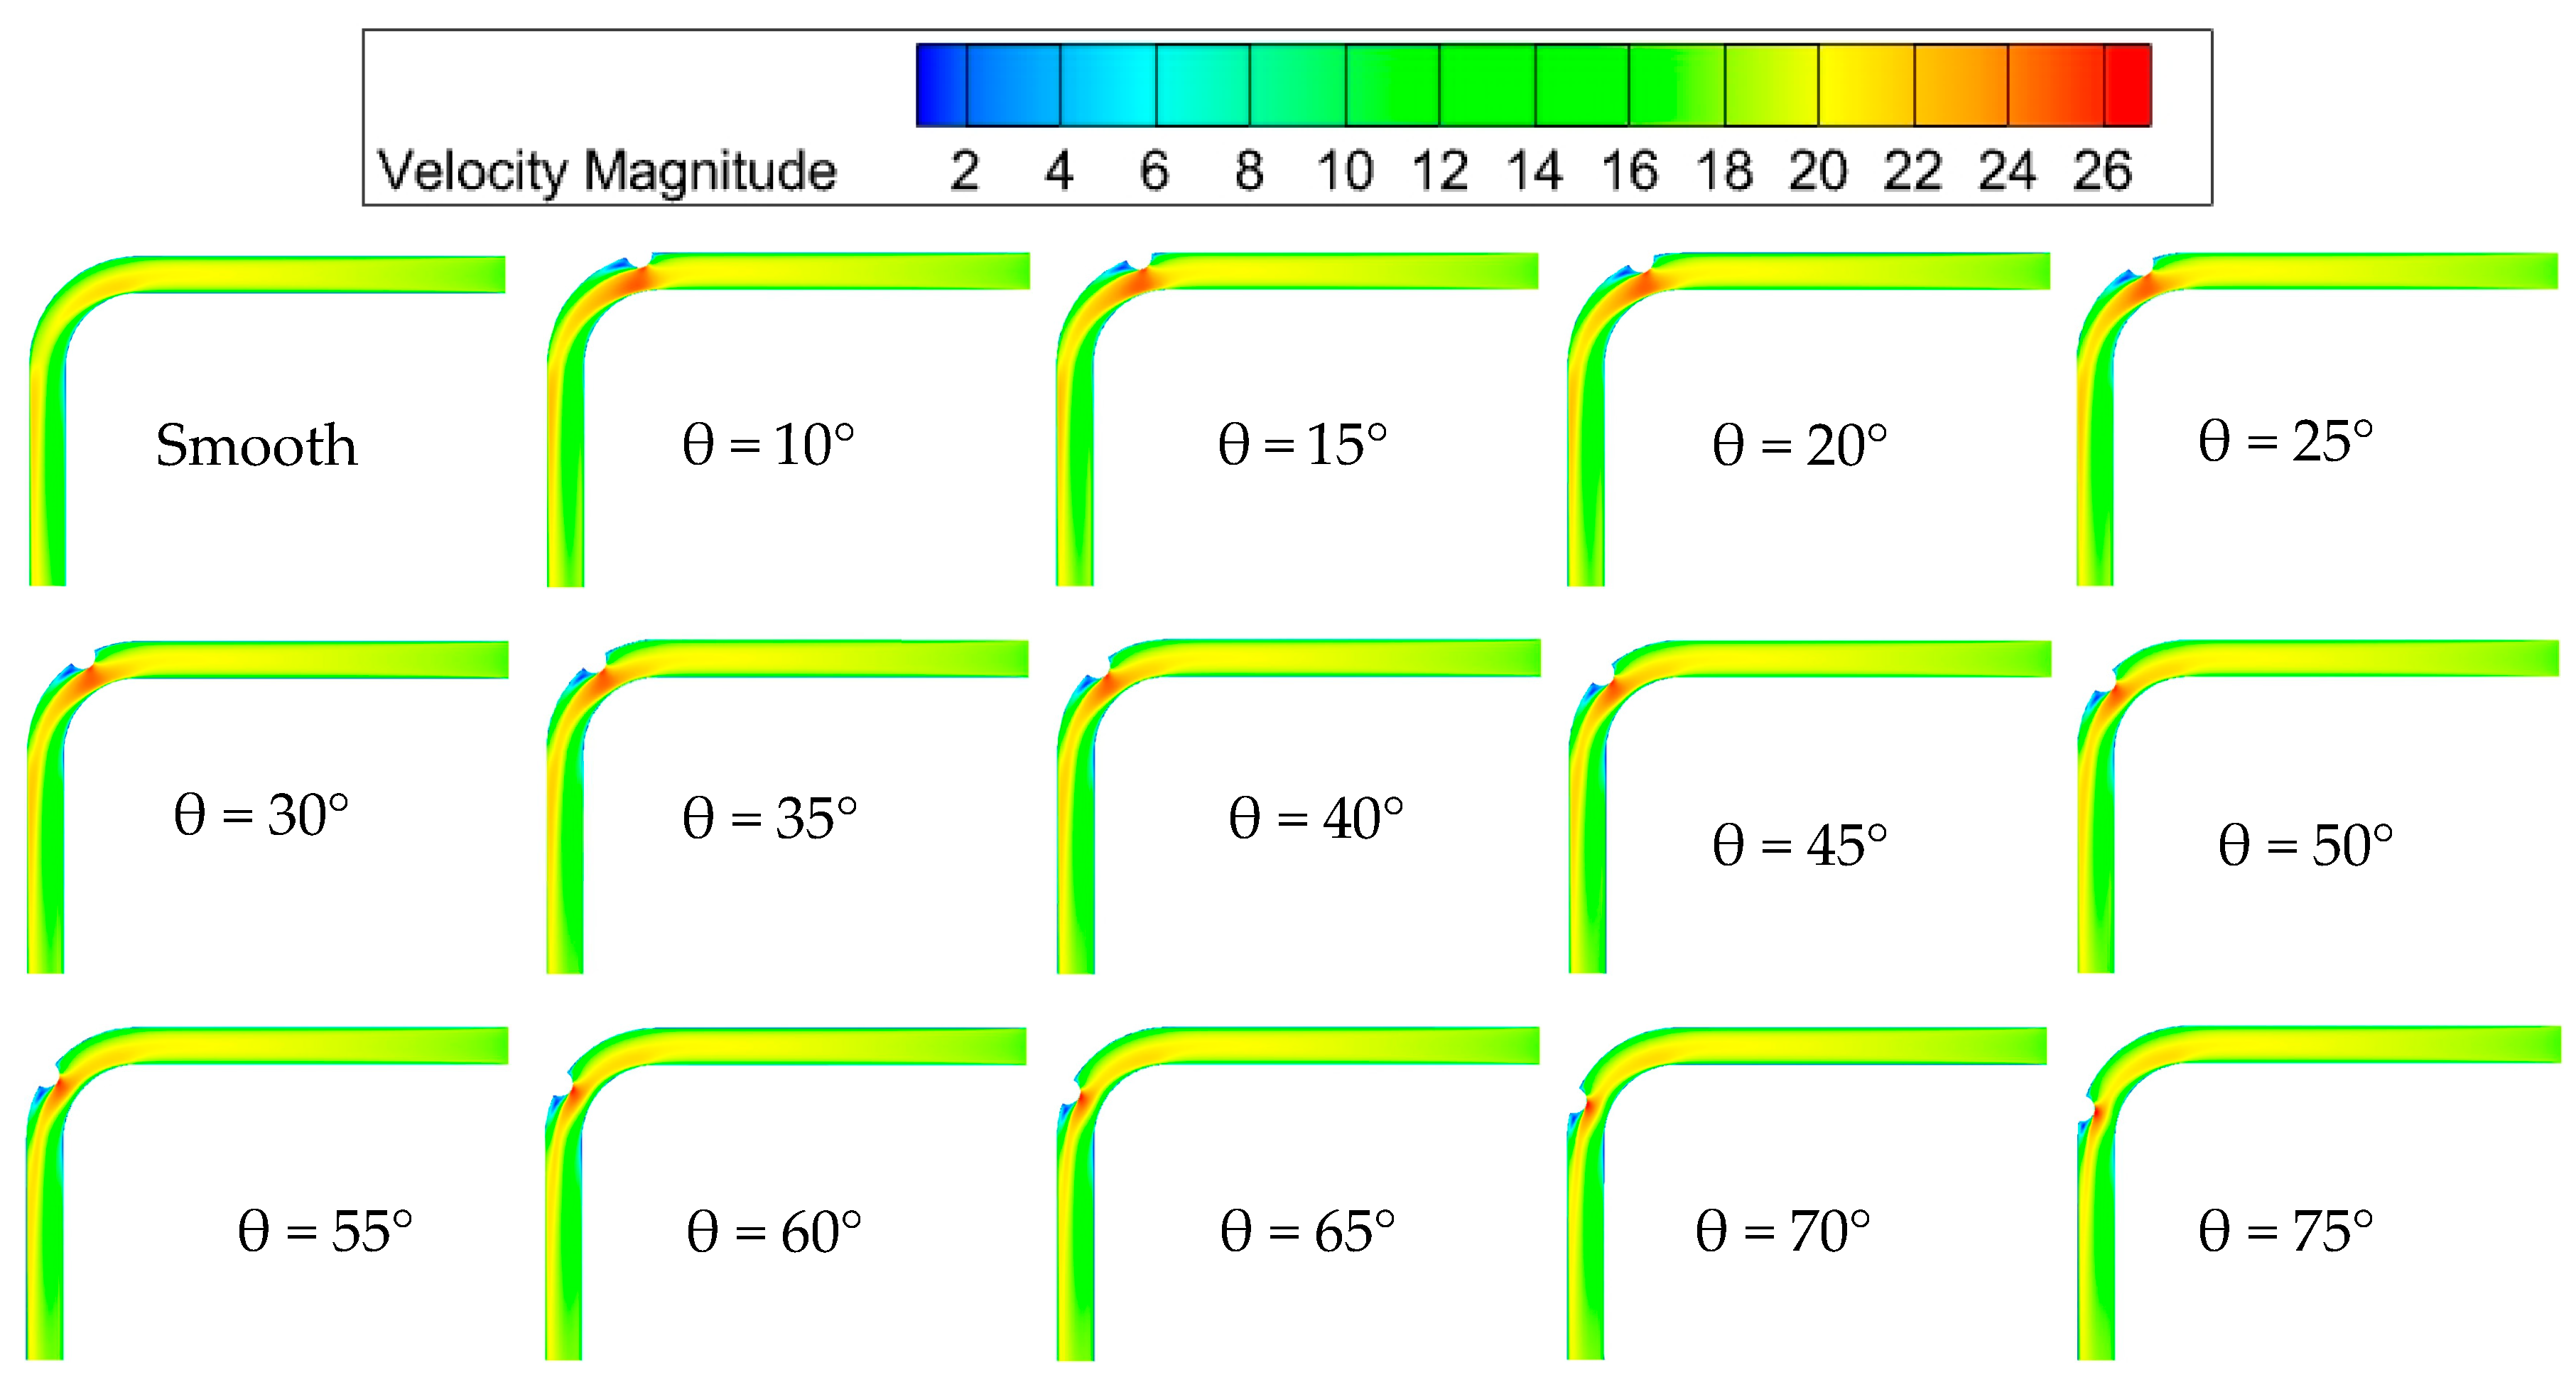
The velocity contour map on the dimple bent channel’s XY plane is displayed in Figure 5. The velocity distribution is impacted by the existence of dimple structures, as seen in Figure 5. As θ increases, the extent of high-velocity regions in the flow field gradually diminishes. This occurs because, close to the end of the bend segment, the high-velocity area of the flow field contracts toward the pipe’s center. The presence of dimple structures leads to the formation of vortices. The vortex diffuses high-momentum fluid from the high-velocity outer region toward the pipe center and the low-velocity inner region, further promoting the development of a uniform flow pattern in the main flow zone. Additionally, regions with very low flow velocities exist on the leeward side of the dimples, which can affect particle deposition within the dimpled bent channel. Compared to smooth bend channel, bent channels with dimples exhibit high-velocity flow regions beneath the dimple structures. This is due to the presence of dimple structures, which reduce the cross-sectional area of the internal passage, thereby causing an increase in velocity. Here, the maximum airflow velocity in the flow field is observed.
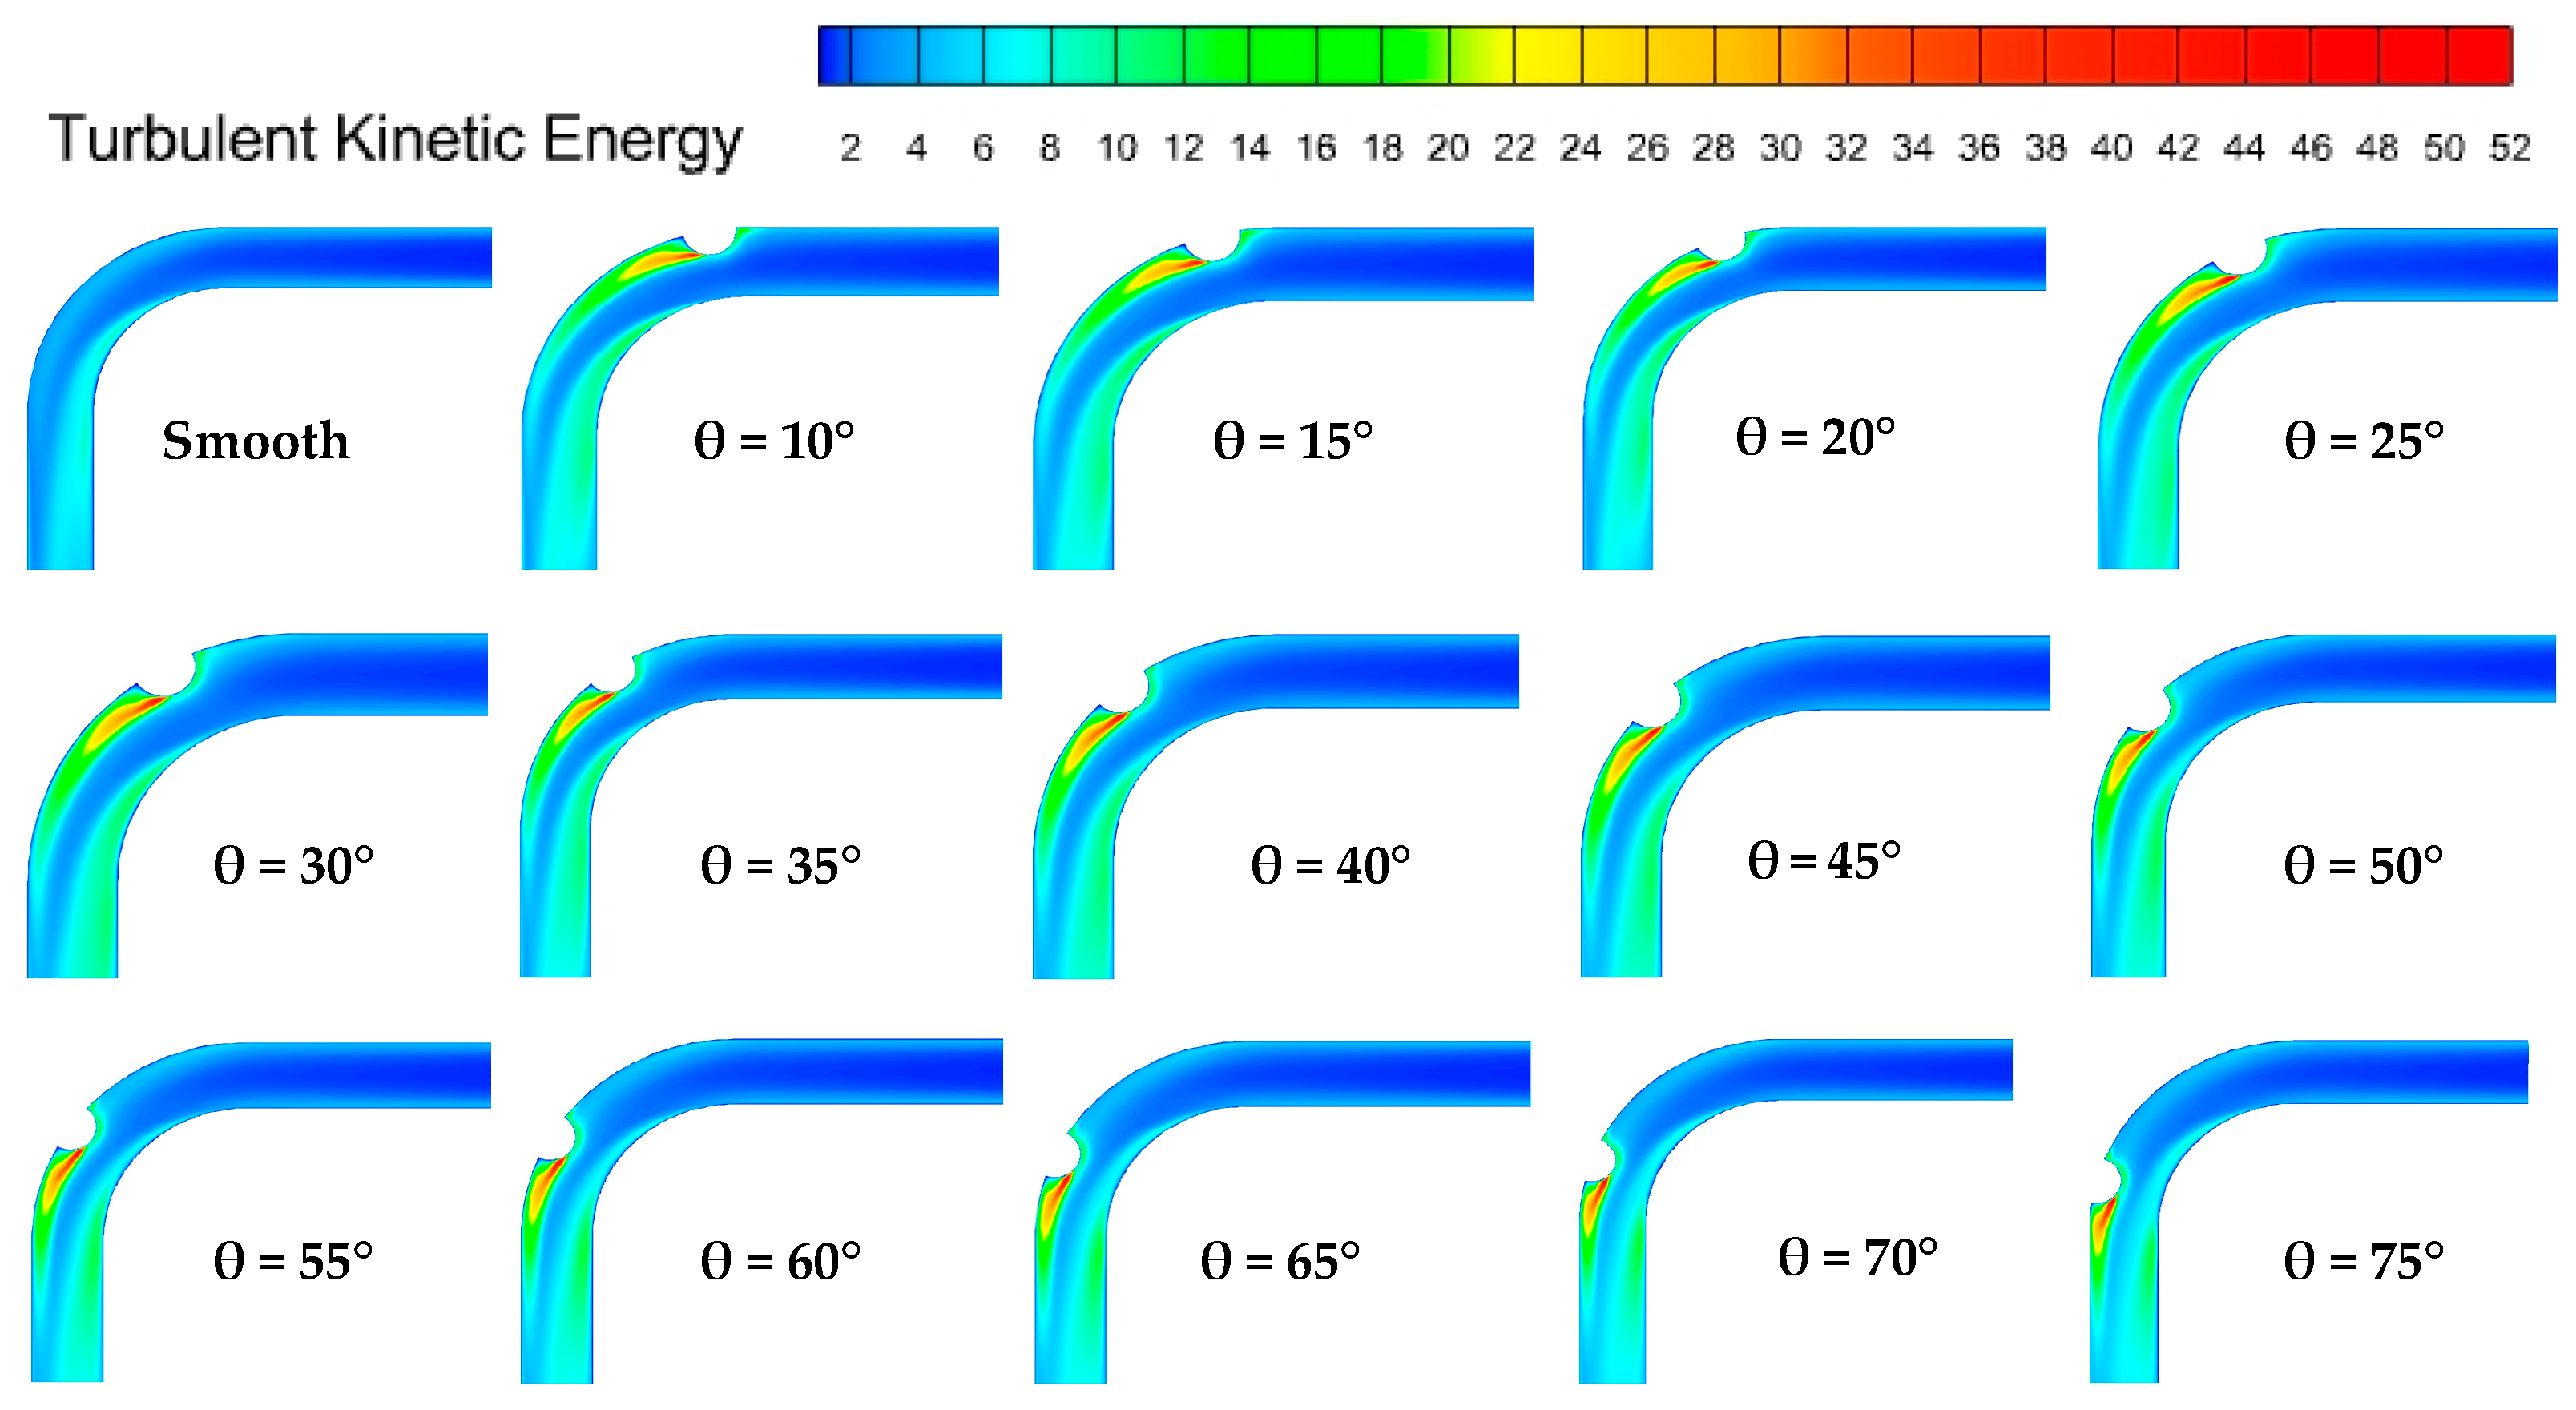
The TKE contour map of the XY plane for the dimpled bend duct is shown in Figure 6. It can be seen that the presence of dimple structures causes significant fluctuations in the TKE values within the channel. On the windward side of the dimple, the TKE value is relatively low, but it is slightly elevated compared to a smooth channel. On the leeward side of the dimple, there exists a distinct region with high TKE values. This is due to the presence of induced vortices in both regions, resulting in strong vortex clusters. Vortex structures in both regions influence particle deposition, with those on the leeward side exerting a greater effect, as demonstrated in the results below. Figure 7 shows the velocity field streamlines in the XY plane. Streamline diagrams are shown only for smooth bent pipe, pipes with θ = 10°, θ = 45°, and θ = 75°. The presence of dimple structures can be seen to complicate the flow field. A smaller vortex exists on the windward side of the dimple structure, while a larger vortex is present on the leeward side, both of which influence the deposition of small particles.
The pressure at various pipeline cross-sections is examined in Figure 8. In both the horizontal and vertical sections of the bent pipe, the pressure drop exhibits nearly identical trends. In the bend section, behind the dimple structure, the pressure drop increases significantly due to the vortex formation on the leeward side of the dimple. After passing through the high-pressure drop zone, the pressure in the bend section rises, gradually returning to a pressure profile consistent with that of a smooth pipe. It can be seen that compared to smooth bent pipes, bent pipes with dimpled structures result in higher pressure drop values.
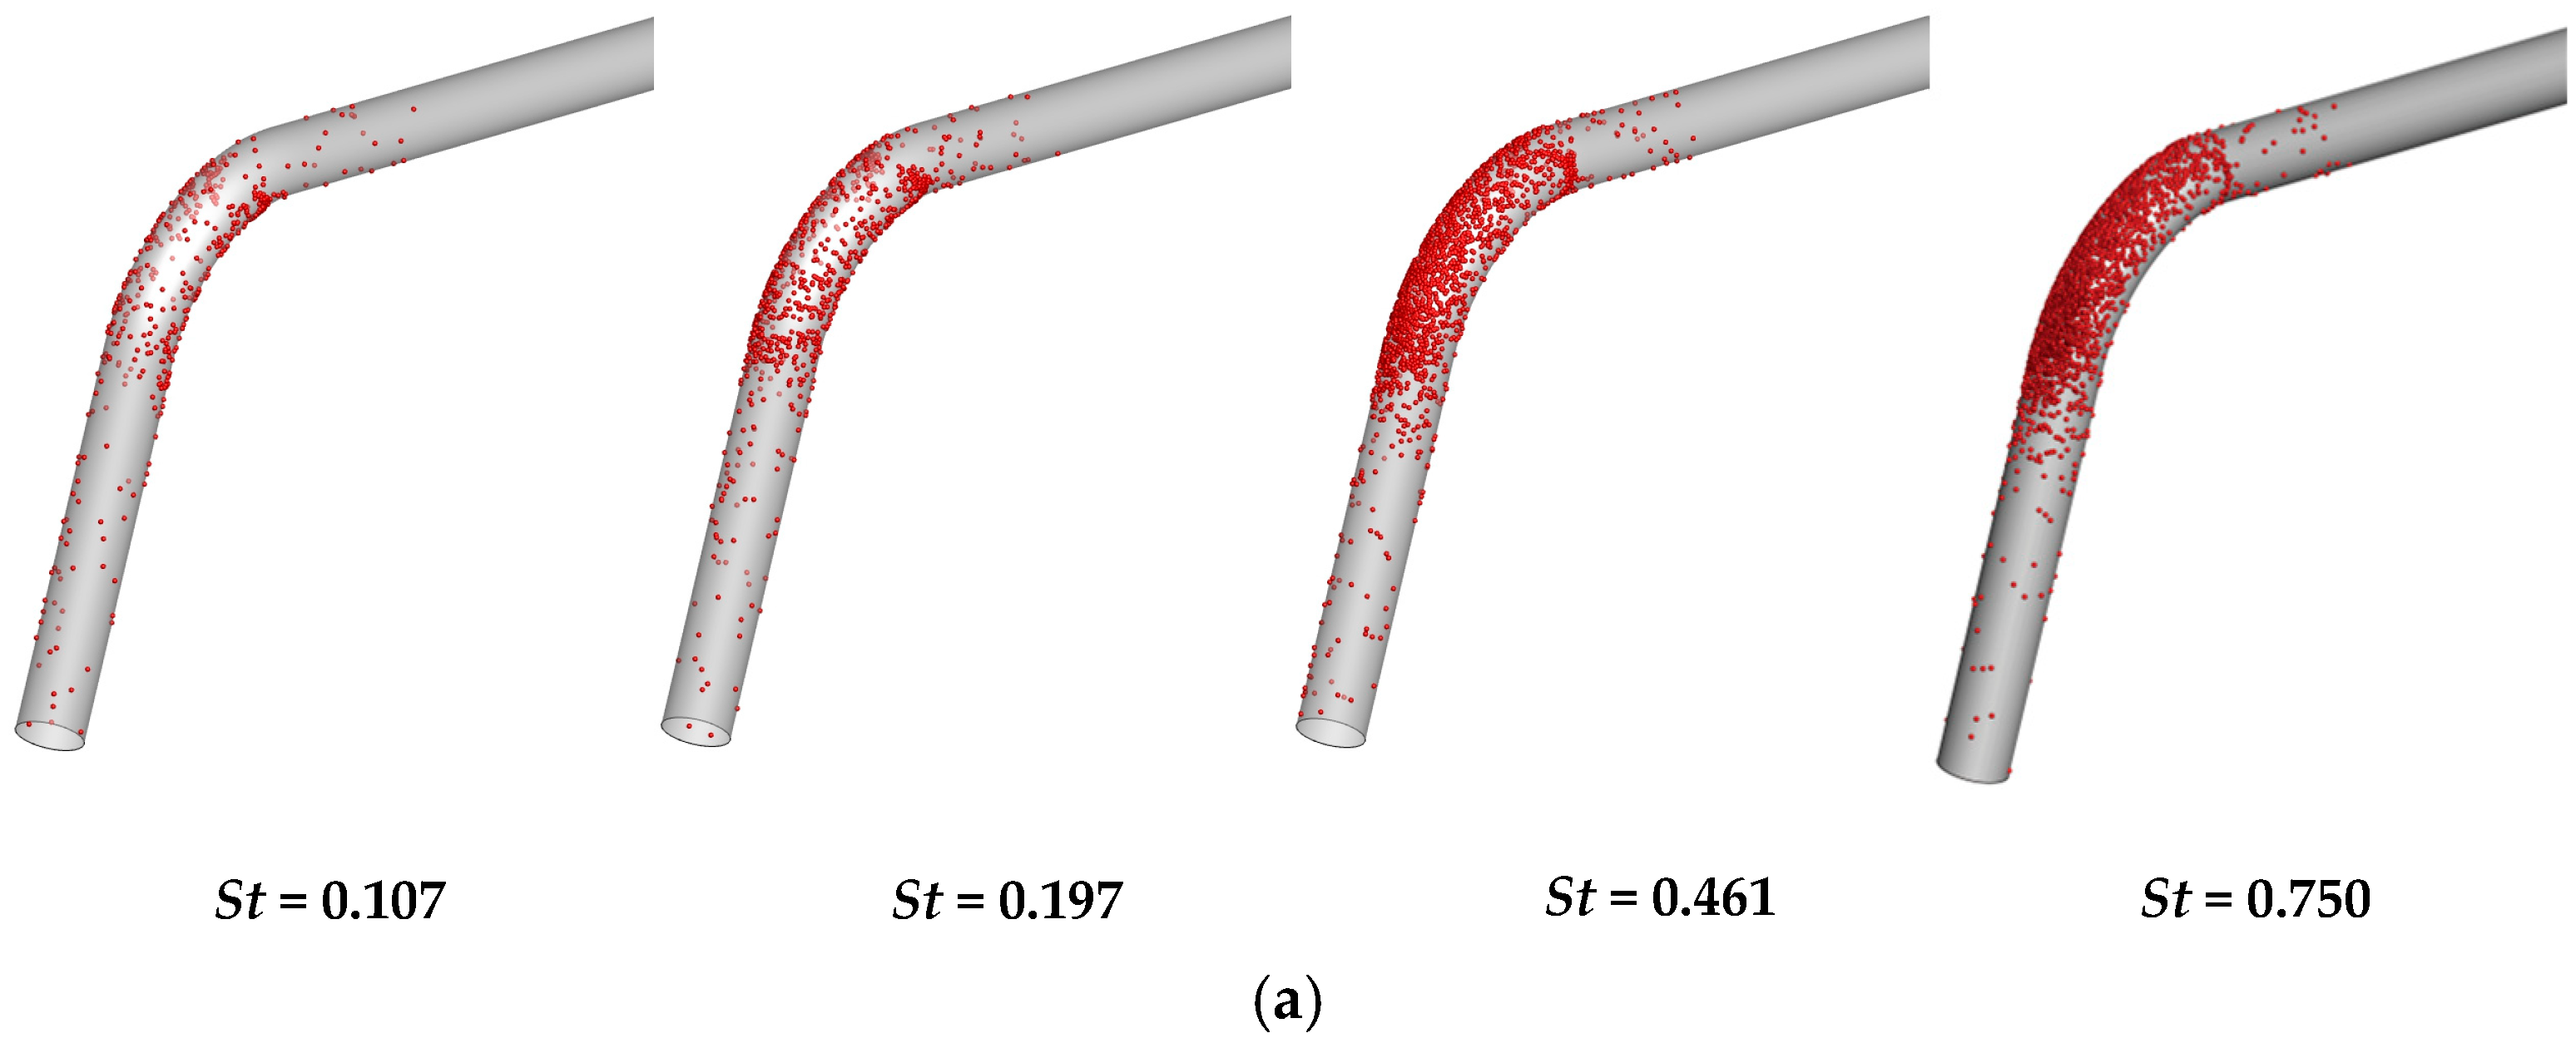
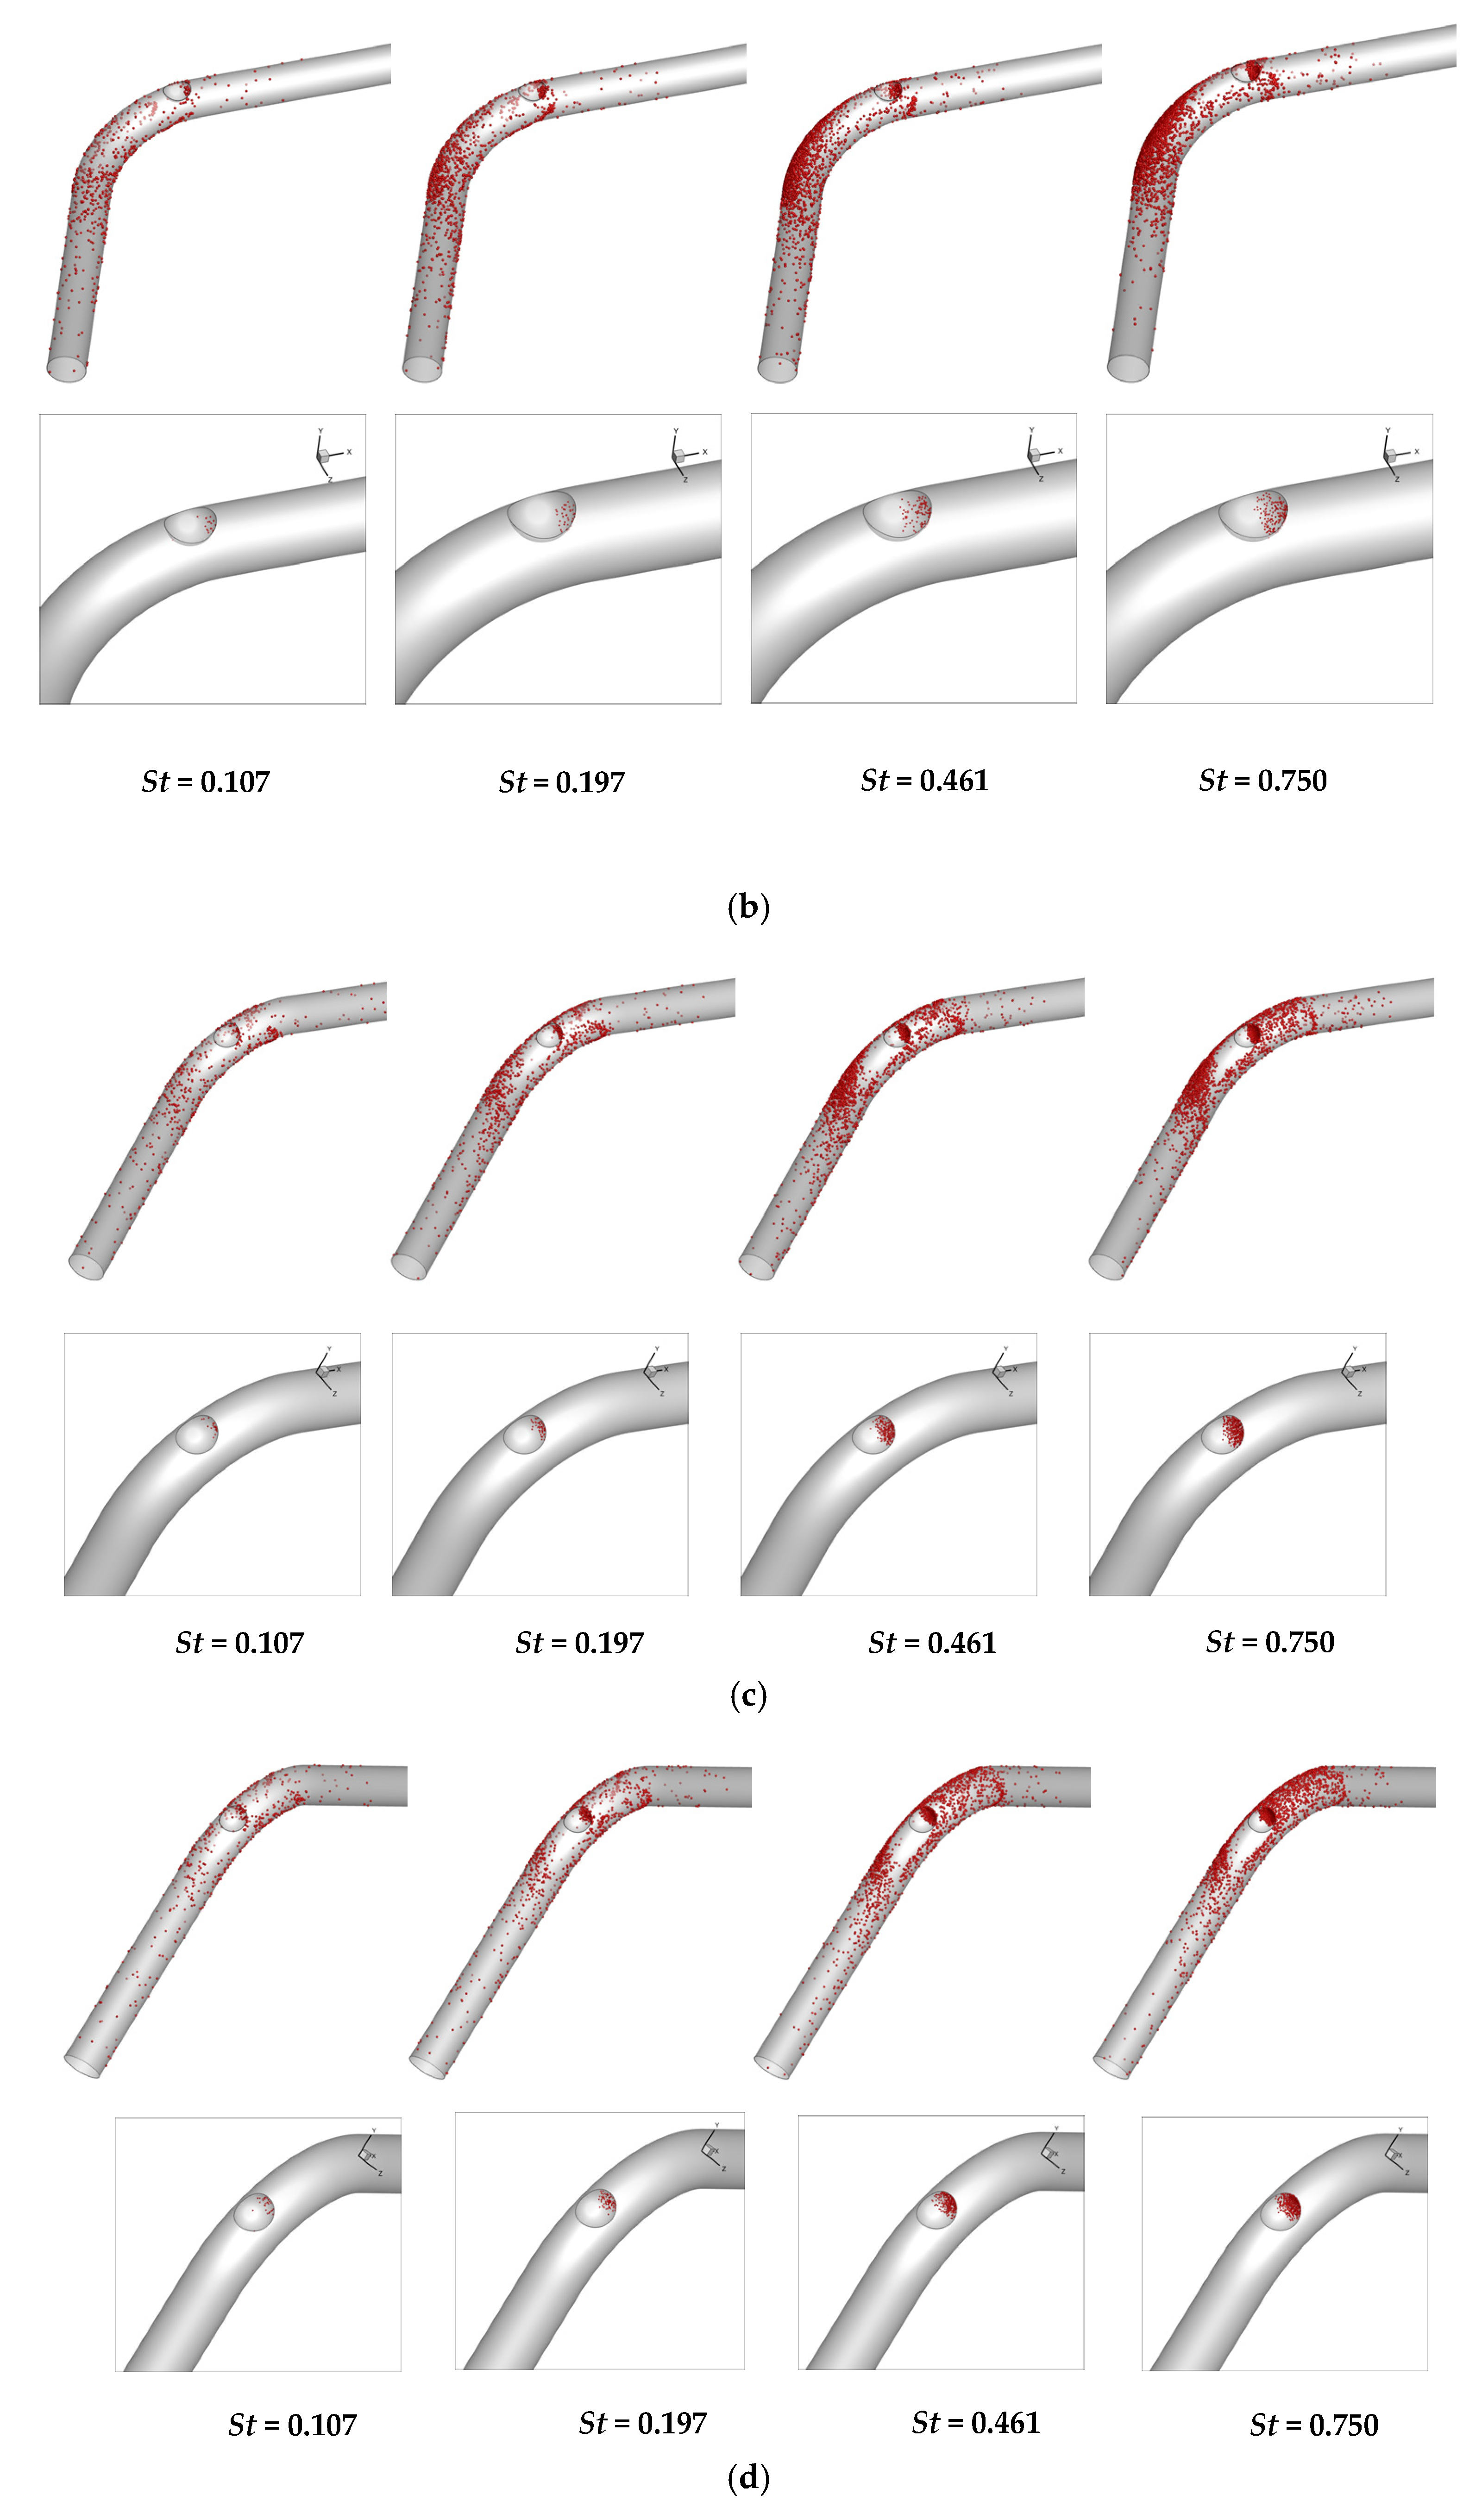
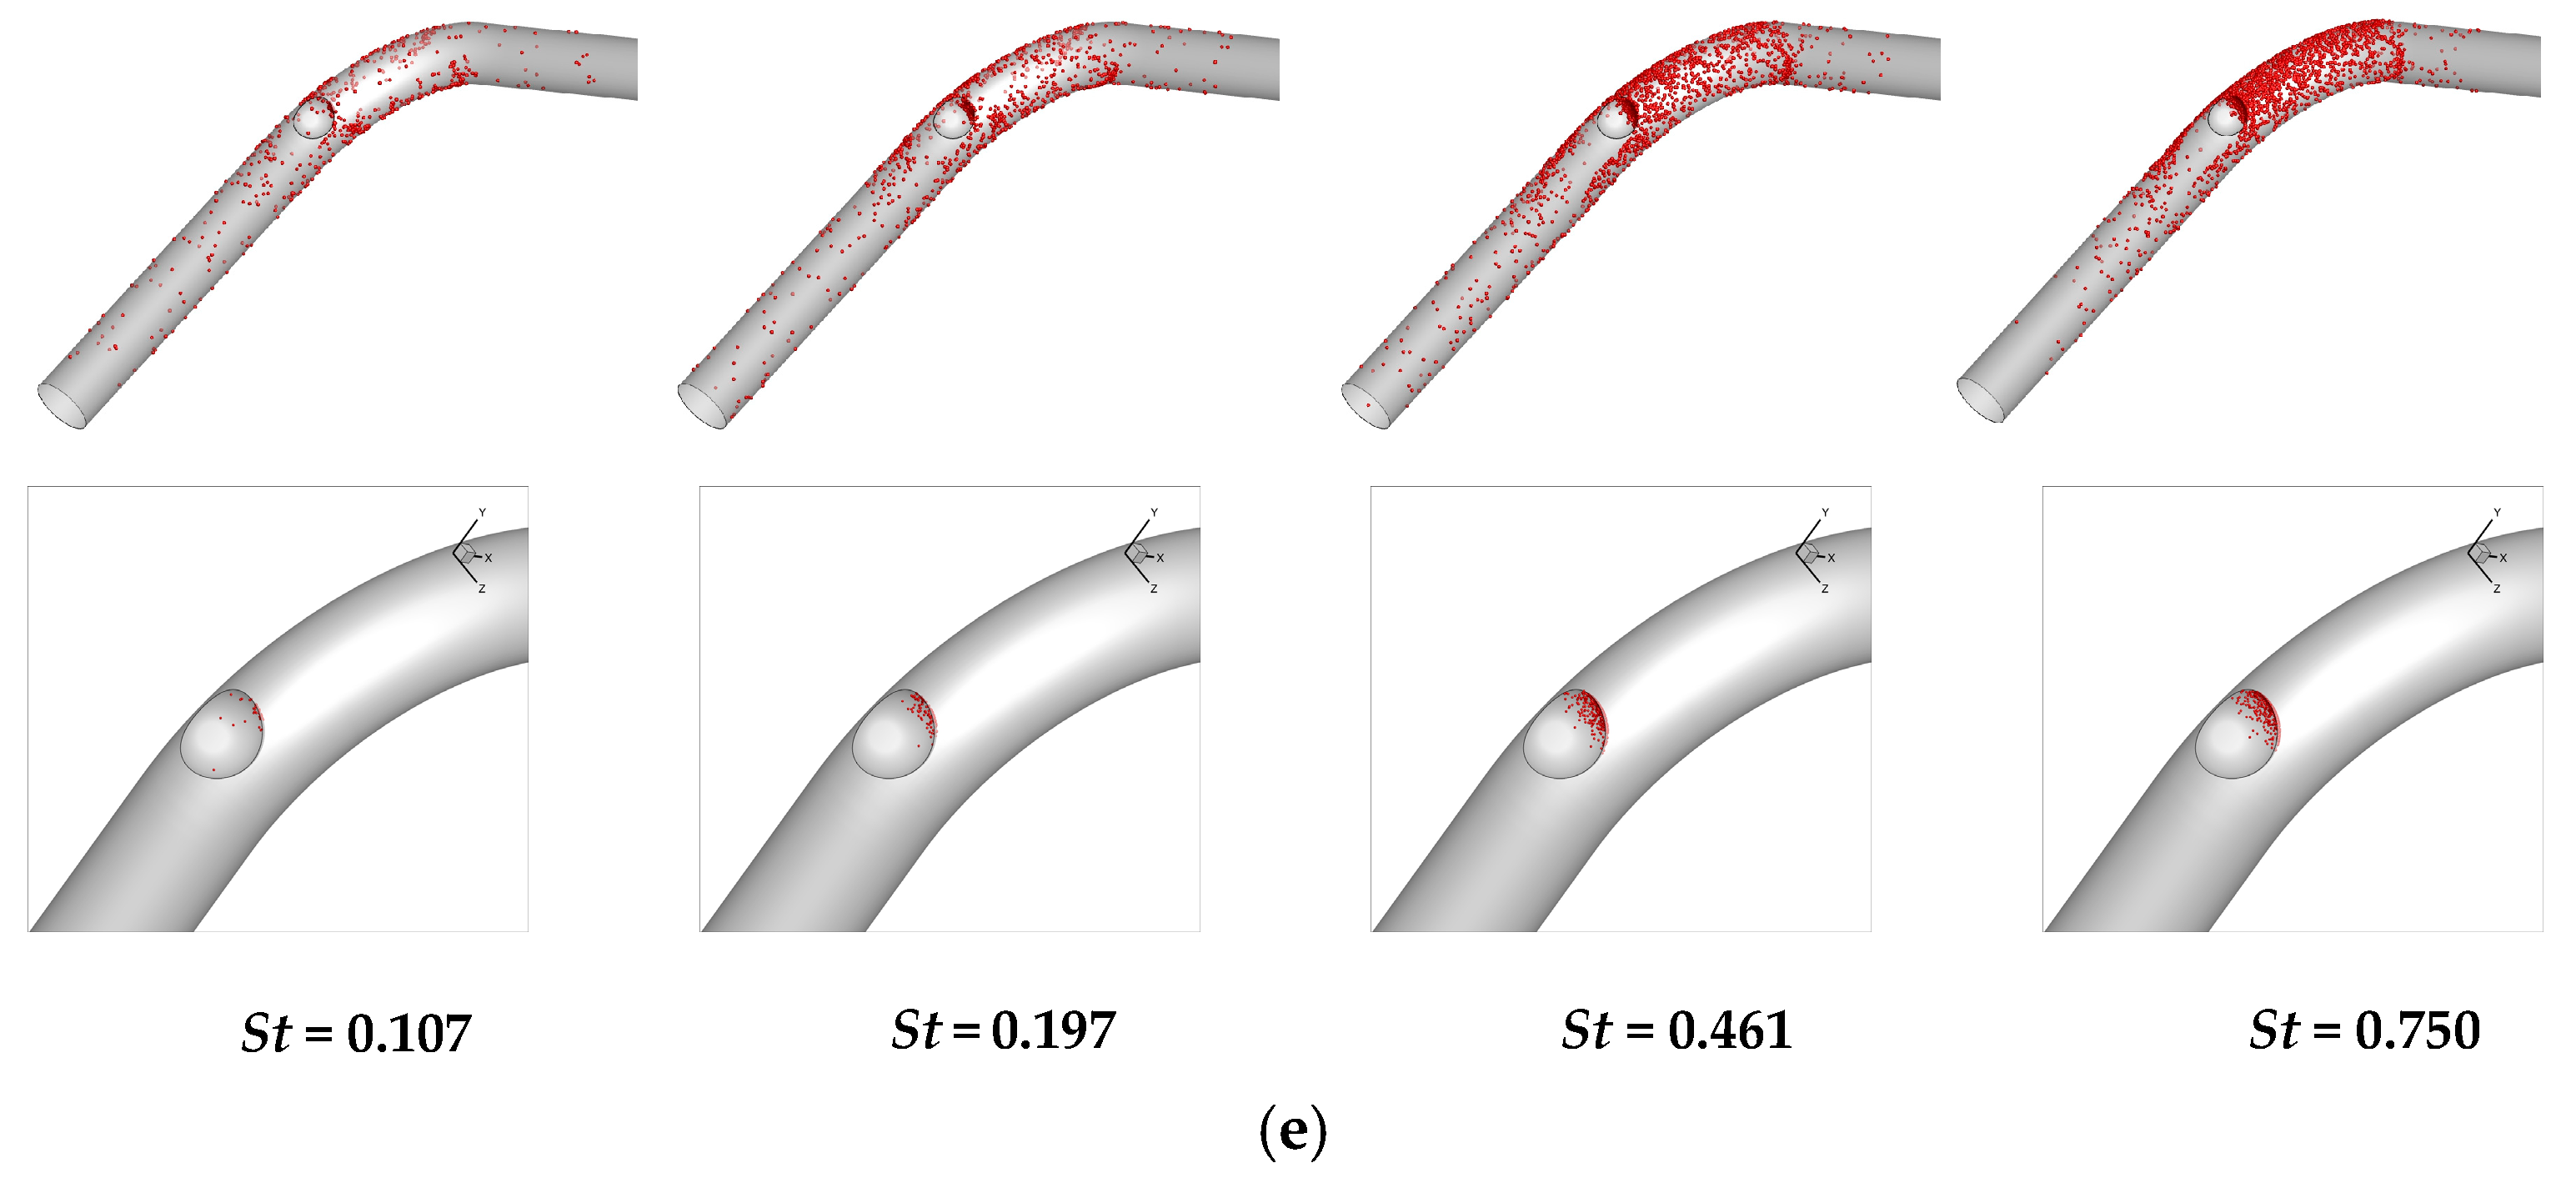
The deposition patterns of particles of varying sizes in dimpled bent channels are displayed in Figure 9. Among them, a, b, c, d, and e represent the deposition patterns of particles with different sizes on smooth bent channels and dimples at 10°, 45°, 60°, and 75° positions.
When St = 0.107, the particle mass is relatively small, making it less affected by inertia and more likely to follow the flow of the gas stream. Due to the high flow velocity in the main channel, most particles leave the bent channel without depositing. Because of secondary flow, a tiny amount is caught by the side walls. When dimple structures are present, the deposition location of particles changes. In addition to depositing on the side walls, some particles also accumulate on the windward side of the dimples. Because tiny particles follow the streamlines due to their low inertia. When encountering obstacles (dimple structures), these particles are partially intercepted and deposited on the windward side of the dimple structures.
As particle size increases, when St = 0.197, the inertia of the particles remains relatively low. However, compared to when St = 0.107, the deposition location of particles begins to change, with more particles accumulating on the bend section of the bend. When St = 0.461, the particles no longer closely follow the flow. At this point, the primary factors influencing particle deposition location are particle inertia and centrifugal force. Under the influence of centrifugal force, particles in the mainstream region are propelled toward the outer wall surface of the bend and ultimately captured by the wall. In the dimpled structure of the bent pipe, more particles are deposited on the windward side of the dimpled structure at this time. On the lower surface and leeward side of the dimple structure, very little particle deposition occurs. Additionally, areas with minimal sedimentation appeared on the leeward side of the hollow. This is attributed to the presence of strong vortices and turbophoresis effects in this region. This effect describes the migration of inertial particles along the turbulent kinetic energy gradient within turbulence, propelling particles toward regions of lower turbulent intensity where they aggregate. The vortex blows away the particles that should be present here.
When St = 0.75, the deposition quantity of particles continues to increase, with particles primarily depositing on the outer bend section of the bend. The primary sedimentation mechanism is dominated by the combined effects of inertia and centrifugal force. For bent tubes incorporating dimple structures, these results remain consistent. However, depending on the location of the dimple structure, the amount of particle deposition varies. When the dimple is at θ = 60°, the maximum number of particles are deposited on the dimple wall surface. This is because this area experiences greater sedimentation in the bent pipe section. Due to the presence of dimple structures that trap particles, the dimple walls in this region accumulate the highest concentration of particle deposits.
Therefore, the reason why deposition patterns differ between bent tube channels with dimple structures and smooth bent tube channels may be: 1. The windward surface of the dimple structure is regarded as an obstacle in the flow field that intercepts particles and causes them to settle. 2. The lee side of the dimple structure exhibits a blank zone of particle deposition due to the combined effects of vortex clusters and turbophoresis. 3. The deposition location of particles in the bend changes, as the presence of dimple structures alters the deposition position in the bend section of the bend. Additionally, the dimple structure can function as a sacrificial component, protecting other areas of the bend from direct particle impact.
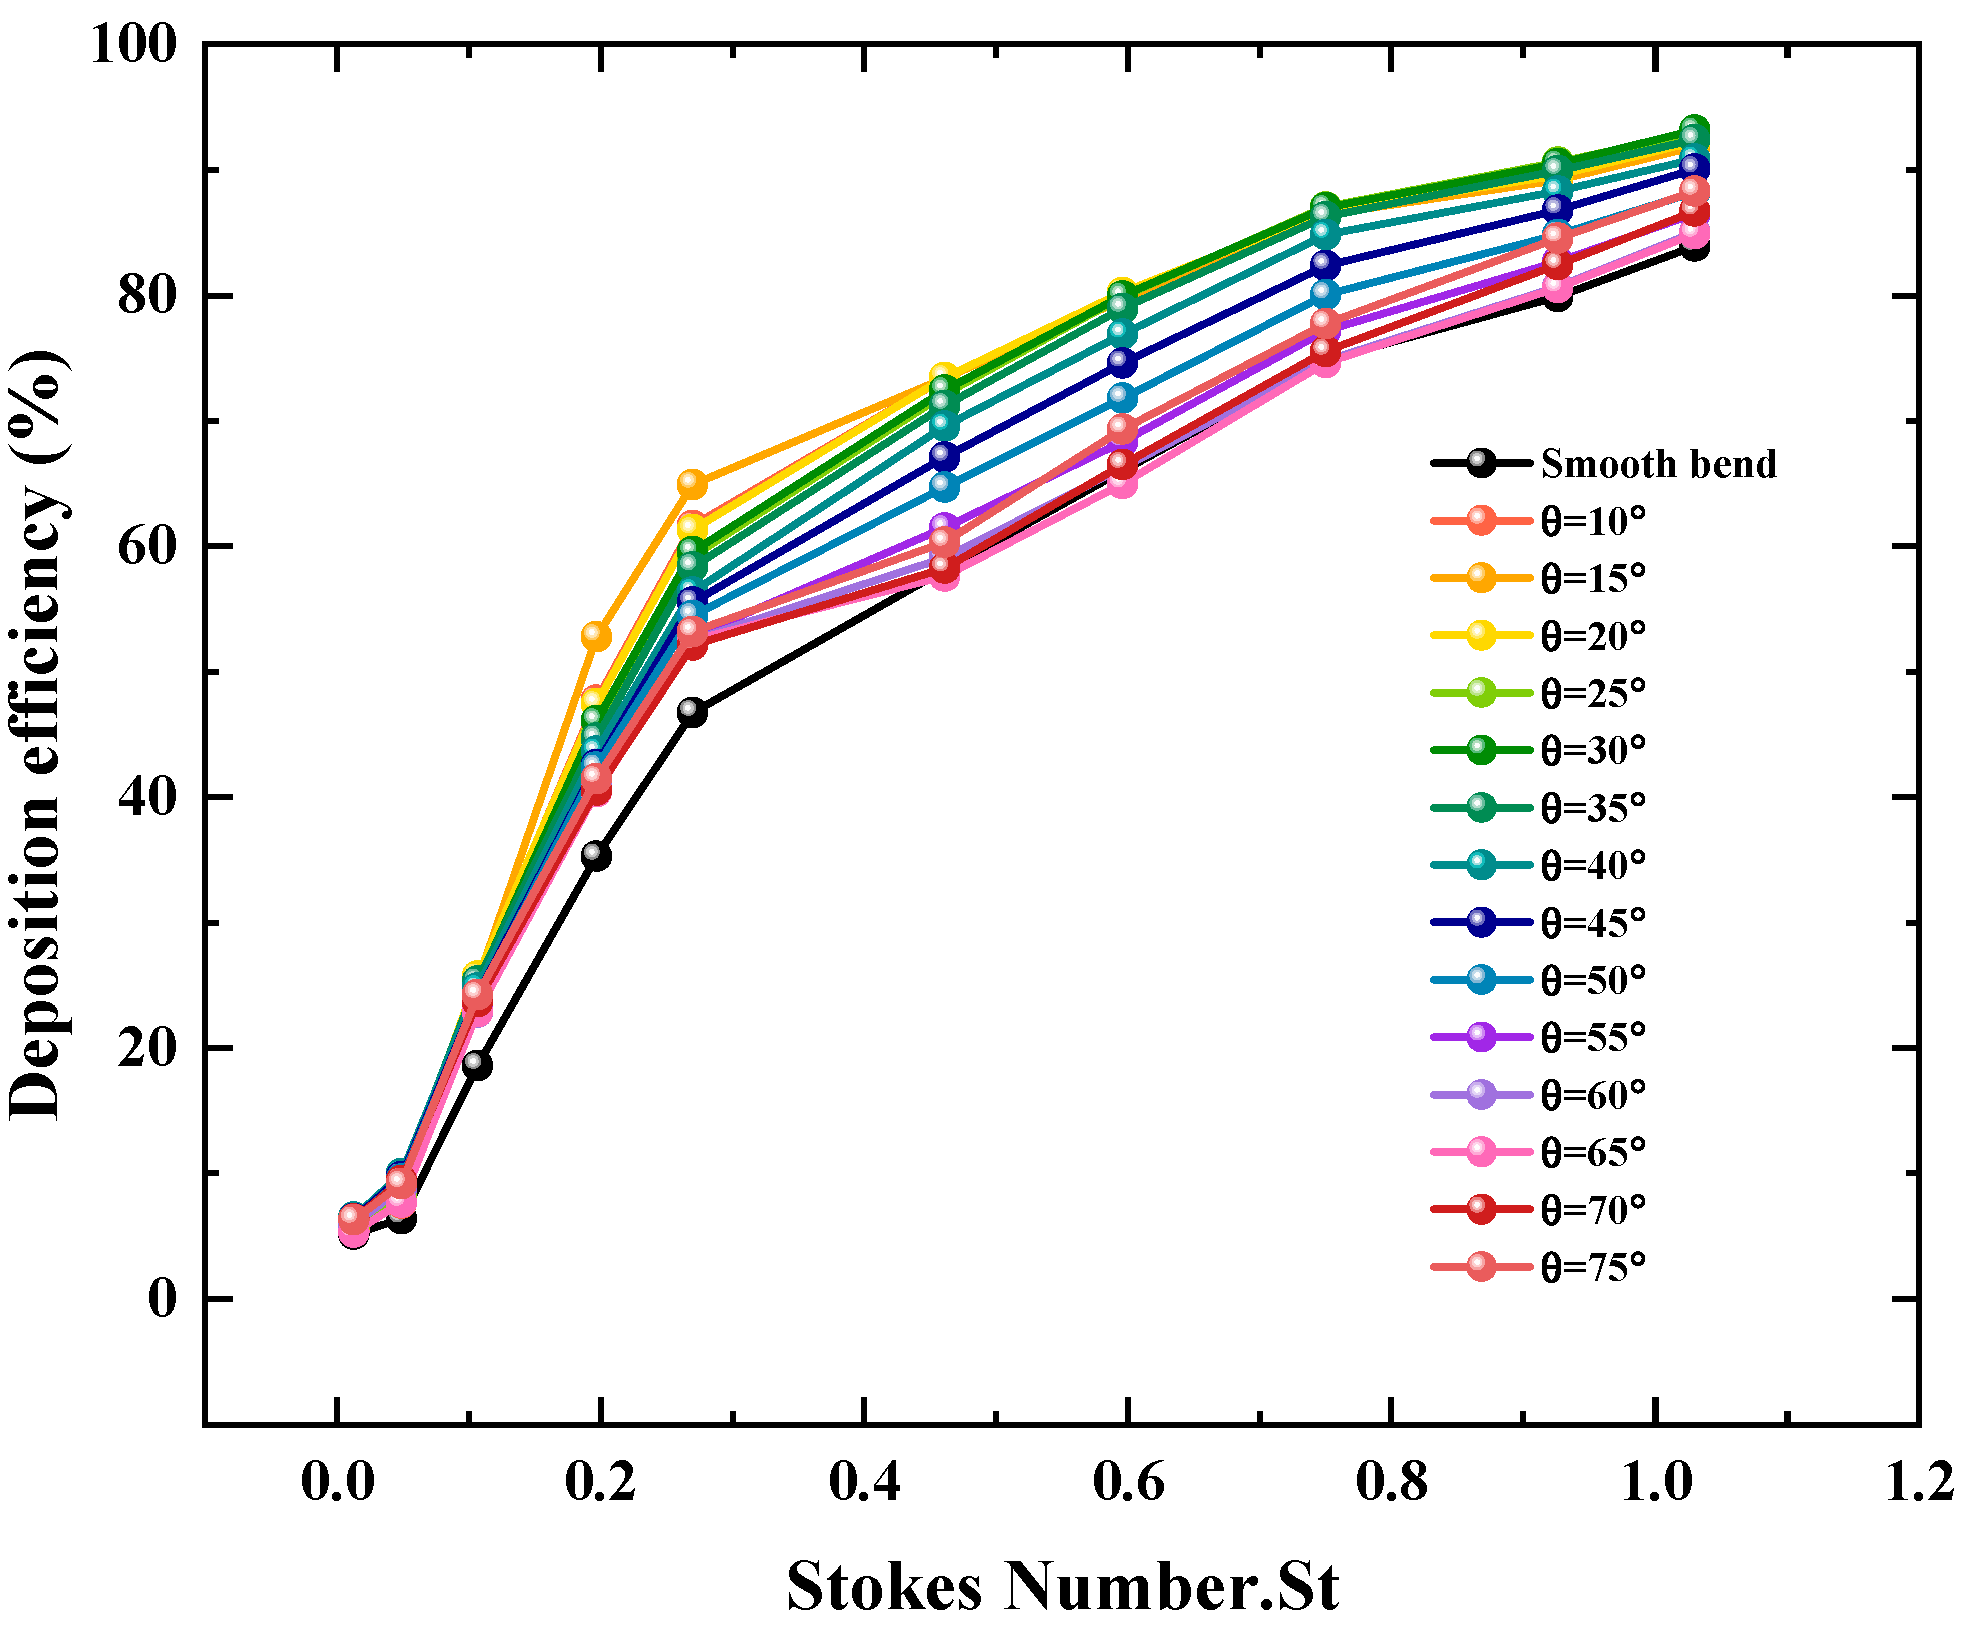
To determine the effect of dimple structure location on particle deposition efficiency, we positioned the dimple structures at different points along the bend section, installing them with angles ranging from 10° to 75°. Figure 10 shows the particle deposition rates for smooth bent pipes and bent pipes with dimple structures at different positions. It can be seen that the presence of dimple structures directly affects the sedimentation efficiency of particles. At θ = 10°, particle deposition rates were high across all particle size ranges in this study. For operating conditions where St ≤ 0.27, an installation angle θ = 15° for the dimple yields the most effective improvement in particle deposition rate. Compared to smooth bent tubes, the deposition rate increased by 17.495% and 18.2% at St = 0.197 and 0.27, respectively. For operating conditions where St ≥ 0.461, the optimal angle is θ = 30°. At this angle, the deposition rate increased by 14.126% and 13.46% at St = 0.461 and 0.596, respectively. When θ < 40°, the overall particle deposition rate shows little change, exhibiting a gradual downward trend. As θ increases between 40° and 65°, the particle deposition rate gradually decreases. At θ = 65°, the deposition rate is the lowest. When St is 0.461, 0.596, and 0.75, the particle deposition rate decreases by 0.7%, 1.5%, and 0.6%, respectively, compared to the smooth bend. This is because in smooth bend pipe channels, particles primarily settle in the outer bend rear section of the bend due to inertial and centrifugal forces. The presence of dimple structures affects the flow field configuration within the bend pipe and results in regions with minimal particle deposition on the leeward side of the dimple structures. More particles that should have settled here were intercepted or prevented from settling by the dimple structure. When θ > 65°, the deposition rate of the dimpled bend begins to increase as the installation angle increases. This is because particles that should not have settled are intercepted by the dimple structure, leading to an increased deposition rate. Overall, the presence of dimple structures leads to an increase in deposition rates. However, if it is necessary to protect a specific section of the bend pipe structure from excessive impact, dimple structures can be added to the front section of that part.

5. Limitations

A unidirectional coupled discrete-phase model is used in this investigation. In this case, it is assumed that the particles are affected by the gas flow, while the flow field remains unaffected in return. This assumption is reasonable for low particle concentrations but may lead to inaccuracies in more dense particulate flows where bidirectional coupling becomes significant. Because every particle is represented as a perfect sphere, drag and motion calculations are made easier. It might not, however, correctly depict how irregularly shaped dust particles behave in real duct settings. Furthermore, this study did not account for particle–particle collisions and agglomeration effects, which can influence deposition distributions under conditions of high particle concentration or significant resuspension. In summary, the findings of this study are applicable to the analysis of deposition patterns for low-concentration, monodisperse spherical particles in gas–solid two-phase flow through curved pipes. To enhance the model’s applicability to complex real-world operating conditions, future research should take into account non-spherical particle morphologies, bidirectional coupling, elastoplastic behaviour and particle interactions. Furthermore, the effects of surface roughness and humidity will be taken into account to enhance the model’s realism and applicability, as well as the impact of introducing dimple structures on erosion in the bent section of the pipe.

6. Conclusions

This study employed the RNG model and DPM model to investigate particle deposition characteristics in a 90° circular bent channel featuring dimple structures. A UDF program was used to create a particle collision rebound model, which was then applied to the CFD model. Grid independence, velocity, and particle deposition verifications were used to guarantee the study’s correctness. The following conclusions were reached:
(1)
The formation of dimple structures leads to vortex generation, resulting in a complex flow field within the dimpled channels. A high TKE region forms on the leeward side of the dimple structure. This is due to the presence of induced vortices and strong vortex clusters at this location, which in turn affect particle deposition. Additionally, on the leeward side of the dimple structure, a significant change in pressure drop occurs, attributed to the vortex formation resulting from the dimple effect on the leeward surface.
(2)
The presence of dimple structures affects the sedimentation rate of particles. The deposition rate of dimple structures varies depending on their installation location. For operating conditions where St ≤ 0.27, an installation angle θ = 15° for the dimple yields the optimal effect on enhancing the particle deposition rate, with the maximum deposition rate increasing by 18.2%. For operating conditions where St ≥ 0.461, the optimal angle is θ = 30°, achieving a 14.126% increase in the maximum deposition rate. When θ < 40°, the overall deposition rate remains largely unchanged. When θ ranges between 45° and 65°, the particle deposition rate decreases significantly as θ increases, reaching its lowest value at θ = 65°. At this point, when St is 0.461, 0.596, and 0.75, the particle deposition rate decreases by 0.7%, 1.5%, and 0.6%, respectively, compared to the smooth bend. When θ > 65°, the deposition rate on the bend begins to increase as the installation angle increases. Channels incorporating this structure can be applied to removal or air purification equipment.
(3)
The presence of dimple structures influences the deposition location of particles. The windward side of the dimple structure acts as an obstacle within the channel, intercepting and depositing incoming particles at this location. On the leeward side and bottom surface of the dimple structure, there is very little particle deposition. The dimple structure can serve as a sacrificial component, absorbing direct impacts from particles and protecting the rest of the bend.

Author Contributions

Conceptualization, Z.W.; Methodology, Z.H.; Software, Z.W.; Validation, Z.W.; Formal analysis, Z.W.; Investigation, Z.H.; Resources, Z.W.; Data curation, Z.H.; Writing—original draft, Z.W.; Writing—review & editing, H.L.; Visualization, Z.W.; Supervision, H.L.; Project administration, H.L.; Funding acquisition, H.L. All authors have read and agreed to the published version of the manuscript.

Funding

The authors appreciate financial supports provided by the Tianshan Talent Training Program of Xinjiang-Science and Technology Innovation Team (2023TSYCTD0009), Xinjiang Key Research and Development Project–Departmental and Local Linkage Project (No. 2025B04049-002) and National Natural Science Foundation of China (No. 52266017).

Data Availability Statement

There is no new data in this study.

Conflicts of Interest

The authors declare no conflict of interest.

Nomenclature

C C Cunningham correction factor
C d drag coefficient
d p diameter of dust particle (μm)
D Pipe diameter (m)
E s Young’s moduli of channel wall (Gpa)
E p Young’s moduli of the particle (Gpa)
F D Drag force (N)
F G Gravitation and buoyancy (N)
g gravitational acceleration (m/s2)
G k turbulent kinetic energy generated by the mean velocity gradient
k turbulent kinetic energy (m2/s2)
Keffective stiffness parameter
m p particle mass
N d The number of deposited particles
N 0 The total number of released particles
p ¯ Average pressure (cm)
R kinematic restitution coefficient
ReReynolds number
S the modulus of the mean strain rate tensor
StStokes number
u c r critical deposition velocity (m/s)
u p particle velocity (m/s)
u friction velocity (m/s)
u ¯ i averaged velocity (m/s)
U 0 average flow velocity (m/s)
U s normalized mean flow velocity (m/s)
v kinetic viscosity of air
ν s Poisson’s ratios of the channel wall
ν p Poisson’s ratios of the particle
V d particle deposition velocity
V d + dimensionless particle deposition velocity
y + dimensionless distance from the wall
ε dissipation rate of turbulent kinetic energy
ρ p density of particle (kg/m3)
ρ g density of fluid (kg/m3)
τ D particle relaxation time
τ s system response time
ς random number that follows a normal distribution
η deposition rate of particles
λ mean free path of air
μdynamic viscosity
μ e f f effective dynamic viscosity
μ t turbulent viscosity

References

  1. Erraghroughi, F.Z.; Bah, A.; El Maakoul, A.; Abdellah, A.B. Numerical Assessment of Particle Deposition Reduction in Turbulent Bend Pipe Flow with a Rib Insertion. Int. J. Heat Fluid Flow 2024, 106, 109290. [Google Scholar] [CrossRef]
  2. Chen, Q. Ventilation Performance Prediction for Buildings: A Method Overview and Recent Applications. Build. Environ. 2009, 44, 848–858. [Google Scholar] [CrossRef]
  3. Hofmann, W. Modelling Inhaled Particle Deposition in the Human Lung—A Review. J. Aerosol Sci. 2011, 42, 693–724. [Google Scholar] [CrossRef]
  4. Lu, H.; Lu, L. CFD Investigation on Particle Deposition in Aligned and Staggered Ribbed Duct Air Flows. Appl. Therm. Eng. 2016, 93, 697–706. [Google Scholar] [CrossRef]
  5. Zhan, F.; Zhuang, D.; Ding, G.; Tang, J. Numerical Model of Particle Deposition on Fin Surface of Heat Exchanger. Int. J. Refrig. 2016, 72, 27–40. [Google Scholar] [CrossRef]
  6. Li, A.; Ahmadi, G.; Bayer, R.G.; Gaynes, M.A. Aerosol Particle Deposition in an Obstructed Turbulent Duct Flow. J. Aerosol Sci. 1994, 25, 91–112. [Google Scholar] [CrossRef]
  7. Lai, A.C.K. Modeling Indoor Coarse Particle Deposition onto Smooth and Rough Vertical Surfaces. Atmos. Environ. 2005, 39, 3823–3830. [Google Scholar] [CrossRef]
  8. Lai, A.C.K.; Nazaroff, W.W. Supermicron Particle Deposition from Turbulent Chamber Flow onto Smooth and Rough Vertical Surfaces. Atmos. Environ. 2005, 39, 4893–4900. [Google Scholar] [CrossRef]
  9. Lu, H.; Wang, Y. Particle Deposition in Ventilation Ducts: A Review. Build. Simul. 2019, 12, 723–734. [Google Scholar] [CrossRef]
  10. Pui, D.Y.H.; Romay-Novas, F.; Liu, B.Y.H. Experimental Study of Particle Deposition in Bends of Circular Cross Section. Aerosol Sci. Technol. 1987, 7, 301–315. [Google Scholar] [CrossRef]
  11. Peters, T.M.; Leith, D. Particle Deposition in Industrial Duct Bends. Ann. Occup. Hyg. 2004, 48, 483–490. [Google Scholar] [CrossRef]
  12. Li, Q.; Song, J.; Li, C.; Wei, Y.; Chen, J. Numerical and Experimental Study of Particle Deposition on Inner Wall of 180° Bend. Powder Technol. 2013, 237, 241–254. [Google Scholar] [CrossRef]
  13. Kadia, S.; Larsson, I.A.S.; Billstein, M.; Rüther, N.; Lia, L.; Pummer, E. Investigating Supercritical Flow Characteristics and Movement of Sediment Particles in a Narrow Channel Bend Using PTV and Video Footage. Adv. Water Resour. 2024, 193, 104827. [Google Scholar] [CrossRef]
  14. Wu, F.; Yu, C.; Yu, J.; Zhou, S.; Fan, Z.; Xu, R. Experimental Study on Particle Deposition Behavior in Air Supply Ducts of a High-Speed Train. Build. Environ. 2025, 269, 112494. [Google Scholar] [CrossRef]
  15. Sun, K.; Lu, L.; Jiang, H. A Numerical Study of Bend-Induced Particle Deposition in and behind Duct Bends. Build. Environ. 2012, 52, 77–87. [Google Scholar] [CrossRef]
  16. Guo, J.; Chen, Z.; Shen, B.; Wang, J.; Yang, L. Numerical Study on Characteristics of Particle Deposition Efficiency on Different Walls of 90° Square Bend. Powder Technol. 2020, 364, 572–583. [Google Scholar] [CrossRef]
  17. Seyfi, S.; Mirzayi, B.; Seyyedbagheri, H. CFD Modeling of Black Powder Particles Deposition in 3D 90-Degree Bend of Natural Gas Pipelines. J. Nat. Gas Sci. Eng. 2020, 78, 103330. [Google Scholar] [CrossRef]
  18. Yan, Y.; Zhao, Y.; Yao, J.; Wang, C.-H. Investigation of Particle Transport by a Turbulent Flow through a 90° Bend Pipe with Electrostatic Effects. Powder Technol. 2021, 394, 547–561. [Google Scholar] [CrossRef]
  19. Yan, Y.; Mortimer, L.F.; Wolde, B.; Fairweather, M.; Zhao, Y.; Yao, J. Effect of Secondary Flow and Wall Collisions on Particle-Laden Flows in 90° Pipe Bends. Int. J. Multiph. Flow 2024, 179, 104925. [Google Scholar] [CrossRef]
  20. Ladino, A.; Duque-Daza, C.A.; Lain, S. Effect of Walls with Large Scale Roughness in Deposition Efficiency for 90-Degree Square Bend Configurations. J. Aerosol Sci. 2023, 167, 106093. [Google Scholar] [CrossRef]
  21. Guo, Z.; Zhang, J.; Li, H.; He, H. A Comprehensive Evaluation of the Anti-Erosion Characteristics of Several New Structural Elbows in the Pneumatic Conveying System. Powder Technol. 2022, 412, 117976. [Google Scholar] [CrossRef]
  22. Li, R.; Sun, Z.; Li, A.; Li, Y.; Wang, Z. Design Optimization of Hemispherical Protrusion for Mitigating Elbow Erosion via CFD-DPM. Powder Technol. 2022, 398, 117128. [Google Scholar] [CrossRef]
  23. Zhang, H.; Nunayon, S.S.; Lai, A.C. Performance Evaluation of Flow Resistance and Ultrafine Particle Deposition Enhancement in an Air Duct Equipped with V-Shaped Winglet Vortex Generators. Build. Environ. 2020, 183, 107194. [Google Scholar] [CrossRef]
  24. Lu, H.; Quan, Y. A CFD Study of Particle Deposition in Three-Dimensional Heat Exchange Channel Based on an Improved Deposition Model. Int. J. Heat Mass Transf. 2021, 178, 121633. [Google Scholar] [CrossRef]
  25. Shuvo, M.S.; Sakib, M.N.; Rahman, R.; Saha, S. Particle Deposition and Characteristics of Turbulent Flow in Converging and Diverging Nozzles Using Eulerian-Lagrangian Approach. Results Eng. 2022, 16, 100669. [Google Scholar] [CrossRef]
  26. Han, Z.; Lu, H. Numerical Simulation of Turbulent Flow and Particle Deposition in Heat Transfer Channels with Concave Dimples. Appl. Therm. Eng. 2023, 230, 120672. [Google Scholar] [CrossRef]
  27. Liu, L.; Xi, Y.; Zhang, L.; Xu, W.; Zhao, R.; Liu, Y.; Wang, Z.; Wu, B.; Dong, K. Numerical Study of Particle Deposition Characteristics in a New Type of Reinforced Pipe. Chem. Eng. Process.-Process Intensif. 2023, 189, 109371. [Google Scholar] [CrossRef]
  28. Sakib, M.N.; Shuvo, M.S.; Rahman, R.; Saha, S. Particle Deposition and Fluid Flow Characteristics in Turbulent Corrugated Pipe Flow Using Eulerian-Lagrangian Approach. Heliyon 2023, 9, e14603. [Google Scholar] [CrossRef] [PubMed]
  29. Akter, F.; Saha, S. Deposition of Aerosol Particles and Characteristics of Turbulent Flow inside Wavy Pipe Using Eulerian-Lagrangian Approach. Chem. Eng. Process.-Process Intensif. 2024, 205, 109971. [Google Scholar] [CrossRef]
  30. Wang, Z.; Han, Z.; Lu, H.; Zhao, W. Particle Deposition Characteristics in Concave Dimple Heat Transfer Channels with Different Inclination Angles. Powder Technol. 2025, 452, 120545. [Google Scholar] [CrossRef]
  31. Liu, P.; Gong, K.; Lin, D.; Guo, S.; Ma, Z.; Liu, Z.; Zhang, H. Numerical Study of Particle Deposition and Removal Behavior in the Water-Cooled Flue of a Submerged Arc Furnace. Chem. Eng. Process.-Process Intensif. 2025, 216, 110404. [Google Scholar] [CrossRef]
  32. Jin, Y.; Feng, M.; Li, M.; Shao, H.; Hu, X.; Cui, J. Particle Deposition Characteristics on Different Finned Tube Types in Industrial Flue Gas Waste Heat Recovery. Int. Commun. Heat Mass Transf. 2025, 166, 109180. [Google Scholar] [CrossRef]
  33. Yakhot, V.; Orszag, S.A.; Thangam, S.; Gatski, T.B.; Speziale, C.G. Development of Turbulence Models for Shear Flows by a Double Expansion Technique. Phys. Fluids A Fluid Dyn. 1992, 4, 1510–1520. [Google Scholar] [CrossRef]
  34. Kim, J.; Yadav, M.; Kim, S. Characteristics of Secondary Flow Induced by 90-Degree Elbow in Turbulent Pipe Flow. Eng. Appl. Comput. Fluid Mech. 2014, 8, 229–239. [Google Scholar] [CrossRef]
  35. Li, Y.; Zhou, Y.; Xiao, Y.; Yang, W. Study of Gas-Solid Two-Phase Flow in Pipeline Elbows Using an LES-DPM Coupling Method. Powder Technol. 2023, 413, 118012. [Google Scholar] [CrossRef]
  36. Caciolo, M.; Stabat, P.; Marchio, D. Numerical Simulation of Single-Sided Ventilation Using RANS and LES and Comparison with Full-Scale Experiments. Build. Environ. 2012, 50, 202–213. [Google Scholar] [CrossRef]
  37. Van Hooff, T.; Blocken, B.; Tominaga, Y. On the Accuracy of CFD Simulations of Cross-Ventilation Flows for a Generic Isolated Building: Comparison of RANS, LES and Experiments. Build. Environ. 2017, 114, 148–165. [Google Scholar] [CrossRef]
  38. Vahaji, S.; Nguyen, N.-H.; Shang, Y.; Inthavong, K. Sedimentation Effects on Particle Position and Inertial Deposition in 90° Circular Bends. Powder Technol. 2021, 393, 722–733. [Google Scholar] [CrossRef]
  39. Brach, R.M.; Dunn, P.F. A Mathematical Model of the Impact and Adhesion of Microsphers. Aerosol Sci. Technol. 1992, 16, 51–64. [Google Scholar] [CrossRef]
  40. Arsalanloo, A.; Abbasalizadeh, M. Numerical Study on Deposition of Particles in a 90° Bend in the Presence of Swirling Flow Using Eulerian-Lagrangian Method. Powder Technol. 2017, 320, 285–294. [Google Scholar] [CrossRef]
  41. Sudo, K.; Sumida, M.; Hibara, H. Experimental Investigation on Turbulent Flow in a Circular-Sectioned 90-Degree Bend. Exp. Fluids 1998, 25, 42–49. [Google Scholar] [CrossRef]
  42. Zhang, P.; Roberts, R.M.; Bénard, A. Computational Guidelines and an Empirical Model for Particle Deposition in Curved Pipes Using an Eulerian-Lagrangian Approach. J. Aerosol Sci. 2012, 53, 1–20. [Google Scholar] [CrossRef]
Figure 1. Schematic of Particle-Wall Contact.
Coatings 15 01336 g001
Figure 2. (a) 2D sketch (b) 3D grid (c) Inlet and outlet gird (d) Dimple grid.
Coatings 15 01336 g002
Figure 3. Grid independence verification.
Coatings 15 01336 g003
Figure 4. (a) Verification of velocities at different sections [41] (b) θ = 0° Speed verification [18,41] (c) θ = 45° Speed verification [18,41] (d) Particle deposition verification [10,16,42].
Coatings 15 01336 g004
Figure 5. Velocity Cloud Map in the XY Plane.
Coatings 15 01336 g005
Figure 6. TKE value of flow field of XY plan.
Coatings 15 01336 g006
Figure 7. Streamlines in the XY plane.
Coatings 15 01336 g007
Figure 8. The pressures at different sections.
Coatings 15 01336 g008
Figure 9. The deposition patterns of particles of different St in the wine groove channels at different positions. (a) smooth bend (b) θ = 10° (c) θ = 45° (d) θ = 60° (e) θ = 75°.
Coatings 15 01336 g009aCoatings 15 01336 g009bCoatings 15 01336 g009c
Figure 10. Deposition efficiencies of dimple channels at different locations.
Coatings 15 01336 g010
Table 1. Study on Particle Deposition Characteristics in Pipes of Various Geometric Shapes.
InvestigatorsGeometric ModelParticle CharacteristicsParticle SizeFluidRelevance/Finding
Zhang et al. [23]Air duct equipped with a vortex generatorUltrafine particles (UFPs)5–100 nmAirV-shaped vortex generator enhances particle deposition.
Lu et al. [24]Heat exchange channel in a three-dimensional ribbed structureMonodisperse spherical particles1, 3, 5, 10, 30, 50 μmAirEffect of ribs on particle deposition in straight-tube heat exchange channels
Shuvo et al. [25]Tapered or flared nozzleMonodisperse spherical particles2, 3, 4.1, 4.82, 6.32, 7.2, 8.09, 9, 9.5, 10 μmAirThe deposition rate increases with increasing Re.
Han et al. [26]Heat transfer channel with dimpled structureMonodisperse spherical particles1, 3, 5, 10, 20, 30, 40, 50 μmAirInfluence of dimple structures on particle deposition in straight-tube heat exchange channels.
Ladino et al. [20]Bent pipe containing large-scale roughness structuresMonodisperse spherical particles3–30 μmAirLarge-scale roughness enhances deposition efficiency in bent pipes.
Liu et al. [27]Cylindrical straight tubes, corrugated tubes, new enhanced heat exchange tubesCaCO3 particles5–50 μmWaterThe new enhanced tube reduces particle deposition.
Sakib et al. [28]Cylindrical bellowsSpherical particles1–30 μmAirIncreased corrugation height enhances particle deposition.
Akter et al. [29]Cylindrical bellowsAerosol particles1–30 μmAirLarge pipe diameters and low flow rates enhance sedimentation efficiency.
Erraghroughi et al. [1]Circular bent pipe with ribbed structureSpherical particles2–11.4 μmAirRibs can provide better protection for bent pipes with low curvature ratios.
Wang et al. [30]Inclined heat transfer channel with dimpled structureMonodisperse spherical particles1, 3, 5, 10, 20, 30, 40, 50 μmAirInfluence of dimple structures on particle deposition in inclined straight-tube heat exchange channels.
Liu et al. [31]Submerged arc furnaceParticles5–140 μmFlue gas, waterProposing a novel water-cooled flue to mitigate particulate pollution.
Jin et al. [32]Fin-tube heat exchange channelPulverised coal particles1–10 μmFlue gasLarger particles settle in regions of lower vorticity, thereby reducing sedimentation.
Table 3. Particle characteristics at the bend inlet.
Particle Size
(μm)
1.002.003.004.104.826.327.208.099.009.50
Stokes number0.0130.050.1070.1970.2700.4610.5960.7500.9261.030
Disclaimer/Publisher’s Note: The statements, opinions and data contained in all publications are solely those of the individual author(s) and contributor(s) and not of MDPI and/or the editor(s). MDPI and/or the editor(s) disclaim responsibility for any injury to people or property resulting from any ideas, methods, instructions or products referred to in the content.