Article

Novel Omniphobic Teflon/PAI Composite Membrane Prepared by Vacuum-Assisted Dip-Coating Strategy for Dissolved Gases Separation from Transformer Oil

1
China Electric Power Research Institute, Beijing 100192, China
2
Zhejiang Key Laboratory of Advanced Organic Materials and Technologies, College of Chemical and Biological Engineering, Zhejiang University, Hangzhou 310027, China
*
Author to whom correspondence should be addressed.
Coatings 2025, 15(11), 1319; https://doi.org/10.3390/coatings15111319
Submission received: 11 October 2025 / Revised: 6 November 2025 / Accepted: 6 November 2025 / Published: 11 November 2025
(This article belongs to the Special Issue Advances in Polymer Composite Coatings and Films)

Abstract

Omniphobic membranes have gained extensive attention for mitigating membrane wetting in robust membrane separation owing to the super-repulsion toward water and oil. In this study, a Teflon/PAI composite membrane with omniphobic characteristics was prepared by a vacuum-assisted dip-coating strategy on the PAI hollow fiber membrane. A series of characterizations on morphological structure, surface chemical composition, wettability, permeability, mechanical properties, and stability were systematically investigated for pristine PAI and Teflon/PAI composite membranes. Subsequently, the experiment was conducted to explore the oil–gas separation performance of membranes, with standard transformer oil containing dissolved gas as the feed. The results showed that the Teflon AF2400 functional layer was modified, and C-F covalent bonds were introduced on the composite membrane surface. The Teflon/PAI composite membrane exhibited excellent contact angles of 156.3 ± 1.8° and 123.0 ± 2.5° toward DI water and mineral insulating oil, respectively, indicating omniphobicity. After modification, the membrane tensile stress at break increased by 23.0% and the mechanical performance of the composite membrane was significantly improved. In addition, the Teflon/PAI composite membrane presented satisfactory thermal and ultrasonic stability. Compared to the previous membranes, the Teflon/PAI composite membrane presented a thinner Teflon AF2400 separation layer. Furthermore, the omniphobic membrane demonstrated anti-wetting performance by reaching the dynamic equilibrium within 2 h for the dissolved gases separated from the insulating oil. This suggests an omniphobic membrane as a promising alternative for oil–gas separation in monitoring the operating condition of oil-filled electrical equipment online.

Graphical Abstract

1. Introduction

Oil-filled electrical equipment holds a crucial position in the power industry. As the key medium, insulating oil plays a role in insulation, cooling, and arc extinction for transformers, circuit breakers, cables, and other devices, safeguarding stable operation and reliability as well as safety in the power system [1,2,3,4,5]. When faults occur in oil-filled electrical equipment, carbon-carbon, carbon-hydrogen and carbon-oxygen bonds are cracked in insulating oil and paper composed of carbon, hydrogen and oxygen elements, thus generating hydrogen (H2), carbon monoxide (CO), carbon dioxide (CO2) and low-carbon hydrocarbon gases, such as methane (CH4), ethane (C2H6), ethylene (C2H4) and acetylene (C2H2) [6,7,8,9]. The above-mentioned gases’ characteristics reflect the type and progression of faults, making it essential to detect the composition and concentration of dissolved gases in insulating oil [10,11,12,13,14,15]. Dissolved gas analysis (DGA) is considered one of the most effective methods for monitoring and diagnosing faults in oil-filled electrical equipment, receiving extensive attention from scholars and researchers [16,17,18,19].
DGA technology mainly consists of oil–gas separation and gas detection. To be more specific, oil–gas separation is performed, followed by detection and analysis of the extracted gases to obtain critical information [20,21,22]. The oil–gas separation section is quite vital, determining the accuracy of subsequent gas detection and thereby affecting the test results in the DGA process. Due to different separation forms, conventional oil–gas separation technologies mainly include traditional mechanical degassing methods and membrane degassing methods [23,24]. Compared to traditional mechanical separation methods containing vacuum degassing, dynamic headspace degassing, and oscillation degassing, membrane degassing technology has several advantages, such as no complex mechanical devices, simpler operating procedure, lower energy consumption, lower maintenance costs, and smaller equipment footprint [25,26,27]. Membrane technology is a promising alternative to apply for oil–gas separation, preventing the vaporized oil from entering and contaminating the detection chamber [28].
Membrane separation is an emerging physical separation technology, utilizing a membrane as the medium to achieve separation and purification of different components in a mixture [29,30]. The oil–gas membrane separation is driven by the partial pressure difference originating from the temperature difference and the concentration difference across the membrane [25,26,27]. Gas components in the oil pass through the membrane to the permeate side, based on the dissolution-diffusion principle [27,28]. Membranes play a vital role in the oil–gas membrane separation process, with their performance directly influencing separation efficiency and permeate quality. In terms of dissolved gases separated from the insulating oil, the issues of membrane wetting and long separation time have hindered the development and large-scale application of oil-gas membrane separation technology [30,31,32]. Oleophobic characteristics in the air and a thin separation layer for membranes are necessary, determining the separation efficiency.
Currently, oil-gas separation membranes are made of polymer materials including polyimide (PI), polytetrafluoroethylene (PTFE), Teflon AF2400, and fluorinated ethylene propylene (FEP) [32,33,34,35]. Among them, Teflon AF2400 is the optimal material for oil–gas separation membranes, owing to high free volume fraction, favorable gas permeability, extremely low surface energy, excellent oleophobicity, and outstanding inertness toward substances [27,33,34]. Han et al. [36] prepared a composite membrane by depositing Teflon AF2400 on the ceramic ultrafiltration membrane. The results indicated that the thickness of the Teflon AF2400 layer was 8 μm and the oil–gas equilibrium time was 5 h. Liu et al. [27] fabricated a Teflon AF2400/γ-Al2O3/α-Al2O3 composite membrane with an ultrathin Teflon AF2400 layer via introducing the intermediate mesoporous γ-Al2O3 under high-temperature sintering. However, the composite membrane was not applied for insulating oil to investigate the oil–gas separation performance. In addition, a long oil–gas equilibrium time is unfavorable for oil and gas separation in DGA online monitoring technology. With the frequent occurrence of transformer explosion accidents, the separation level of dissolved gases in the oil needs to be improved in order to shorten the detection cycle and acquire gas information faster. Herein, we propose to exploit new membranes with satisfactory oleophobicity as well as a thin separation layer for dissolved gases separation from transformer oil to achieve a shorter equilibrium time.
In this work, the Teflon/PAI composite membrane with omniphobic characteristics was developed with a vacuum-assisted dip-coating method. The Teflon AF2400 functional layer was modified on the original PAI membrane, and the thickness was regulated by controlling the concentration of the coating solution. Membrane morphology, structure, surface chemical composition, wetting behaviors, permeability, and mechanical properties were characterized systematically. The thermal and mechanical stabilities were assessed under harsh conditions. Furthermore, oil–gas separation tests were conducted to explore the membrane’s separation performance and equilibrium time, with standard transformer oil containing dissolved gas as the feed.

2. Experimental Procedure

2.1. Materials and Chemicals

Polyamideimide (PAI, Torlon® 4000T-LV) was purchased from Solvay Co., Ltd., Brussels, Belgium. N-methylpyrrolidone (NMP, 99.5%) and Fluorinert® FC-40 were provided by Aladdin Biochemical Technology Co., Ltd., Shanghai, China. Teflon (AF 2400X-J) was supplied by Chemours Chemical (Shanghai) Co., Ltd., Shanghai, China. Anhydrous ethanol (99.7%), 1,2-propanediol (PG, 99%), and isopropanol (IPA, 99.5%) were supplied by Macklin Biochemical Technology Co., Ltd., Shanghai, China. Mineral insulating oil was acquired from Petro China Co., Ltd., Beijing, China. Deionized (DI) water was produced from an ultrapure water purification system (resistivity > 18.0 MΩ·cm, Merck Millipore (China) Co., Ltd., Shanghai, China). Pure N2 (99.5%) and pure He (99.5%) were obtained from Air Products (Shanghai) Co., Ltd., Shanghai, China. All chemicals and reagents were utilized directly without further purification.

2.2. Fabrication of Teflon/PAI Composite Membrane

(1)
PAI hollow fiber membrane prepared by the dry-wet phase inversion method.
PAI resin was dried in a vacuum oven at 100 °C for 24 h to remove the adsorbed water on the surface. The pretreated PAI powder was dissolved in NMP under constant magnetic stirring at a 60 °C thermostatic water bath for 12 h to form a uniform and transparent casting solution. The casting solution was transferred into a vacuum oven to degas statically at 60 °C for 6 h and then cooled to room temperature. Meanwhile, NMP and deionized water were mixed and stirred magnetically at a constant speed at ambient temperature for 3 h to obtain a core liquid.
The casting solution and the core liquid were transferred into syringe pumps of a homemade hollow fiber membrane preparation device, respectively. After they were set aside overnight, the distance between the spinneret and the coagulation bath was adjusted, and the relevant parameters of the casting solution and the core liquid containing extrusion speeds were set. The wet hollow fiber membrane was extruded from the spinneret at a constant speed at room temperature and then entered the coagulation bath after a specific air gap. Hollow fiber membranes were collected and rinsed with anhydrous ethanol and DI water repeatedly, and then soaked in DI water for 24 h to remove the residual solvent. Subsequently, hollow fiber membranes were dried in an oven with constant temperature and humidity at 25 °C and 60% RH. According to different concentrations of the casting solution, hollow fiber membrane substrates were named PAI-1, PAI-2, and PAI-3, respectively. The schematic diagram of the hollow fiber membrane spinning setup by the dry-wet phase inversion method is shown in Figure 1, and the spinning conditions of hollow fiber membrane substrates are presented in Table 1.
(2)
Teflon/PAI composite membrane prepared by vacuum-assisted dip-coating method.
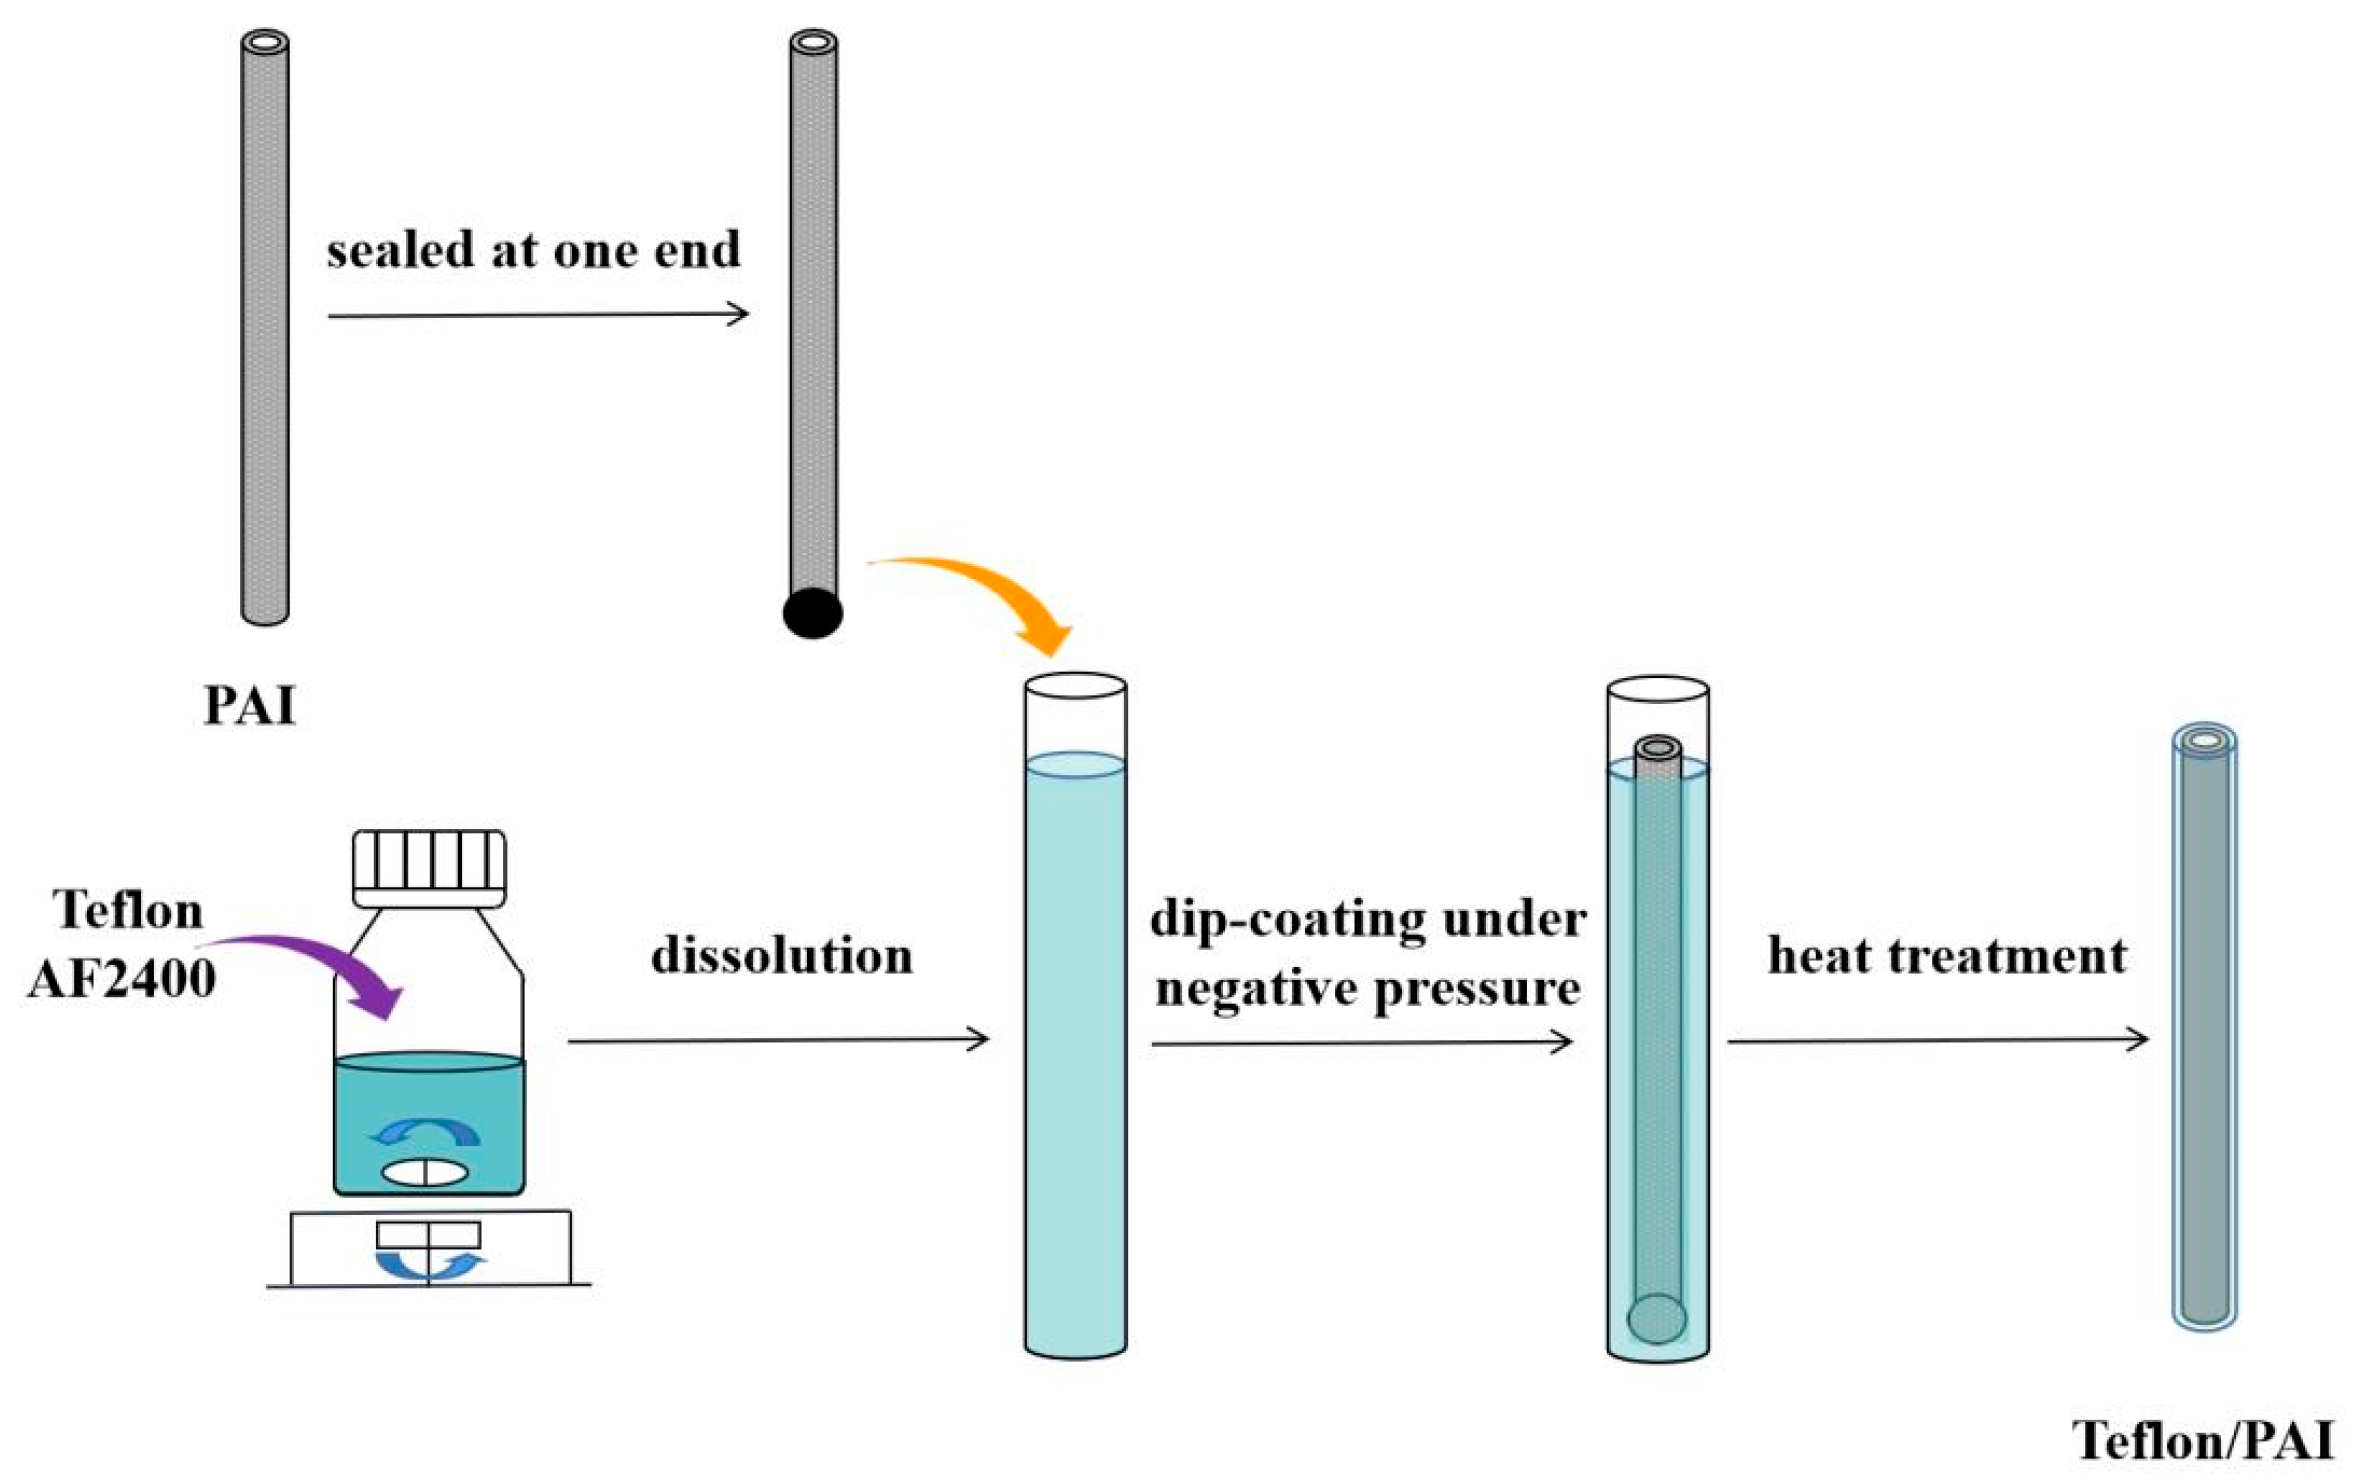
As an amorphous fluoropolymer, Teflon AF2400 was dried first in a vacuum oven at 100 °C for 24 h and then added to Fluorinert® FC-40 under continuous stirring at 80 °C for 12 h to gradually gain a homogeneous solution. Subsequently, the PAI substrate rinsed by IPA was immersed in the aforementioned modified solution under vacuum conditions. After dip-coating for a certain time, it was taken out and placed in a vacuum oven at 165 °C for 6 h. A composite membrane modified by Teflon AF2400 was acquired and called Teflon/PAI for short. According to different concentrations of Teflon AF2400, composite membranes were labeled as Teflon/PAI-1, Teflon/PAI-2, Teflon/PAI-3, and Teflon/PAI-4, respectively. The schematic diagram of the Teflon/PAI composite membrane fabrication process is displayed in Figure 2, and immersion solution compositions and dip-coating conditions are demonstrated in Table 2.

2.3. Membrane Characterization and Test

(1)
Microscopic characterization of membrane morphology.
Membrane surface and cross-section morphology features were observed by a field emission scanning electron microscope (SEM). Membrane samples were sprayed with gold powder under vacuum for 90–120 s via an ion sputtering instrument. The detailed operation is shown in the Supplementary Information.
(2)
Membrane composition analysis.
Membrane surface compositions and functional groups were determined by an attenuated total reflectance Fourier transform infrared spectroscopy (ATR-FTIR). The detailed operation was shown in the Supplementary Information. The spectra were recorded in the scanning range of 4000–400 cm−1 wave numbers with a 4 cm−1 resolution.
Membrane surface chemical structure and elemental compositions were analyzed by X-ray photoelectron spectroscopy (XPS). The detailed operation was shown in the Supplementary Information. Measurement data were obtained by high-resolution for C1s (280–297 eV), O1s (528–539 eV), N1s (394–410 eV), and F1s (678–694 eV) with a 50.0 eV pass energy analytical mode.
(3)
Membrane wetting behavior analysis.
Membrane surface wetting behavior was assessed with an optical contact angle goniometer equipped with a video camera. Contact angles were measured with a 2–5 μL droplet by the static sessile drop method. The detailed operation was shown in the Supplementary Information. In the experiment, each membrane sample was tested at least five times in different positions, and the average was presented as the result.
(4)
Membrane permeability test.
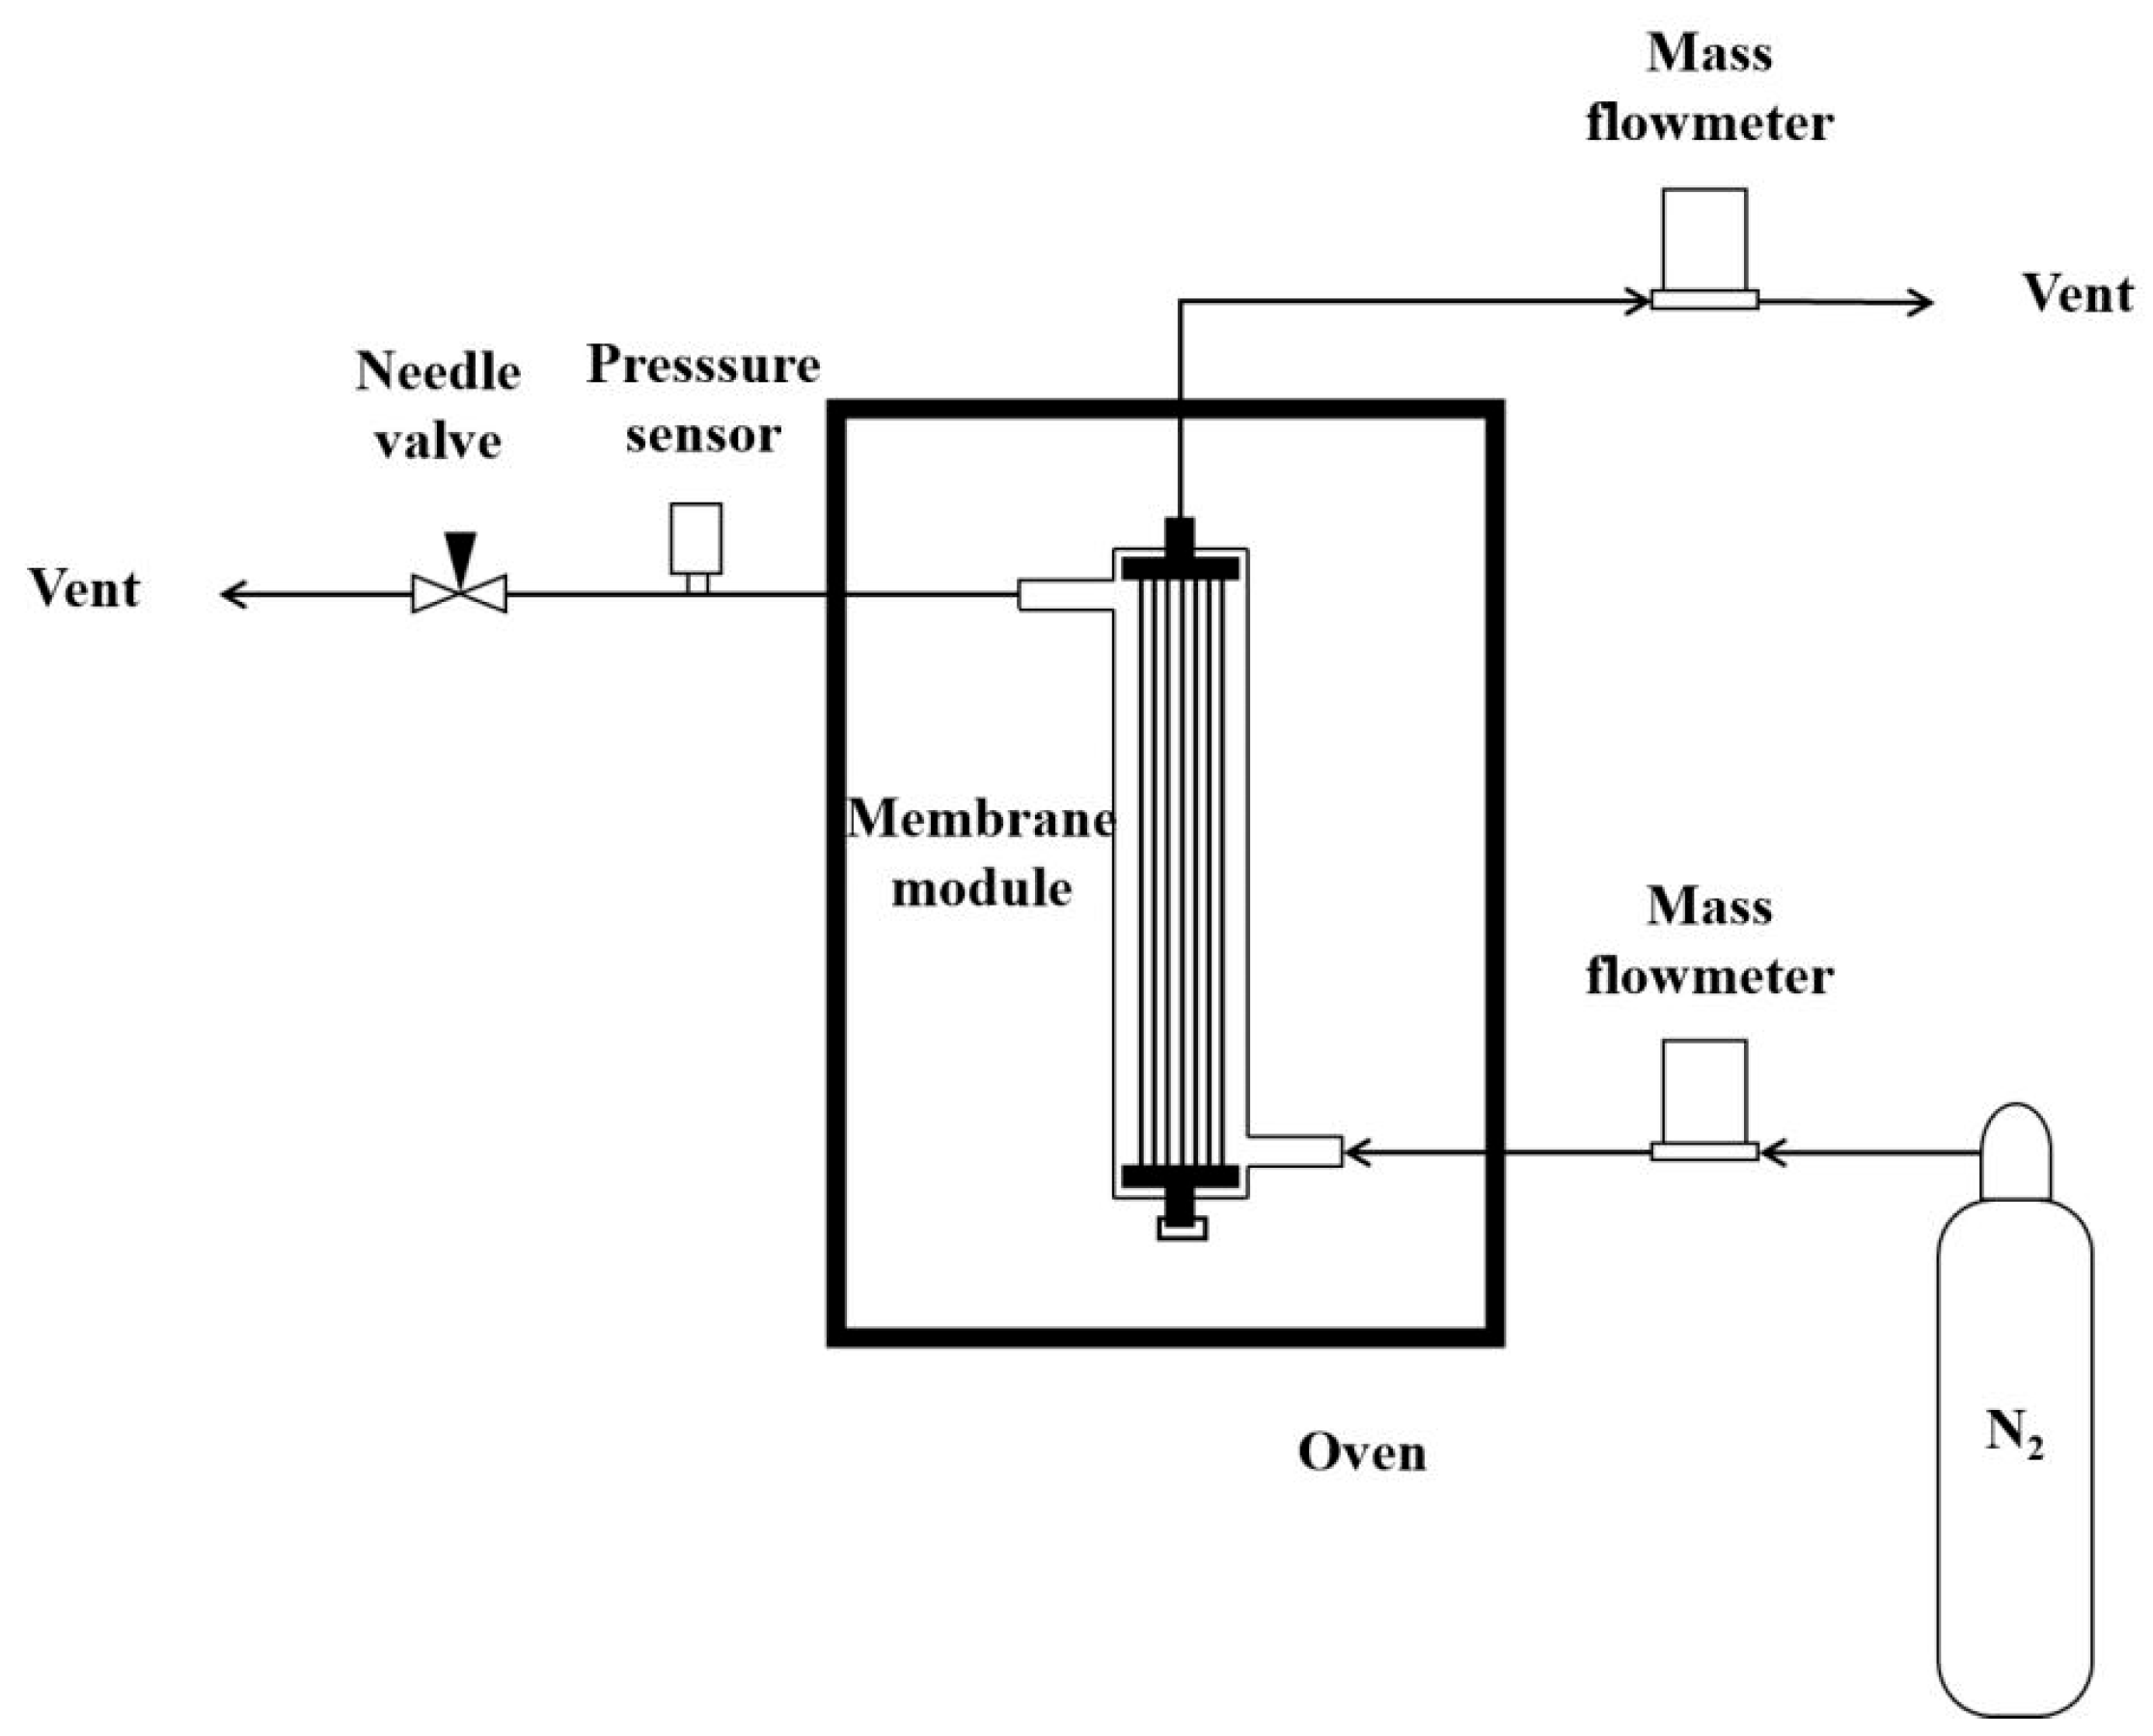
Gas permeability of hollow fiber membranes was measured using a homemade testing device, and the schematic diagram of the gas permeability test setup is shown in Figure 3. The detailed operation was shown in the Supplementary Information. During the test, the mass flow meter and the needle valve were adjusted to control the pressure sensor, and the gas flow rate on the permeate was recorded. Each sample was tested at least three times, and the average was regarded as the result.
The membrane permeation rate p i is calculated as follows [31,35]:
p i = Q i A × P
where Q i (L·mol−1·h−1) is the gas volume flow rate of gas component i at standard temperature and pressure (STP), A (m2) is the effective membrane area, p (Pa) is the transmembrane pressure difference in component i, p i is the permeation rate of gas component i, which is represented by gas permeation unit (GPU), and 1 GPU = 3.35 × 10⁻¹⁰ mol·m−2·s−1·Pa−1.
In addition, the permeability coefficient P is indicated as the membrane’s gas permeability performance, reflecting the ability to pass through the membrane. The relationship between the permeation rate p and the permeability coefficient P is as follows [31,35]:
p = P l
where l (μm) is the membrane thickness.
The membrane gas permeable selectivity is expressed as the ratio of two pure gases (i and j) permeability coefficients. The calculation formula is as follows [31,35]:
α i / j = P i P j = p i p j
where αi/j is the gas permeable selectivity ratio, pi is the permeation rate of gas i, and pj is the permeation rate of gas j, respectively.
The gas permeability and the gas permeable selectivity of hollow fiber membranes are evaluated by permeation rates of helium and nitrogen as well as their ratio.
(5)
Membrane mechanical performance test.
Mechanical properties of hollow fiber membranes, including tensile stress at break, elongation at break, and Young’s modulus, were tested by an electronic tensile tester (Instron 68TM-5, Boston, MA, USA) at room temperature. A membrane with an initial length of 50 mm was placed in the test area. The tensile speed was set to 10 mm/min. In the experiment, each membrane sample was tested at least five times, and the average was treated as the measurement result.
(6)
Membrane stability test.
A membrane sample was soaked in the electric insulating oil at 80 °C for 168 h and subjected to ultrasonication continuously at room temperature for 12 h, respectively. The membrane stability was evaluated by comparing the changes in microscopic morphology and contact angles on the membrane surface before and after heat as well as ultrasonic treatment.
(7)
Membrane oil-gas separation performance test.
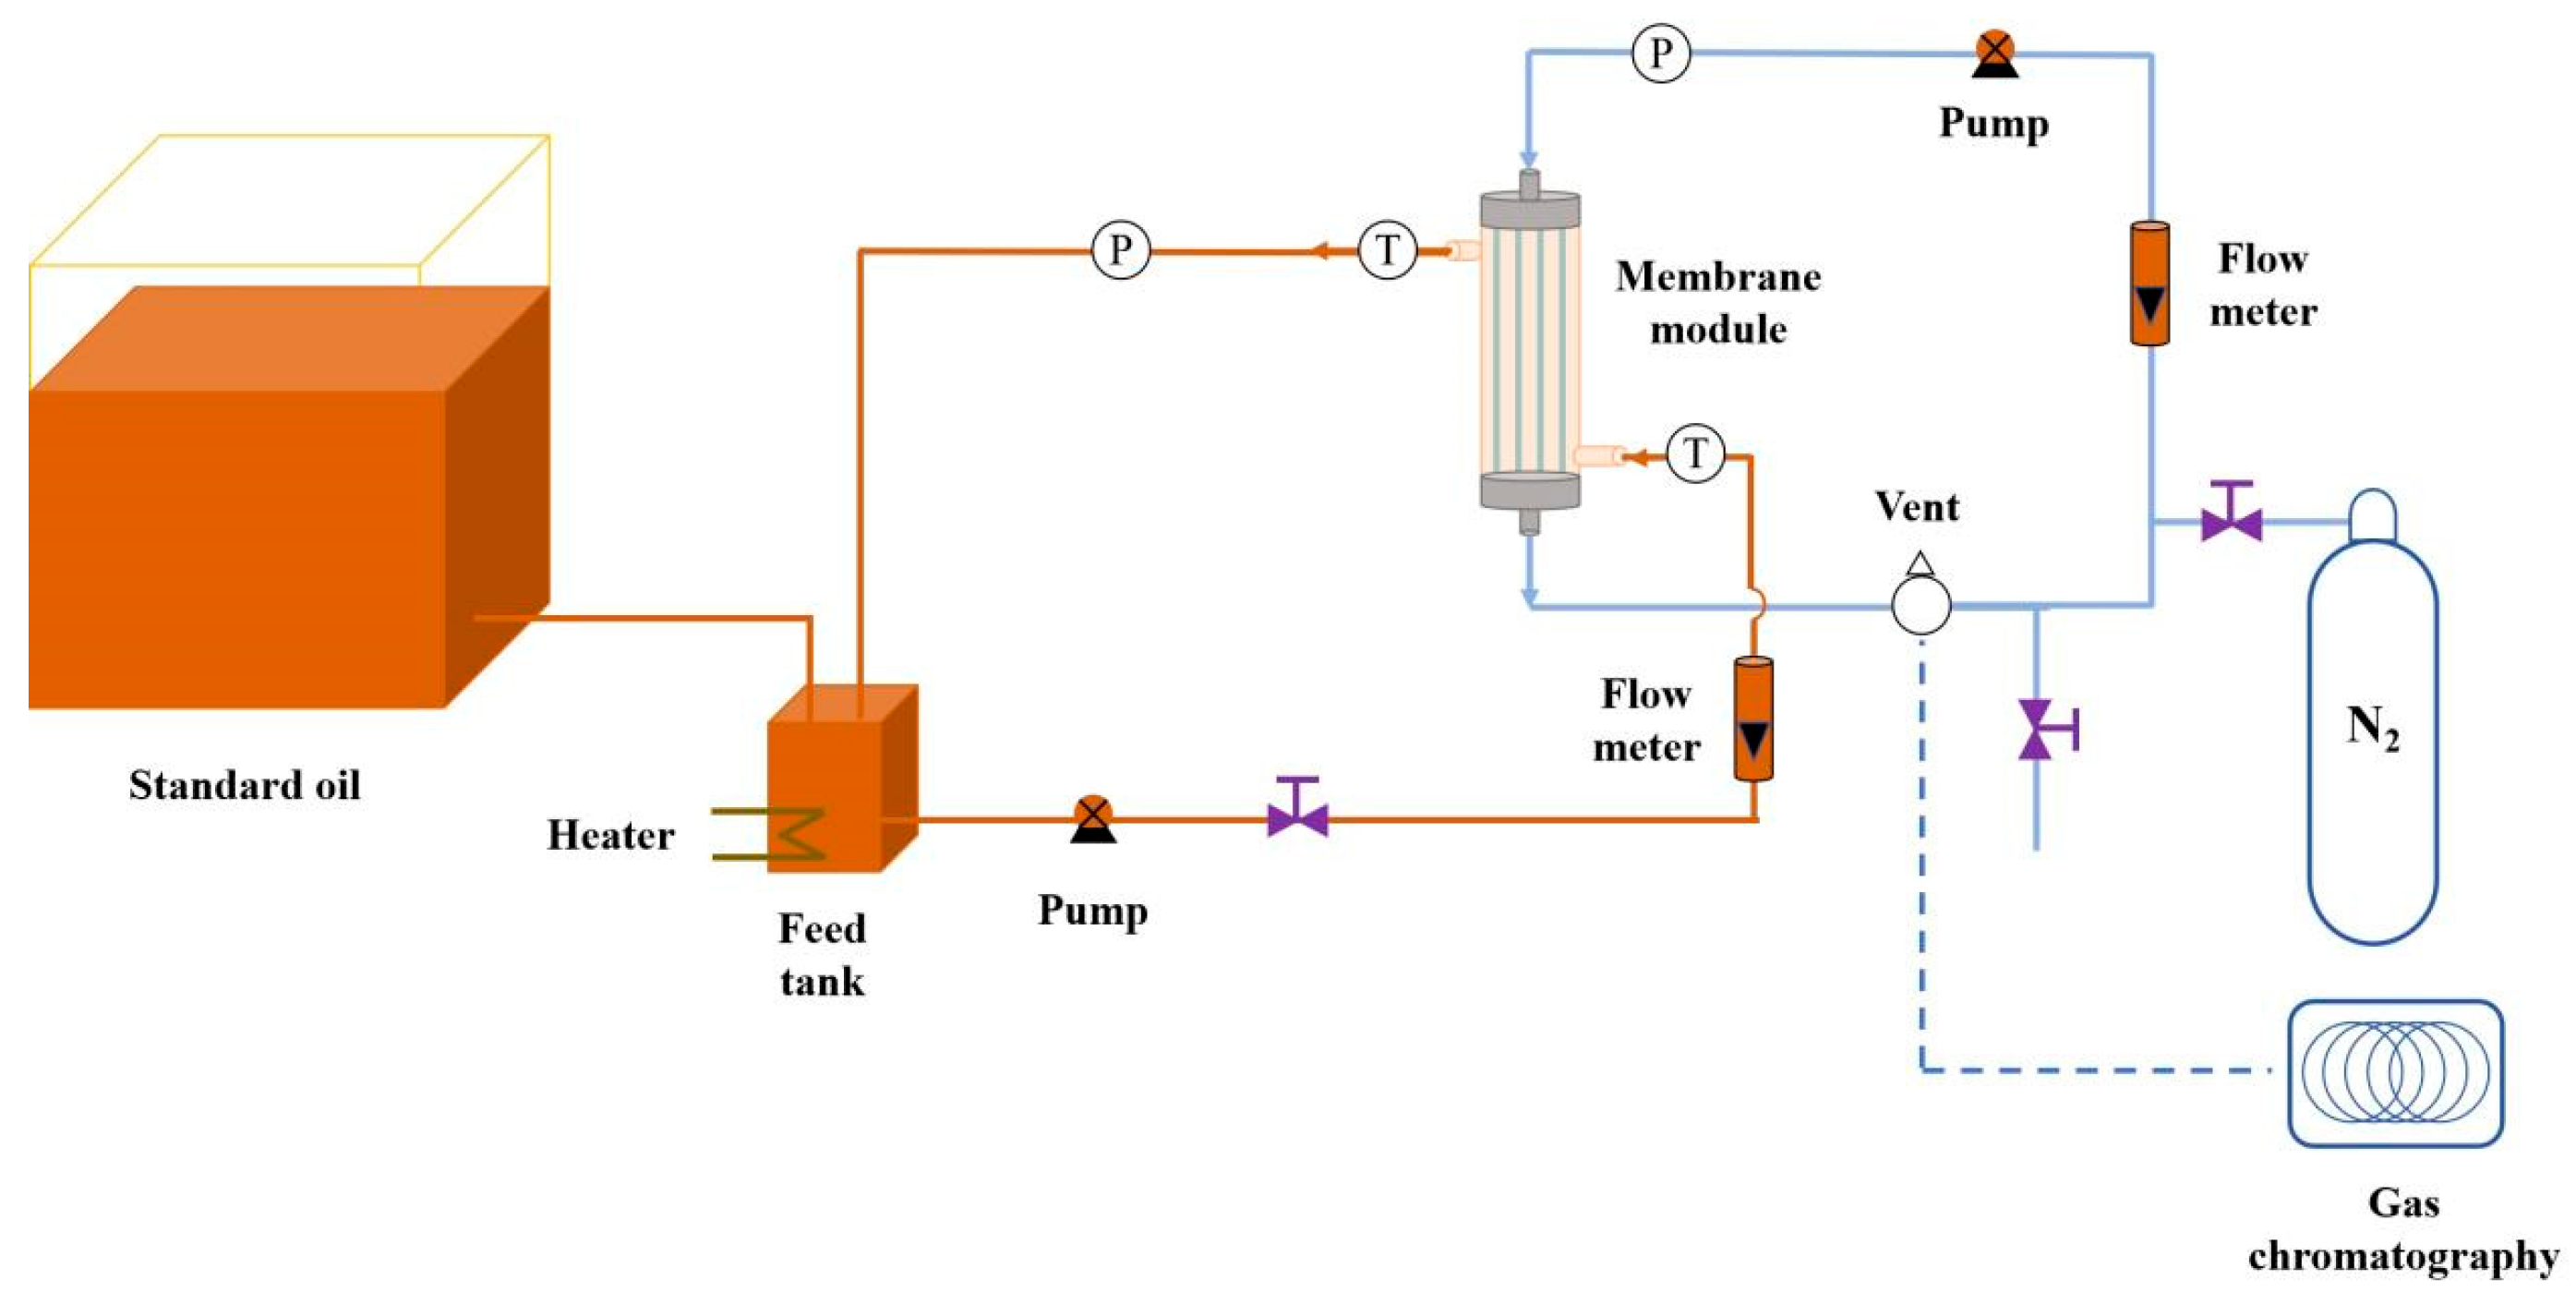
Oil-gas separation performance of the hollow fiber composite membrane was investigated via the experimental setup, and the schematic diagram of the oil-gas separation performance test setup is shown in Figure 4. In the membrane module, the effective membrane area was approximately 36.5 cm2. As the feed, transformer oil containing low and medium concentrations of dissolved gas was prepared according to the requirements of “Q/GDW 10536-2021 Technical Specification for Dissolved Gas Online Monitoring Device in Transformer Oil” [37,38,39]. In the test process, the inlet temperature of the membrane module was kept at 50 ± 1 °C. The pressure of the feed circulating pipeline was maintained at 0.2 ± 0.02 MPa. The oil and gas separation process was carried out in the membrane module. On the permeate side, the pressure was held at 0.1 ± 0.02 MPa with the help of N2, and the permeate was circulated by a miniature electromagnetic gas pump at ambient temperature. The detailed operation is shown in the Supplementary Information.
The dissolved gas in transformer oil was separated and enriched in the permeate with the operating time. After being taken out by a dosing syringe, 1 mL of gas was transferred into the gas chromatograph to analyze the composition and content, further evaluating the oil-gas separation performance of the hollow fiber composite membrane. When the variation in the gas chromatography test data was small, the error value was less than 10% among five consecutive tests. It was considered that the gas between the feed and the permeate had reached a dynamic equilibrium state, and the gas concentration in the permeate was the maximum. The separation time corresponding to 90% of the maximum was defined as the oil-gas equilibrium time.

3. Results and Discussion

3.1. Membrane Morphology Structure Analysis

To investigate the effects of the preparation technique and the modification process on the membrane surface and cross-section, the morphology was characterized by SEM. The SEM images of cross-section and external surface for PAI hollow fiber membranes are shown in Figure 5. In detail, the overall cross-section morphology of pristine hollow fiber membrane PAI-1, PAI-2 and PAI-3 is presented in Figure 5a–c; the partially magnified morphology of cross-section for pristine hollow fiber membrane PAI-1, PAI-2 and PAI-3 is exhibited in Figure 5d–f; the external surface morphology of pristine hollow fiber membrane PAI-1, PAI-2 and PAI-3 is demonstrated in Figure 5g–i. It can be observed that PAI hollow fiber membranes were endowed with a cross-section morphology consisting of finger-like pore structure and sponge-like pore structure, as well as the surface porous morphology. With the increase in the casting solution concentration, the finger-like pore length decreased in the cross-section, the pore size declined, and the surface structure became denser [30,40,41].
From the viewpoint of system thermodynamic analysis, when the polymer concentration in the casting solution is low, liquid–liquid demixing is easier to occur than solid–liquid demixing. The instantaneous liquid–liquid demixing played a predominant role in the phase inversion process, and the solvent in the casting solution was exchanged with the non-solvent in the coagulation bath quickly [40,41]. Therefore, a loose porous structure was created on the surface, and a finger-like porous structure was formed in the cross-section [42,43]. With the increase in the polymer concentration in the casting solution, the exchange rate between solvent and non-solvent declined, and the liquid–liquid demixing was replaced by the solid–liquid demixing gradually. Thus, pore diameters on the surface and finger-like pore lengths in the cross-section decreased. When the polymer concentration was high, the viscosity of the casting solution increased significantly, and the phase inversion process became dominated by the delayed solid–liquid demixing [40]. Consequently, surface pore diameter declined sharply, the dense surface morphology was formed, and the cross-section structure was focused on sponge-like pores. Considering the pore size distribution of PAI hollow fiber membranes, PAI-2 with a 27 wt% concentration in the casting solution was selected as the pristine membrane.
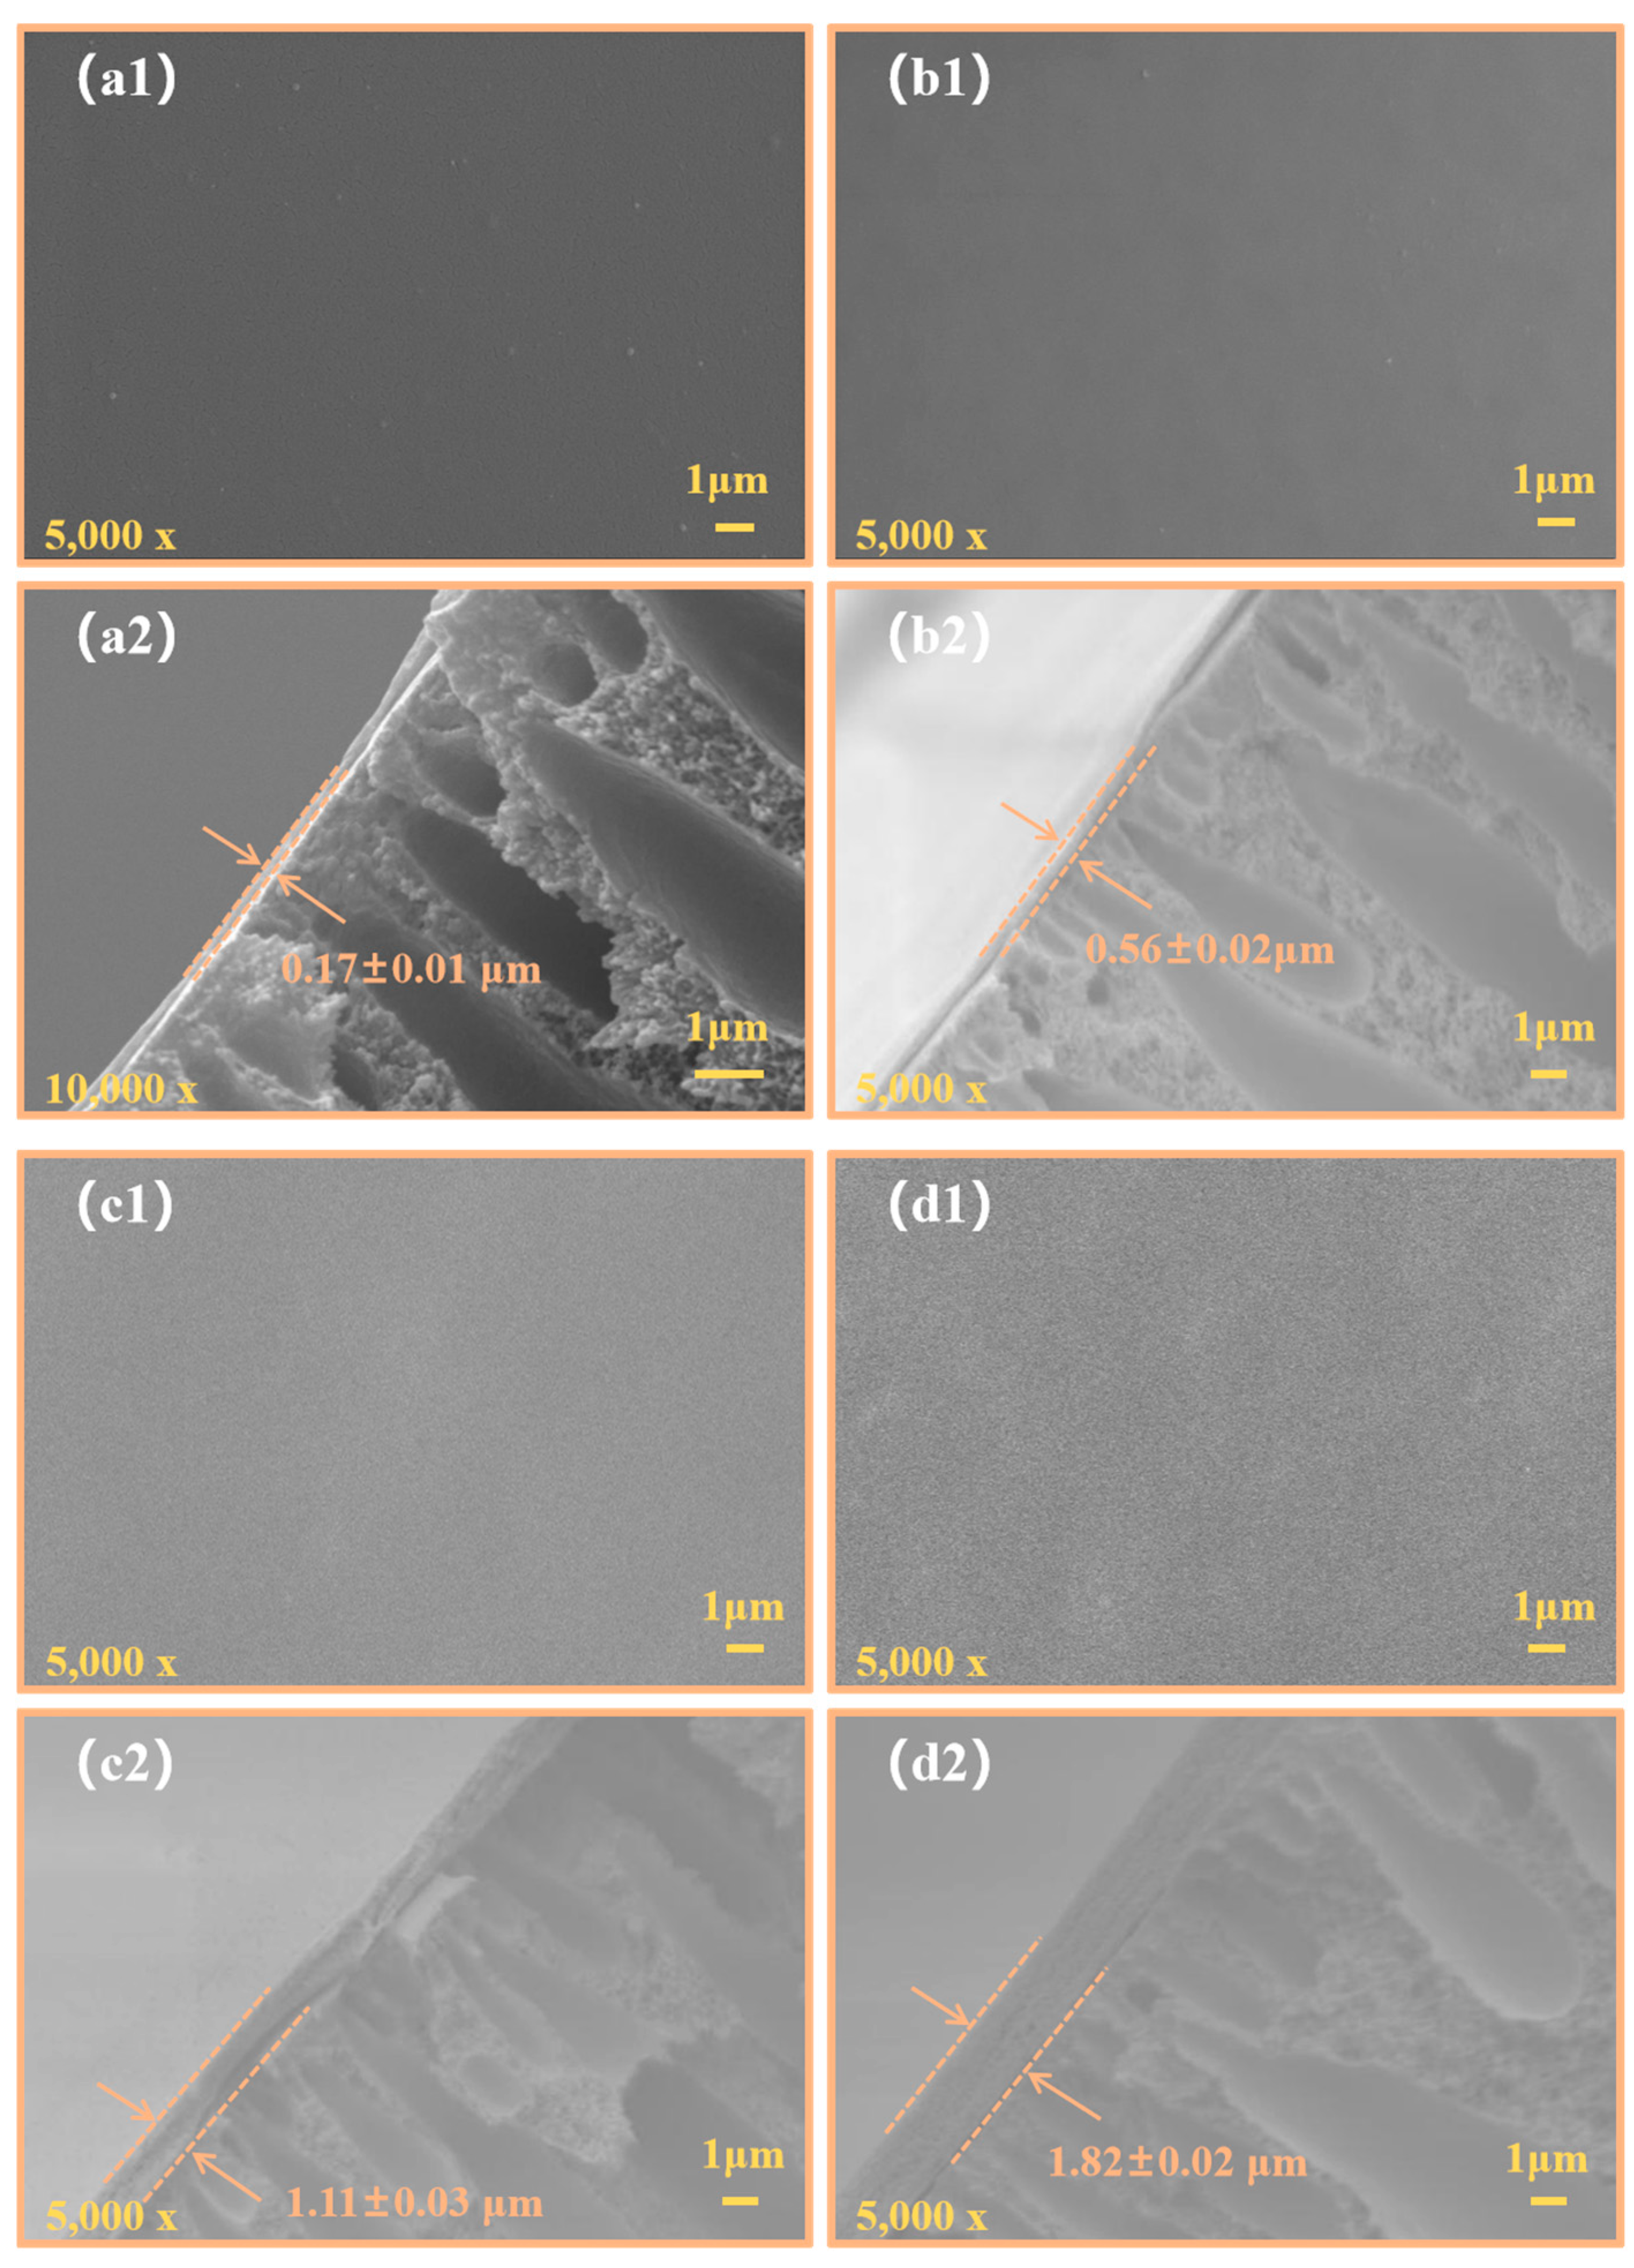
Surface and cross-section SEM images of Teflon/PAI composite membranes are depicted in Figure 6. In particular, the surface morphology of composite membrane Teflon/PAI-1, Teflon/PAI-2, Teflon/PAI-3, and Teflon/PAI-4 is presented in Figure 6a1–d1; the cross-section structure of composite membrane Teflon/PAI-1, Teflon/PAI-2, Teflon/PAI-3, and Teflon/PAI-4 is shown in Figure 6a2–d2. It can be viewed that a uniform and dense functional layer was deposited on the surface of Teflon/PAI composite membrane, and the modification process had no influence on the cross-sectional structure of membranes. With the increase in the Teflon AF2400 concentration in the immersion solution, the thickness of the functional layer increased little by little. Additionally, the functional layer thickness could be measured by the scale in the bottom right corner of Figure 6a2–d2. The modified layer thicknesses of Teflon/PAI-1, Teflon/PAI-2, Teflon/PAI-3, and Teflon/PAI-4 were 0.17 ± 0.01 μm, 0.56 ± 0.02 μm, 1.11 ± 0.03 μm, and 1.82 ± 0.02 μm, respectively.

3.2. Membrane Chemical Composition Analysis

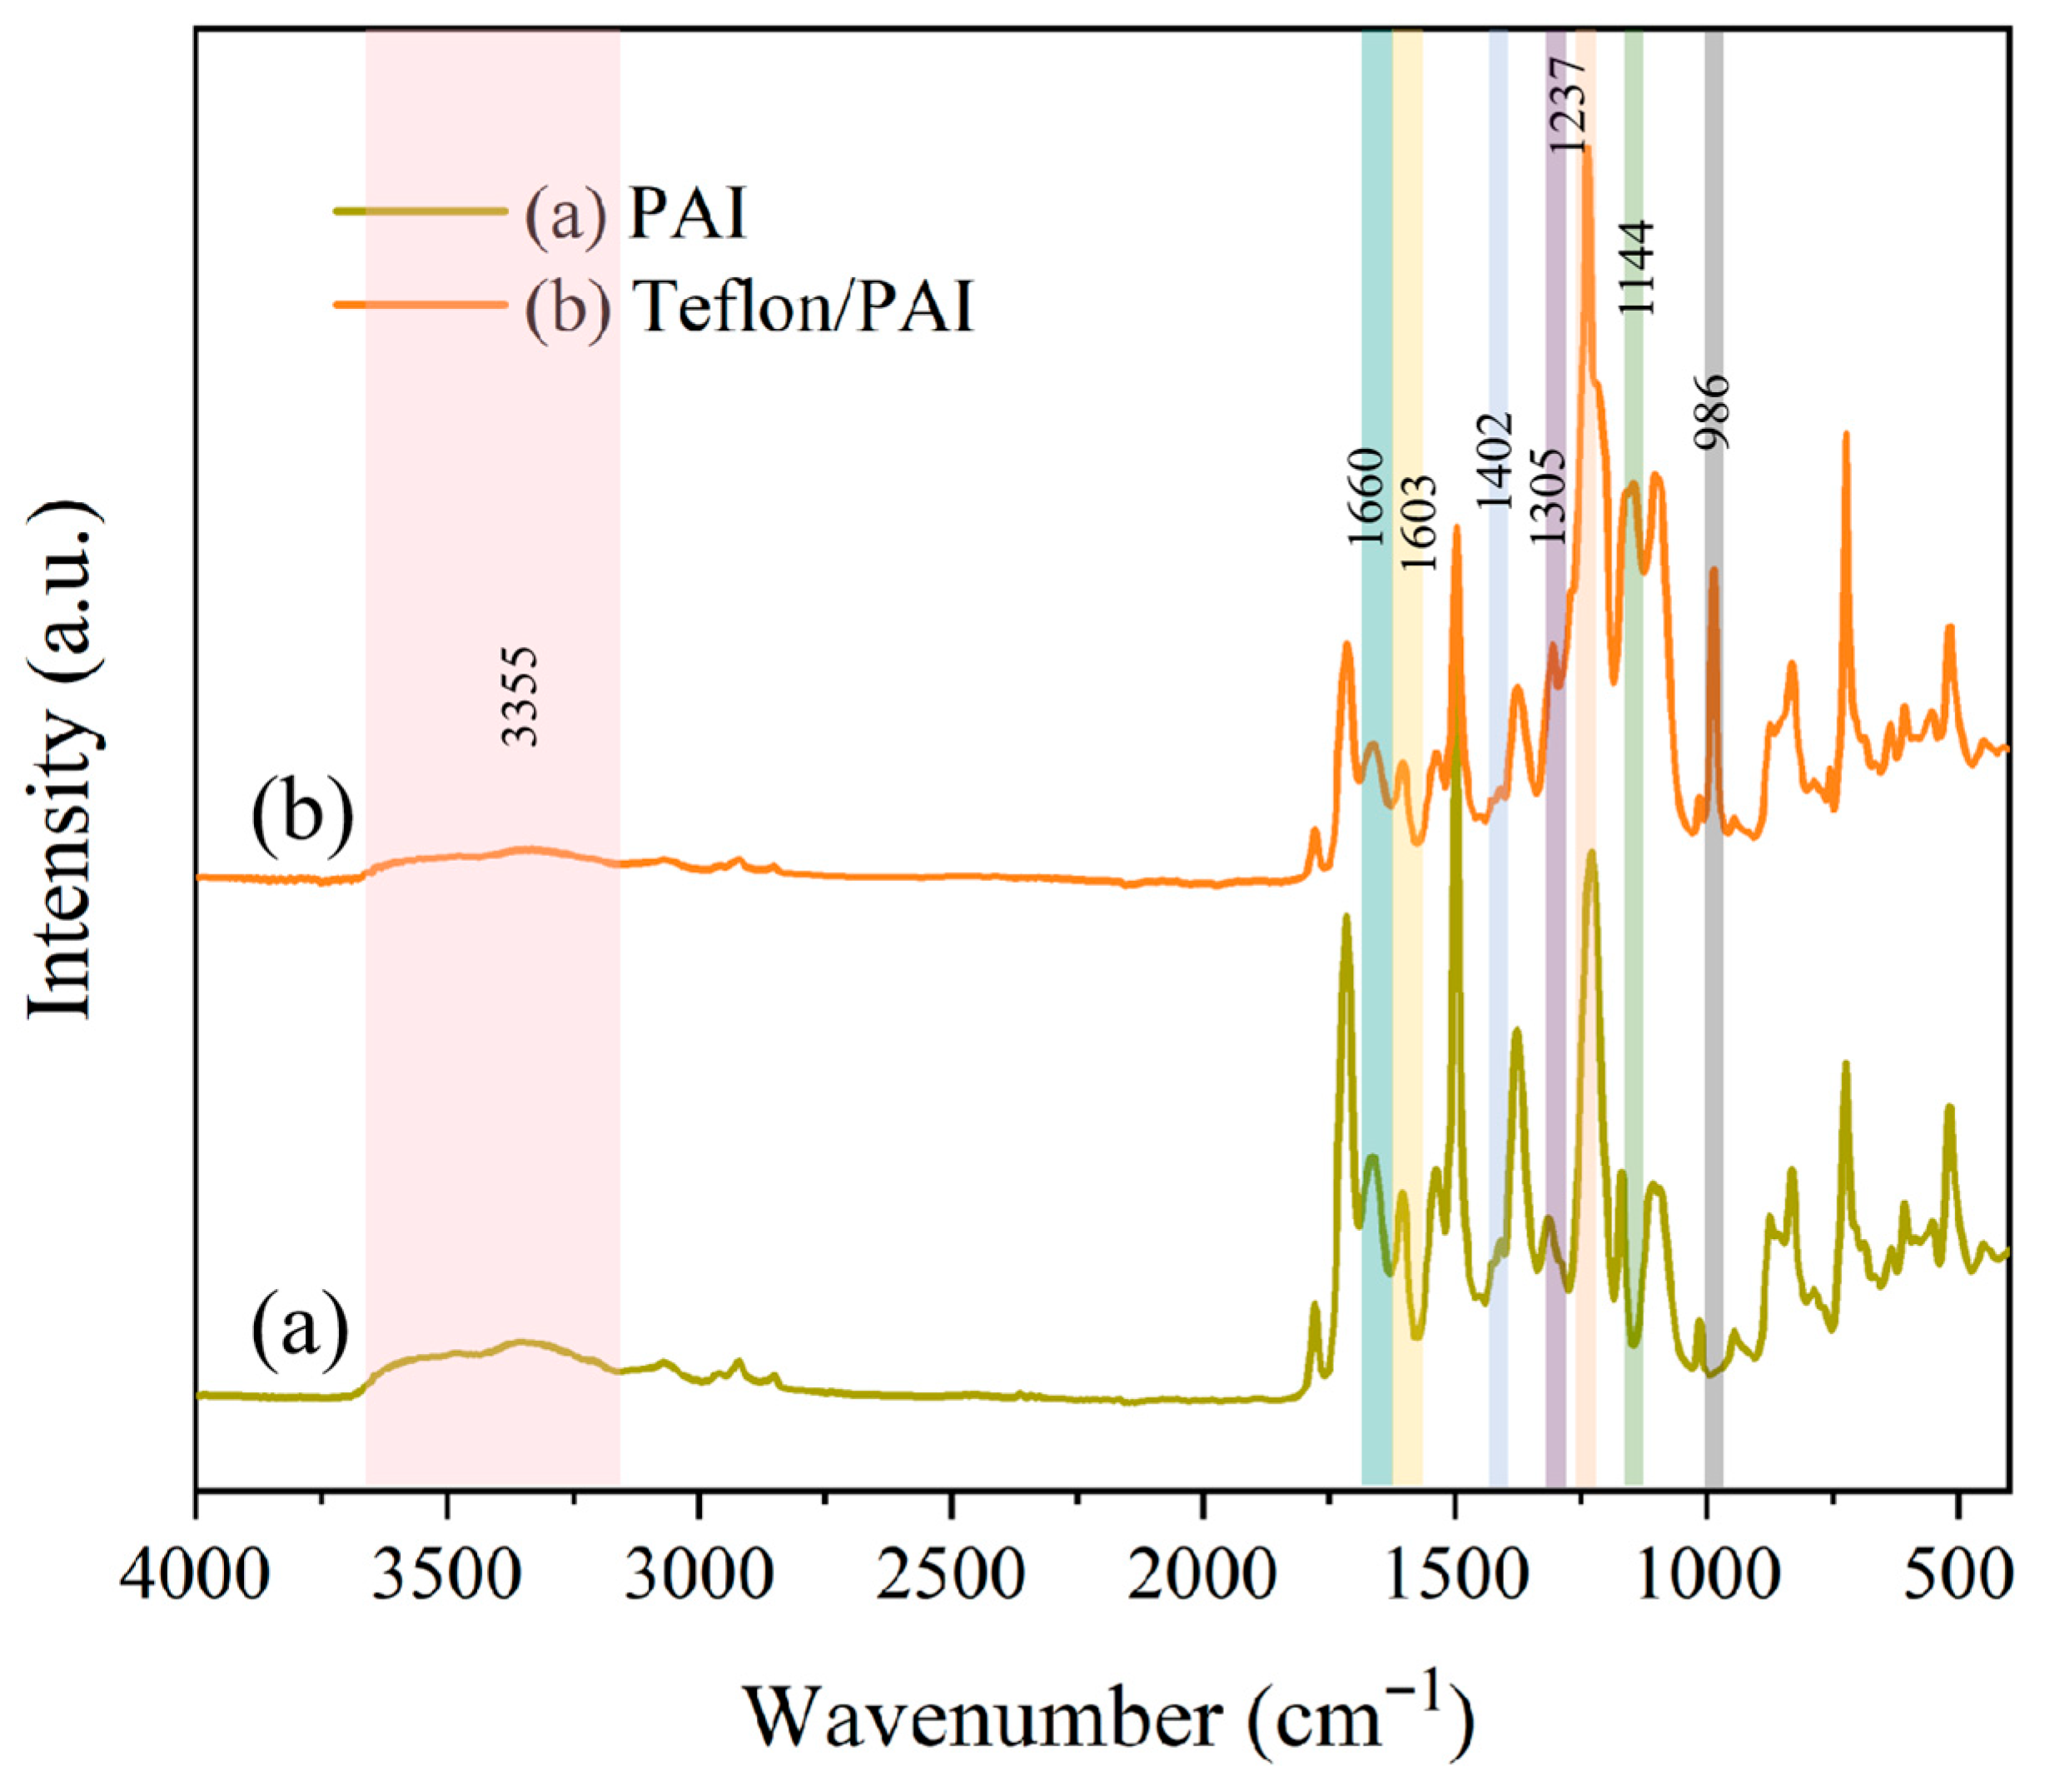
To confirm that the Teflon AF2400 functional layer had been modified on the composite membrane, surface chemical compositions of pristine and composite membranes were analyzed by ATR-FTIR and XPS. The ATR-FTIR spectra of pristine PAI membrane and Teflon/PAI composite membranes are demonstrated in Figure 7. As can be seen that compared to PAI, Teflon/PAI presented new characteristic absorption peaks that appeared at 986 cm−1, 1144 cm−1, 1237 cm−1, and 1305 cm−1, indicating the stretching vibration of C-O and C-F covalent bonds [34]. Specifically, C-F covalent bonds originated from -CF2 and -CF3 groups, indicating that Teflon AF2400 had been decorated successfully on the PAI membrane surface. The characteristic peak at 1603 cm−1 and the broad peak near 3355 cm−1 corresponded to the stretching vibration of N-H covalent bonds [42,43]. The absorption band at 1660 cm−1 was assigned to the stretching vibration of C=O covalent bonds [42,43,44]. The above absorption peak intensity of Teflon/PAI composite membrane was significantly weaker than that of pristine PAI membrane, mainly attributed to the modification of Teflon AF2400 coating on the membrane surface.
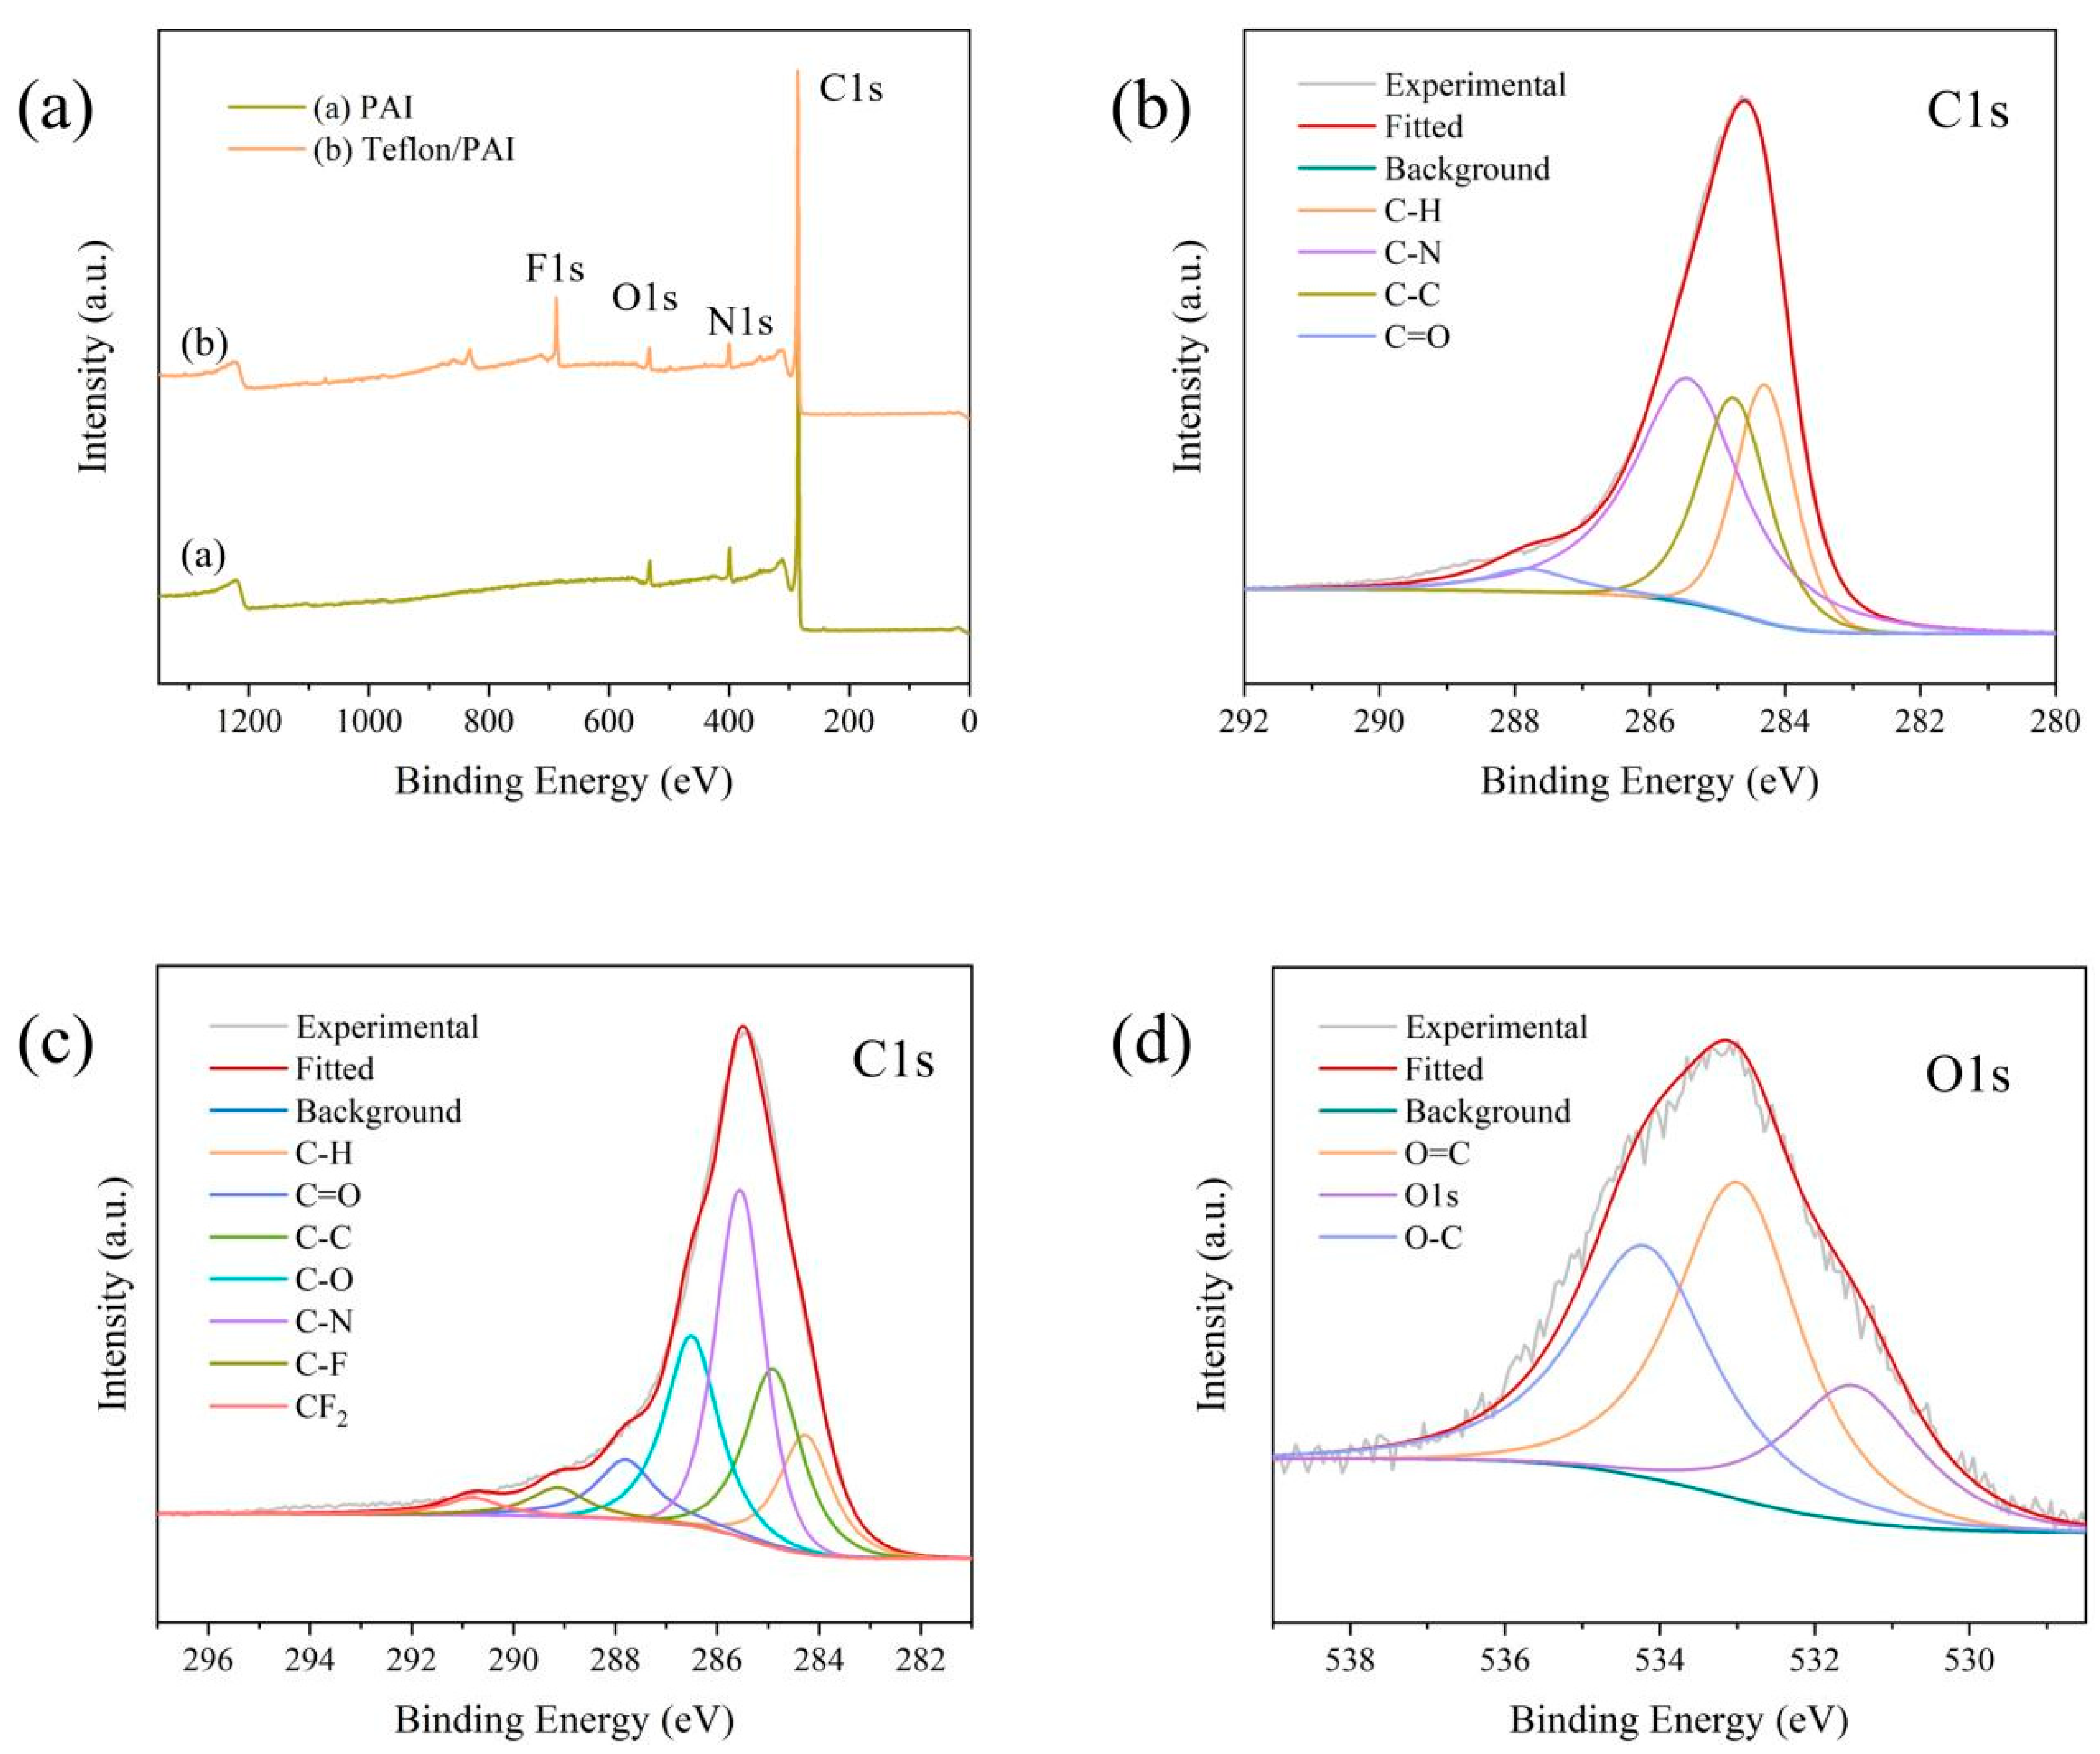
To further characterize elemental species as well as content and chemical composition of the membrane surface, pristine PAI membrane and Teflon/PAI composite membrane were tested and analyzed by XPS, and the results are displayed in Figure 8 and Table 3. As shown in the XPS full spectra of membranes, the characteristic peak of the F element was present in the Teflon/PAI composite membrane. In addition, it could be seen from Table 3 that C1s (90.76%), N1s (5.95%), and O1s (3.29%) content were conferred with the PAI membrane, whereas the Teflon/PAI membrane possessed F1s (9.06%) content, and the content of C1s and N1s decreased. This confirmed that Teflon AF2400 was coated on the surface of the PAI membrane. For the C1s fitting narrow spectra (Figure 8b,c), there were four characteristic peaks at 284.3 eV, 284.8 eV, 285.5 eV, and 287.8 eV from PAI and Teflon/PAI membranes, attributed to C-H, C-C, C-N, and C=O covalent bonds, respectively [45,46]. Furthermore, in the C1s fitting narrow spectrum of Teflon/PAI, C-F covalent bonds at 289.2 eV and 290.8 eV were observed, derived from -CF2 and -CF3 groups in the Teflon AF2400 coating [46,47]. The characteristic peak at 286.5 eV corresponded to the C-O covalent bonding, as shown in Figure 8c. The O1s fitting narrow spectrum (Figure 8d) was decomposed into three representative peaks with respect to O1s (531.5 eV), O=C (532.9 eV), and O-C (534.2 eV) [45,46,47]. Therefore, C-O and C-F covalent bonds from Teflon AF2400 were introduced on the Teflon/PAI membrane surface, as indicated in the C1s and O1s spectra.

3.3. Membrane Wettability

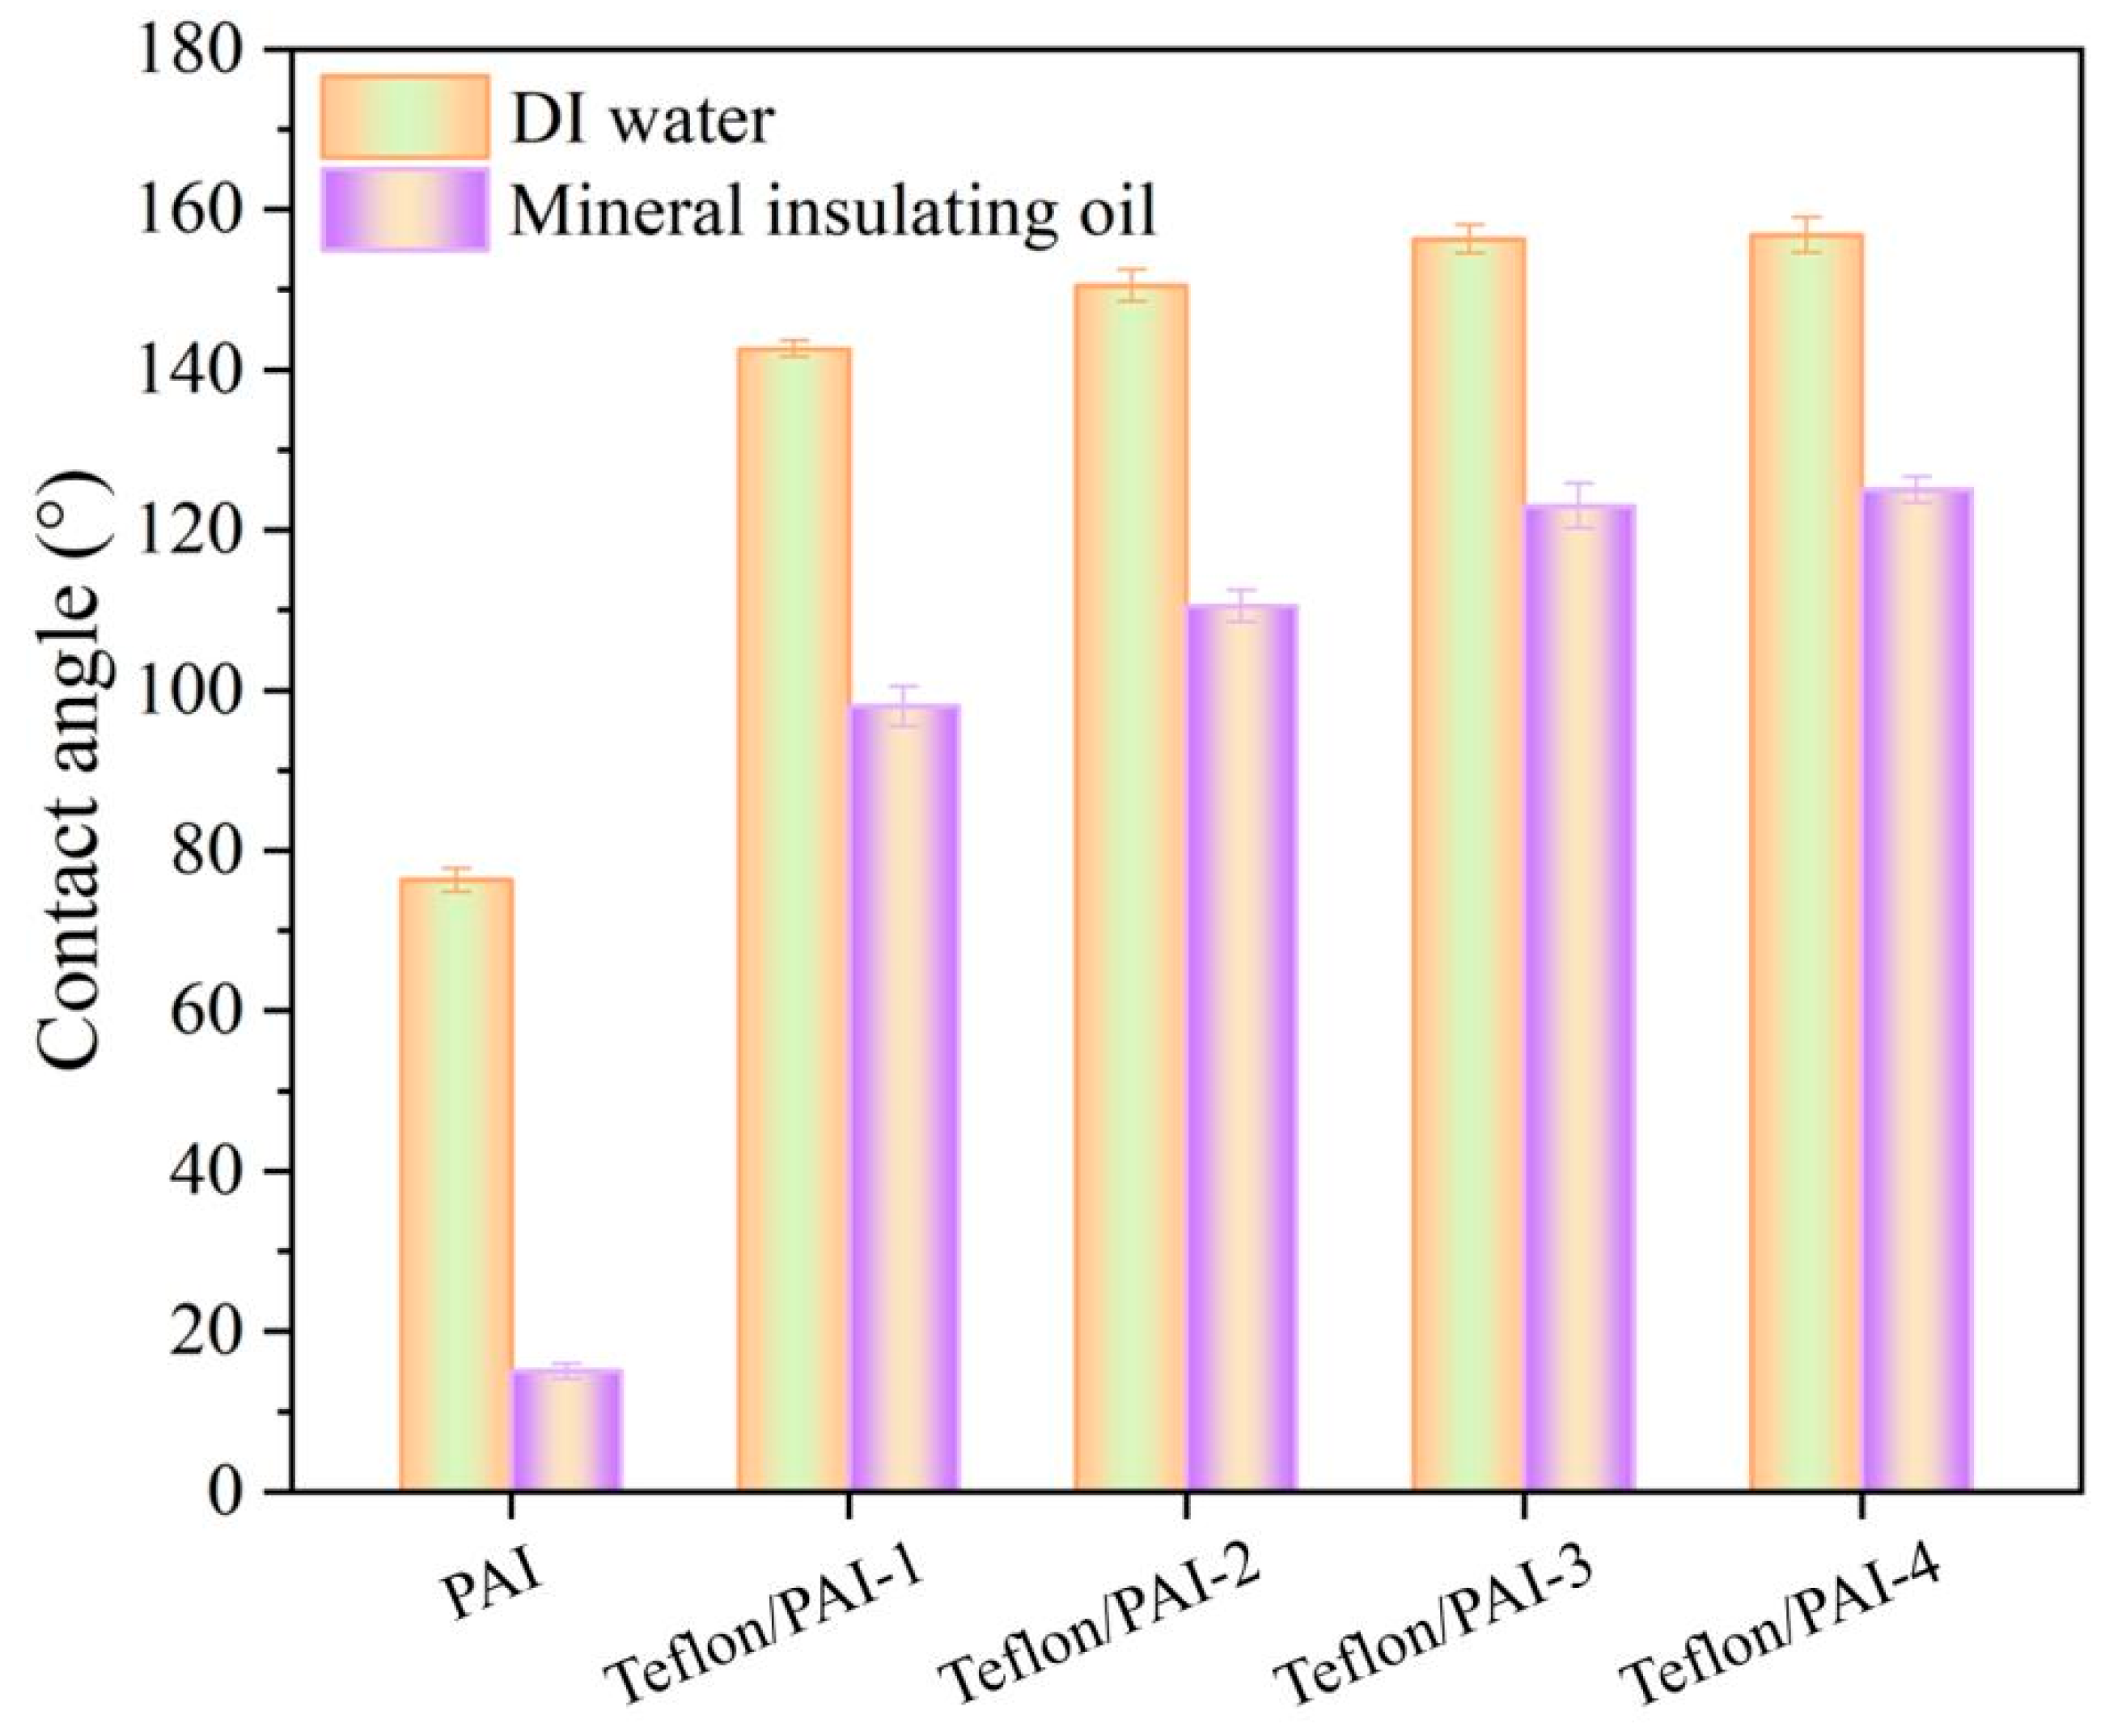
The wetting behavior of the membrane is crucial for the anti-wetting performance in the transformer oil-gas separation process. The wettability was characterized by testing contact angles and monitoring the state of droplets on the membrane surface. Contact angles (CAs) on the membrane surface were measured with DI water and mineral insulating oil at room temperature, and the results are shown in Figure 9. It was suggested that the CAs of pristine PAI membrane toward DI water and mineral insulating oil were 72.3 ± 1.5° and 15.0 ± 1.0° in the air at ambient temperature and pressure, respectively. It was attributed to the fact that amide groups in PAI interacted with water molecules through hydrogen bonding, showing hydrophilicity. Mineral insulating oil was liable to adsorb on the membrane surface, displaying a smaller oil contact angle and oleophilicity, because of low surface tension. After modification by the Teflon AF2400 functional layer, the composite membrane surface was covered with hydrophobic and oleophobic substances, such as -CF2 and -CF3 groups. This reduced the solid surface energy of the membrane surface, and CAs toward DI water and mineral insulating oil increased remarkably. Both mN·m−1 and dyn·cm−1 are used for evaluating surface tension, and 1 mN·m−1 is equal to 1 dyn·cm−1. The solid surface energy of Teflon AF2400 (15.6 dyn·cm−1) is smaller than the surface tension of mineral insulating oil (about 46 mN·m−1), and the composite membrane surface presented the repulsive state when contacted with droplets [34,36]. With the ascent of Teflon AF2400 concentration, CAs of the droplet on the composite membrane surface increased gradually and then tended to stabilize. CAs of Teflon/PAI-3 composite membrane toward DI water and mineral insulating oil were 156.3 ± 1.8° and 123.0 ± 2.5° in the air at ambient temperature and pressure, respectively. It was demonstrated that the Teflon/PAI-3 composite membrane exhibited a superhydrophobic and oleophobic state and possessed excellent omniphobicity.

3.4. Membrane Permeability

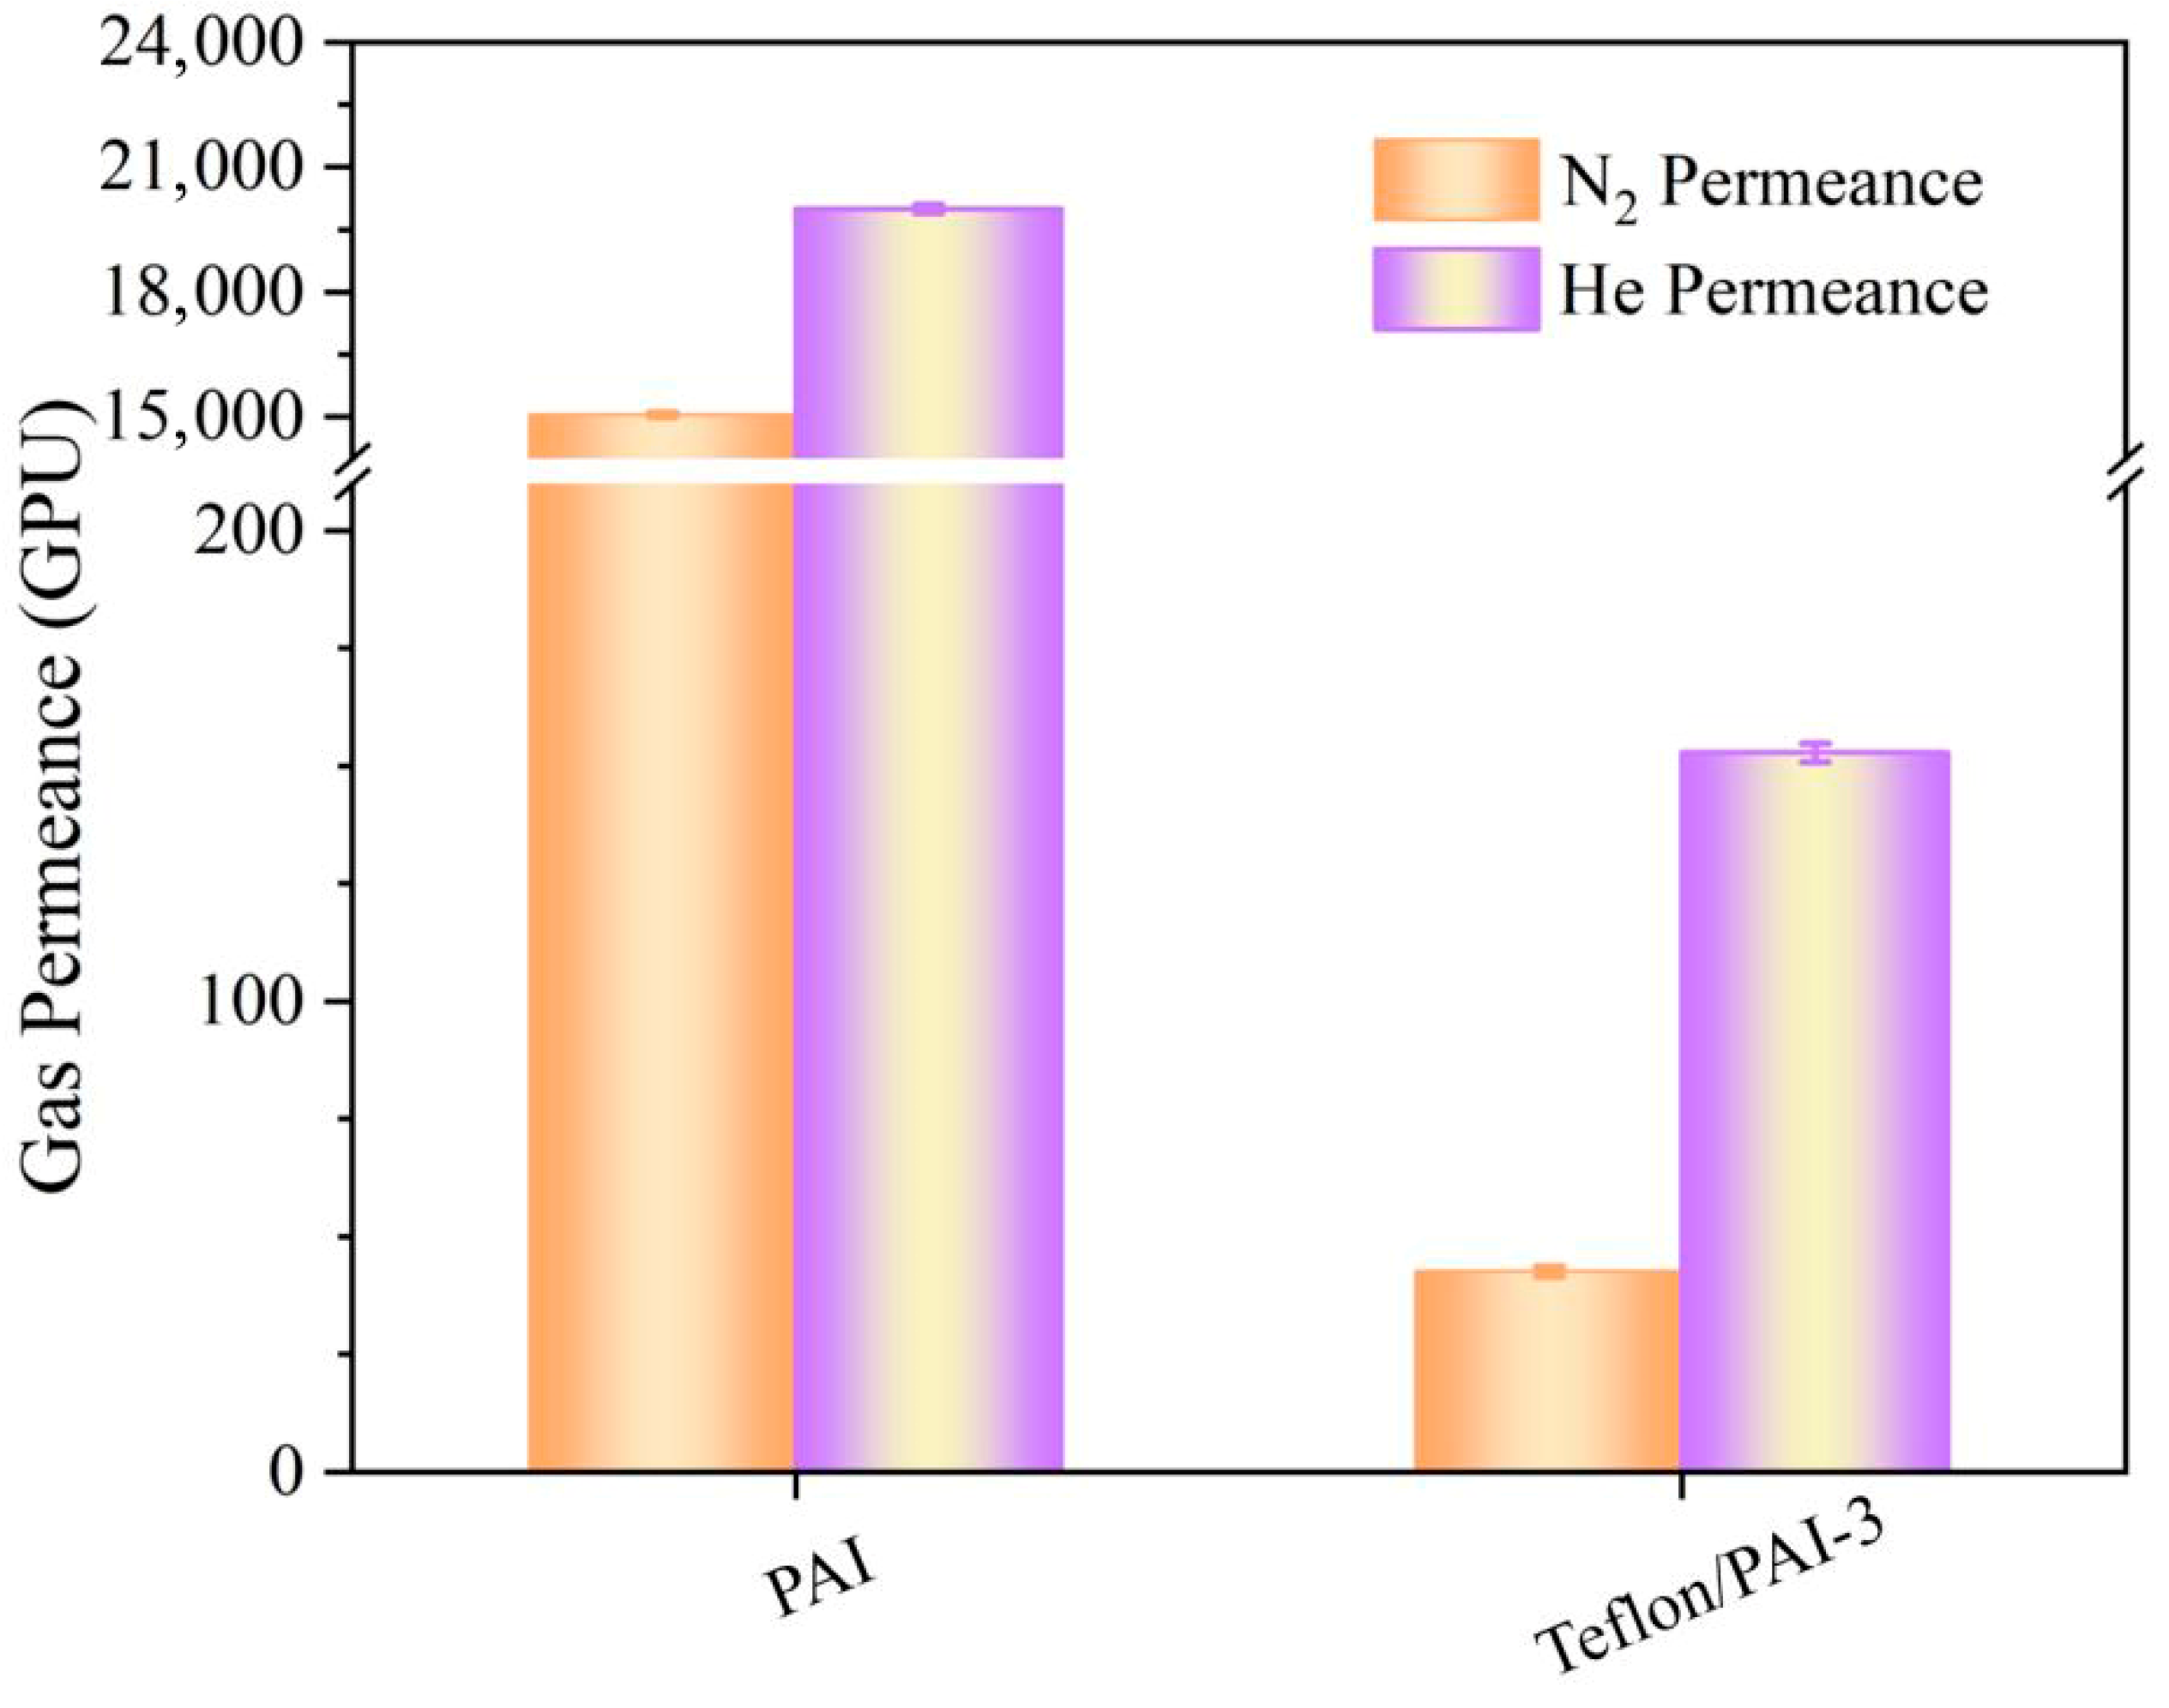
The separation of fault characteristic gases from transformer oil is the liquid–gas separation process. Based on the membrane surface omniphobicity, membrane permeability would influence the oil-gas separation efficiency directly [16]. The transmission rate of gas was higher, indicating that the membrane permeability was better. The permeability of pristine PAI membrane and Teflon/PAI-3 composite membrane was analyzed by a home-made gas permeability testing device, with N2 and He as the representative gases. In the measurement, the pressure was maintained at 0.2 MPa by adjusting the needle valve. The gas permeate rate was calculated, and the results are shown in Figure 10. It was established that permeate rates of N2 and He for pristine PAI membrane were 15,060 GPU and 20,100 GPU, respectively. The gas molecules were diffused in the membrane pores with less resistance, described by the dusty-gas model. However, after being modified by the dense functional layer, permeate rates of N2 and He for the Teflon/PAI-3 composite membrane decreased to 42.6 GPU and 152.8 GPU, respectively. Gas was transported in the functional layer with a dissolution-diffusion form, and the mass transfer resistance was mainly dominated by the functional layer in the membrane separation process. The adsorption and diffusion process of gas molecules in the Teflon AF2400 layer determined the permeate rate. In addition, the He/N2 selective ratio of Teflon/PAI-3 composite membrane (3.59) was higher than that of pristine PAI membrane (1.33), which increased by 170%. When gas molecules were transferred by viscous flow and Knudsen flow in membrane pores, the molecular dynamics diameter would affect the gas transmission efficiency. Meanwhile, the gas selective ratio was relevant to the solubility and the diffusion rate of gas molecules in the membrane transportation.

3.5. Membrane Mechanical Performance and Stability

The parameters were used to characterize the mechanical performance of pristine PAI membrane and Teflon/PAI-3 composite membrane, such as tensile stress at break, elongation at break, and Young’s modulus. The corresponding measurements were listed in Table 4. For pristine PAI membrane, the tensile stress at break was 34.8 ± 0.1 MPa, the elongation at break was 65.8 ± 0.2% and the Young’s modulus was 563.9 ± 0.3 MPa. In the same way, as for Teflon/PAI-3 composite membrane, the tensile stress at break was 42.8 ± 0.3 MPa, the elongation at break was 72.1 ± 0.1% and the Young’s modulus was 656.5 ± 0.2 MPa. It was found that tensile stress at break, elongation at break, and Young’s modulus were improved remarkably after Teflon AF2400 modification on the membrane surface. The modification process was beneficial to the elevation of mechanical performance, providing the foundation for the subsequent oil–gas separation tests.
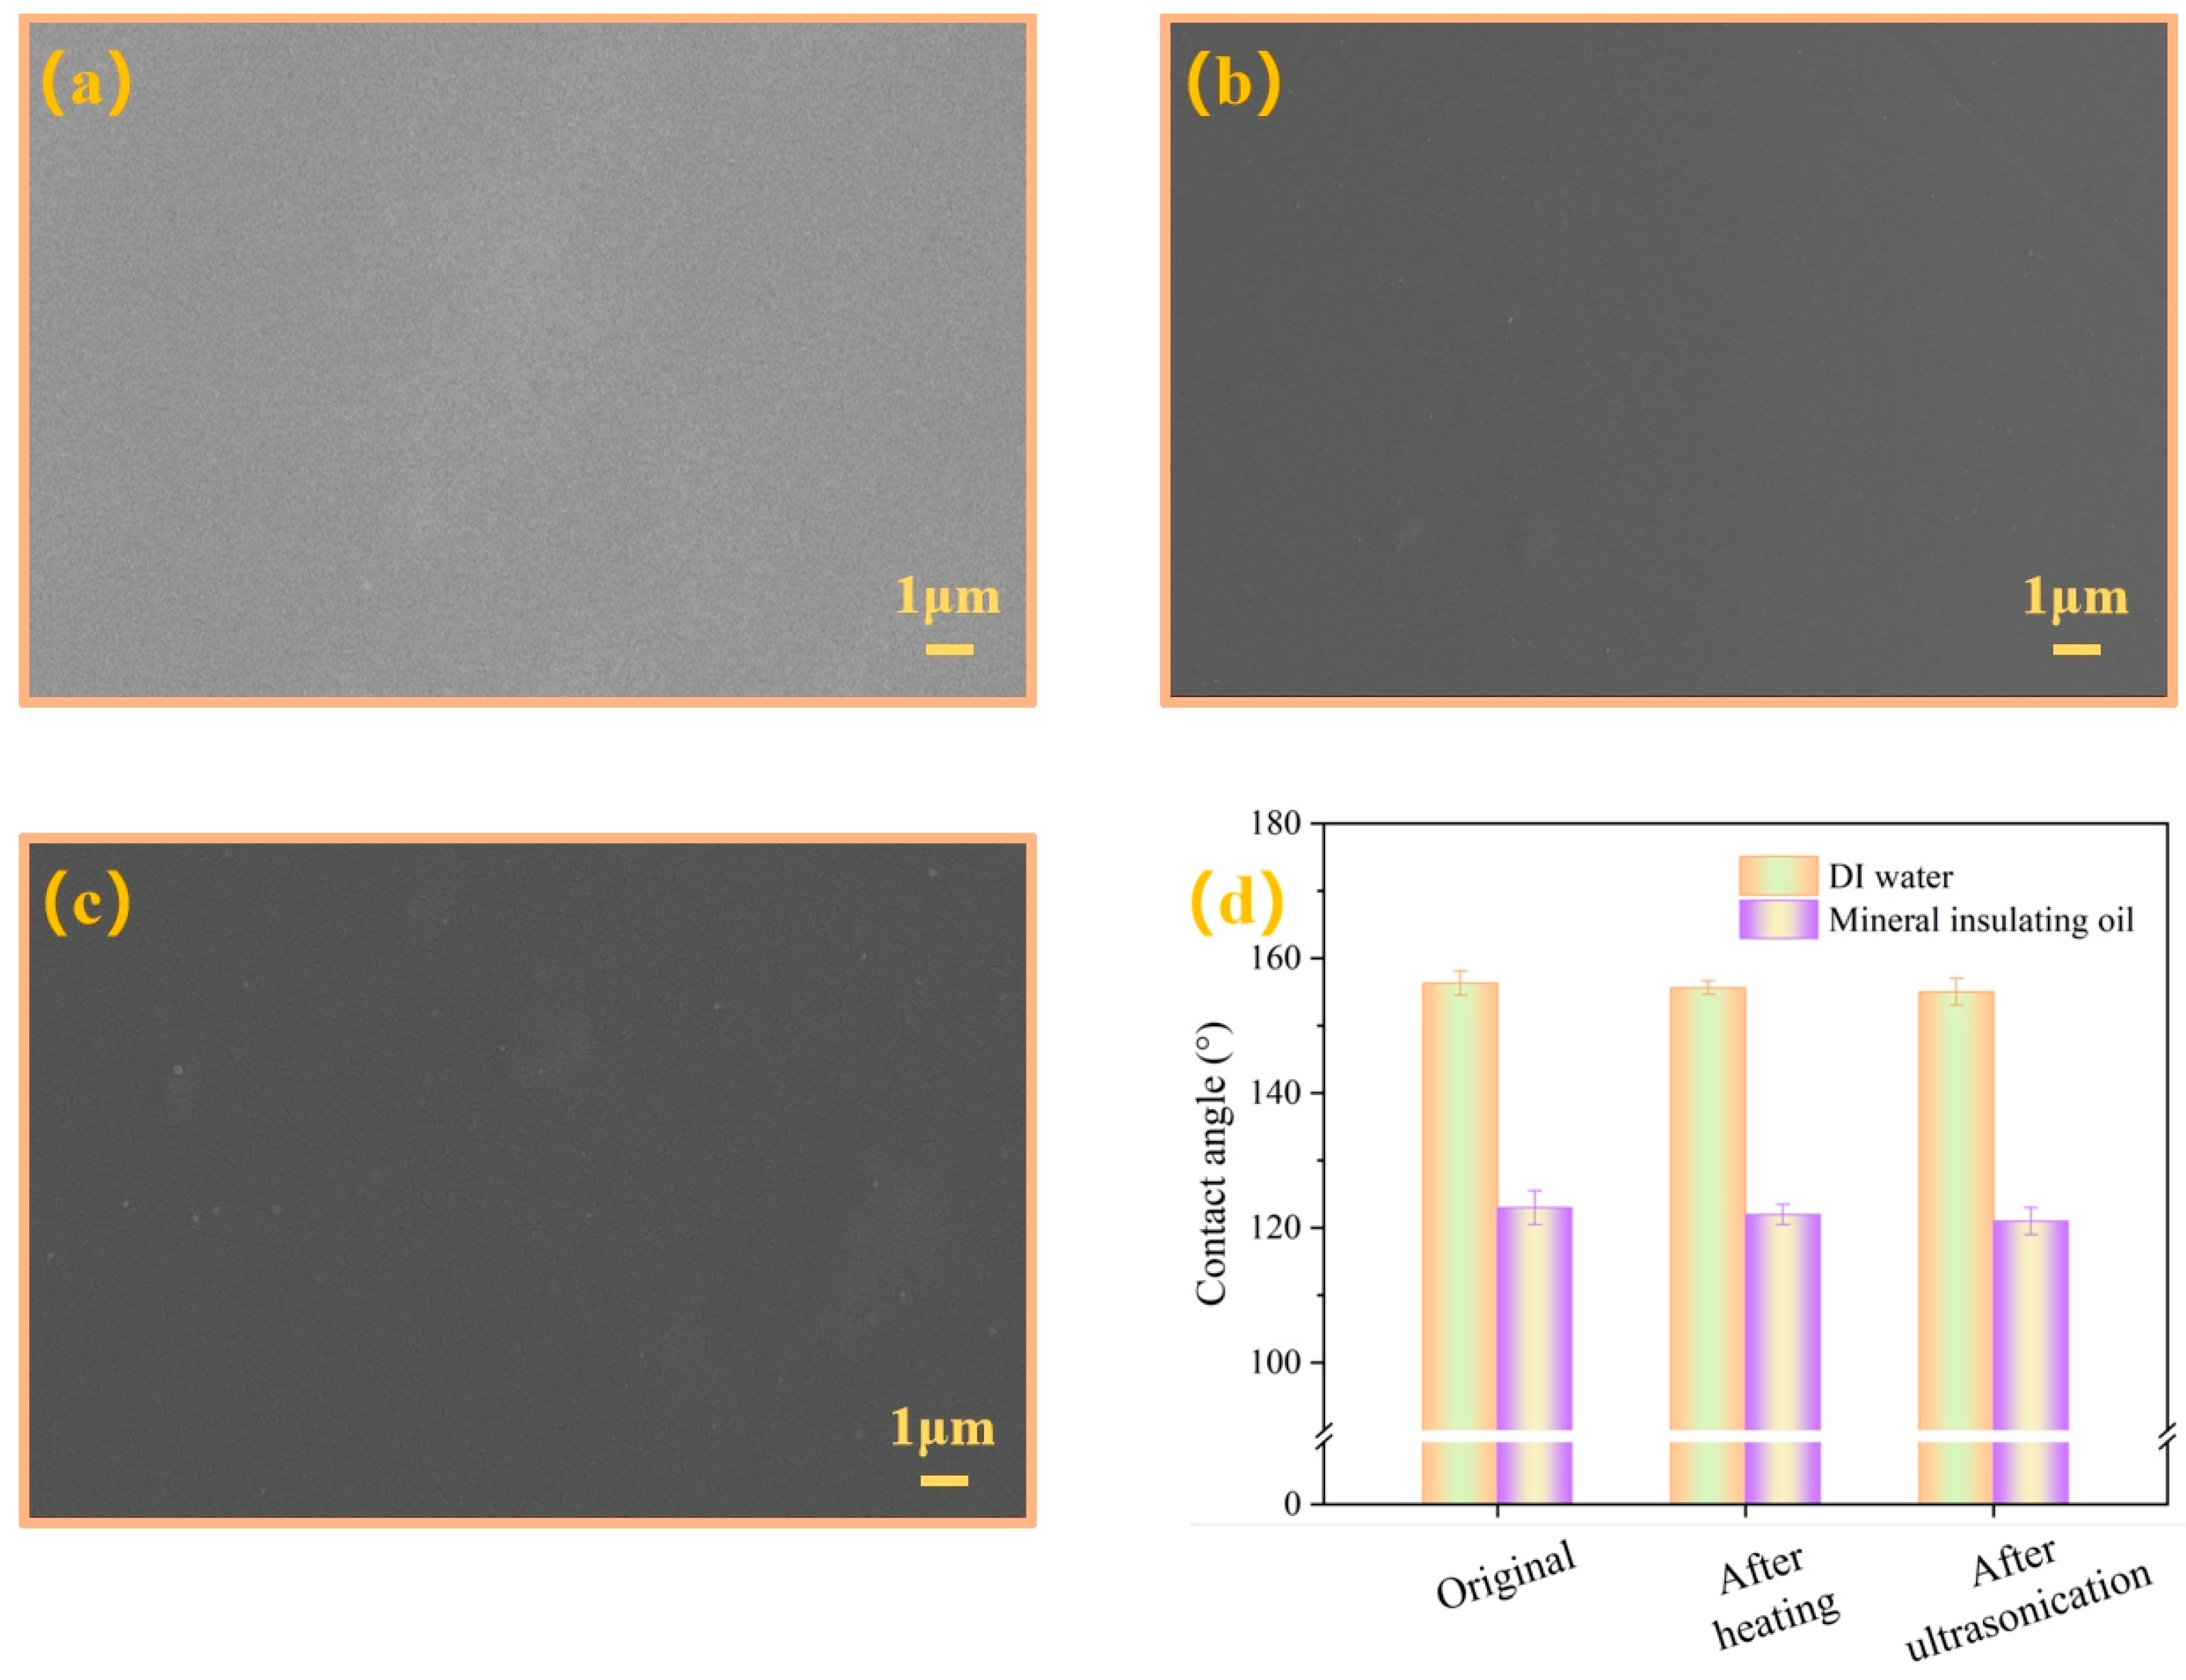
Membrane stability was also a significant factor in the membrane separation process. The changes in surface micro-morphology and contact angles for Teflon/PAI-3 composite membrane were presented in Figure 11, after heating treatment and ultrasonication. In detail, the membrane was soaked in the transformer oil at 80 °C for 168 h and treated continuously under ultrasonic conditions at room temperature for 12 h, respectively. After that, it was rinsed with PG and anhydrous ethanol, and then transferred into a vacuum oven to dry at 60 °C for 2 h. As displayed in Figure 11, after immersion at 80 °C for 168 h, the Teflon/PAI-3 composite membrane surface still maintained the initial morphology, showing the dense structure. CAs of Teflon/PAI-3 membrane surface toward DI water and mineral insulating oil were 155.8 ± 1.0° and 122.0 ± 1.5°, respectively, and remained stable. After ultrasonic treatment at ambient temperature for 12 h, the surface morphology of the Teflon/PAI-3 composite membrane was dense, and no damage had occurred. At the same time, the contact angles of DI water and mineral insulating oil on the Teflon/PAI-3 membrane surface were 155.0 ± 1.5° and 121.0 ± 2.0°, respectively, and there was no significant decrease. Results indicated that the Teflon/PAI-3 composite membrane possessed excellent stability.

3.6. Membrane Separation Performance

The oil–gas separation process in the transformer oil could be explained by the dissolution-diffusion model, as follows: Firstly, the gas comes into contact with the membrane surface. Secondly, it is dissolved and diffused in the membrane, and it arrives at the other side of the membrane. Finally, it is released from the membrane surface and enters the permeate. The bidirectional diffusion of gas in the membrane was conducted until reaching a dynamic equilibrium, with the gas concentration in the permeate remaining constant. Gas permeation of oil and gas phases on both sides of the separation membrane complied with the following relationship [36]:
C g = ( 9.87 K C 0 C g 0 ) × 1 e x p 10 5 H A t d V + C g 0
where C g 0 and C g are the initial concentration, and the concentration when the permeation time is t in the gas chamber at 100 kPa, respectively (μL·L−1), C 0 is the dissolved gas concentration in the oil at 100 kPa (μL·L−1), K is the equilibrium constant in the oil-gas separation process, H is the permeate coefficient (m2·s−1·Pa−1), A is the effective area of membrane (m2), d is the thickness of membrane (m), V is the volume of gas chamber (m3), and t is the permeation time (s).
When the oil-gas separation process reached the equilibrium state, the membrane and the gas chamber structure did not influence the gas volume fraction. However, the membrane and the gas chamber structure affected the equilibrium time. The structural parameter was denoted as b, which was calculated by the following equation [28,36]:
b = 10 5 H A d V
During the initial stage, there was only background gas in the gas chamber, and the permeate gas concentration was 0, namely C g 0   = 0. Equation (5) was simplified as:
C g = 9.87 K C 0 1 e x p b t
C m a x was the maximum value of gas concentration in the gas chamber, namely C m a x = 9.87 K C 0 . The gas concentration was indicated as:
C g = C m a x 1 exp b t
In practice, when sufficient time has passed to reach the equilibrium state in the oil–gas separation process, the equilibrium time is recorded with t90. It was defined as the time required to reach 90% of the maximum value C m a x . t90 was obtained from Equations (5) and (7) as follows:
t 90 = 2.3 V d 10 5 H A
As shown in Equation (8), the oil-gas separation equilibrium time t90 was closely related to A, d, and V. It was proportional to the gas chamber volume and the membrane thickness. With the increase in membrane effective contact area, the oil-gas separation equilibrium time decreased.
In the oil-gas separation process, membrane surface oleophobicity, and membrane permeability were crucial factors in the service life and separation performance of the membrane. Based on the analysis of morphology structure, wettability, and permeability, the Teflon/PAI-3 composite membrane demonstrated excellent omniphobic property. Meanwhile, considering that the thickness of the modified layer had an effect on the separation efficiency, Teflon/PAI-3 composite membrane was selected to characterize the oil-gas separation performance with a similar MD device.
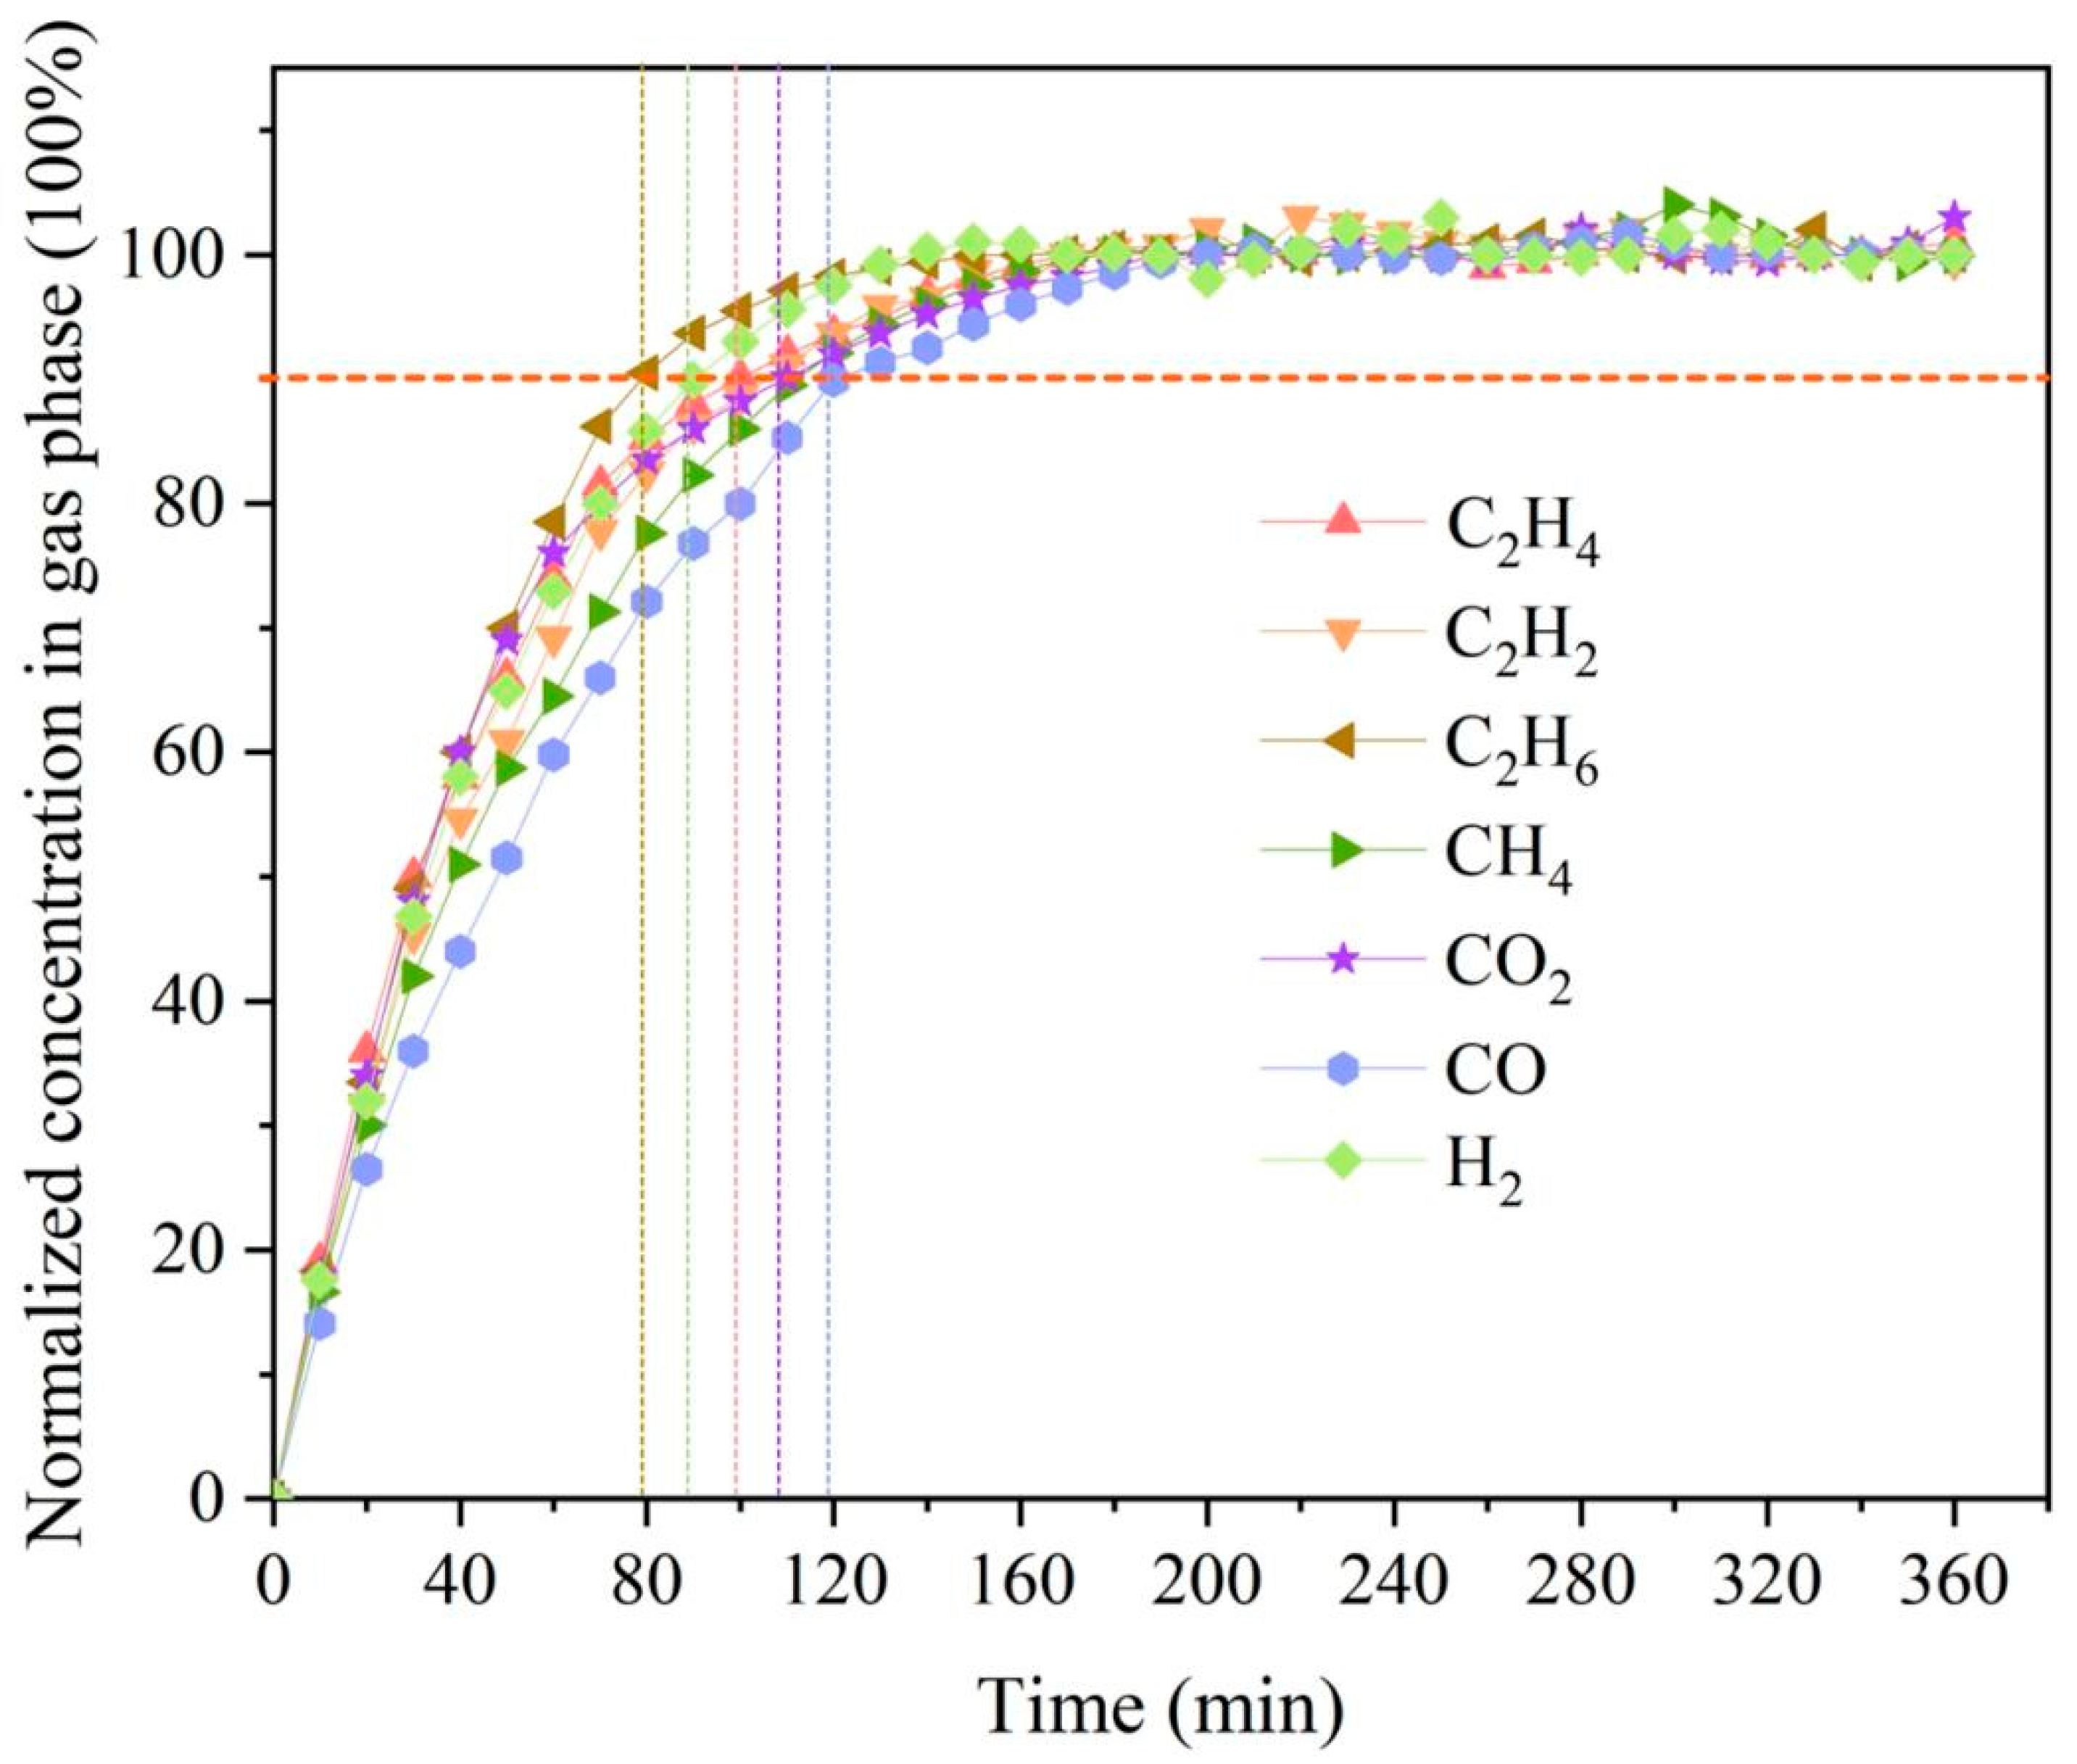
The insulating oil dissolved by representative gases (C2H4, C2H2, C2H6, CH4, CO2, CO, H2) was uesd as the feed. The gas concentrations in the feed were 16.84 μL·L−1 (C2H4), 3.64 μL·L−1 (C2H2), 24.01 μL·L−1 (C2H6), 12.46 μL·L−1 (CH4), 1475.29 μL·L−1 (CO2), 457.24 μL·L−1 (CO) and 65.94 μL·L−1 (H2), respectively. The feed was kept constant during the test, and the variations in the gas concentration in the permeate were presented in Figure 12. It was observed that the gas concentration in the permeate increased gradually until it stabilized in a certain range, with the operating time increasing. The equilibrium time of seven types of gases was 100 min (C2H4 and C2H2), 80 min (C2H6), 110 min (CH4 and CO2), 120 min (CO), and 90 min (H2), respectively. The gases in the feed and permeate could reach the dynamic equilibrium in 2 h [28,36]. However, when a pristine PAI membrane was tested for less than 10 min, small oil droplets appeared in the permeate gas path, indicating that membrane pores were wetted by the feed. The insulating oil penetrated through the membrane, so that the oil-gas separation process failed. Due to the modification of the Teflon AF2400 functional layer, the Teflon/PAI-3 composite membrane presented excellent omniphobic characteristics. It was difficult for insulating oil to permeate through the membrane, and thus the separation process was conducted to evolve the dissolved gas. In addition, Table 5 summarizes the membrane performance of previously reported and current membranes in oil-gas separation applications. Ceramic membrane tube cast by 1.8 wt% Teflon AF2400 with an 8 μm separation layer presented the oil-gas separation equilibrium time for 5 h. The thickness of the separation layer affected the transfer process and increased the mass transfer resistance. The thin separation layer was beneficial for promoting the oil-gas separation equilibrium. Compared to the literature, the omniphobic Teflon/PAI-3 composite membrane with a 1.11 μm separation layer in this work exhibited shorter oil-gas separation equilibrium time and higher separation efficiency, indicating the potential to be applied in monitoring the operating condition of oil-filled electrical equipment.

4. Conclusions

The Teflon/PAI composite membrane with omniphobicity was fabricated via a convenient strategy, namely Teflon AF2400 functional layer modified on the pristine PAI membrane with a vacuum-assisted dip-coating method. It was found that the pristine PAI hollow fiber membrane possessed a porous surface and finger-like as well as sponge-like mixed cross-section morphology. Teflon AF2400 was coated on the pristine membrane, forming a dense functional layer. The optimal Teflon/PAI-3 composite membrane exhibited superhydrophobic and oleophobic characteristics with surface contact angles of 156.3 ± 1.8° and 123.0 ± 2.5° toward DI water and mineral insulating oil, respectively. Additionally, the Teflon/PAI-3 composite membrane soaked in the transformer oil maintained excellent mechanical stability after heating treatment and ultrasonication. Meanwhile, the mechanical performance of Teflon/PAI-3 composite membrane improved remarkably, including tensile stress at break, elongation at break, and Young’s modulus. Through a series of characterizations, such as ATR-FTIR and XPS, it was verified that C-F covalent bonds from Teflon AF2400 constructed the oleophobic interface. In the oil-gas separation process, the dissolved gases in the insulating oil were extracted, and the dynamic equilibrium time was within 2 h. After a 168 h thermal and ultrasonic treatment, the hydrophobicity and oleophobicity on the Teflon/PAI membrane surface remained essentially unchanged. When the oil-gas separation time was 2 h, the gas concentration in the permeate remained consistent with previous results, with a testing error within 3%. It demonstrated good potential for practical application to monitor the operating condition of oil-filled electrical equipment in the power industry. In the subsequent experimental process, long-term DGA monitoring tests should be further investigated.

Supplementary Materials

The following supporting information can be downloaded at: https://www.mdpi.com/article/10.3390/coatings15111319/s1.

Author Contributions

W.Z.: Conceptualization, Methodology, Formal analysis, Investigation, Resources, Data curation, Writing-original draft, Visualization. Q.Y.: Methodology, Validation, Writing-review and editing, Supervision. Y.J.: Supervision, Writing-review and editing. Y.M.: Project administration, Funding acquisition. L.S.: Resources, Project administration, Validation. X.Z.: Writing-review and editing. H.G.: Supervision. C.C.: Resources, Project administration, Validation. All authors have read and agreed to the published version of the manuscript.

Funding

Financial support provided by the Science and Technology Project of State Grid Corporation of China (Grant No. 5700-202335249A-1-1-ZN) is acknowledged gratefully.

Institutional Review Board Statement

Not applicable.

Informed Consent Statement

Not applicable.

Data Availability Statement

Data are contained within the article.

Conflicts of Interest

The authors declare that they have no known competing financial interests or personal relationships that could have appeared to influence the work reported in this paper.

References

  1. Han, X.; Huang, S.; Zhang, X.; Zhu, Y.; An, G.; Du, Z. A transformer condition recognition method based on dissolved gas analysis features selection and multiple models fusion. Eng. Appl. Artif. Intell. 2023, 123, 106518–106526. [Google Scholar] [CrossRef]
  2. Chatterjee, S.; Haque, N.; Pradhan, A.K.; Dalai, S.; Chatter-jee, B. Estimation of conductivity at reduced time for sensing moisture content of oil-paper insulation. IEEE Sens. J. 2020, 21, 12999–13006. [Google Scholar] [CrossRef]
  3. Wang, H.; Qu, G.; Li, S. Role of metal passivator on production of hydrogen gas in insulating oil and oil-impregnated insulation paper. Energy Rep. 2024, 11, 1544–1550. [Google Scholar] [CrossRef]
  4. Li, Z.; Chen, W.; Yan, X.; Zhou, Q.; Wang, H. An outlier robust detection method for online monitoring data of dissolved gases in transformer oils. Flow. Meas. Instrum. 2025, 102, 102793–102800. [Google Scholar] [CrossRef]
  5. Soni, R.; Mehta, B. Diagnosis and prognosis of incipient faults and insulation status for asset management of power transformer using fuzzy logic controller & fuzzy clustering means. Elec. Power Syst. Res. 2023, 220, 109256.1–109256.18. [Google Scholar]
  6. Ahmed, R.; Liu, J.; Zhang, M.; Fan, X. Reliability and condition assessment techniques for oil-immersed power equipment under varying temperatures: A review. Energy Rep. 2025, 14, 1896–1916. [Google Scholar] [CrossRef]
  7. Amodu, I.O.; Raimi, M.; Ogbogu, M.N.; Benjamin, I.; Gulack, A.O.; Adeyinka, A.S.; Louis, H. Mn-doped covalent organic framework (COF), graphene, and their nanocomposite (Mn@GP/COF) as sensors for oil-dissolved gases in transformer: A computational study. Mater. Today Commun. 2024, 38, 108363–108379. [Google Scholar] [CrossRef]
  8. Kiran, S.R.; Mariprasath, T.; Basha, C.H.H.; Murali, M.; Reddy, M.B. Thermal degrade analysis of solid insulating materials immersed in natural ester oil and mineral oil by DGA. Mater. Today Proc. 2022, 52, 315–320. [Google Scholar] [CrossRef]
  9. Suwarno; Sutikno, H.; Prasojo, R.A.; Abu-Siada, A. Machine learning based multi-method interpretation to enhance dissolved gas analysis for power transformer fault diagnosis. Heliyon 2024, 10, 25975–25995. [Google Scholar] [CrossRef]
  10. Std C57.104-2019; Guide for the Interpretation of Gases Generated in Mineral Oil-Immersed Transformers. IEEE: New York City, NY, USA, 2019.
  11. Sun, C.; Ohodnicki, P.R.; Stewart, E.M. Chemical sensing strategies for real-time monitoring of transformer oil: A review. IEEE Sens. J. 2017, 18, 5786–5806. [Google Scholar] [CrossRef]
  12. Velasquez, R.M.A.; Velasquez, R.F.A. Enhanced fault detection in zig-zag transformers: Insights from dissolved gas analysis and transient current analysis. Results Eng. 2025, 25, 104166–104180. [Google Scholar] [CrossRef]
  13. Ali, M.S.; Bakar, A.H.A.; Omar, A.; Jaafar, A.S.A.; Mohamed, S.H. Conventional methods of dissolved gas analysis using oil-immersed power transformer for fault diagnosis: A review. Electr. Power Syst. Res. 2023, 216, 109064–109079. [Google Scholar] [CrossRef]
  14. Uddin, A.I.; Yaqoob, U.; Chung, G.S. Dissolved hydrogen gas analysis in transformer oil using Pd catalyst decorated on ZnO nanorod array. Sens. Actuators B Chem. 2016, 226, 90–95. [Google Scholar] [CrossRef]
  15. Fei, S.; Wang, M.; Miao, Y.; Tu, J.; Liu, C. Particle swarm optimization based support vector machine for forecasting dissolved gases content in power transformer oil. Energy Convers. Manag. 2009, 50, 1604–1609. [Google Scholar] [CrossRef]
  16. Park, M.S.; Lee, J.H.; Park, Y.; Yoo, R.; Park, S.; Jung, H.; Kim, W.; Lee, H.S.; Lee, W. Doping effects of ZnO quantum dots on the sensitive and selective detection of acetylene for dissolved-gas analysis applications of transformer oil. Sens. Actuators B Chem. 2019, 299, 126992–127001. [Google Scholar] [CrossRef]
  17. Huang, Z.; Zhou, W.; Xia, J.; Gu, W.; Zhou, Q. First-principles investigation of Pd modified HfTe2 monolayer membranes: Detection of dissolved gas in transformer oil. Colloids Surf. A Physicochem. Eng. Asp. 2025, 726, 137782–137793. [Google Scholar] [CrossRef]
  18. Wang, D.; Zhou, L.; Yang, Z.; Cui, Y.; Wang, L.; Jiang, J.; Guo, L. A new testing method for the dielectric response of oil-immersed transformer. IEEE Trans. Ind. Electron. 2020, 67, 10833–10843. [Google Scholar] [CrossRef]
  19. de Faria, H., Jr.; Costa, J.G.S.; Olivas, J.L.M. A review of monitoring methods for predictive maintenance of electric power transformers based on dissolved gas analysis. Renew. Sustain. Energy Rev. 2015, 46, 201–209. [Google Scholar] [CrossRef]
  20. Sun, H.; Huang, Y.; Huang, C. A Review of Dissolved Gas Analysis in Power Transformers. Energy Procedia 2012, 14, 1220–1225. [Google Scholar] [CrossRef]
  21. Li, Z.; Zhang, Q.; Wang, Z.; Dai, J. A highly sensitive low-pressure TDLAS sensor for detecting dissolved CO and CO2 in transformer insulating oil. Opt. Laser Technol. 2024, 174, 110622–110630. [Google Scholar] [CrossRef]
  22. Chen, T.; Ma, F.; Zhao, Y.; Zhao, Y.; Wan, L.; Li, K.; Zhang, G. Portable ppb-level acetylene photoacoustic sensor for transformer on-field measurement. Optik 2021, 243, 167440–167448. [Google Scholar] [CrossRef]
  23. Zhang, Z.; Zhang, Y.; Li, T.; Zhang, C.; Yu, L.; Luo, Z.; Luo, B.; Tian, B.; Wang, H. Complementary MEMS gas sensor array and lightweight deep learning for DGA in transformer fault diagnosis. Sens. Actuators B Chem. 2025, 444, 138482–138494. [Google Scholar] [CrossRef]
  24. Li, C.; Chen, K.; Zhao, J.; Qi, H.; Zhao, X.; Ma, F.; Han, X.; Guo, M.; An, R. High-sensitivity dynamic analysis of dissolved gas in oil based on differential photoacoustic cell. Opt. Lasers Eng. 2023, 161, 107394–107401. [Google Scholar] [CrossRef]
  25. Hong, T.; Kang, J.; Wang, S.; Li, Y.; Jing, X. Transformer oil-soaking stability and gas-permeation performance of Teflon AF2400 membranes. Mater. Lett. 2025, 401, 139235–139238. [Google Scholar] [CrossRef]
  26. Qu, L.; Papaioannou, E.I. Development of mixed ionic and electronic conducting materials for gas separation membranes: A critical overview. Chem. Eng. J. 2024, 496, 153791–153803. [Google Scholar] [CrossRef]
  27. Liu, S.; Ma, L.; Chen, C.; Chen, C.; Lin, Y.S. Highly gas permeable, ultrathin Teflon AF2400/γ-alumina composite hollow fiber membranes for dissolved gas analysis. J. Membr. Sci. 2017, 540, 243–250. [Google Scholar] [CrossRef]
  28. Song, H.; Wang, H.; Wang, H.; Liu, Y.; Liu, S.; Chen, C. Rapid evaluation method for oil-gas separation membrane utilizing mass spectrometry. Chin. J. Anal. Chem. 2025, 53, 100515–100523. [Google Scholar] [CrossRef]
  29. Criscuoli, A.; Macedonio, F.; Brunetti, A.; Tocci, E.; Drioli, E. Impact of Membrane Engineering on the Process Engineering Progresses: Towards a Sustainable Development. Chem. Eng. Process. Process Intensif. 2023, 189, 109385. [Google Scholar] [CrossRef]
  30. Buggenhout, S.V.; Verbeke, R.; Davenport, D.M.; Vankelecom, I.F. Drying polymer membranes for preservation: A review. J. Membr. Sci. 2025, 731, 124190–124207. [Google Scholar] [CrossRef]
  31. Bakar, N.; Abu-Siada, A.; Islam, S. A review of dissolved gas analysis measurement and interpretation techniques. IEEE Electr. Insul. Mag. 2014, 30, 39–49. [Google Scholar] [CrossRef]
  32. Chen, T.; Li, K.; Liao, Z.; Xie, X.; Zhang, G. Influence of oil status on membrane-based gas-oil separation in DGA. Sensors 2022, 22, 3629. [Google Scholar] [CrossRef]
  33. Elmanovich, I.V.; Kondratenko, M.S.; Kolomytkin, D.O.; Gallyamov, M.O.; Khokhlov, A.R. Active layer materials coated with Teflon AF nano-films deposited from solutions in supercritical CO2 for fuel cell applications. Int. J. Hydrog. Energy 2013, 38, 10592–10601. [Google Scholar] [CrossRef]
  34. Zhang, H.; Wang, S.; Weber, S.G. Morphology and free volume of nanocomposite Teflon AF 2400 films and their relationship to transport behavior. J. Membr. Sci. 2013, 443, 115–123. [Google Scholar] [CrossRef]
  35. Li, C.; Ma, F.; Sun, C.; Qi, H.; Han, X.; Guo, M.; Chen, K. In-situ detection of dissolved C2H2/CH4 with frequency-division-multiplexed fiber-optic photoacoustic sensor. Sens. Actuators B Chem. 2025, 435, 137651–137659. [Google Scholar] [CrossRef]
  36. Han, Y.; Ding, F.; Hao, C.; Lv, S.; Wang, X. The oil-gas separation characteristics of ceramic/Teflon AF2400 composite membrane. Sep. Purif. Technol. 2012, 88, 19–23. [Google Scholar] [CrossRef]
  37. State Grid Corporation of China. Technical Specification for Online Monitoring Devices of Dissolved Gases in Transformer Oil: Q/GDW 10536-2021; State Grid Corporation of China: Bejing, China, 2021; pp. 5–6. [Google Scholar]
  38. IEC 60567; Oil-Filled Electrical Equipment—Sampling of Gases and Analysis of Free and Dissolved Gases—Guidance. IEC: Geneva, Switzerland, 2011.
  39. IEC 60599; Mineral Oil-Filled Electrical Equipment in Service—Guidance on the Interpretation of Dissolved and Free Gases Analysis. IEC: Geneva, Switzerland, 2015.
  40. Mousavi, S.M.; Raveshiyan, S.; Amini, Y.; Zadhoush, A. A critical review with emphasis on the rheological behavior and properties of polymer solutions and their role in membrane formation, morphology, and performance. Adv. Colloid. Interface Sci. 2023, 319, 102986–103018. [Google Scholar] [CrossRef]
  41. Lin, D.; Chang, C.; Chen, T.; Cheng, L. Microporous PVDF membrane formation by immersion precipitation from water/TEP/PVDF system. Desalination 2002, 145, 25–29. [Google Scholar] [CrossRef]
  42. Zhang, Y.; Wang, R.; Yi, S.; Setiawana, L.; Hu, X.; Fane, A.G. Novel chemical surface modification to enhance hydrophobicity of polyamide-imide (PAI) hollow fiber membranes. J. Membr. Sci. 2011, 380, 241–250. [Google Scholar] [CrossRef]
  43. Chen, Q.; Zhang, Z.; Huang, Y.; Liu, A.; Wang, H.; Zhou, R.; Kang, S.; Li, J.; Li, N. Thermally stable polyamide-imide (PAI) hierarchical porous separator for lithium metal batteries. Adv. Membr. 2025, 5, 100168–100177. [Google Scholar] [CrossRef]
  44. Helali, N.; Rastgar, M.; Ismail, M.F.; Sadrzadeh, M. Development of underwater superoleophobic polyamide-imide (PAI) microfiltration membranes for oil/water emulsion separation. Sep. Purif. Technol. 2020, 238, 116451–116464. [Google Scholar] [CrossRef]
  45. Li, X.; Shan, H.; Cao, M.; Li, B. Mussel-inspired modification of PTFE membranes in a miscible THF-Tris buffer mixture for oil-in-water emulsions separation. J. Membr. Sci. 2018, 555, 237–249. [Google Scholar] [CrossRef]
  46. Zhang, W.; Lu, Y.; Liu, J.; Li, X.; Li, B.; Wang, S. Preparation of re-entrant and anti-fouling PVDF composite membrane with omniphobicity for membrane distillation. J. Membr. Sci. 2020, 595, 117563–117576. [Google Scholar] [CrossRef]
  47. Zhang, W.; Hu, B.; Wang, Z.; Li, B. Fabrication of omniphobic PVDF composite membrane with dual-scale hierarchical structure via chemical bonding for robust membrane distillation. J. Membr. Sci. 2021, 622, 119038–119052. [Google Scholar] [CrossRef]
Figure 1. Schematic diagram of hollow fiber membrane spinning setup by the dry-wet phase inversion method.
Coatings 15 01319 g001
Figure 2. Schematic diagram of the Teflon/PAI composite membrane fabrication process.
Coatings 15 01319 g002
Figure 3. Schematic diagram of gas permeability test setup.
Coatings 15 01319 g003
Figure 4. Schematic diagram of oil–gas separation performance test setup.
Coatings 15 01319 g004
Figure 5. SEM images of pristine hollow fiber membranes: (a,d) cross-section; (g) outer surface-PAI-1; (b,e) cross-section; (h) outer surface-PAI-2; (c,f) cross-section; and (i) outer surface-PAI-3.
Coatings 15 01319 g005
Figure 6. SEM images of Teflon/PAI composite membranes: (a1) surface and (a2) cross-section-Teflon/PAI-1; (b1) surface and (b2) cross-section-Teflon/PAI-2; (c1) surface and (c2) cross-section-Teflon/PAI-3, and (d1) surface and (d2) cross-section-Teflon/PAI-4.
Coatings 15 01319 g006
Figure 7. ATR-FTIR spectra of hollow fiber membranes: (a) PAI and (b) Teflon/PAI.
Coatings 15 01319 g007
Figure 8. XPS spectra of hollow fiber membranes: (a) full spectra of PAI and Teflon/PAI, (b) C1s fitting narrow spectra of PAI, (c) C1s fitting narrow spectra of Teflon/PAI, and (d) O1s fitting narrow spectra of Teflon/PAI.
Coatings 15 01319 g008
Figure 9. Contact angles of PAI and Teflon/PAI membranes, standard deviations were obtained from at least three different measurements.
Coatings 15 01319 g009
Figure 10. Gas permeance of PAI and Teflon/PAI membranes.
Coatings 15 01319 g010
Figure 11. SEM microscopic images and surface contact angles of Teflon/PAI-3 composite membrane before and after heating and ultrasonication: (a) original photographs, (b) heating treatment, (c) ultrasonic treatment, and (d) the contact angle variation before and after treatment.
Coatings 15 01319 g011
Figure 12. The gas permeable test in the oil/gas separation process for the Teflon/PAI-3 composite membrane.
Coatings 15 01319 g012
Table 1. The spinning conditions of the hollow fiber membrane substrate.
Spinning ParametersValue
PAI concentration (wt%)24, 27, 30
NMP concentration in core liquid (wt%)65
The casting solution flow rate (mL/min)2.0
The core liquid flow rate (mL/min)1.0
Air gap (cm)40
Coagulation bath composition (anhydrous ethanol:H2O) (volume ratio)80:20
The casting solution temperature (°C)25
The coagulation bath temperature (°C)25
Spinneret jet (mm)1.0 (inner diameter), 1.8 (outer diameter)
Table 2. Immersion solution compositions and dip-coating conditions.
Immersion Solution Compositions and Dip-Coating ConditionsValue
Teflon AF2400 concentration (wt%)0.5, 1.0, 1.5, 2.0
Operating pressure (MPa)−0.05
The immersion solution temperature (°C)25
The dip-coating time (s)30
Table 3. Surface element component and content (atomic percentage) of PAI and Teflon/PAI hollow fiber membranes measured by XPS.
MembraneC1sN1sO1sF1s
PAI90.76%5.95%3.29%---
Teflon/PAI82.8%4.43%3.7%9.06%
Table 4. Stress test of PAI and Teflon/PAI hollow fiber membranes.
MembraneTensile Stress at Break/MPaElongation at Break/%Young’s Modulus/MPa
PAI34.8 ± 0.165.8 ± 0.2563.9 ± 0.3
Teflon/PAI42.8 ± 0.372.1 ± 0.1656.5 ± 0.2
Table 5. Comparison of membrane performance in oil–gas separation application.
Membrane SubstanceModification MethodTreated MembraneOmniphobicityFeed CompositionTemperature Difference (°C)Oil–Gas Separation Equilibrium Time (h)Ref.
Ceramic membrane tube (7.5 mm inner diameter, 12.5 mm outer diameter, 100 mm length, and 50 nm pore size)Coating by 1.8 wt% Teflon AF2400Teflon AF2400 (an 8 μm separation thickness)---Transformer oilcontained H2, CO2, CO, CH4, C2H4, C2H6 and C2H2205[36]
FEP membrane (a thickness of 100 μm)---FEP with a thickness of 0.3 mm---Insulating oil solution contained 58.4 ppm H2, 479.1 ppm CO2, 164.9 ppm CO, 17.5 ppm CH4, 16.6 ppm, C2H4, 16.8 ppm C2H6, 15.2 ppm C2H225---[28]
Macroporous α-Al2O3 hollow fiber membraneCoating with a 0.5 wt% Teflon AF2400 solution Teflon AF2400/γ-Al2O3/α-Al2O3 (the thickness of the
Teflon AF2400 layer is about 270 nm)
------------[27]
PAI hollow fiber membraneVacuum-assisted dip-coating by 1.0 wt% Teflon AF2400 solutionTeflon/PAI (a 1.11 μm separation thickness)156.3 ± 1.8° and 123.0 ± 2.5° toward DI water and mineral insulating oil, respectivelyInsulating oil solution contained
16.84 μL·L−1 C2H4, 3.64 μL·L−1 C2H2, 24.01 μL·L−1 C2H6, 12.46 μL·L−1 CH4, 1475.29 μL·L−1 CO2, 457.24 μL·L−1 CO and 65.94 μL·L−1 H2
50 ± 1 2This work
Disclaimer/Publisher’s Note: The statements, opinions and data contained in all publications are solely those of the individual author(s) and contributor(s) and not of MDPI and/or the editor(s). MDPI and/or the editor(s) disclaim responsibility for any injury to people or property resulting from any ideas, methods, instructions or products referred to in the content.