Abstract
The accurate real-time delineation of overburden failure zones, specifically the caved and water-conducted fracture zones, remains a significant challenge in longwall mining, as conventional monitoring methods often lack the spatial continuity and resolution for precise, full-profile strain measurement. Based on the hydrogeological data of the E9103 working face in Hengjin Coal Mine, a numerical calculation model for the overburden strata of the E9103 working face was established to simulate and analyze the stress distribution, failure characteristics, and development height of the water-conducting fracture zones in the overburden strata of the working face. To address this problem, this study presents the application of a distributed optical fiber sensing (DOFS) system, centering on an innovative fiber installation technology. The methodology involves embedding the sensing fiber into boreholes within the overlying strata and employing grouting to achieve effective coupling with the rock mass, a critical step that restores the in situ geological environment and ensures measurement reliability. Field validation at the E9103 longwall face successfully captured the dynamic evolution of the strain field during mining. The results quantitatively identified the caved zone at a height of 13.1–16.33 m and the water-conducted fracture zone at 58–60.6 m. By detecting abrupt strain changes, the system enables the back-analysis of fracture propagation paths and the identification of potential seepage channels. This work demonstrates that the proposed DOFS-based monitoring system, with its precise spatial resolution and real-time capability, provides a robust scientific basis for the early warning of roof hazards, such as water inrushes, thereby contributing to the advancement of intelligent and safe mining practices.
1. Introduction
During fully mechanized top-coal caving mining, the advance of the working face induces stress redistribution in the overlying strata, leading to their deformation, damage, and failure. This process forms the caved zone, fractured zone, and bent zone—collectively termed the “three zones”. Accurately determining the spatio-temporal development and heights of these zones is paramount for preventing water inrushes, especially in mines operating above confined aquifers or under complex hydrogeological conditions. The risk escalates significantly during pressurized mining near such aquifers [,,]. Accurately determining the spatio-temporal evolution and extent of the overburden “three zones” is critical for mitigating roof water inrush risks in longwall mining, particularly when operating above confined aquifers or under complex hydrogeological settings. Under such challenging conditions—such as mining in close proximity to high-pressure aquifers—the potential for water inrush rises substantially []. Since the 1960s, significant research efforts have been devoted to understanding mining-induced failure mechanisms in coal seam floors, resulting in notable theoretical and practical progress []. Foundational contributions include the development of the water inrush coefficient model, hydro-mechanical coupling criteria, structural models of the “lower three zones” and “lower four zones,” along with key stratum theory and elastic thin plate theory. Together, these advances have established an essential basis for forecasting and preventing floor water inrush incidents [,,].
Despite these advancements, reliably predicting the evolution of fractures and the formation of seepage pathways within mining-disturbed rock masses continues to pose significant challenges. This knowledge gap is particularly evident in the context of monitoring floor water inrush and developing integrated multi-physics early warning systems, which remain under-researched, especially for deep mining operations in western regions [,,,]. A critical unresolved issue is the dynamic failure behavior of aquicludes under the coupled influence of mining-induced stress and groundwater seepage []. This limited understanding constrains accurate assessment of the aquiclude’s integrity and its water-resisting capacity. Furthermore, as intelligent mining systems become more deeply embedded in underground coal extraction, the management of dynamic hazards in the overlying strata has emerged as a pivotal concern for ensuring both safety and operational efficiency [,,].
Current research on overburden failure has predominantly examined the static distribution of the “three zones” in fully mechanized mining, with comparatively little attention given to the dynamic evolution and spatio-temporal expansion behavior under top-coal caving conditions [,,]. Conventional detection techniques—including borehole fluid loss measurement, downhole television imaging, electrical resistivity tomography, and microseismic monitoring—provide localized fracture identification to a certain degree []. However, these methods typically rely on discrete point-based measurements, thereby lacking continuous and comprehensive cross-sectional monitoring capability [,]. Their constrained spatiotemporal resolution further impedes accurate characterization of dynamic fracture propagation and the development of connected seepage pathways [].
Recent advances in Distributed Optical Fiber Sensing (DOFS) technologies, particularly Brillouin Optical Time Domain Analysis (BOTDA) and Rayleigh Optical Frequency Domain Reflectometry (ROTDR), have opened new pathways for real-time, high-resolution monitoring in mining geomechanics [,,]. These systems provide continuous, full-profile coverage with high spatial resolution and millimeter-scale strain sensitivity, enabling detailed tracking of overburden deformation dynamics and fracture network evolution []. Moreover, by detecting localized strain anomalies, DOFS can help identify incipient seepage channels, thereby supplying essential field data for the development of coupled stress–fracture–seepage models [,,].
Distributed Optical Fiber Sensing (DOFS) represents a paradigm shift in detecting the heights of overburden “three zones,” moving from traditional point-based inference to comprehensive, full-profile. The novelty of this approach lies in its ability to visualize the dynamic evolution and spatial heterogeneity of the three zones through distributed strain field profiles, thereby enabling precise delineation. Looking ahead, this technology is poised to advance the study of overburden failure from static description to dynamic prediction, establishing itself as a cornerstone for building digital mines and implementing intelligent early warning systems for mining-induced hazards.
2. Geological Characteristics of Mine Engineering
2.1. Geological Setting
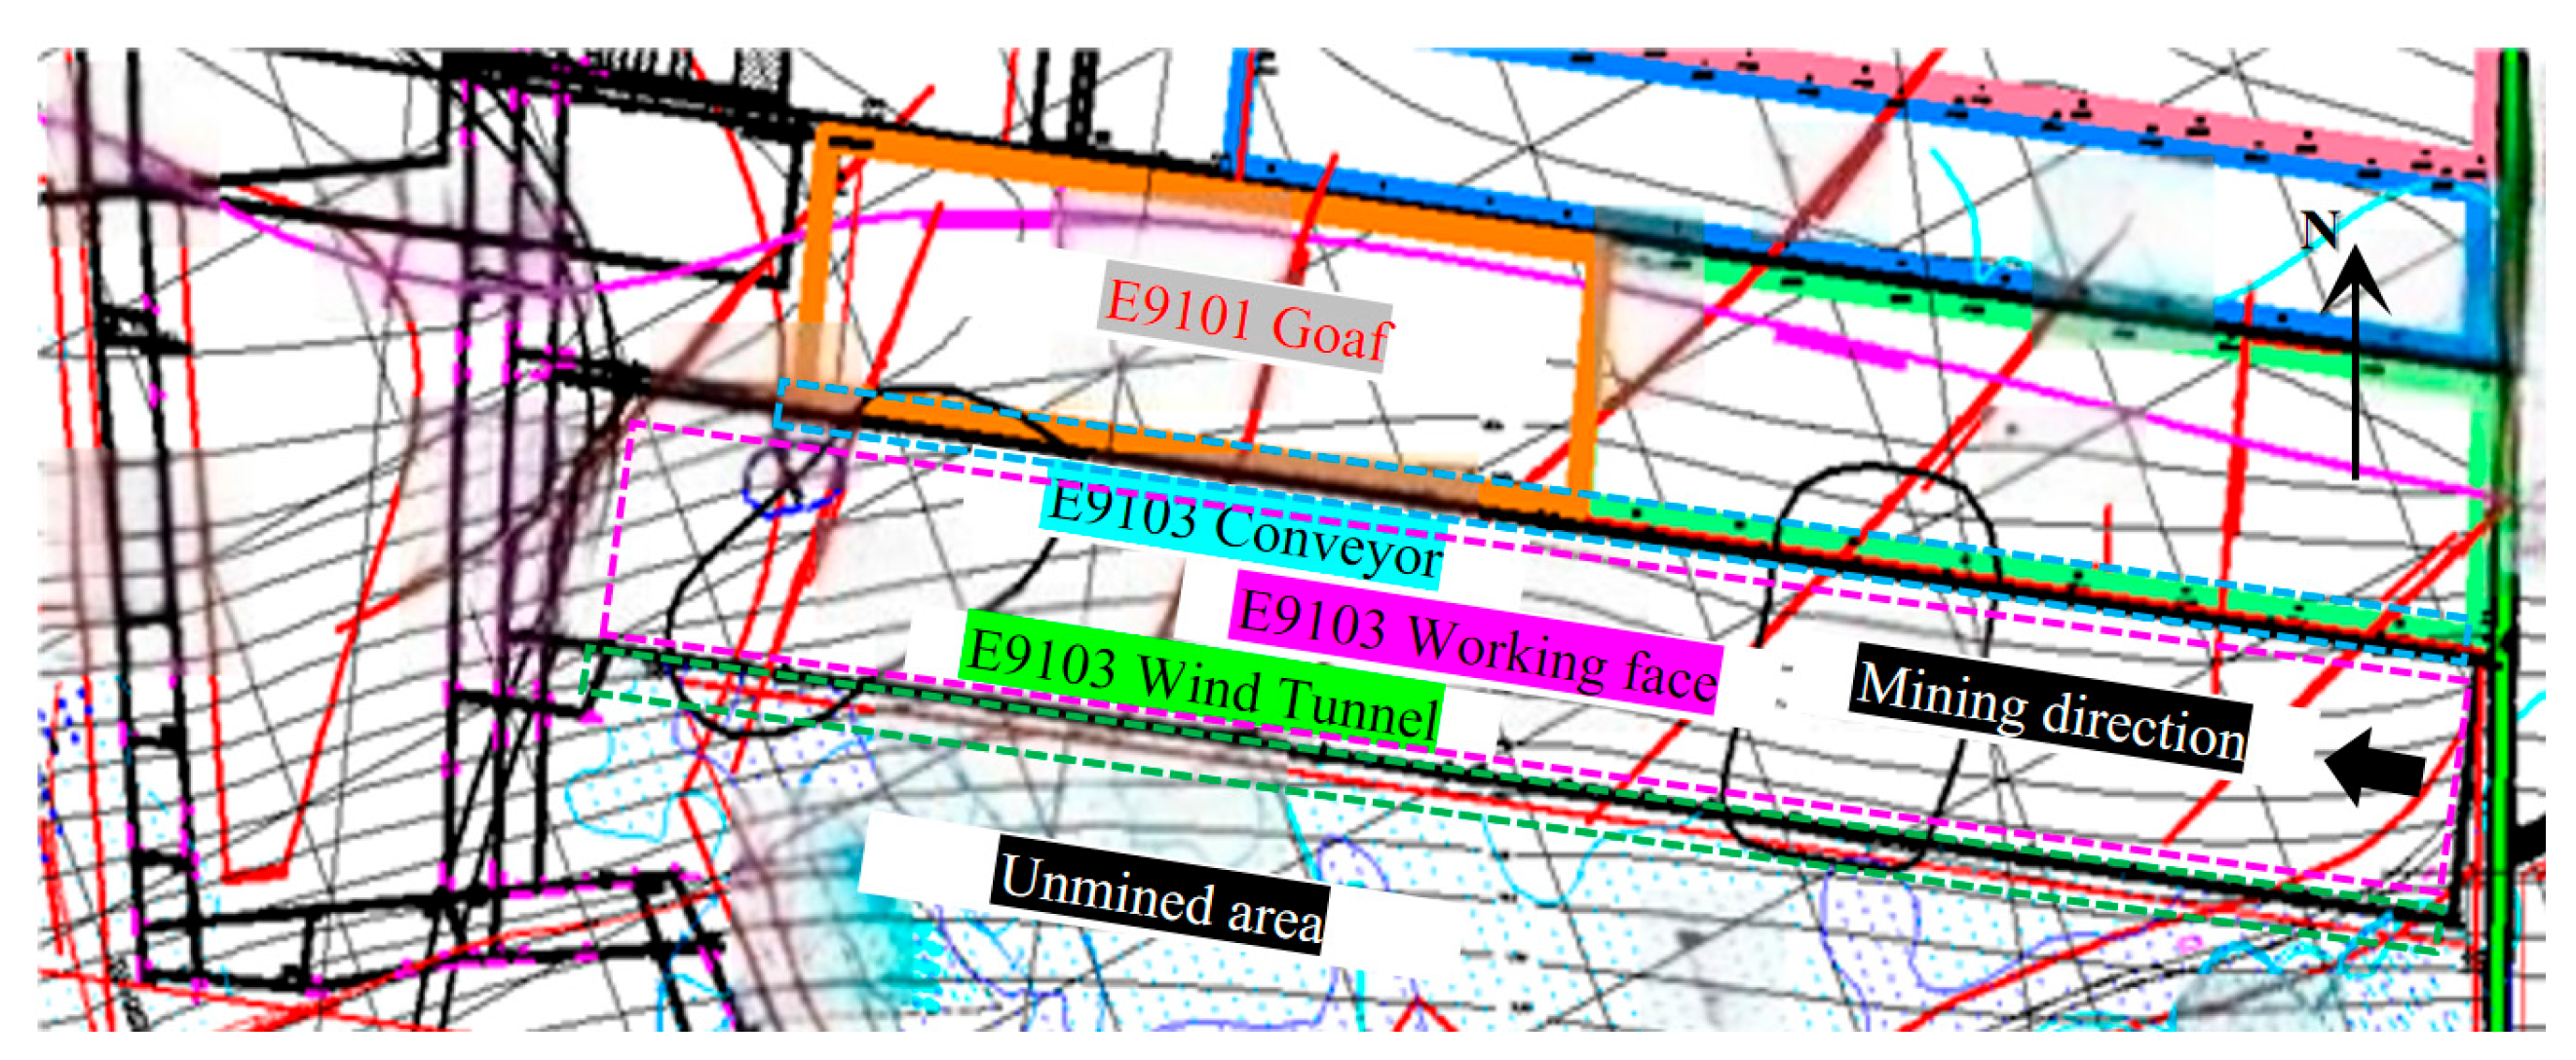
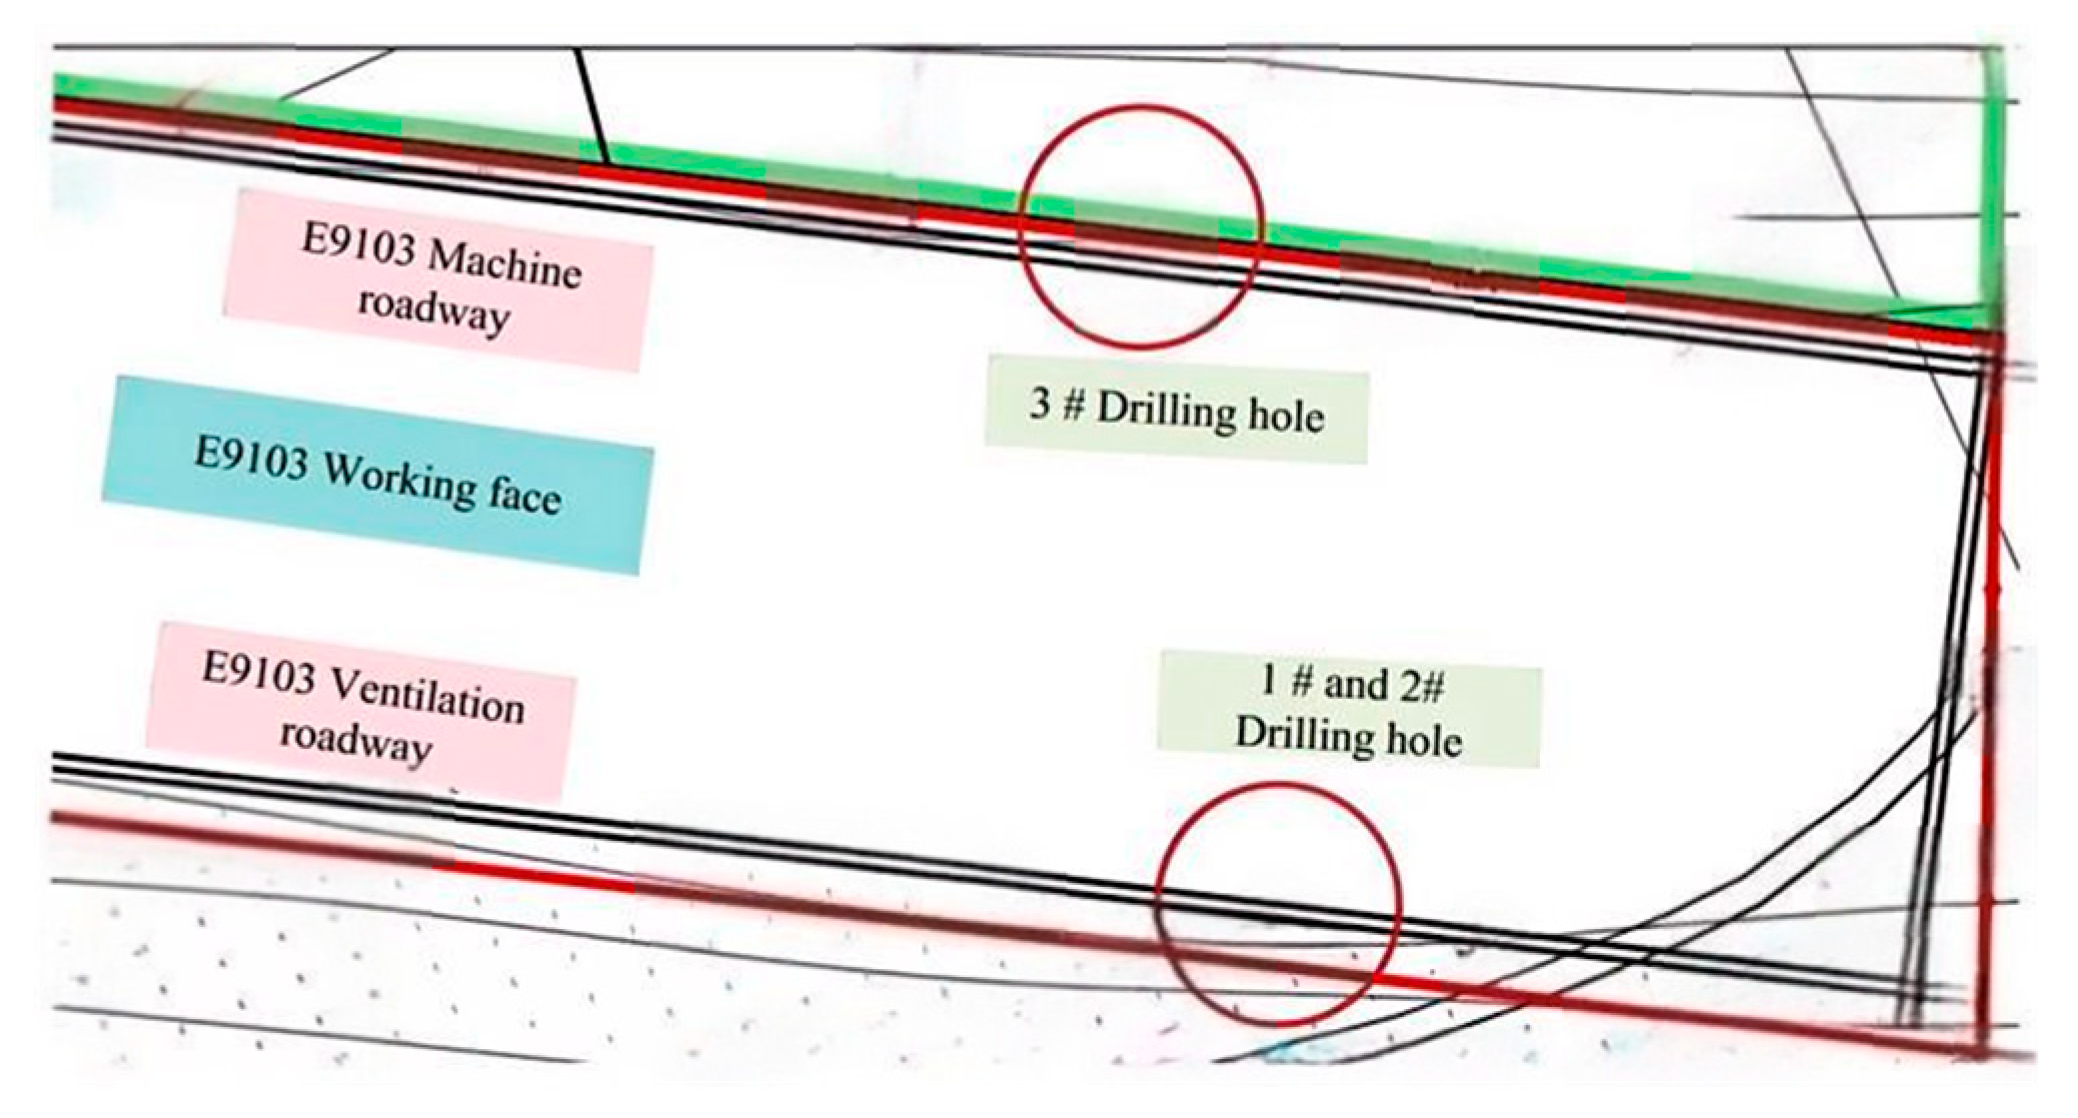
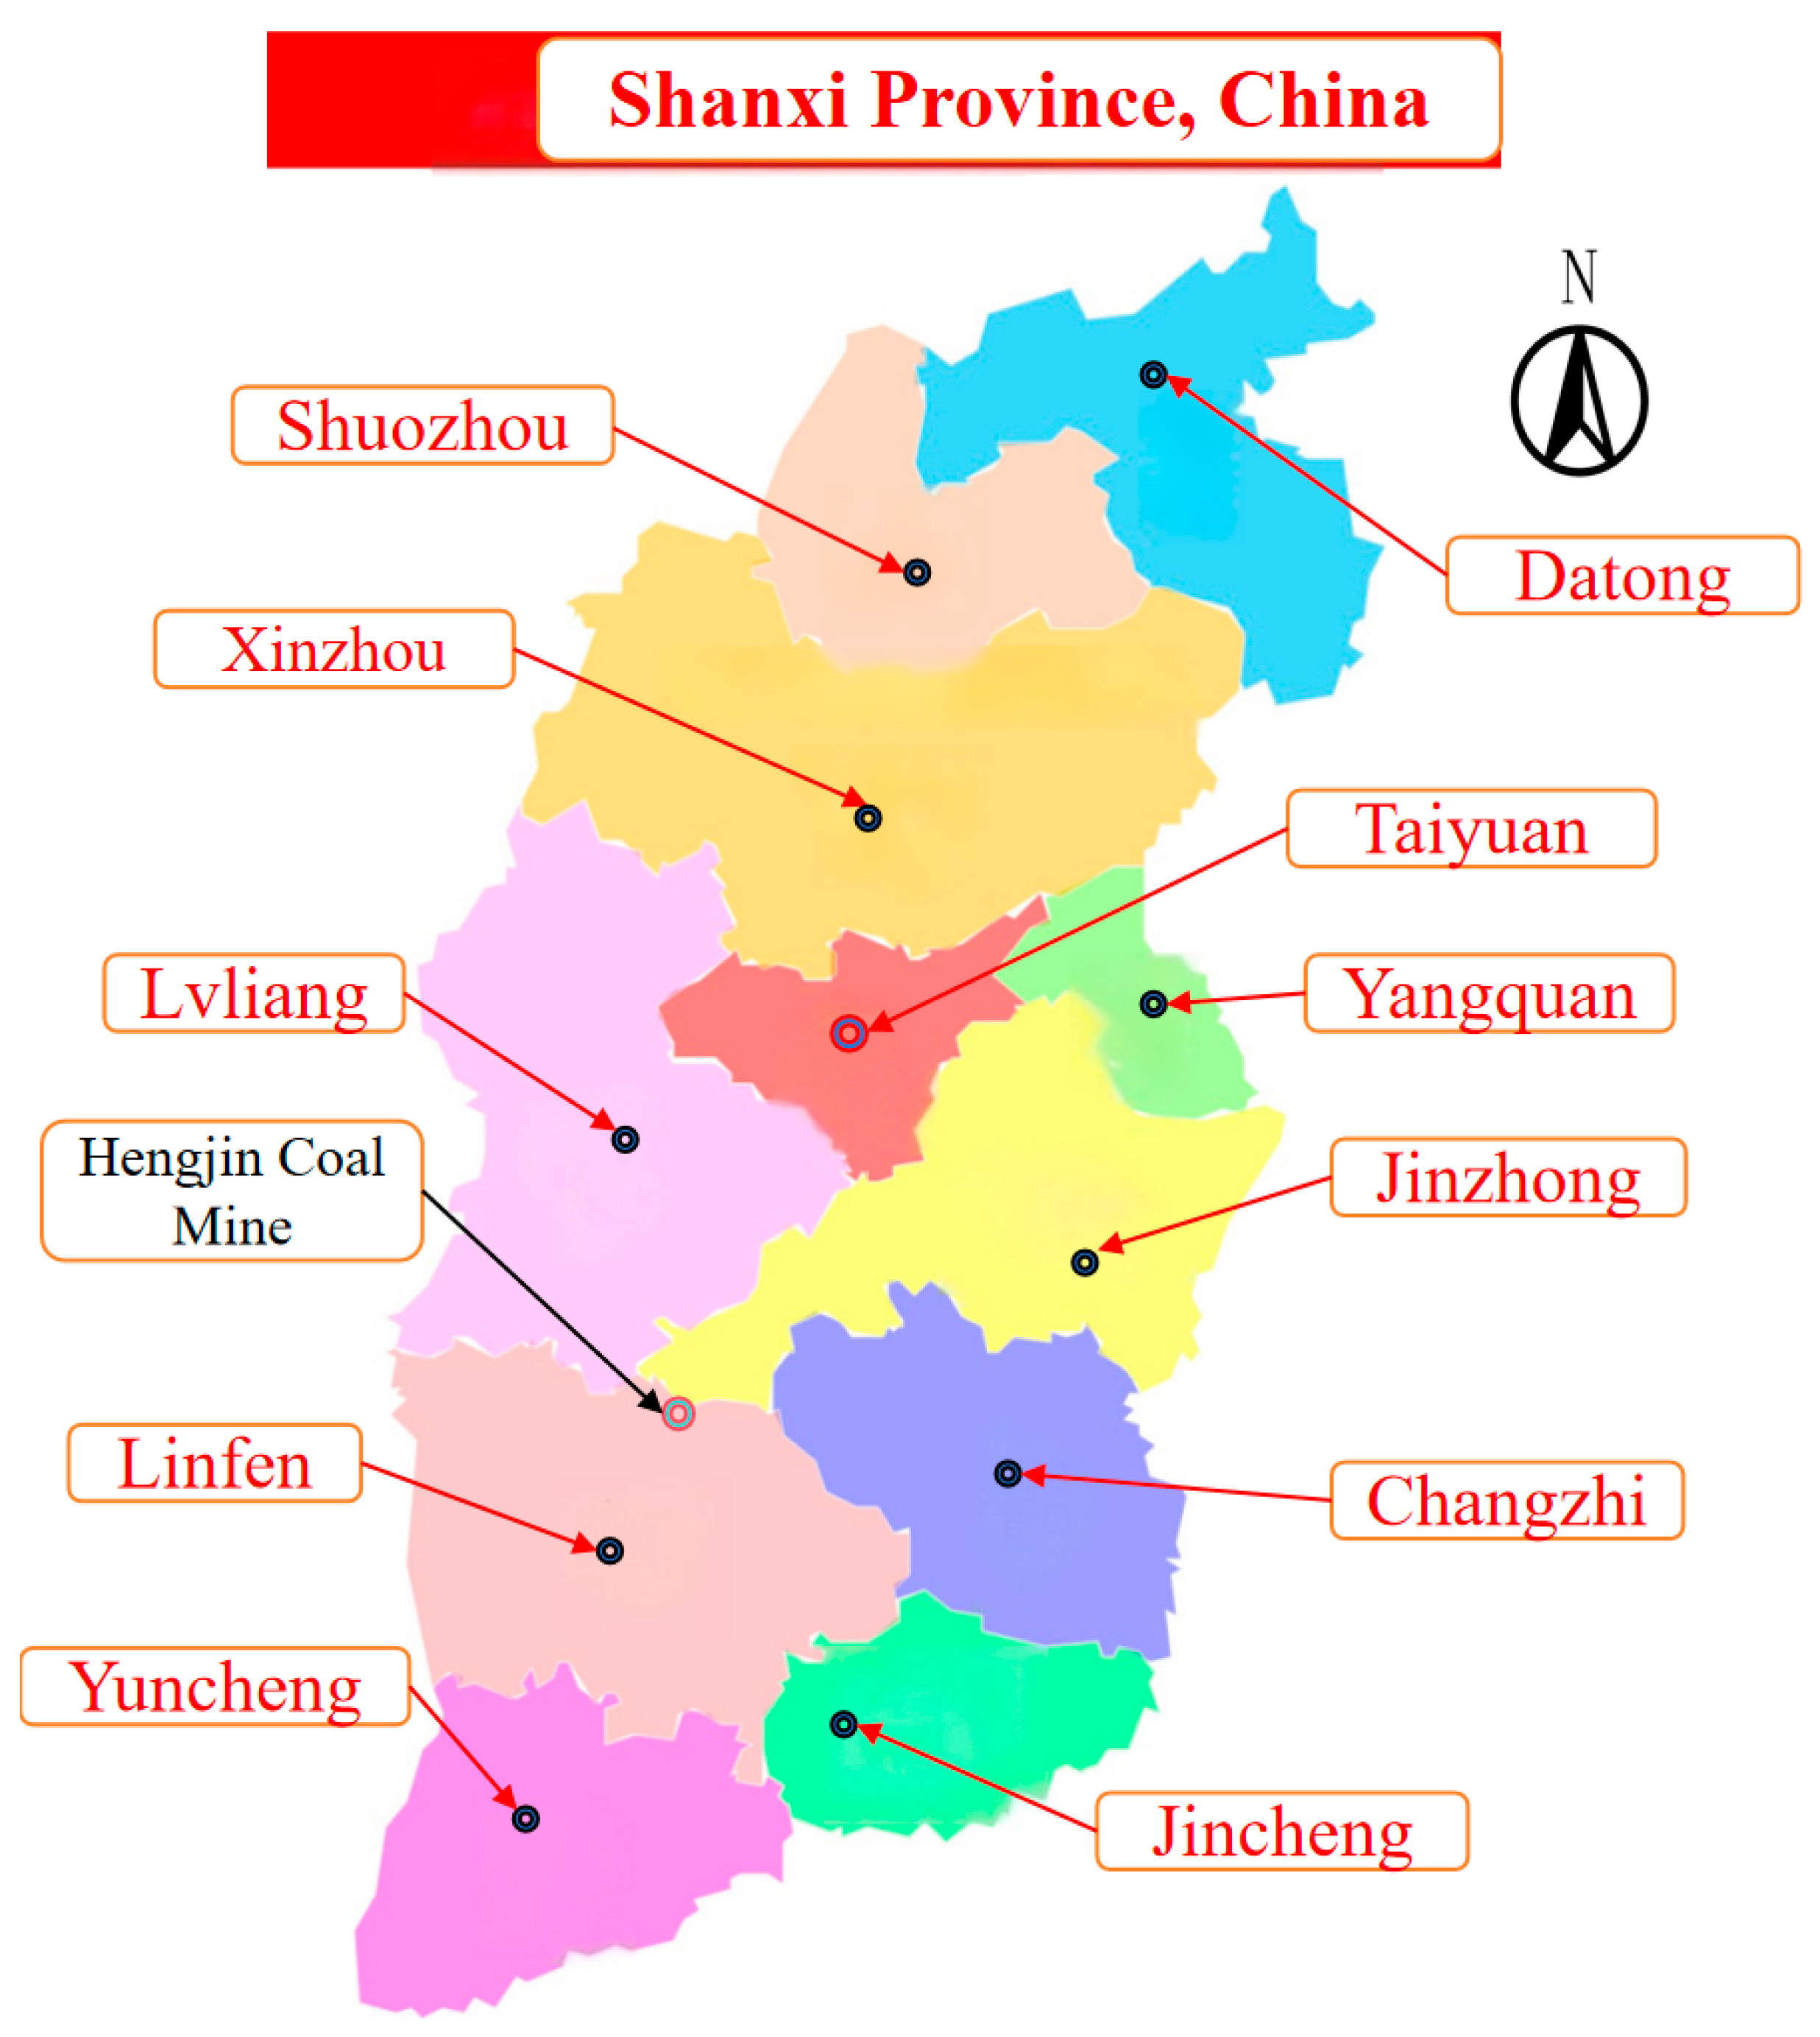
The 9 + 10 coal seams are the primary mineable layers, averaging 4.3 m in thickness (range: 4.2–4.4 m). These seams include one-to-three mudstone partings (avg. total thickness: 1.15 m) that show considerable lateral variability. The immediate and main roof is composed of dense, hard K2 limestone (avg. thickness: 11.69 m), which is calcareous-cemented and contains thin mudstone interbeds and fractured, small karst cavities. The geomechanical properties of this limestone roof are as follows: Uniaxial Compressive Strength (UCS): 29.6 MPa (avg.); Tensile Strength: 1.3 MPa (avg.); Shear Internal Friction Angle: 35°20′; Cohesion: 3.9 MPa; Protodyakonov Strength Factor: 9.63. The map of Shanxi Province is shown in Figure 1, with the approximate locations of coal mines marked in black font. The plan of the E9103 working face is shown in Figure 2.
Figure 1.
Map of Shanxi province. (Hengjin Coal Mine is our research subject and is indicated in black font in the figure).
Figure 2.
Layout of working face E9103.
One of the most direct approaches for studying the overlying strata behavior during the retreat of working face E9103 is in situ monitoring. This study was conducted at the E9103 working face of a coal mine in Shanxi province, China, focusing on the movement and failure patterns of the overburden after mining, as well as the spatio-temporal evolution of the overlying strata before and after extraction. The objective was to determine the heights of the fractured zone and the water-conducting fracture zone resulting from the extraction of the 9 + 10 coal seam at Hengjin coal mine.
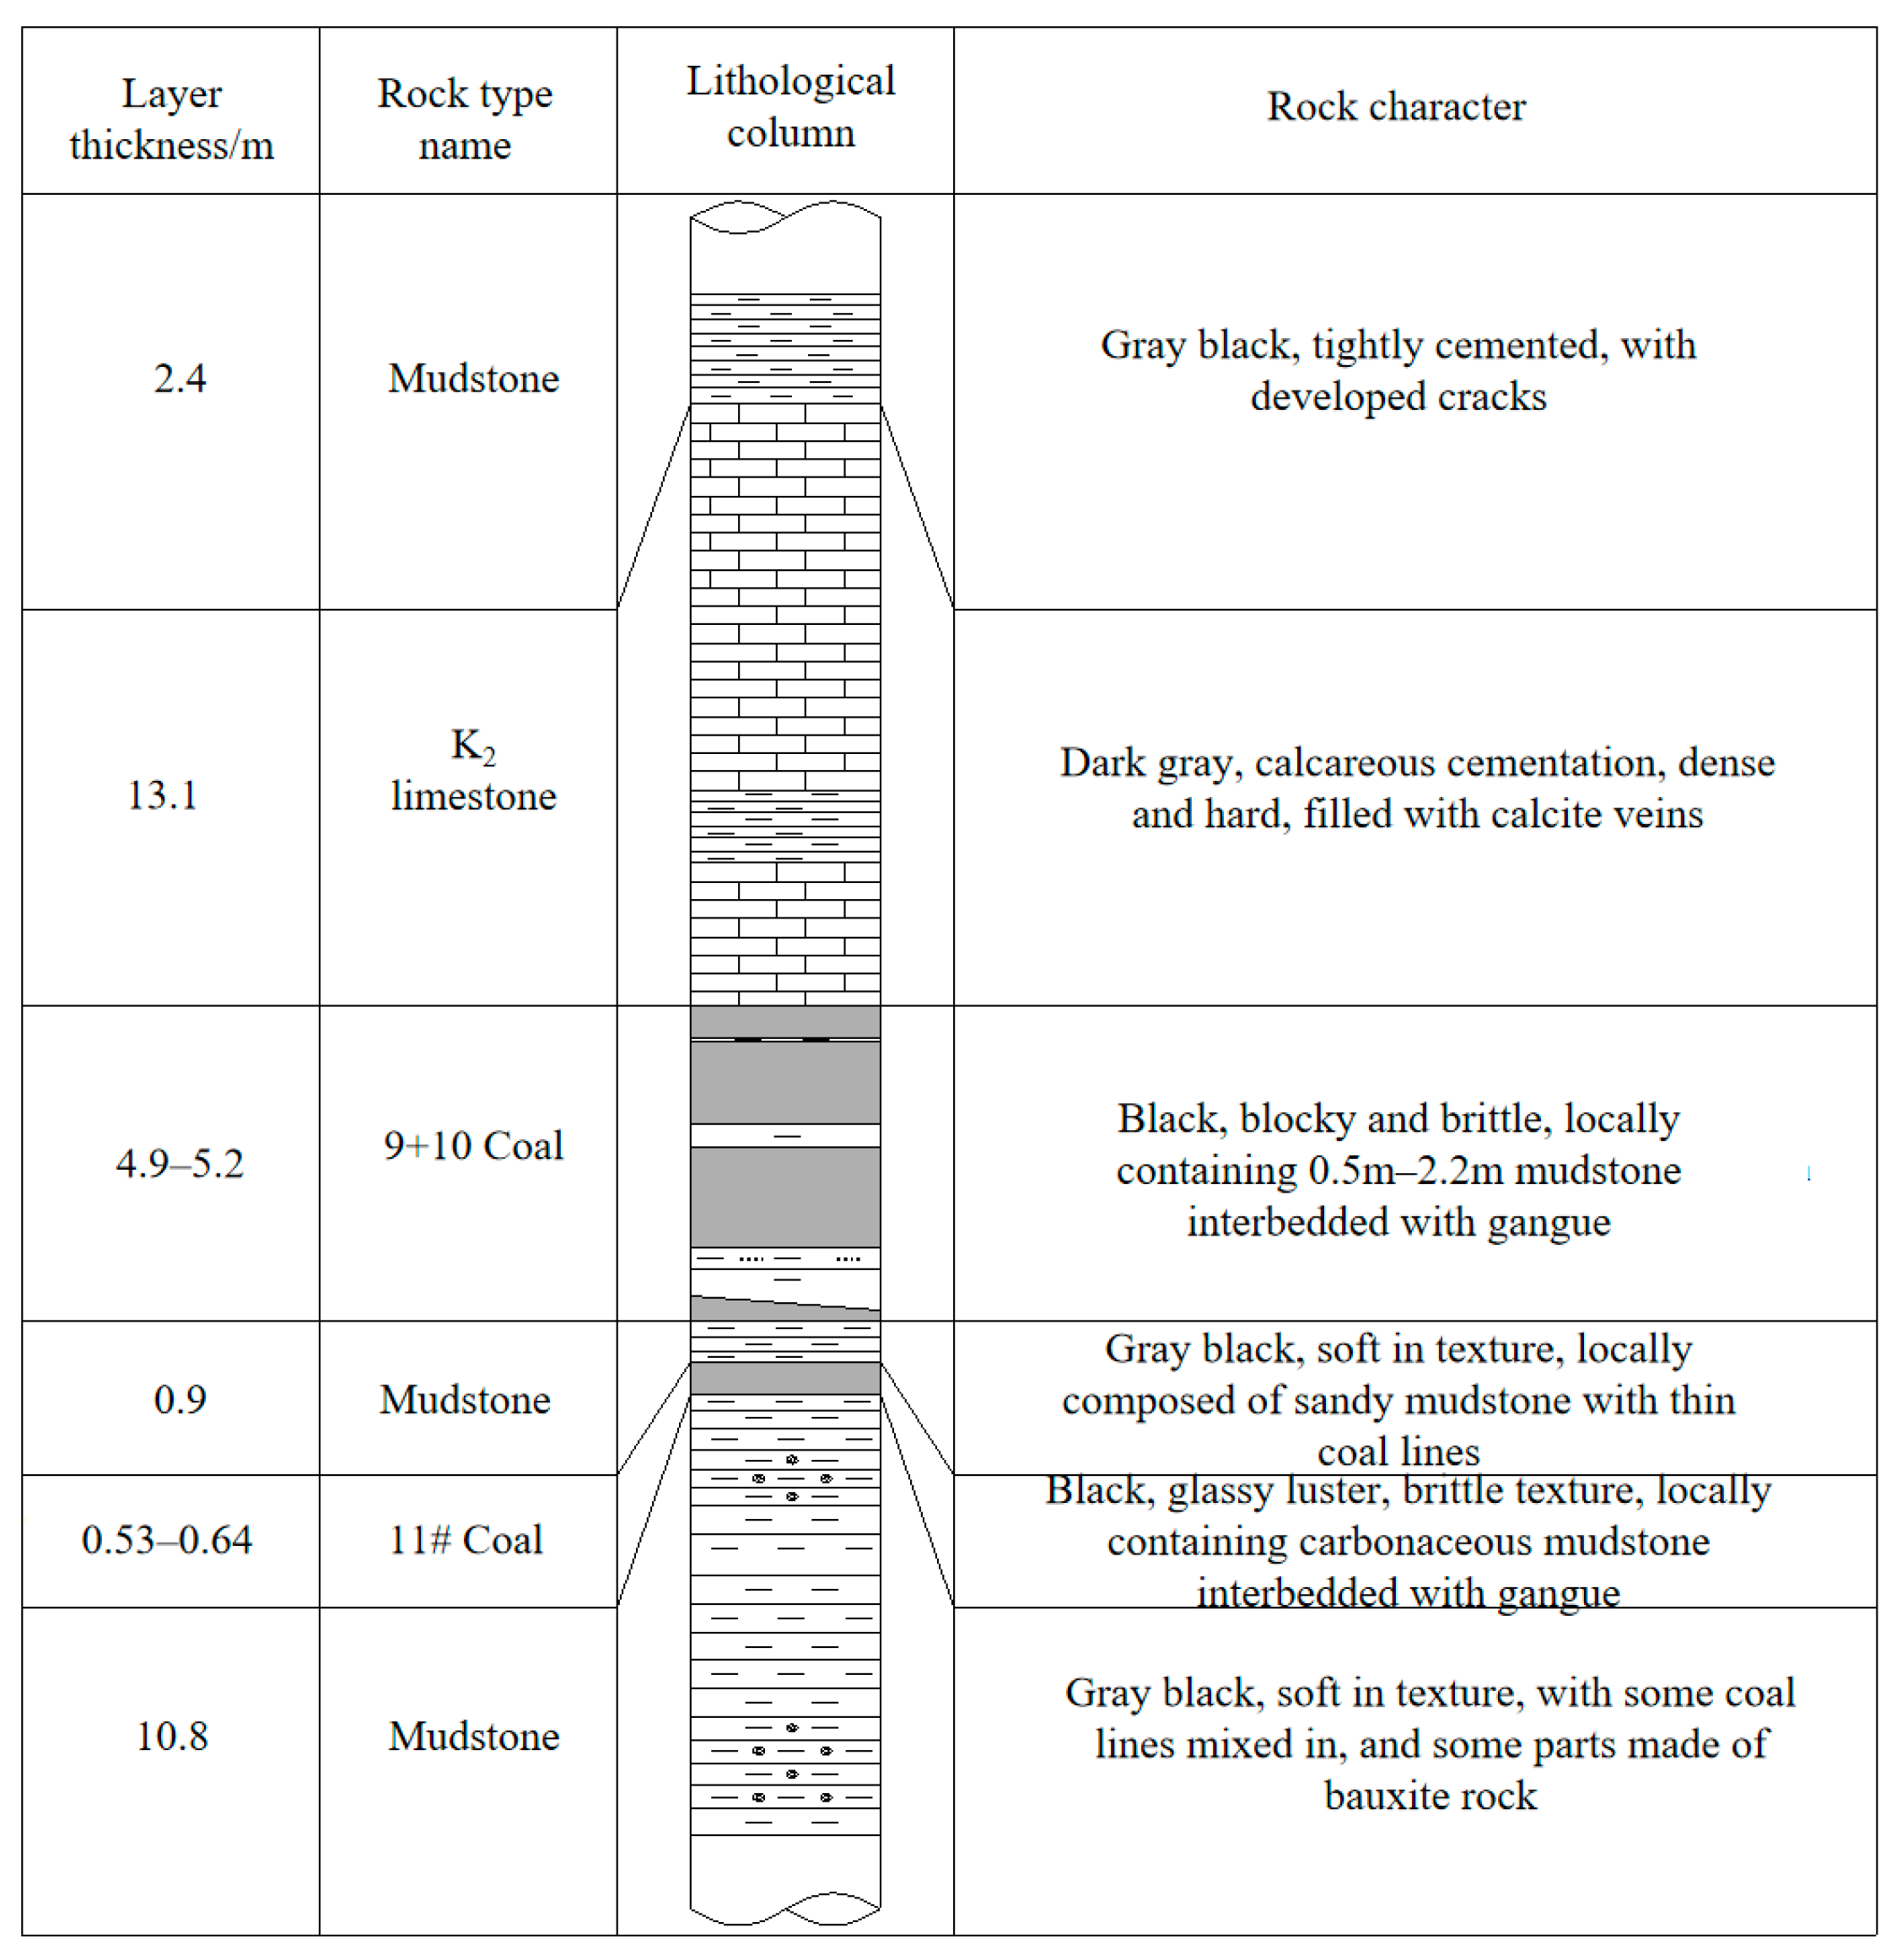
In coal mining, the composite stratigraphic column represents one of the most intuitive and synthetically valuable summaries of geological exploration data. In this study on the water-conducting fracture zone of the 9 + 10 coal seam at Hengjin coal mine, the composite column served as the core geological reference. It documents the lithology, thickness, and positions of key strata in the overlying rock sequence, providing a basis for identifying mechanically weak layers prone to fracturing and estimating the potential height of fracture development. The column directly informed the design and implementation of monitoring boreholes. It also provided an essential reference for correlating strain anomalies—identified via fiber optic monitoring—with specific lithologic units, and for evaluating whether the water-conducting fracture zone extends into overlying aquifers. According to the “Geological Instruction for E9103 working face mining” provided by the Geological Survey Department, the composite columnar diagram of the coal seam is shown in Figure 3.
Figure 3.
Composite Columnar Diagram. (The 11# coal is the eleventh layer of coal).
2.2. Theoretical Calculation of the Three Zones of Overburden Failure and the Caving-to-Mining Ratio
The theoretical calculation methods for determining the height of overburden failure in coal mining—primarily the caved zone and the water-conducting fracture zone—have evolved over many years, leading to the establishment of several commonly used approaches. These methods vary in emphasis and are often applied in combination for mutual validation in practice. Extensive in situ measurements have revealed that the development height of the water-conducting fracture zone is significantly influenced by lithology []. Based on a large amount of measured data from high-intensity mining operations, some researchers have studied calculation methods for predicting the heights of the caved zone and the water-conducting fracture zone (Table 1). After the underground coal seam is extracted, the original stress balance of the rock mass above it is disrupted, leading to movement, deformation, and failure. Consequently, a caving zone, a fracture zone, and a bending subsidence zone form from bottom to top. The direct cause is that the mined-out area causes the immediate roof to lose support, resulting in fracture, crushing, and chaotic accumulation, forming the caving zone. The overlying strata, such as the main roof, generate tensile stress and interlayer shear stress exceeding their tensile strength during the bending subsidence process, forming a large number of vertical tension fractures and bedding fractures, which develop into the fracture zone. The strata above this only undergo overall, continuous, slow bending until the surface, forming the bending subsidence zone. This “three-zone” structure is an inevitable result of the rock mass seeking a new mechanical equilibrium under the redistribution of mining-induced stress. A schematic diagram of the typical “Three Zones” distribution resulting from coal mining is shown in Figure 4.
Table 1.
Regression Relationship Between Mining Height and the Development Height of the Water-Conducting Fracture Zone [].
Figure 4.
Schematic diagram of the distribution of “three zones” formed by coal mining [].
The Caving-to-Mining Ratio(Kc) is defined as the ratio of the Height of the Caved Zone in the overlying strata after coal seam extraction to the Mining Height of the coal seam. It is expressed mathematically as follows:
If ≈ 4–6: It indicates that the height of the caved zone is significantly greater than the mining height. This allows the roof strata to collapse fully and fill the goaf, thereby reducing the pressure on the working face.
If < 2: Insufficient caving may result in a hanging roof, leading to severe strata pressure behavior at the working face (such as the risk of rock burst). The caved zone is the area closest to the goaf and experiences the most severe failure. The height of the caved zone directly determines the difficulty and risk of roof management. A higher caving-to-mining ratio indicates a larger caving range, which may trigger more intense roof weighting, thereby imposing greater demands on support selection and roadway maintenance.
China’s BQ classification system and internationally recognized systems such as RMR and Q systems. The BQ system, a Chinese national standard, is based on the uniaxial saturated compressive strength of rock and the rock mass integrity coefficient. Its basic classification (I to V) has a good correspondence with the classification of the RMR system (Very Good to Very Poor). Many Chinese scholars have established an empirical conversion relationship between BQ and RMR through a large amount of engineering practice data, as shown in Table 2. The comparison between China’s BQ classification (GB 50218) [] and internationally recognized systems (such as RMR, Q) is as follows:
Table 2.
Comparison of China’s BQ classification with RMR and Q [,,].
(1) The CWFH model requires more complex parameters (e.g., post-peak cohesion degradation rate, friction hardening coefficient) that are difficult to accurately determine for our low-heterogeneity rock mass (limited by in situ test conditions); (2) Overly complex models (e.g., CWFH) may introduce unnecessary parameter uncertainty for problems focused on long-term deformation (not rock burst), which could reduce the reliability of results [] (Jaeger et al., 1976, Fundamentals of Rock Mechanics); (3) The case study you cited focuses on rock burst failure in highly heterogeneous deep tunnels (σ1/σᵣ = 0.65), which is fundamentally different from our research scenario. Our study focuses on the long-term deformation stability of a deep hydropower tunnel (not rock burst prediction, which is the core scenario for the CWFH model) []. The geological characteristics of the study area are: (1) Low geological heterogeneity (granite rock mass with discontinuity spacing > 1.5 m, no major faults); (2) Moderate in situ stress (maximum principal stress = 22 MPa, σ1/σᵣ = 0.31 < 0.5, where σᵣ is rock uniaxial compressive strength), which is below the threshold for significant brittle rock burst (σ1/σᵣ ≥ 0.5, according to Hoek et al., 2002 []). Under such conditions, the rock mass exhibits ductile-to-brittle transitional behavior with weak post-peak strain softening—a response that the Mohr–Coulomb model can accurately capture [,,,].
Thus, after a comprehensive evaluation of our research objectives and geological context, we confirmed that the Mohr–Coulomb model is the most appropriate choice for this study.
The caved zone constitutes the lower part of the water-conducting fracture zone. Accurately calculating the height of the caved zone (via the caving-to-mining ratio) is a fundamental step in predicting the total height of the water-conducting fracture zone. The height of the water-conducting fracture zone is the key basis for evaluating the risk of roof water inrush and determining the size of protective coal/rock pillars for water prevention. According to the Chinese regulation “Regulations for Coal Pillar Retention and Pressure Coal Mining under Buildings, Water Bodies, Railways, and Major Shafts”, the calculation formulas for the height of the caved zone are categorized into three types based on the hardness of the overlying strata, as shown in Table 3. (The saturated uniaxial compressive strength of hard rock is greater than 60 MPa, that of medium-hard rock ranges from 30 to 60 MPa, and that of soft rock is less than 30 MPa).
Table 3.
Calculation Formulas for the Caving-to-Mining Ratio [].
3. Numerical Simulation Analysis
3.1. FLAC Numerical Simulation
FLAC3D5.0 stands for Fast Lagrangian Analysis for Continuum, also known as Fast Lagrangian Difference Analysis. It is a continuous medium mechanics analysis software developed by Itasca in the United States, and has become one of the important numerical methods in geotechnical calculations. It is widely used in disciplines such as civil engineering, transportation, and mining, and its practicality and professionalism have been widely confirmed. Mining activities will cause deformation and damage to coal and rock masses within a certain range, resulting in a series of complex mechanical changes, such as support pressure. This changing stress is called mining-induced stress. The movement and failure of overlying rock layers caused by mining-induced stress is a process that occurs and develops continuously with the mining of the working face []. FLAC3D can simulate the spatiotemporal evolution of internal stress, displacement, and other factors in the overlying rock layers under different advancing conditions. Through analysis, the movement and failure laws of the overlying rock layers can be grasped as the working face advances.
3.2. Computational Model and Parameters
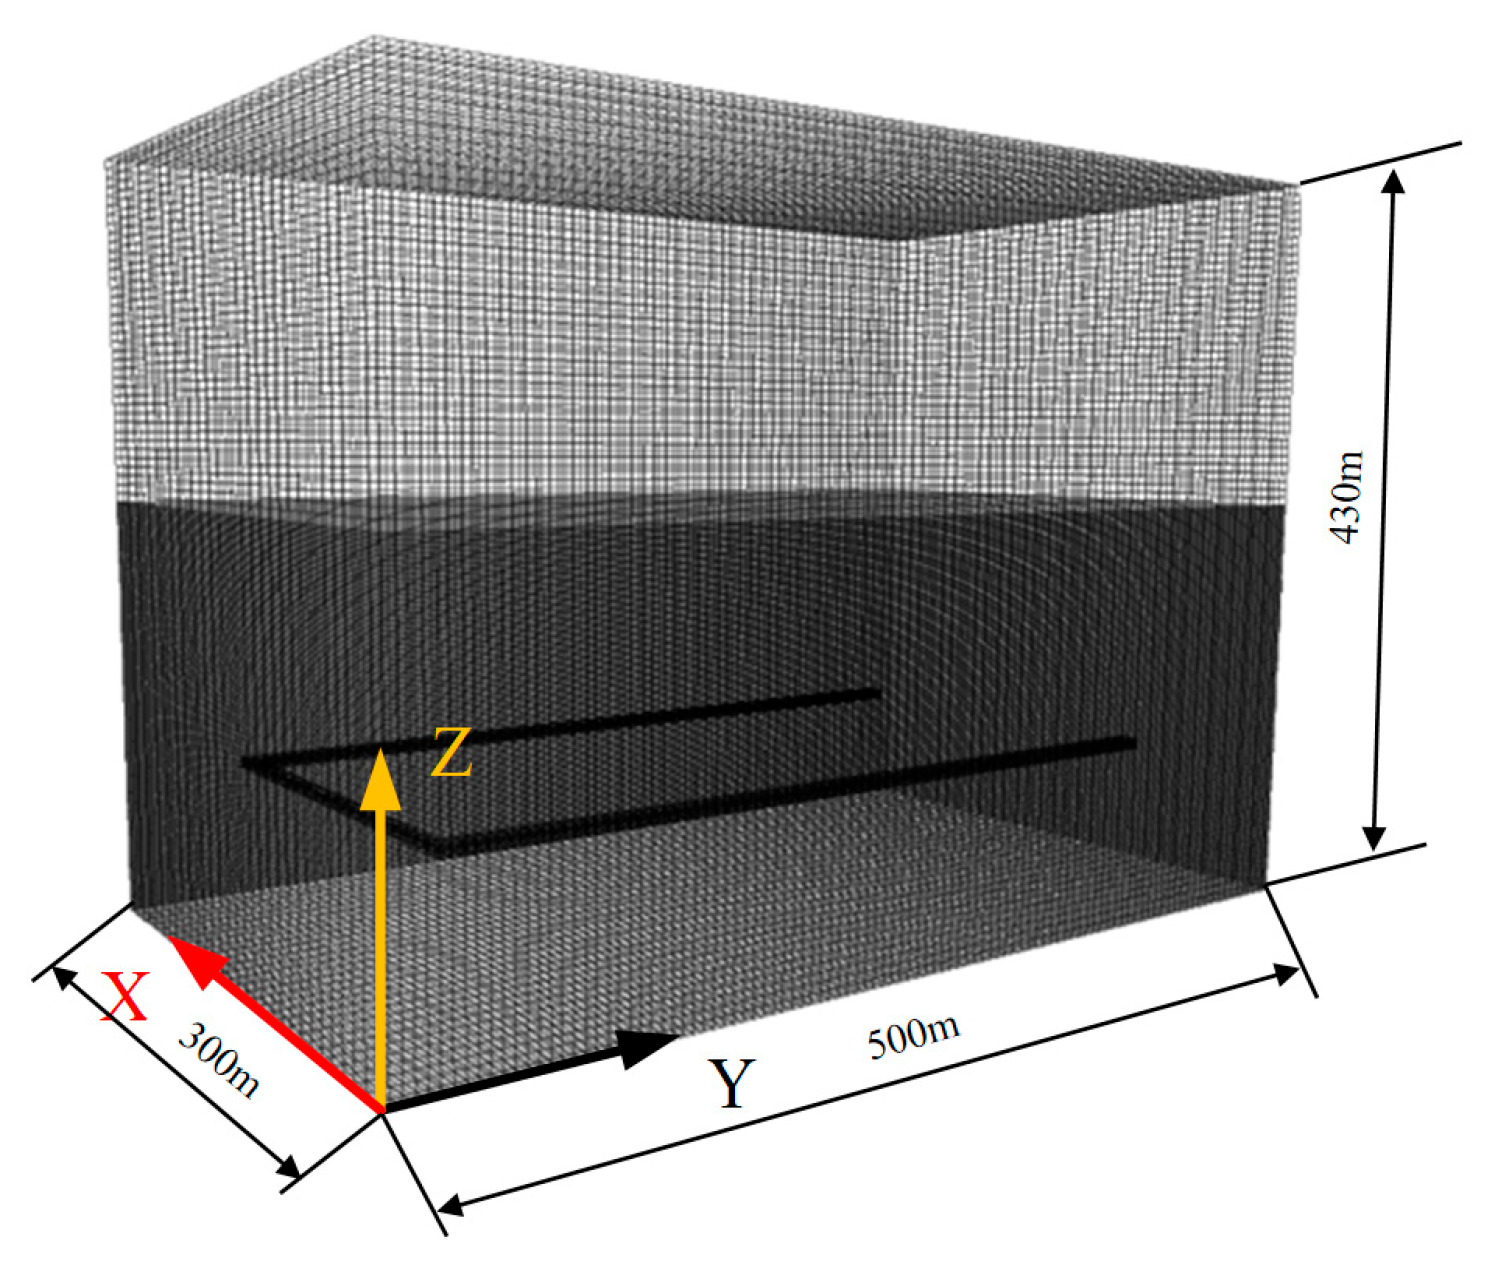
Based on borehole data and the geological column of the E9103 working face in Hengjin Mine, a three-dimensional numerical model was established. The panel has a dip length of 190 m with an average coal seam thickness of 4.5 m. In the model, the working face is oriented along the dip direction (Y-axis), with advancement along the strike (X-axis). The gravitational direction is aligned with the Z-axis, upward being positive. To minimize boundary effects on simulation results, 50 m protective coal pillars were reserved on both sides along the strike and dip directions of the E9103 panel. The simulated dimensions of the working face include a dip length of 190 m, a mining height of 4.5 m, and a seam dip angle of 16°. The advancement length was set to twice the panel length (380 m). The model incorporates 12 rock layers in the floor with a total thickness of 90 m, and 29 overburden layers with a total thickness of 334 m. Considering the widths of both the haulage roadway and ventilation roadway (4 m each), the overall dimensions of the 3D model are 500 m (strike) × 300 m (dip) × 430 m (height). For simplification, the overburden load was applied as a uniformly distributed stress on the top boundary, while displacement boundary conditions were assigned to the sides and bottom of the model. The elevation of the coal seam floor in the E9103 panel ranges from 1140 m to 1193 m. Given an overburden thickness of 334 m, a vertical stress of 8.08 MPa was applied to the top surface of the model. An elastic-perfectly plastic constitutive model was adopted, with failure behavior defined by the Mohr–Coulomb criterion.
The Mohr–Coulomb yield criterion is defined by the following expression:
σ1, σ2, and σ3 are the major, intermediate, and minor principal stresses, respectively; C and φ represent the cohesion and internal friction angle of the material; σt denotes the tensile strength. Shear failure occurs when f s = 0, while tensile failure is initiated when f t = 0. The physical and mechanical parameters of coal and rock are shown in Table 4. The numerical calculation model of the overlying strata in E9103 working face is shown in Figure 5.
Table 4.
Coal and rock mass parameters.
Figure 5.
Numerical calculation model of overlying strata in E9103 working face.
3.3. Analysis of Simulation Results
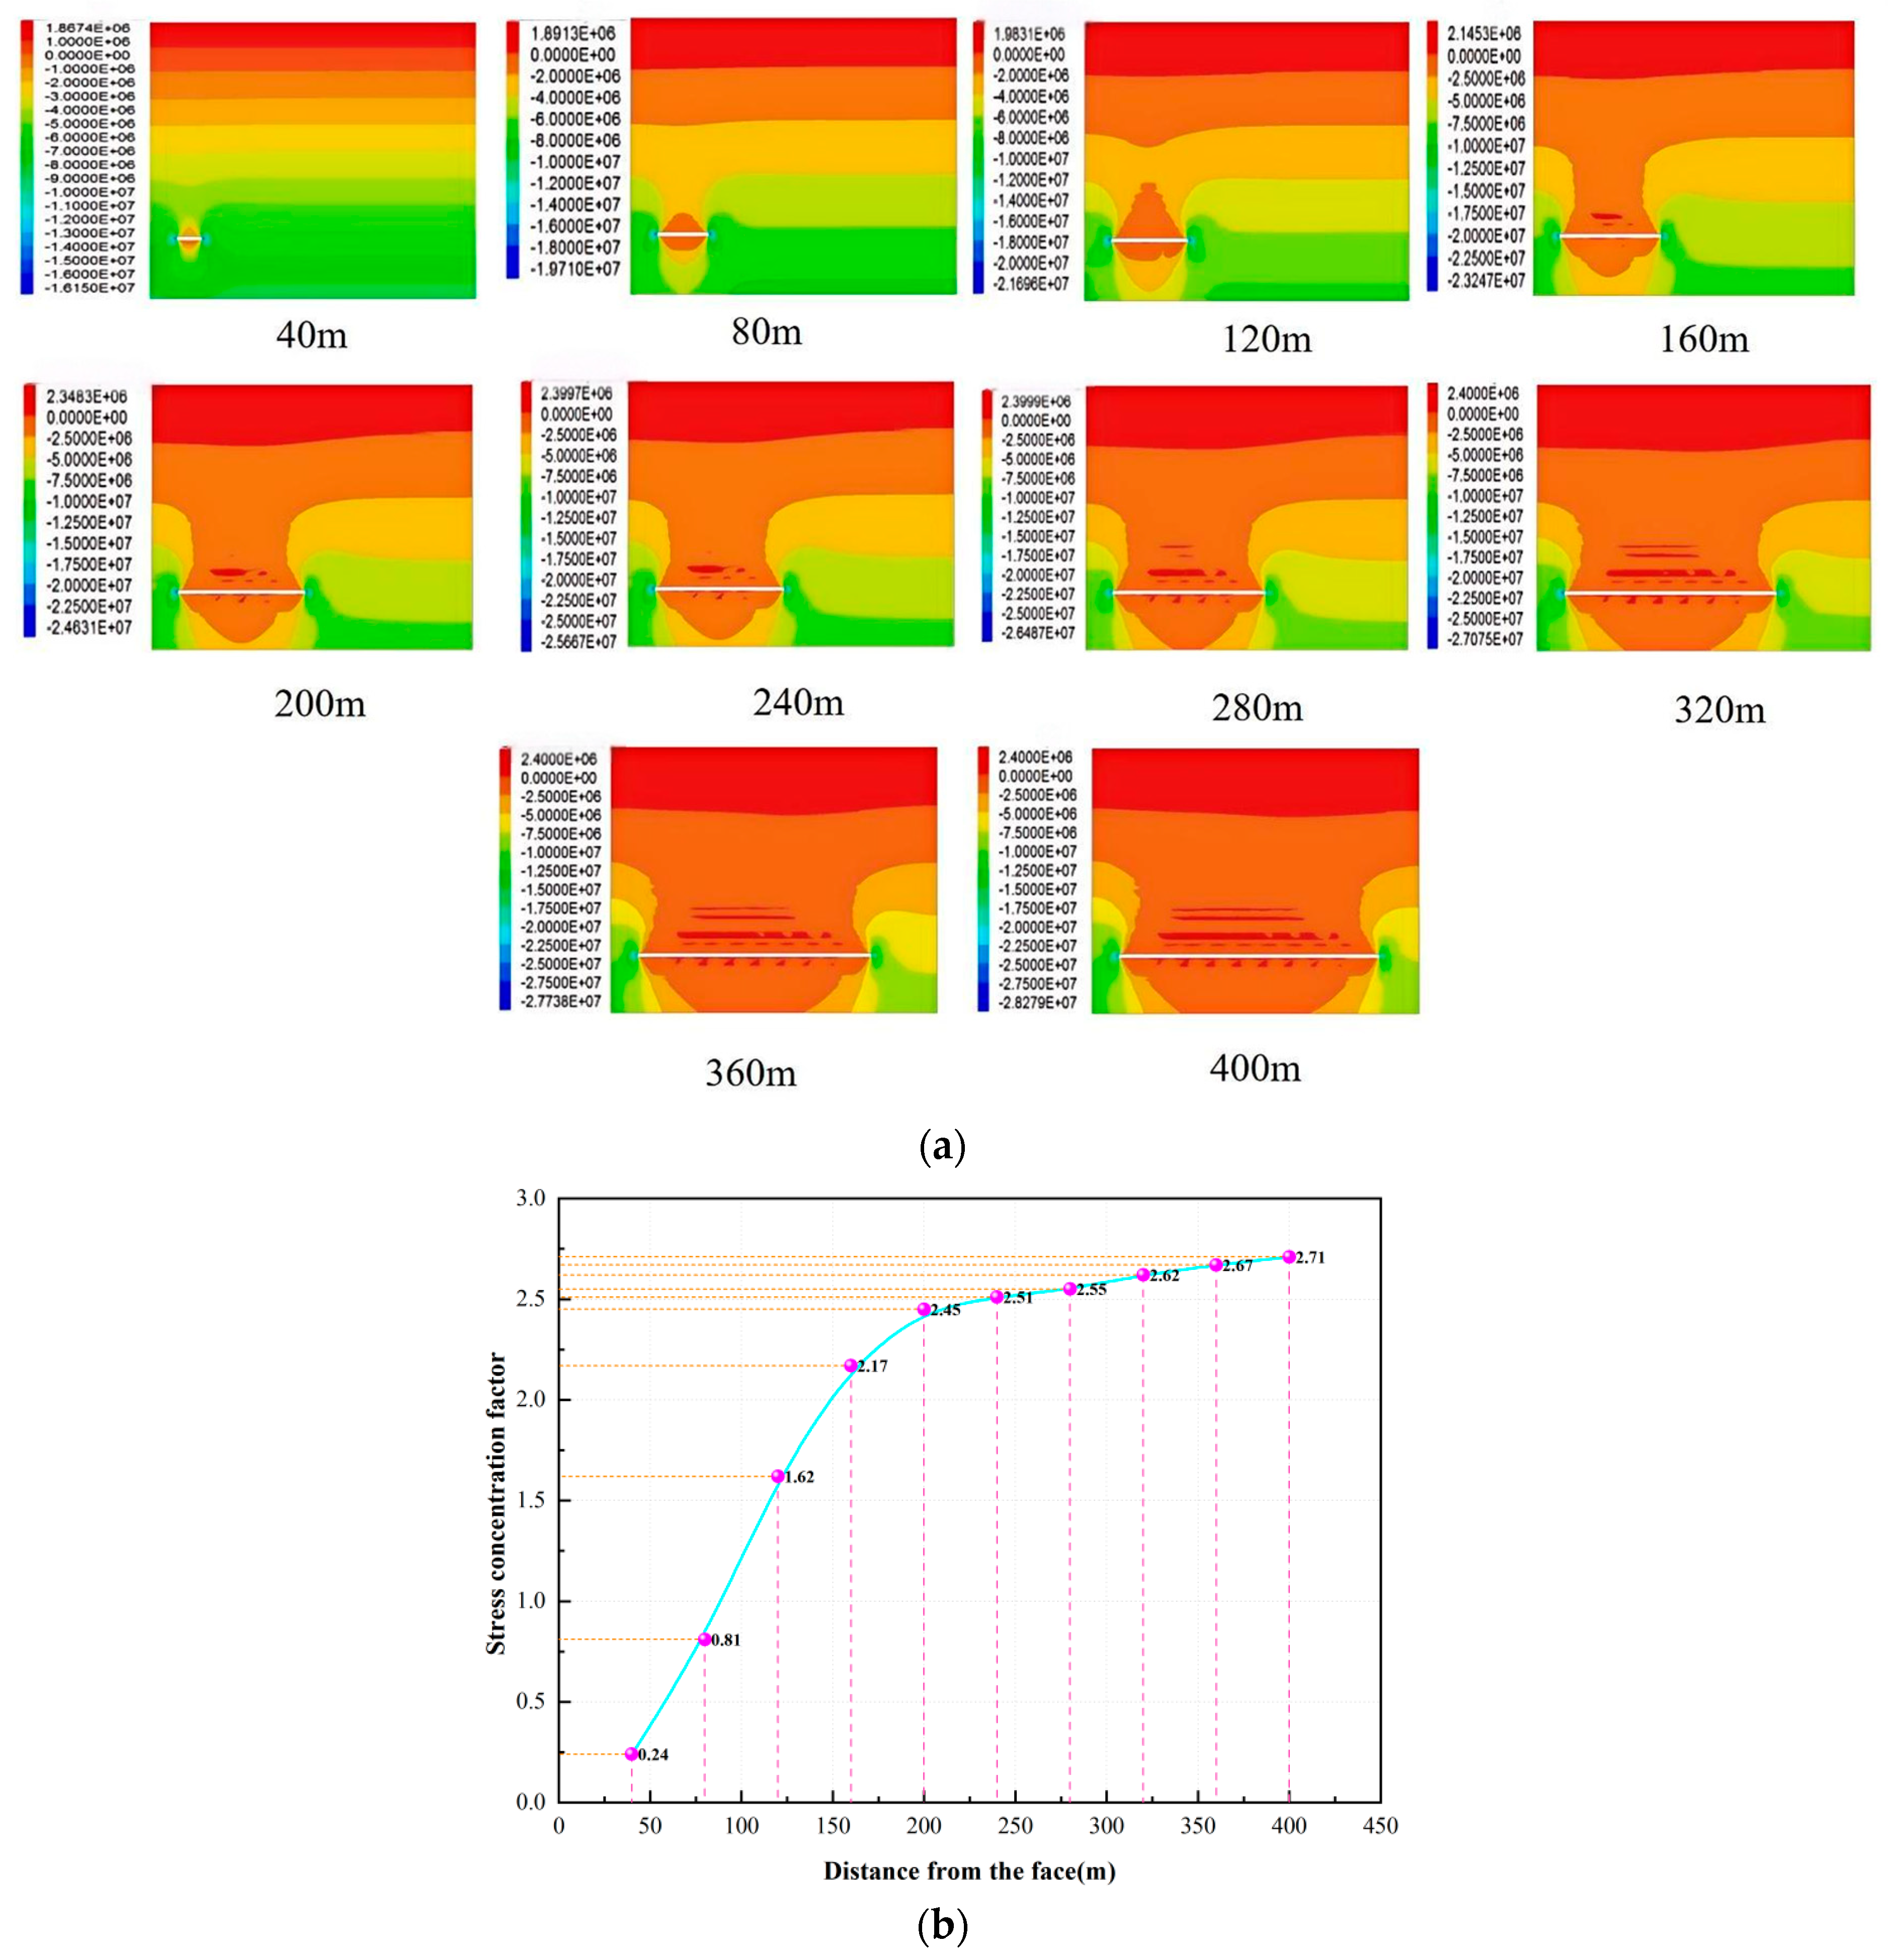
Following the extraction of the working face, the overlying strata undergo movement, resulting in stress redistribution and a series of ground pressure manifestations. This study analyzes the evolution of the stress field in the overburden at different advancing distances. Figure 4 presents nephograms of the vertical stress distribution along the strike direction at various advancement stages of the E9103 working face. All views shown are cross-sections taken at the centerline of the model. When the working face advances 40 m, stress concentration occurs within the coal and rock mass both in front of and behind the working face; the peak value of vertical stress in front of the working face reaches 12.8 MPa, with a stress concentration factor of 0.24 (Figure 6b). When the working face advanced to 200 m, the peak value of the abutment pressure in front and behind the working face reached a maximum of 18.2 MPa, with a stress concentration factor of 2.17. When the working face advances to 400 m, the peak value of abutment pressure both in front of and behind the working face reaches a maximum of 19.8 MPa, with a stress concentration factor of 2.71 (Figure 6b).
Figure 6.
Vertical stress distribution of the overlying rock under different distances from the working face. (a) Advancing distance of the coal mining face. (b) Relationship curve between stress concentration factor and propulsion distance. (The pink line corresponds to the propulsion distance, while the orange-yellow line corresponds to the stress concentration factor).
From Figure 6, it can be seen that the excavation of the working face has disrupted the stress balance state of the original rock, causing stress redistribution in the surrounding rock of the mining site and resulting in mining disturbance. The change in pushing distance reflects the different disturbance and damage ranges of the overlying coal and rock mass caused by coal seam mining. When the working face advances 40 m, stress concentration occurs in the solid rock layers in front and behind the working face. The peak vertical stress in front of the working face reaches 14.38 MPa, with a stress concentration factor of 1.78 (From Figure 6a). However, a stress reduction area appears above the goaf of the working face, forming an “arch” distribution. Tensile stress also occurs in some areas of the overlying rock, causing macroscopic tensile damage to the roof area of the goaf. This is the main factor in the collapse and failure of the overlying rock, and also the main reason for the development of fractures in the lower part of the fracture zone. As the advancing distance of the working face increases, the disturbance range of the mining is also constantly expanding. The low stress zone above the goaf is gradually developing upwards in an arch shape. When the working face advances to 200 m, the peak support pressure in front and behind the working face reaches 21.008 MPa, with a stress concentration coefficient of 2.6. As the working face continues to advance, the increasing trend of the peak support pressure gradually slows down, as shown in Figure 6a, indicating that the pressure manifestation is relatively obvious during the first square measurement period of the working face. It is recommended to strengthen safety production work, such as roof management, during the first square measurement period and its later stages during the mining of the working face.
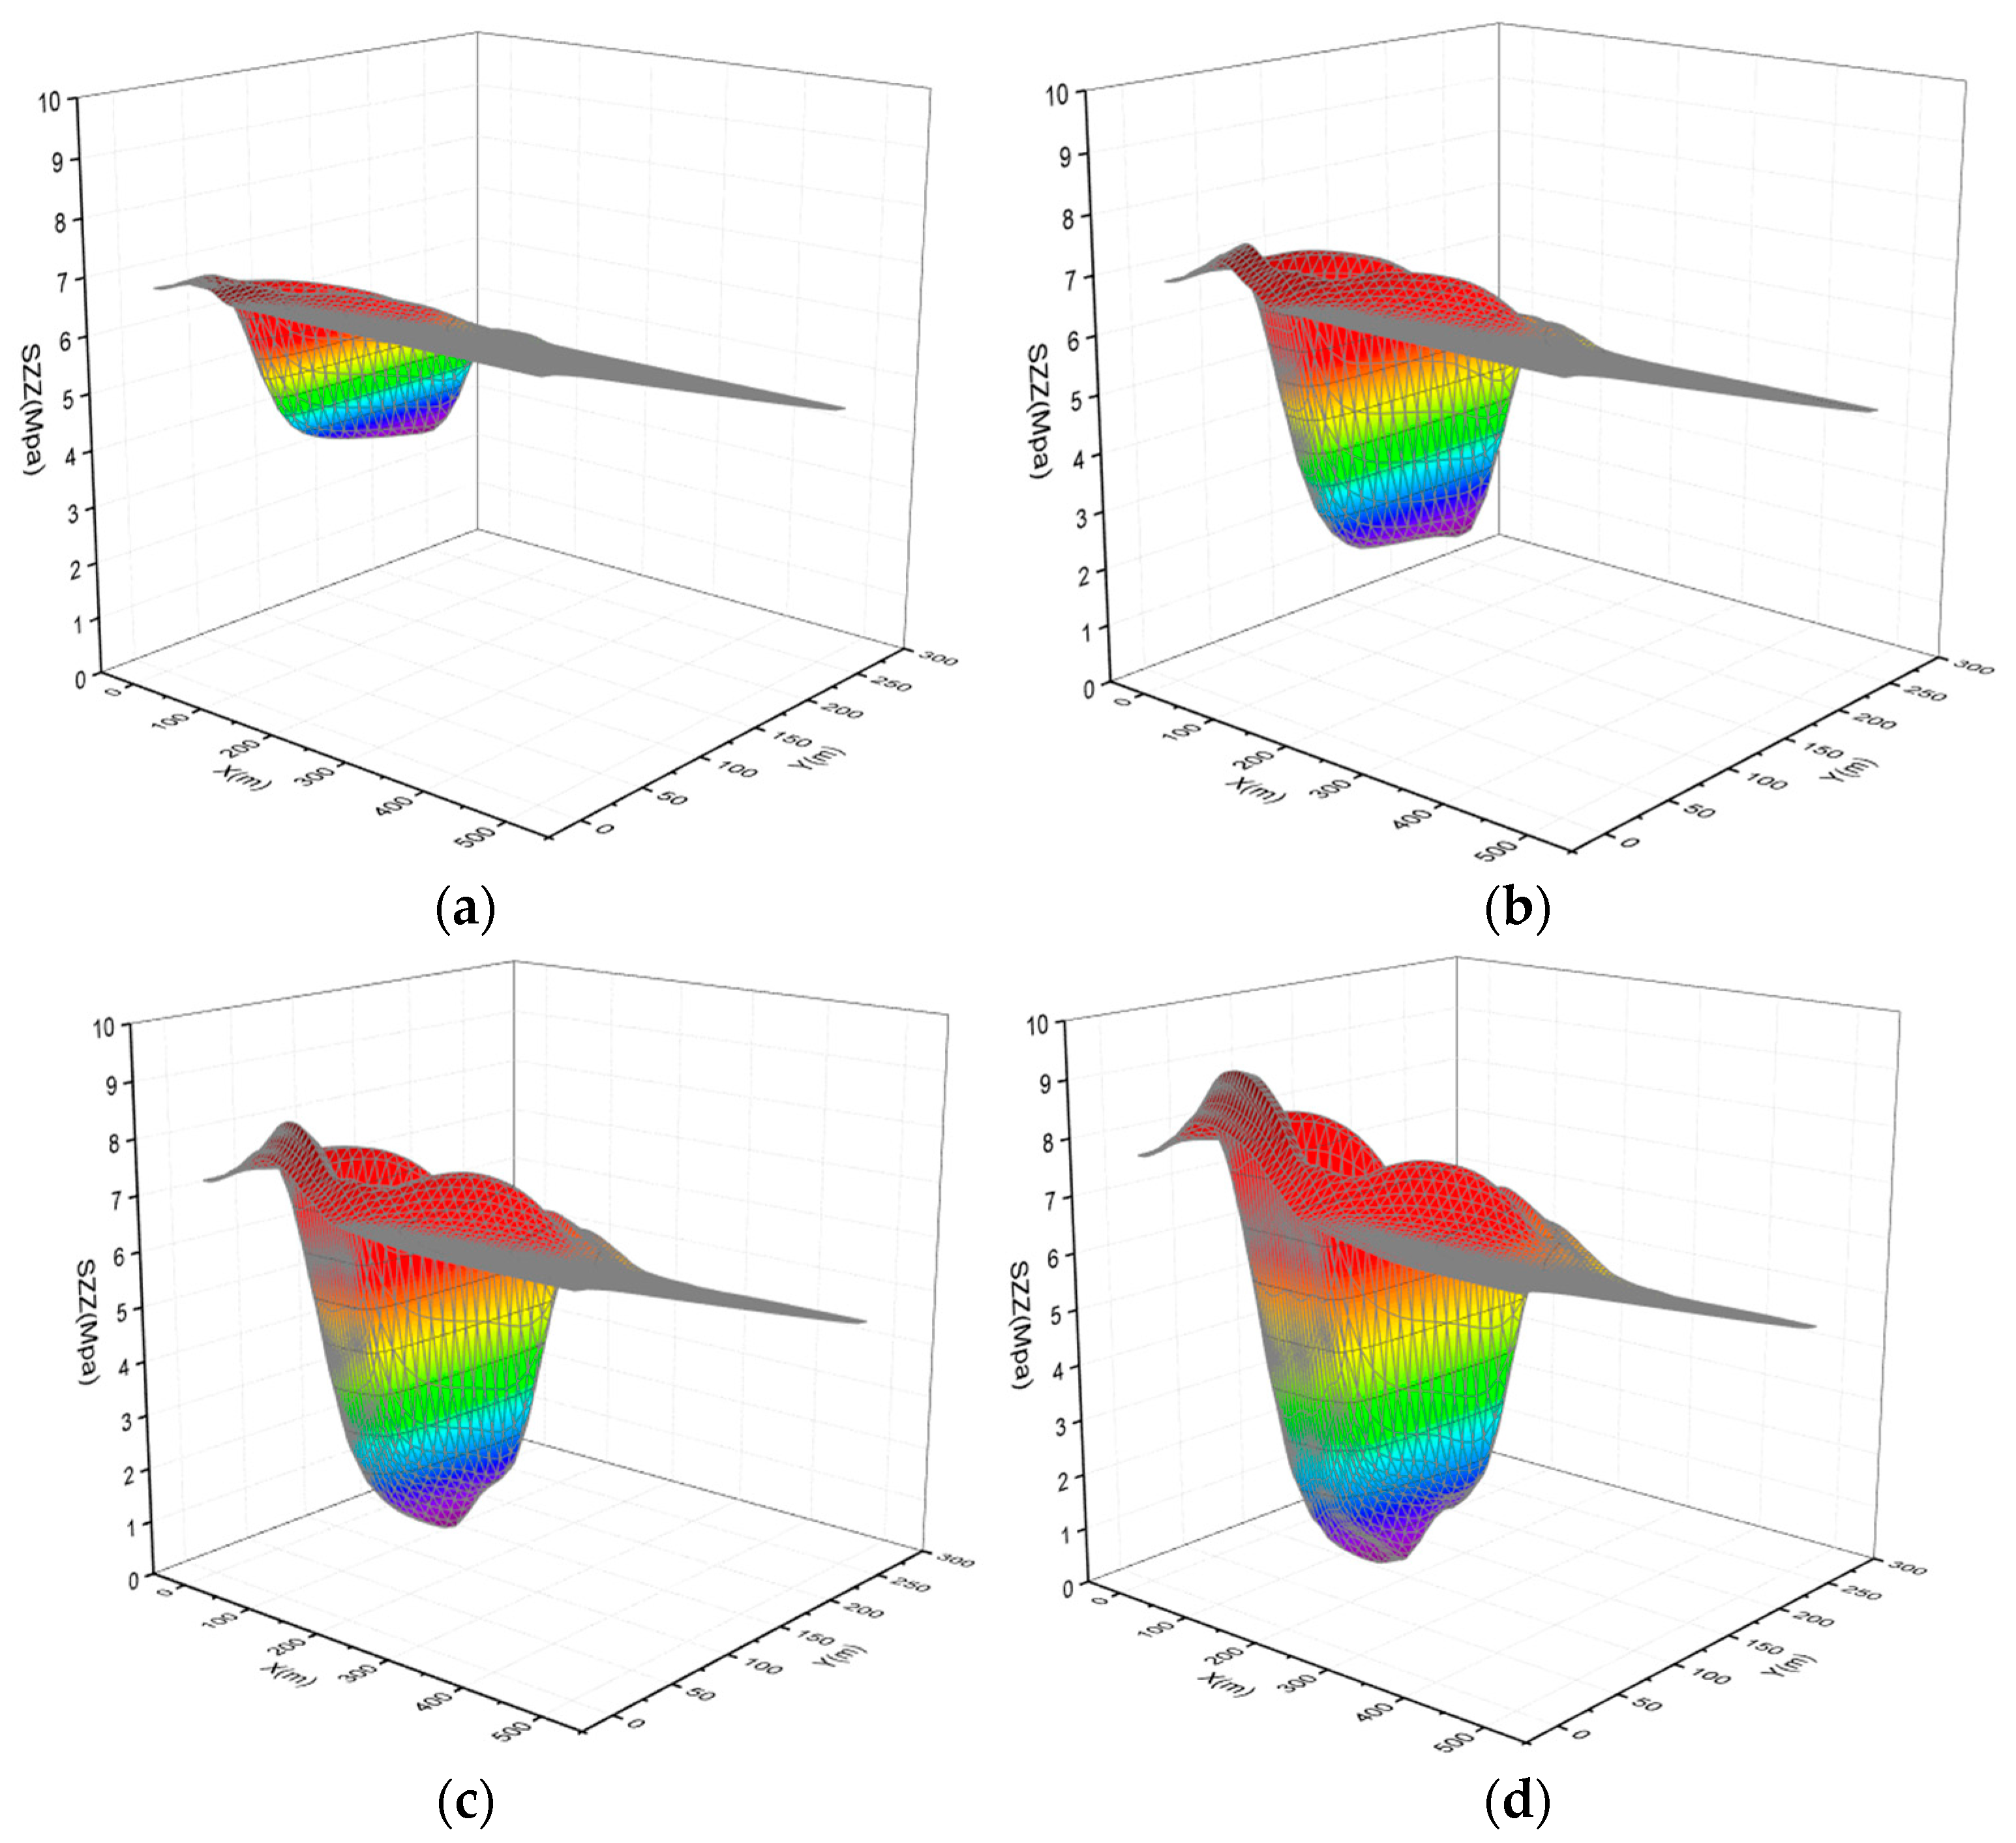
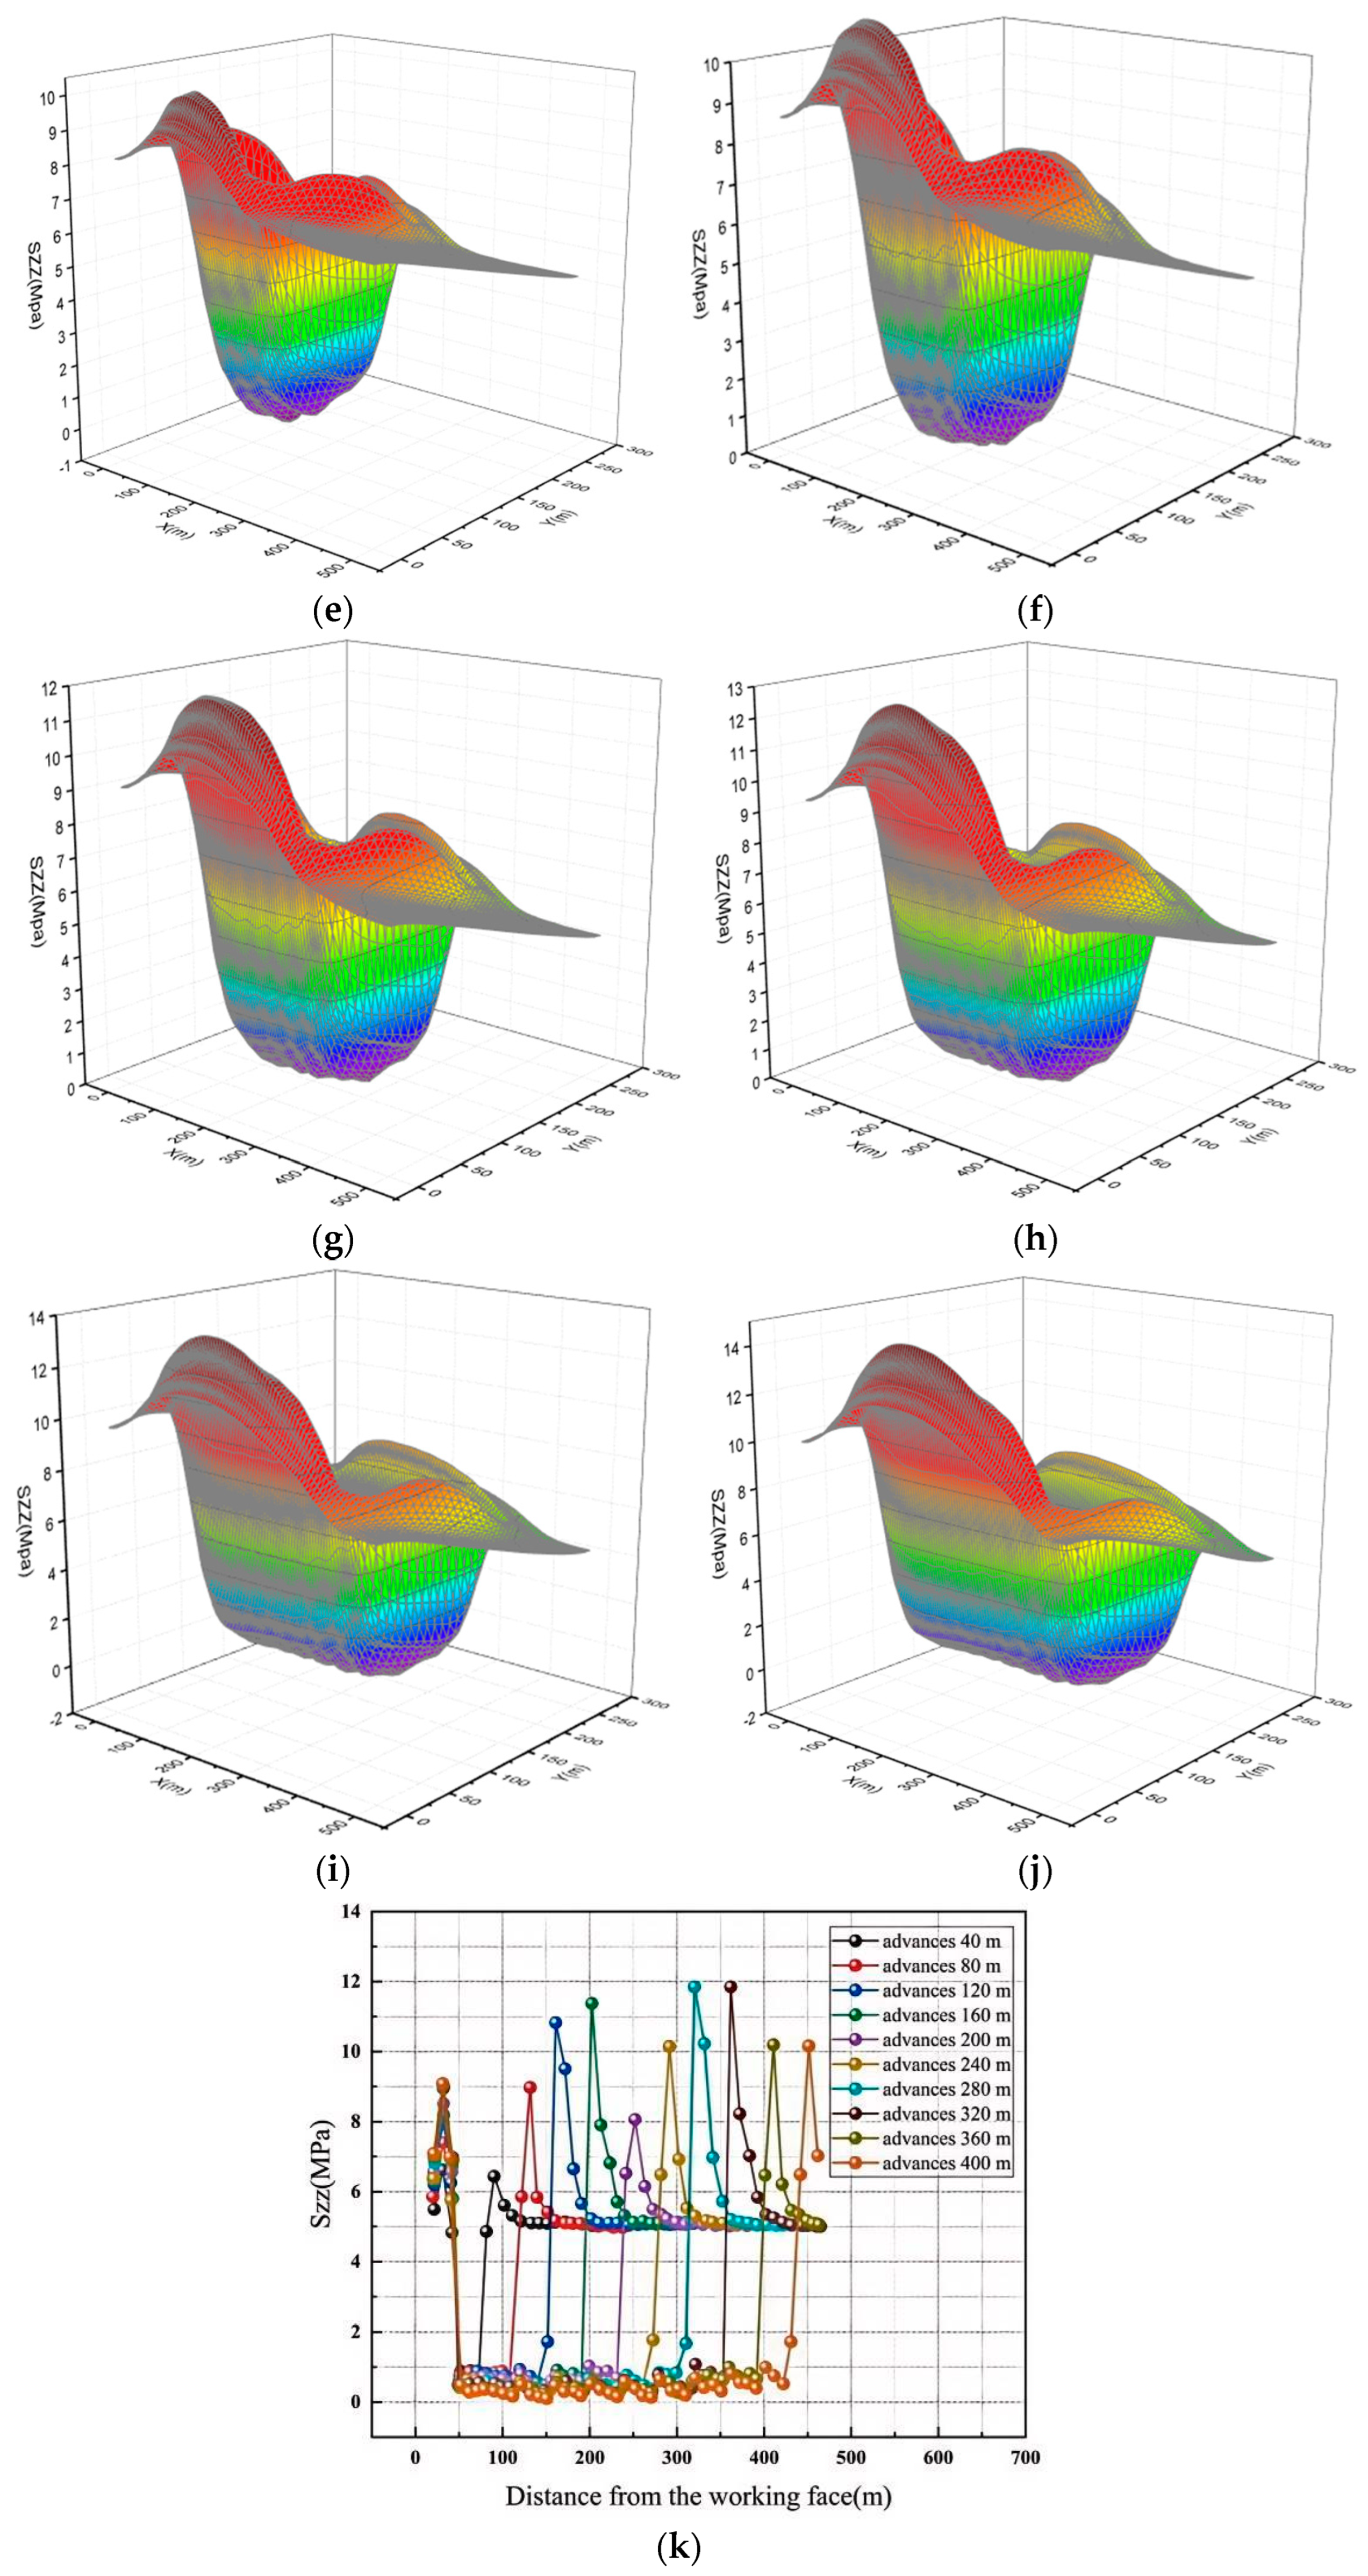
During simulation, when the Hengjin E9103 working face advances at different distances, stress results are output for the units in the overlying rock layers. Three-dimensional surface plots of the vertical stress on the coal seam roof and the vertical stress variation curve in the direction of the central position of the goaf are made when the working face advances at different distances, as shown in Figure 7. From the Figure, it can be seen that after the mining of E9103 working face, the stress state inside the overlying rock layer changes, resulting in a certain degree of pressure relief and stress concentration. Localized tensile stress occurs in the goaf area, leading to tensile failure of the coal rock mass and the formation of a certain degree of cracks in the coal body, which can cause unloading of the coal seam roof.

Figure 7.
Three-dimensional surface and curve of vertical stress on the coal seam roof at different distances from the advanced working face. (a) 40 m. (b) 80 m. (c) 120 m. (d) 160 m. (e) 200 m. (f) 240 m. (g) 280 m. (h) 320 m. (i) 360 m. (j) 400 m. (k) Vertical stress variation curve of the roof at the central position of the goaf.
As can be seen from the three-dimensional surface (Figure 7a–j), as the working face advances, the mining-induced stress field exhibits a typical “pressure arch” morphology, with the scale and scope of the arch continuously expanding. Stress concentration mainly occurs in the coal wall ahead of the working face (advance support pressure) and in the coal pillars on both sides of the goaf (lateral support pressure). The vertical stress variation curve at the central position of the goaf is shown in Figure 7k. As the working face advances, the vertical stress first increases and then decreases. The main reason is that the load is transferred to the coal wall in front of the working face and the coal pillars on both sides of the goaf. When the exposed span exceeds the ultimate strength of the rock stratum, the immediate roof begins to fracture and collapse, and the goaf is filled with collapsed rocks. The supporting capacity of these rubbles is much lower than that of intact coal walls and cannot withstand high stress. Therefore, the stress in this area will drop sharply, forming a “stress reduction zone” or “pressure relief zone” with lower stress than the original rock stress.
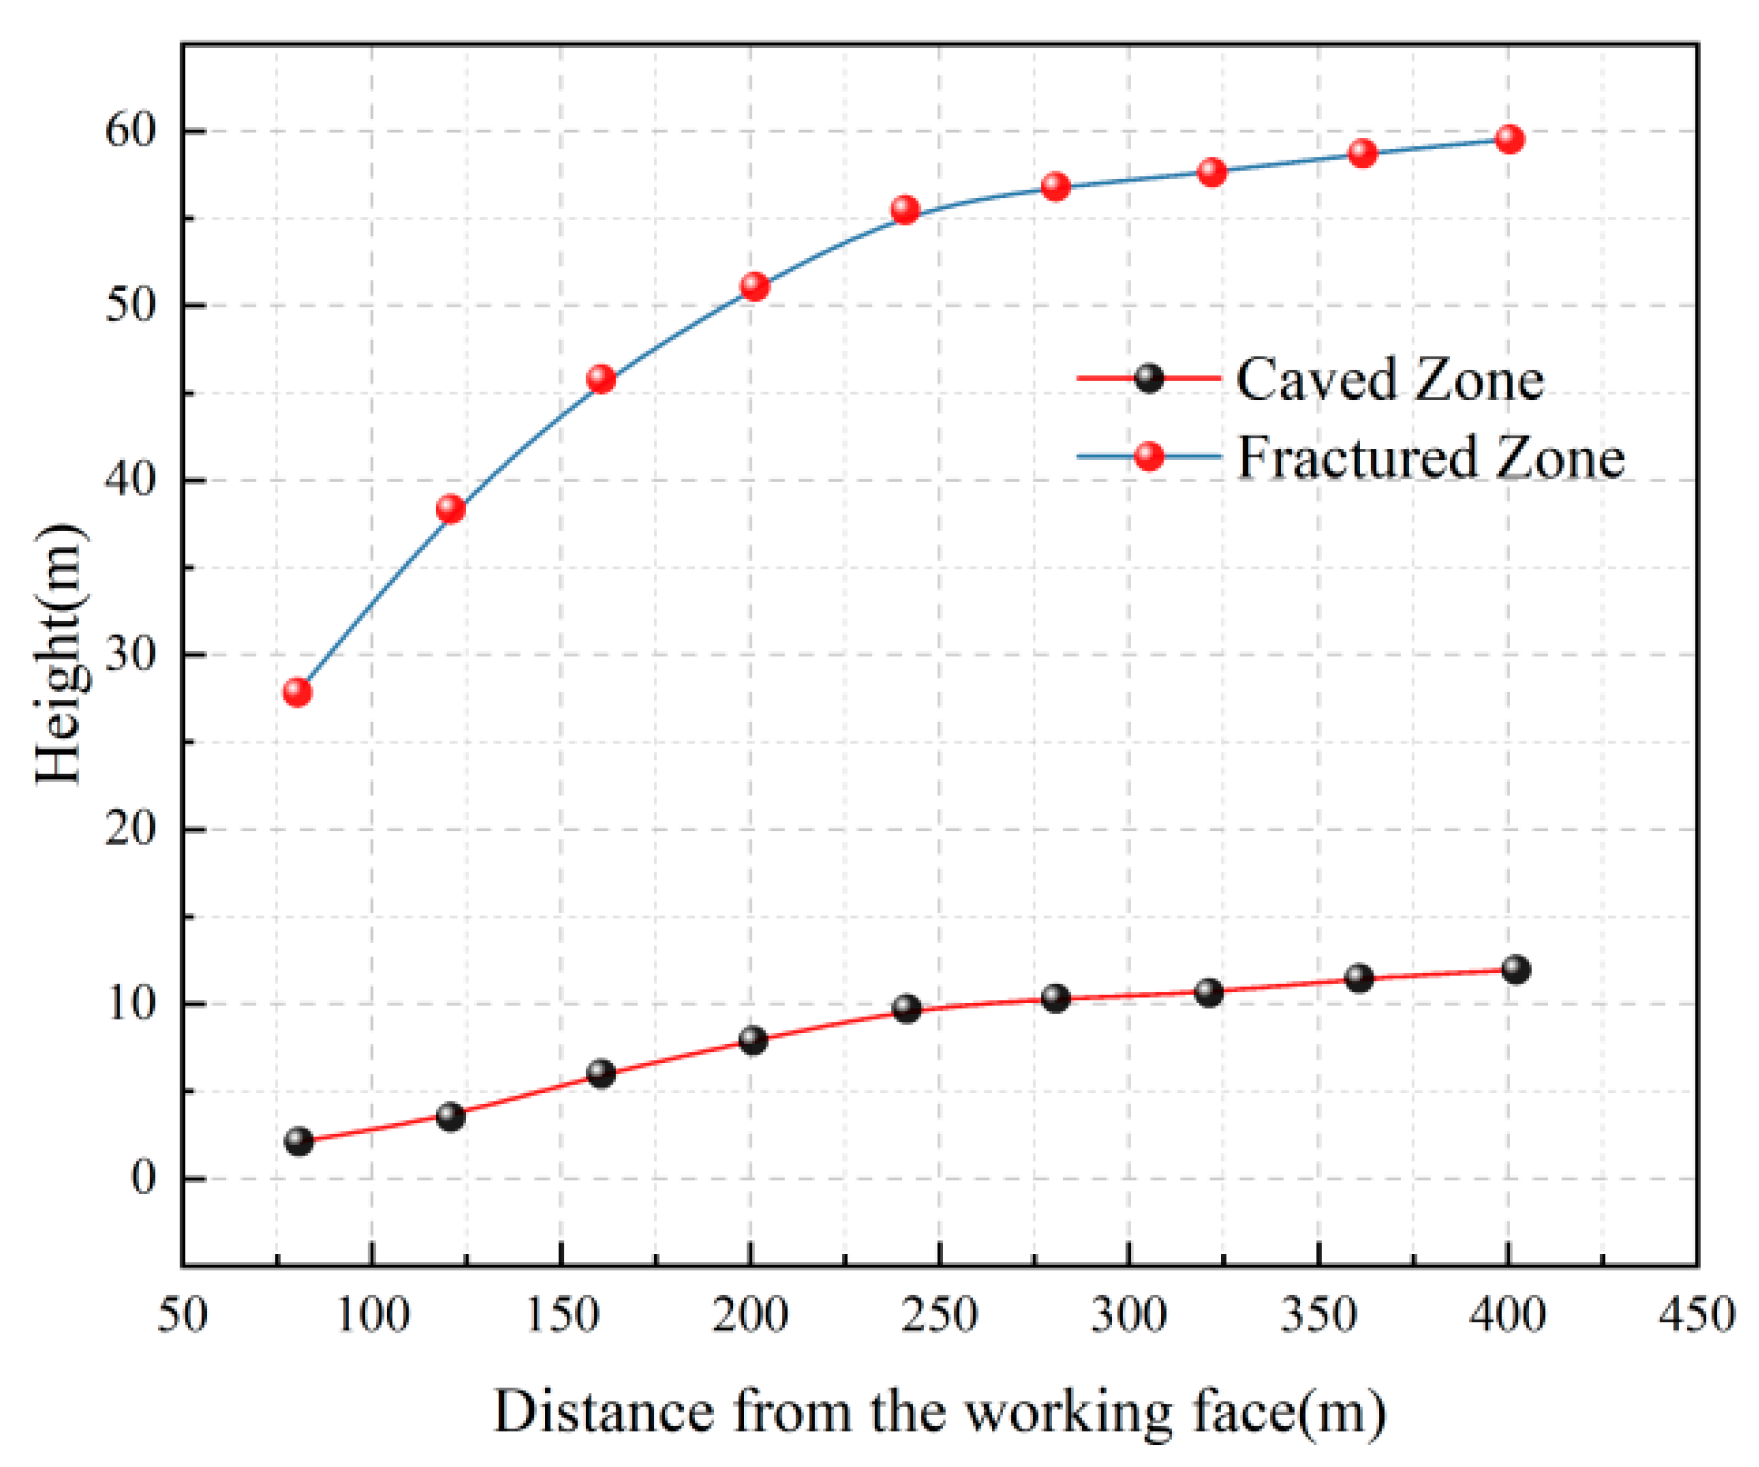
The relationship curve between the development height of the collapse zone and fracture zone in the direction of the strike and the distance of the working face advancement is shown in Figure 8.
Figure 8.
Development of fracture zones in the caving zone of the working face at different distances.
As shown in Figure 8, the height of the caving zone in the strike direction exhibits a weak correlation with the working face advance distance, increasing only slightly to a final range of 7.2–13.13 m. In contrast, the height of the fracture zone increases rapidly with the advance distance. This growth stabilizes after the working face has reached a square configuration, with the fracture zone height maintaining a stable value of 30.8–59.2 m. The curved subsidence zone, representing the interval from the coal seam roof to the surface, is also illustrated.
4. On-Site Measurement of Distributed Optical Fiber in Overlying Strata of Fully Mechanized Top Coal Mining
4.1. Principle of Brillouin Optical Time Domain Analysis (BOTDA) Testing
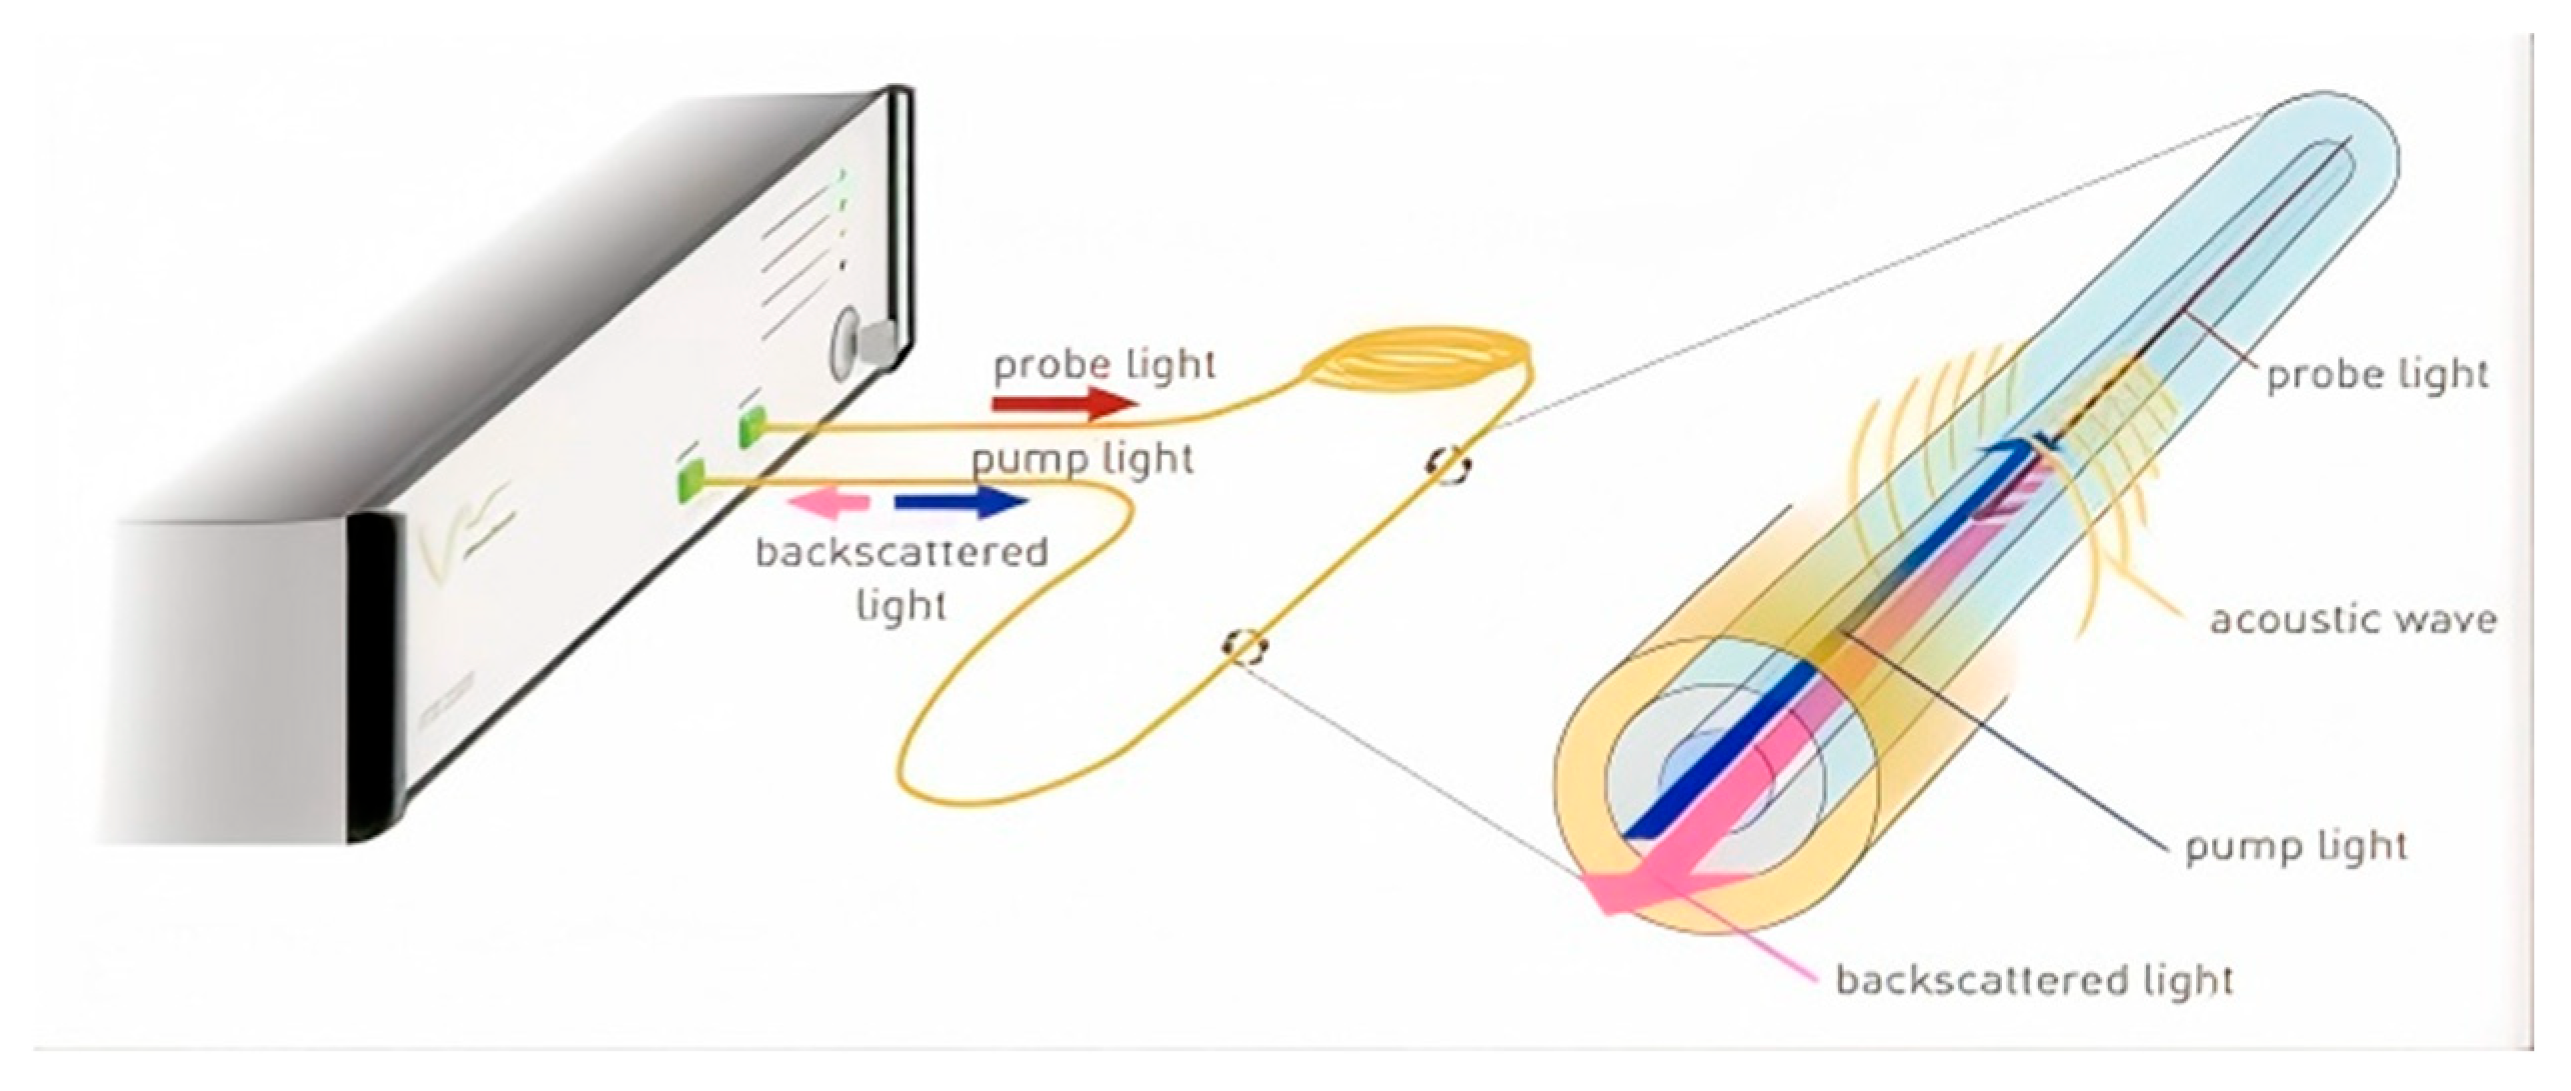
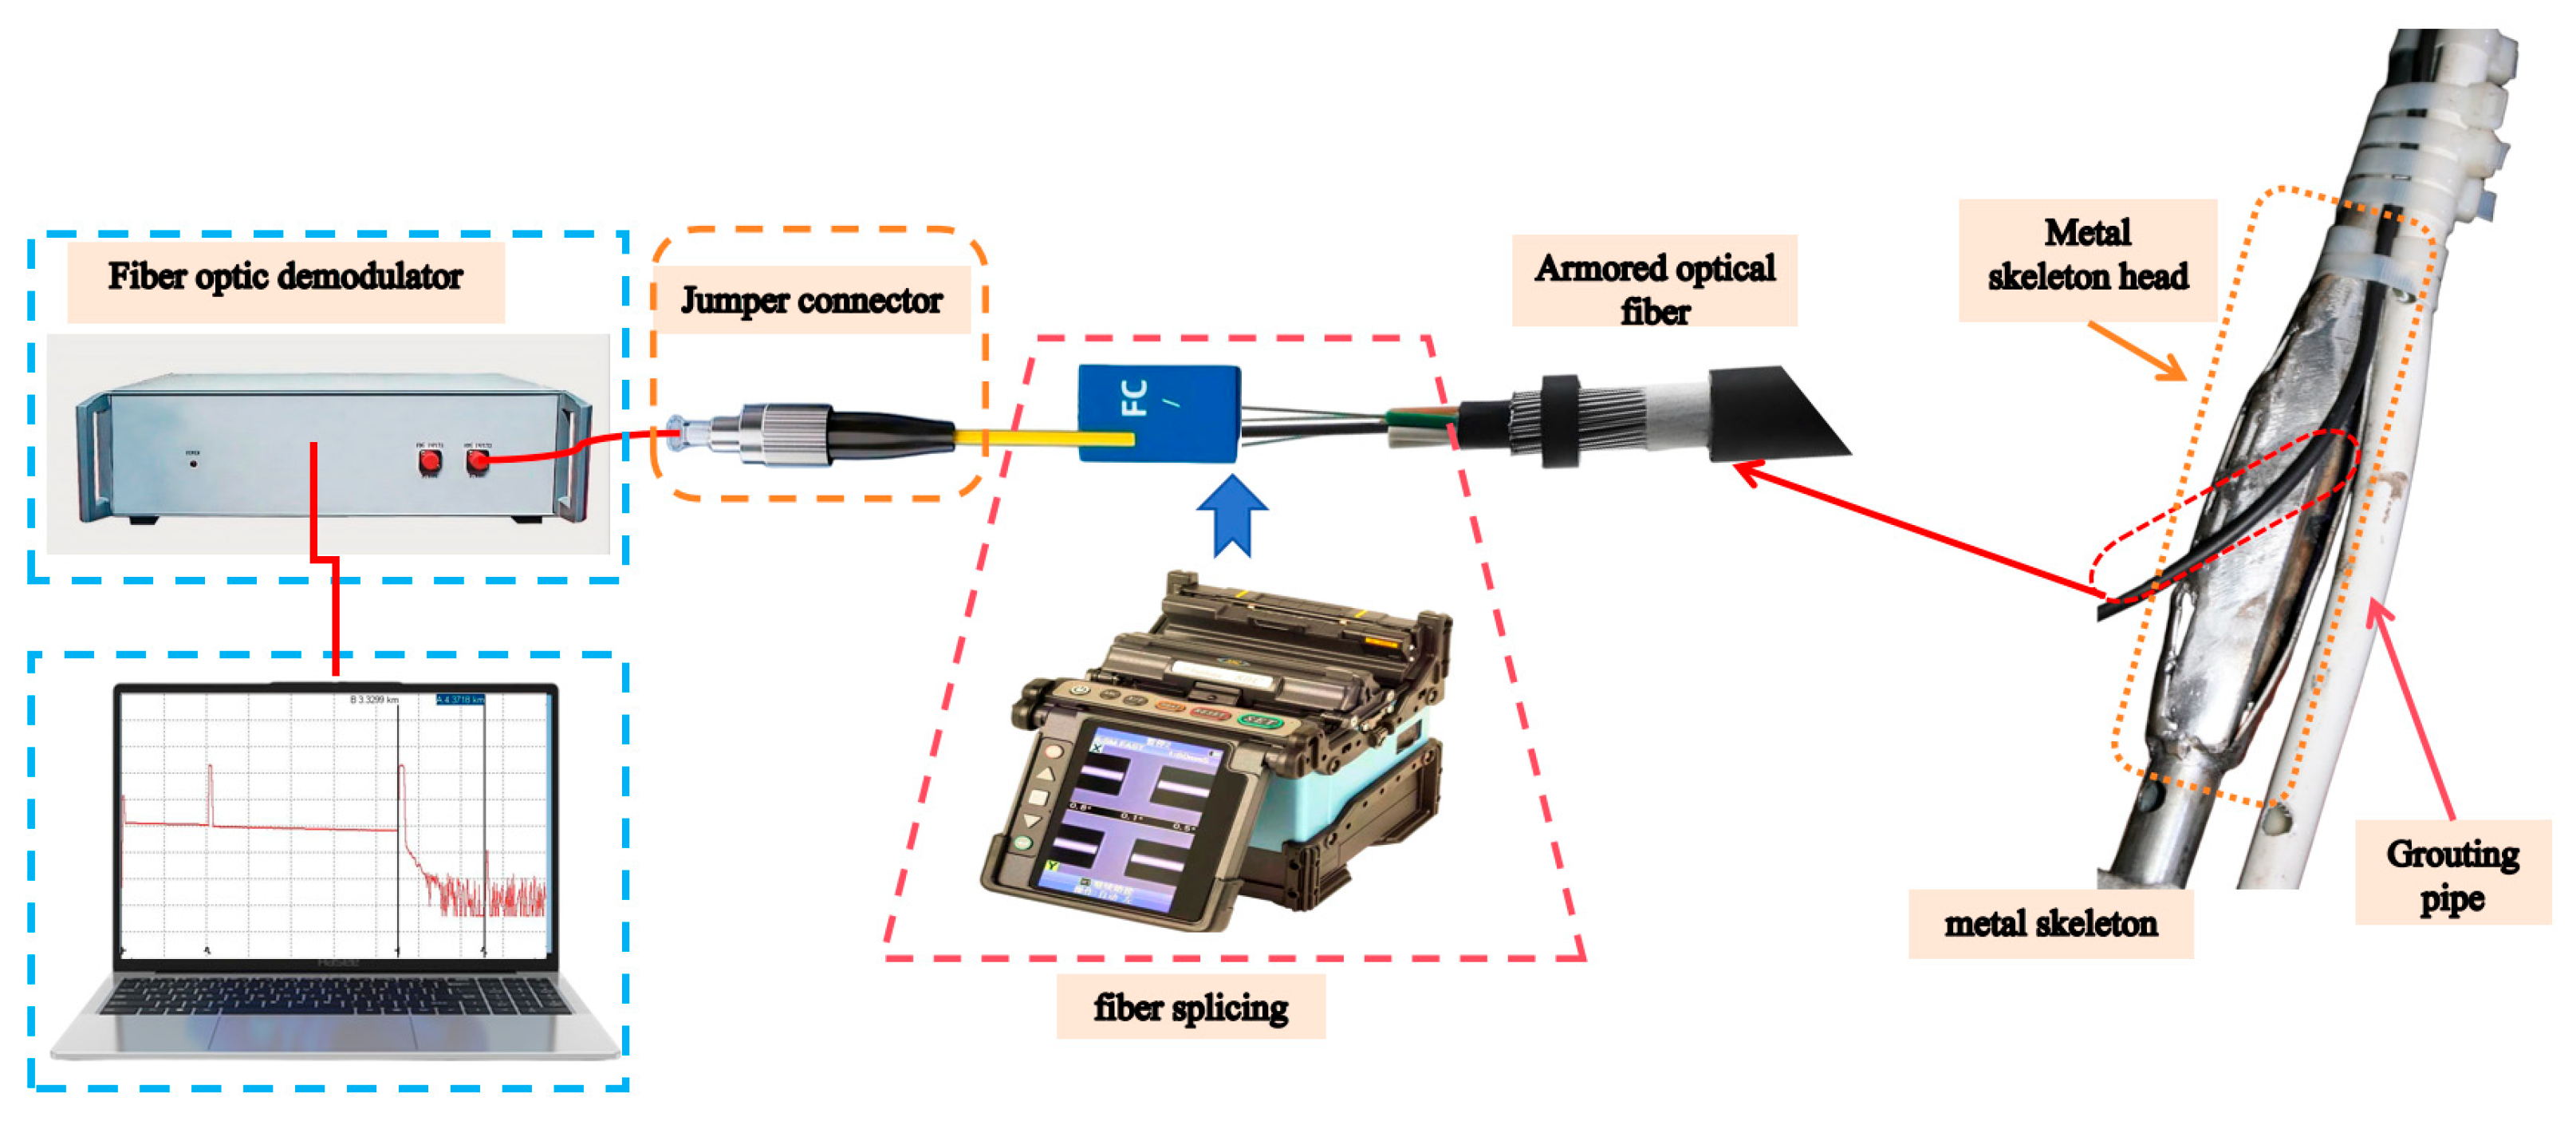
Distributed Fiber Optic Sensing (DFOS) technology is based on Optical Time Domain Reflectometry (OTDR) and Brillouin/Rayleigh scattering effects. By demodulating the coupling response between light wave parameters (intensity/frequency/phase) and external physical fields, it achieves fully distributed continuous sensing of temperature field, strain field, and vibration field inside the rock mass. The core breakthrough lies in utilizing the dual properties of optical fibers, which combine waveguide transmission and sensing units, to synchronously capture the three-dimensional spatial gradient distribution and temporal evolution laws of physical quantities. Compared to traditional point sensors, this technology has centimeter-level spatial resolution and microseismic accuracy, completely solving the limitation of the discretization of monitoring points and providing an innovative means of continuous capture of multi-field coupled disaster precursor information for mining rock masses. Fibrois Terre FTB is a distributed strain measurement device that utilizes silicon dioxide optical fibers. The distributed fiber optic strain measurement system includes monitoring software fTView 3.2.42 and FTB readout unit running on a PC or laptop, which are connected to the readout unit via Ethernet through a computer. The testing system diagram is shown in Figure 9.
Figure 9.
Distributed Fiber Optic Strain Measurement System.
Measurement principle: The FTB readout unit records the continuous strain distribution along the optical fiber. Strain data are obtained by inducing stimulated Brillouin scattering within the fiber. The Brillouin frequency shift—a parameter dependent on the physical properties of the fiber material (typically around 11 GHz for standard telecommunication fibers)—varies with changes in applied strain. By scanning the optical frequency difference (Δf) between two light waves, the Brillouin frequency shifts along the sensing fiber are captured, with each shift corresponding to a local strain or temperature value. The location of each measurement point is determined based on the round-trip time of the optical signal between the point of interest and the readout unit. This process yields a spatially resolved profile of the Brillouin frequency shift along the entire fiber. The operating principle of distributed Brillouin sensing is illustrated in Figure 10.
Figure 10.
Principle of distributed Brillouin sensing [].
Distributed fiber optic sensing testing technology has gradually been applied to underground engineering, and dual-mode BOTDA technology is a dual-ended measurement that can better monitor the fiber optic cables. In application, strict protection of the testing of fiber optic cables is required. This article uses NZS-DSS-C02 metal-based cable-shaped strain-sensing fiber with high testing accuracy and spatial resolution. The parameters of the metal-based, cable-shaped, strain-sensing fiber are shown in Table 5.
Table 5.
Metal-based, Cable-like, Strain-sensing Fiber.
4.2. Experimental Program
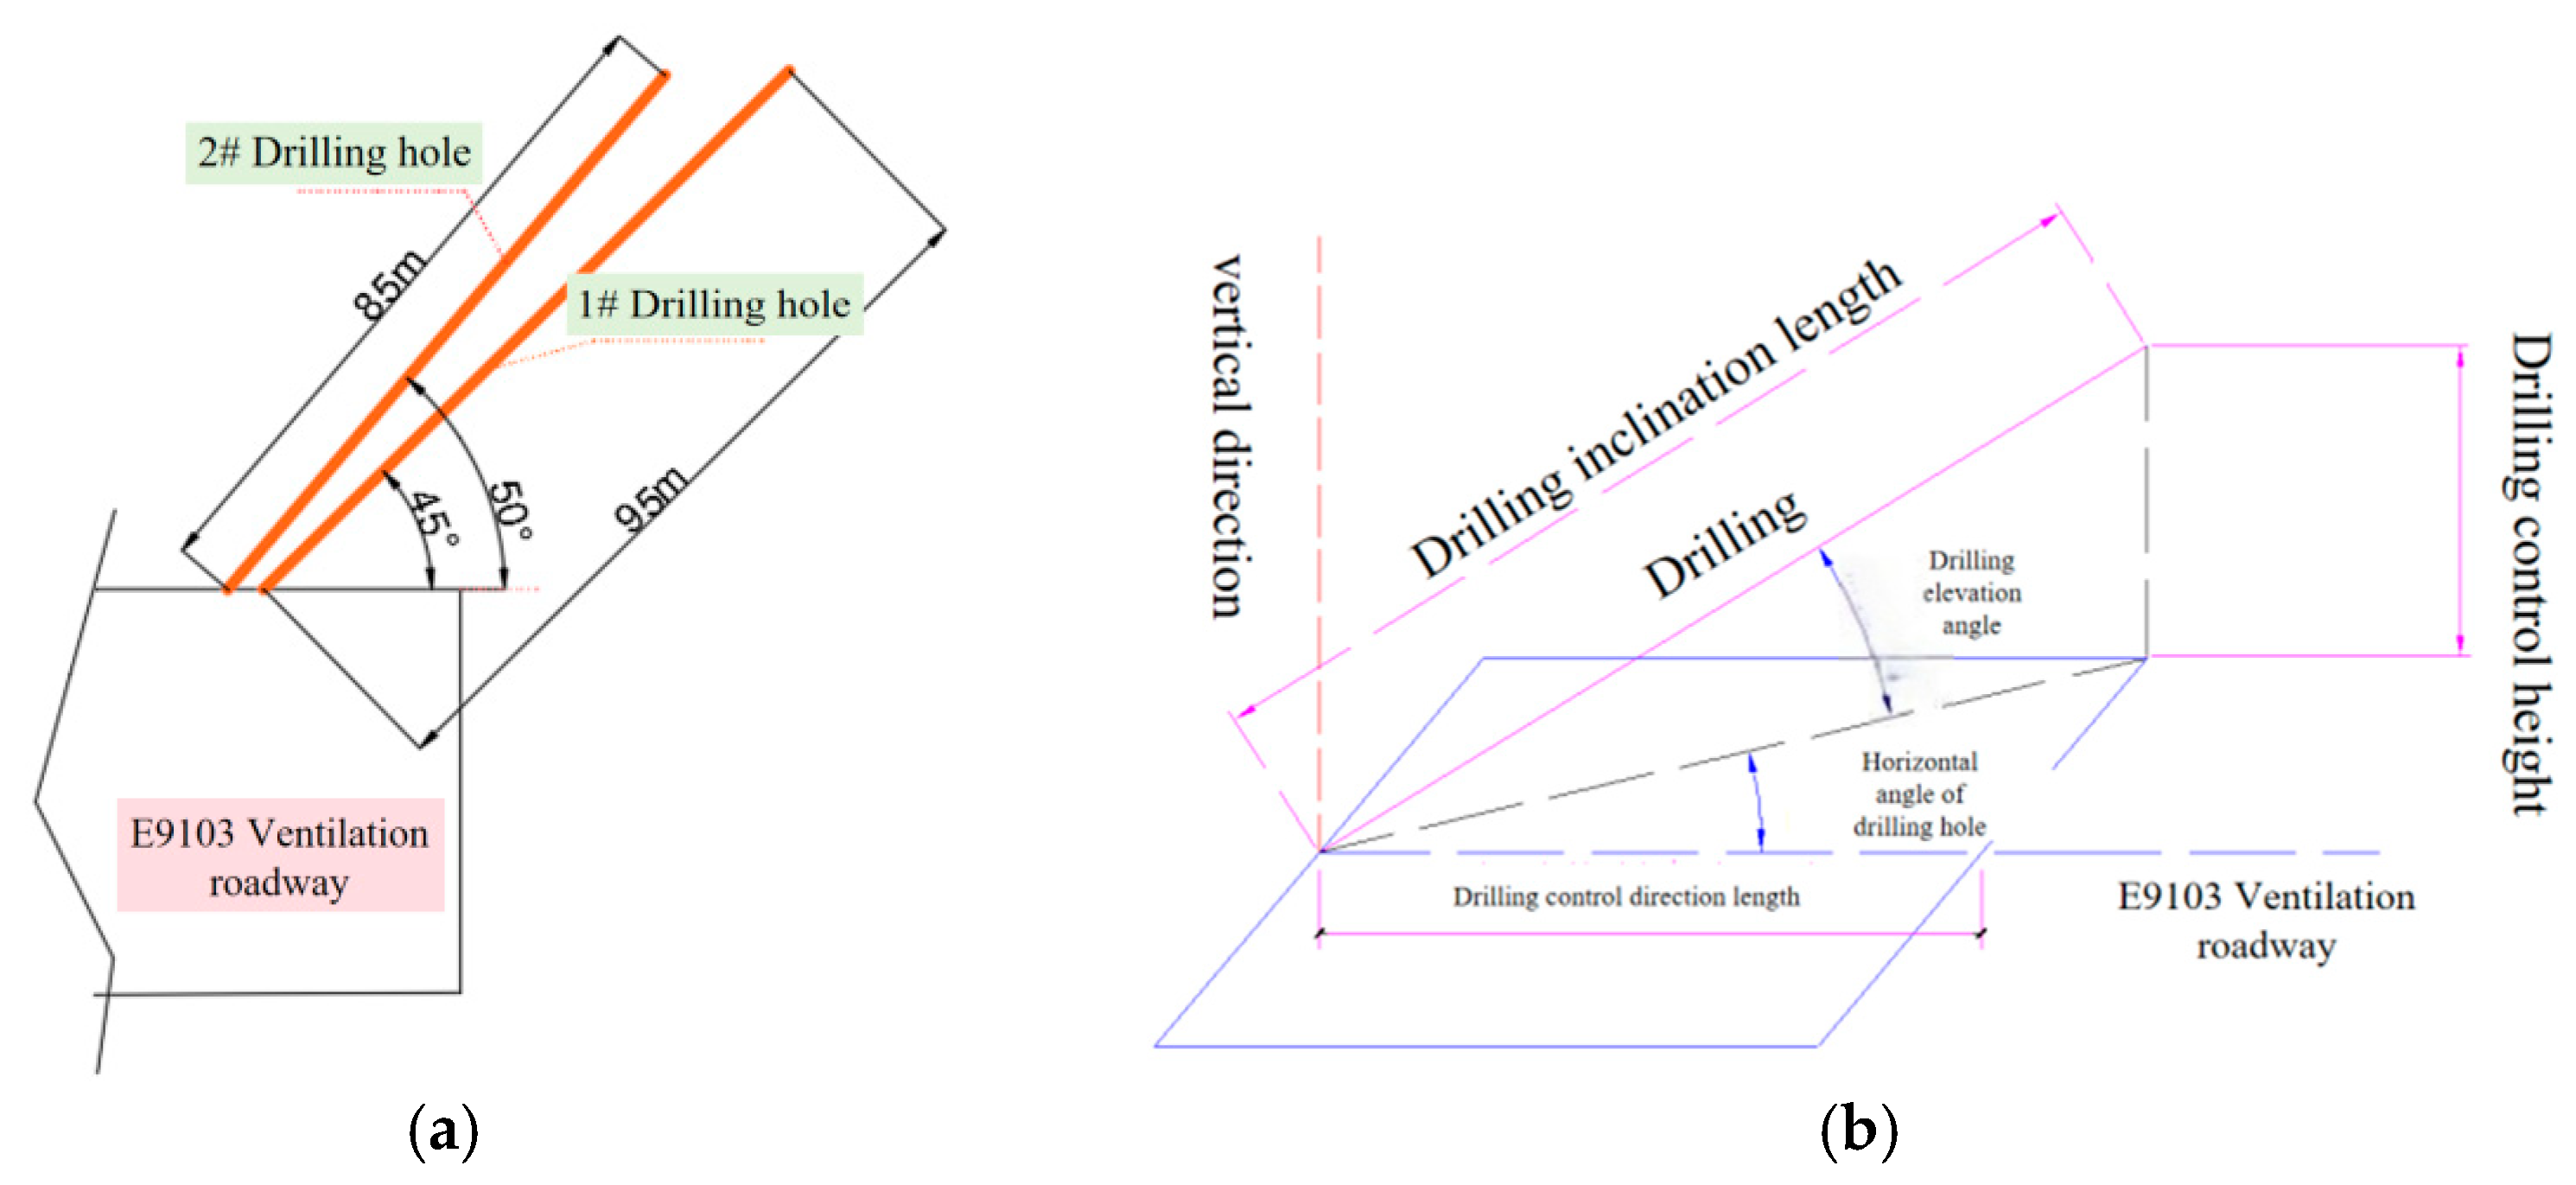
At the E9103 working face, two distributed optical fiber boreholes are designed in the ventilation roadway near the open-off cut. Two advanced roof monitoring boreholes (Borehole 1# and 2#) are constructed in the ventilation roadway of E9103, approximately 200 m ahead in the direction of the working face advance. One additional advanced roof monitoring borehole (Borehole 3#) is drilled in the machine roadway of E9103 in the same advance direction, as shown in Figure 9. Borehole 1# has a designed inclined length of 95 m (with an actual optical fiber installation length of 65 m), a dip angle of 45°, and an azimuth of 345° (the horizontal angle between the borehole and the ventilation roadway is 40°). Borehole 2# has an inclined length of 85 m, a dip angle of 50°, and an azimuth of 351° (the horizontal angle with the ventilation roadway is 45°). Borehole 3# has an inclined length (borehole depth) of 90 m, a dip angle of 60°, and an azimuth of 90° (the horizontal angle with the machine roadway is 60°). The schematic diagram of the three borehole planes is shown in Figure 11. The spatial diagram of the three boreholes is provided in Figure 12, and their parameters are summarized in Table 6. The total deviation of each borehole does not exceed 1°, and casings are installed within a 3 m range at the borehole collar. All three boreholes are oriented diagonally toward the direction of the working face advance.
Figure 11.
Schematic Layout of Boreholes.
Figure 12.
Drill Hole Specifications. (a) Drilling plan. (b) Exploration Drill Site Plan. (The orange-yellow line indicates the drilling depth; The pink line represents the actual position of the drill hole, while the black line represents its projection).
Table 6.
Drilling Parameters.
4.3. Equipment Installation
4.3.1. Pre-Installation Requirements
Fiber Optic Splicing: Leave sufficient slack fiber at the splice point. Strictly follow the fusion splicer operating procedures: strip the cable, clean the fiber, cleave the end face, and fuse. Immediately after splicing, use an OTDR to bidirectionally test the splice loss (generally required to be <0.05 dB) and record the results. Resplice if the result is unsatisfactory. The splice must be placed in a mining-grade flameproof/intrinsically safe fiber optic splice closure, with the fiber coiled neatly and the closure tightly sealed (waterproof, dustproof, and explosion-proof). Since distributed optical fiber is relatively soft, pre-fabricated support structures must be prepared to install the fiber into pre-drilled boreholes. A pre-fabricated metal support structure for distributed optical fiber is shown in Figure 13.
Figure 13.
Fiber optic skeleton diagram.
4.3.2. Distributed Fiber Optic Installation
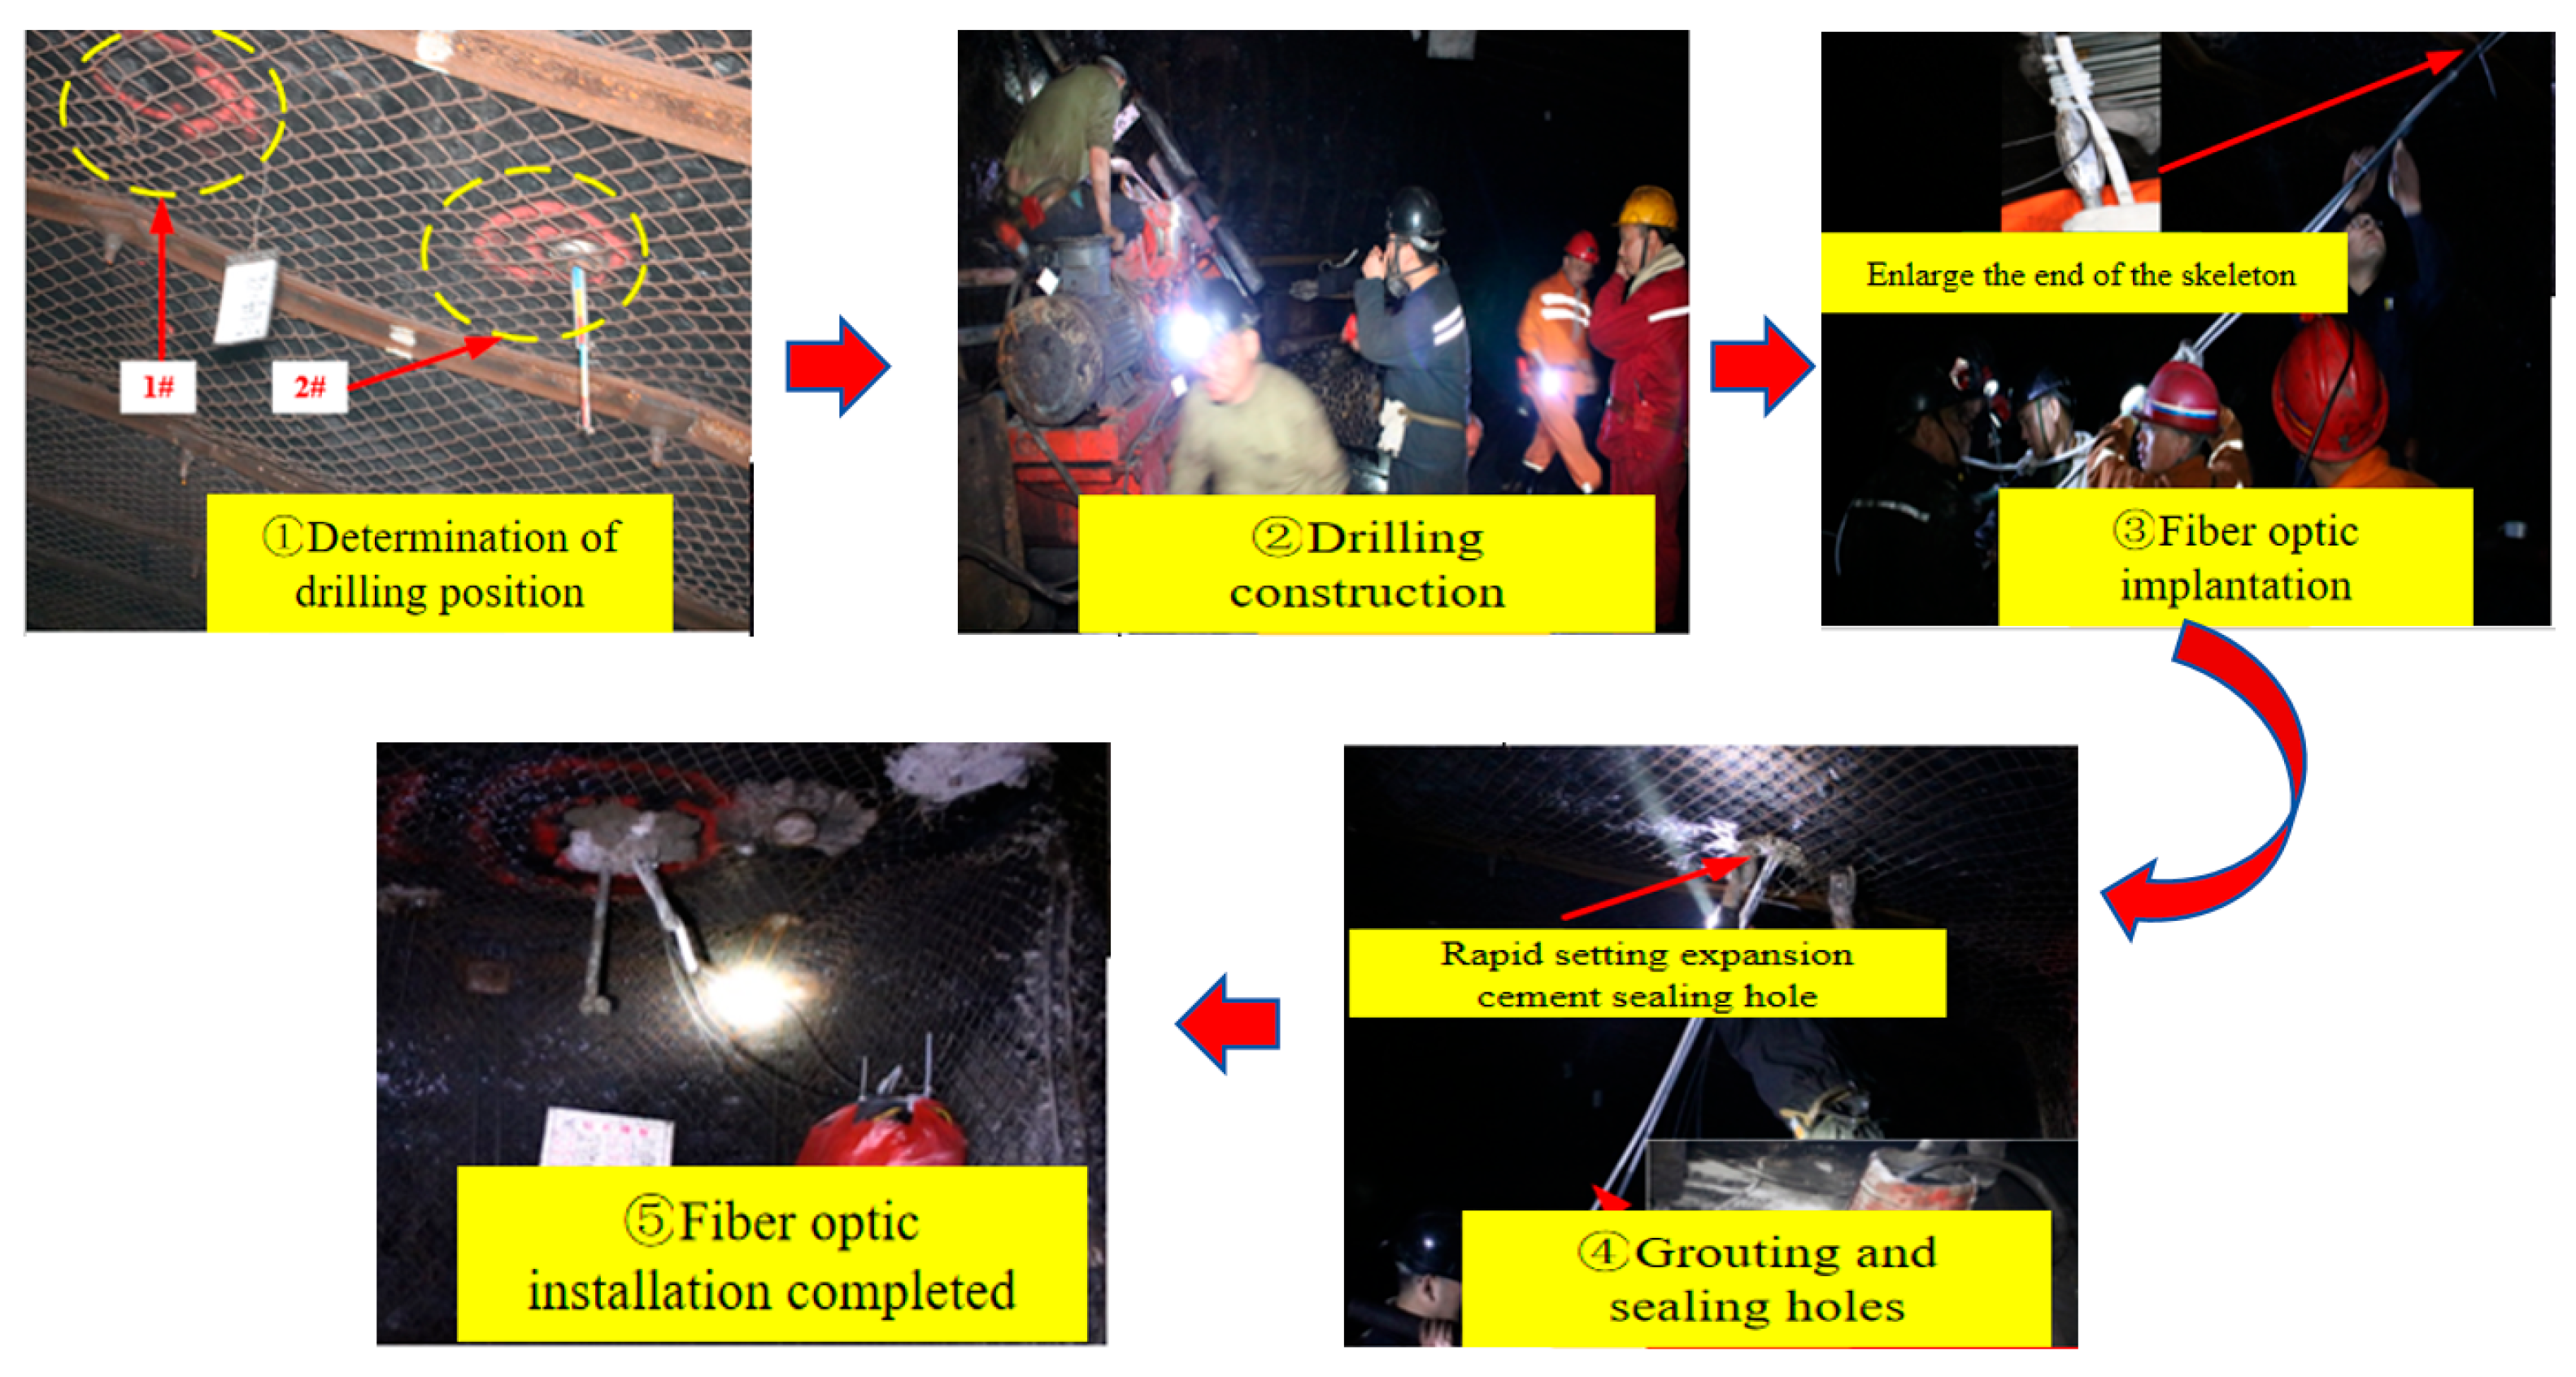
Fixed clamps are mounted at intervals along the rib of the roadway. The fiber optic cable is securely fastened within the clamps to prevent contact damage from personnel or equipment. Borehole-embedded installation is used for internal monitoring within the rock strata. The specific installation steps are as follows:
- (a)
- Carefully feed the sensing cable (often a more robust steel tube cable is selected) to the designated bottom of the hole. The borehole is drilled toward the goaf or rock layer (depth and angle must comply with design requirements).
- (b)
- Seal the borehole (by injecting cement mortar or specialized sealing agent) to ensure effective coupling between the cable and the rock mass, as well as to protect the cable. This step is critical for monitoring performance.
- (c)
- Use specialized clamps or zip ties to firmly secure the cable to non-moving, compression-resistant components such as belt conveyor frames or hydraulic support columns. Attachment to moving parts is strictly prohibited. In areas prone to impact, crushing, or water influx (such as roadway intersections, low-lying areas, and equipment access points), heavy-duty protective conduits must be installed. The installation process is illustrated in Figure 14.
Figure 14. Distributed fiber optic installation process.(1#,2# and 3# represent the number of the borehole.)
4.4. Test Results and Analysis
4.4.1. Data Collection
Initial data are collected immediately after the installation of the distributed optical fiber to establish baseline values for subsequent monitoring. Continuous monitoring begins once the working face enters within 200 m of Borehole 1#, with the sensor initially located outside the mining-induced influence zone. Monitoring continues until fiber damage prevents further data acquisition.
Data from the monitoring boreholes provide vertical control over roof strata failure depth and enable detection of advance abutment pressure and mining-induced damage-sensitive zones in the horizontal direction. When strain occurs along the sensing fiber, the full strain distribution is captured using BOTDR, revealing strain change patterns.
As the working face approaches the monitoring borehole, deformation initially occurs near the borehole bottom, causing optical loss. With further face advance, fiber deformation progressively propagates upward toward the borehole collar.
Given the minimal temperature variation in deep rock masses and the dominance of mechanical strain over thermal effects, the influence of temperature on strain measurements is neglected.
To capture overburden strain evolution during mining, sensing optical fibers are pre-embedded in strata ahead of the working face. For analytical clarity, tensile strain is defined as positive and compressive strain as negative. Using a distributed fiber optic interrogator, strain data along the fiber are collected during panel extraction. Analysis of strain variations provides insights into rock movement characteristics, overburden deformation and failure patterns, and the heights of the caving and water-conducting fracture zones. The data acquisition process is illustrated in Figure 15.
Figure 15.
On-site data collection.
4.4.2. Result Analysis
- (1)
- Strain Distribution and Evolution Characteristics in Borehole 1#
The optical fiber strain generally exhibits compressive strain (with tensile strain defined as positive and compressive strain as negative), indicating that the overlying strata undergo overall compression in the near-vertical direction due to mining-induced influence. However, the strain values of the optical fiber vary at different depths of the borehole. As the working face gradually approaches the monitoring borehole, the compressive strain values of the sensing fiber gradually increase, reflecting the continuous rise in the advance abutment pressure on the overlying strata as the longwall face advances. With further increase in the advance abutment pressure, the overlying strata fail, developing fractures and ruptures. Consequently, the sensing fiber is damaged and eventually fails, exhibiting significant strain variations at the fracture locations.
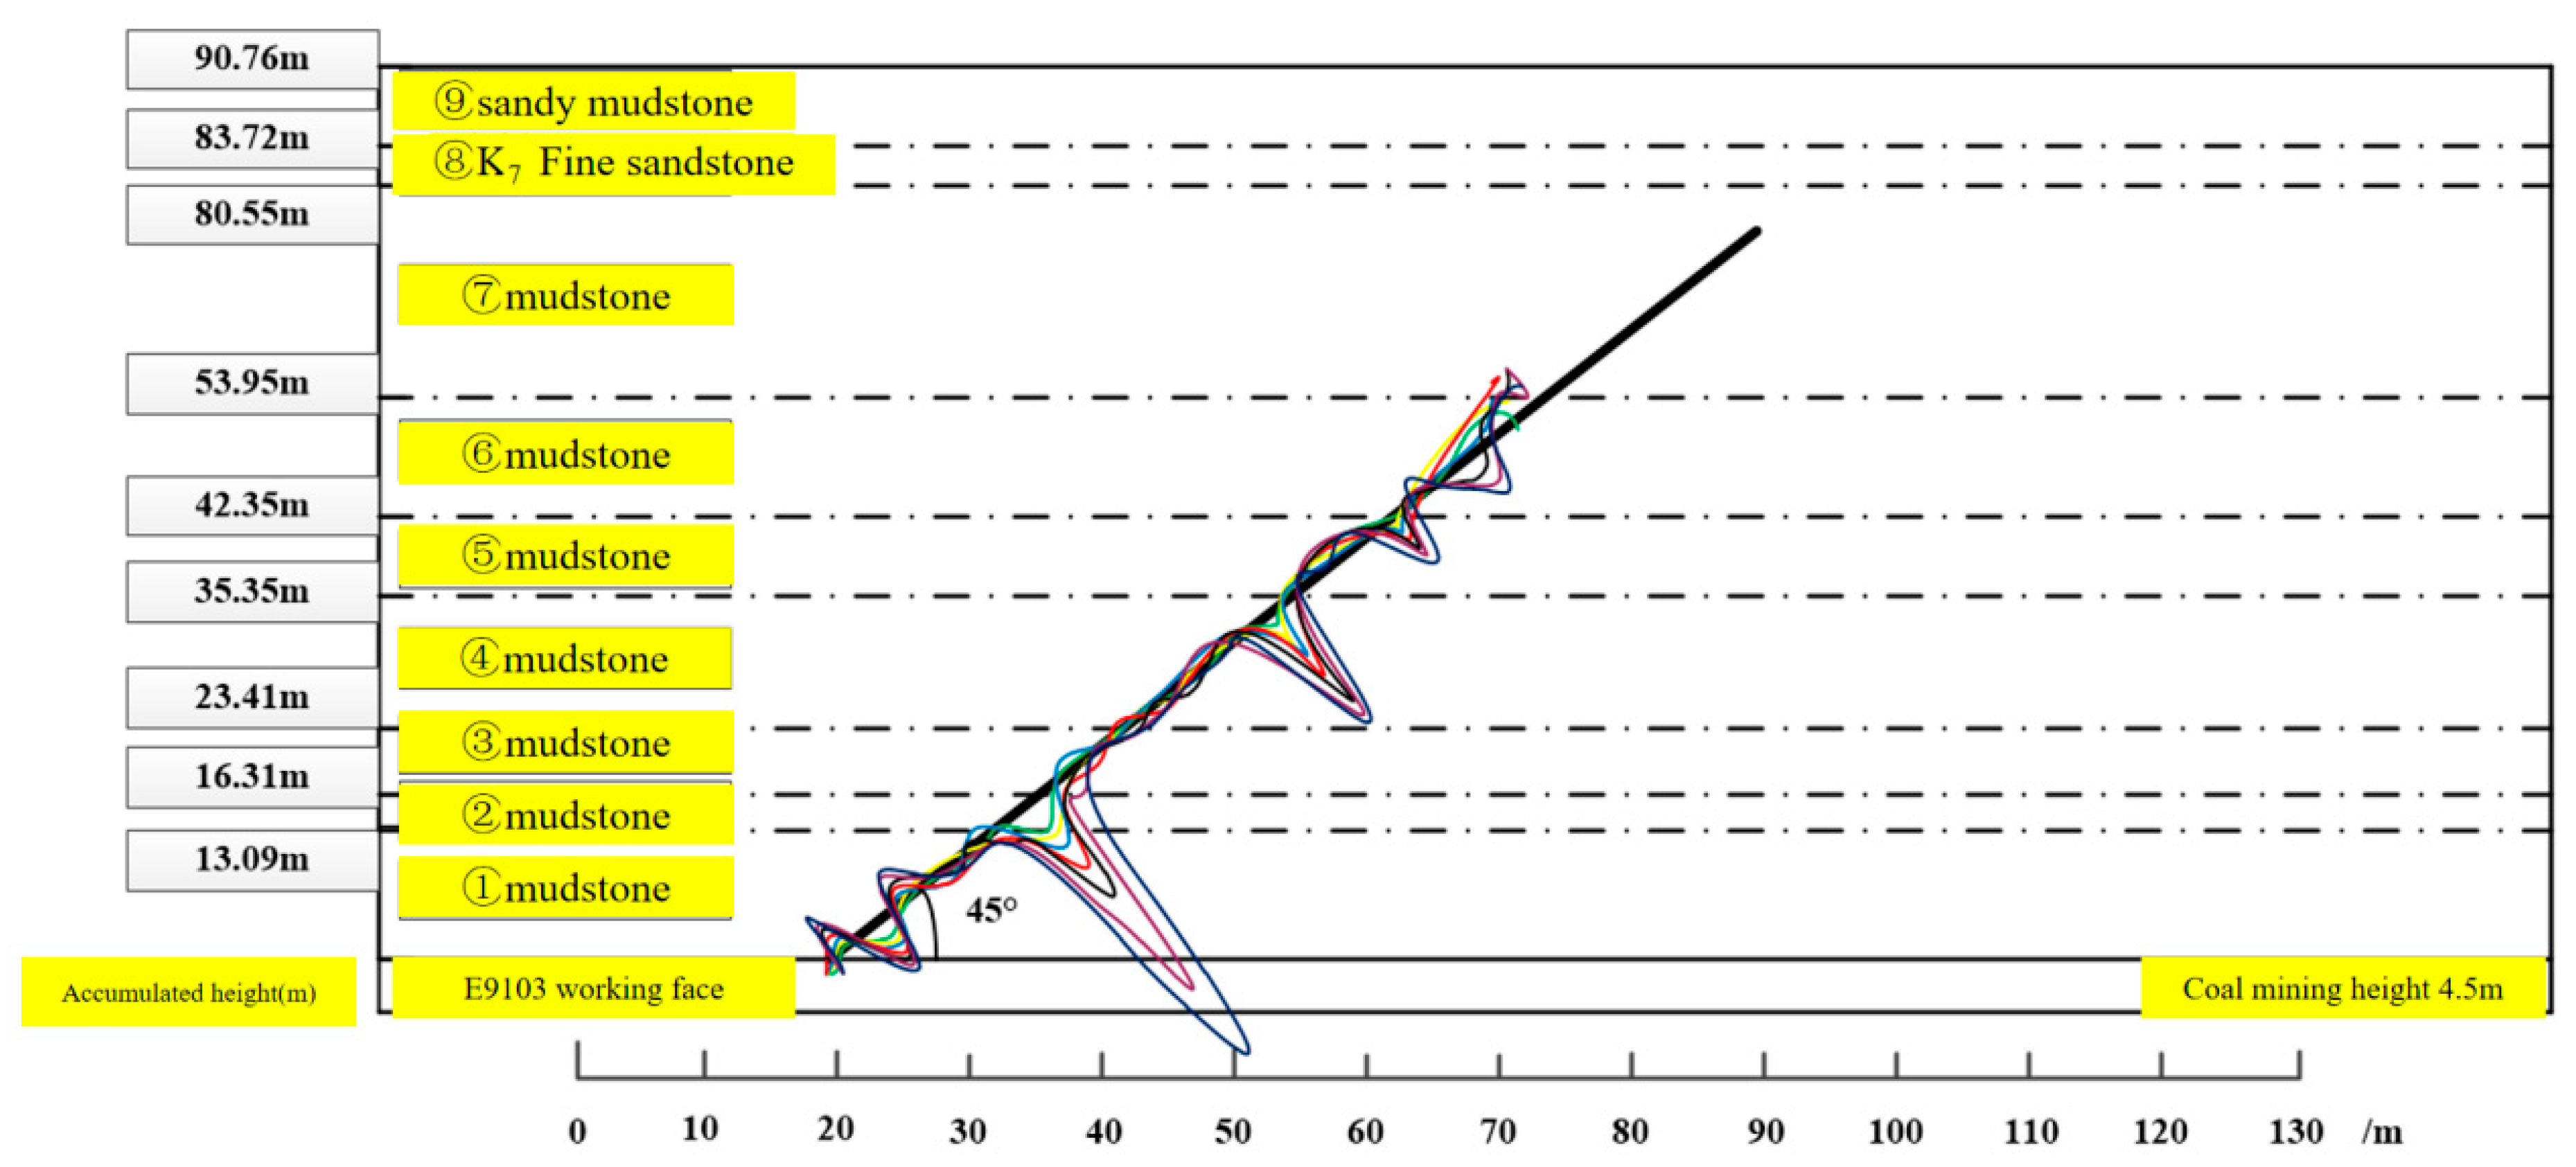
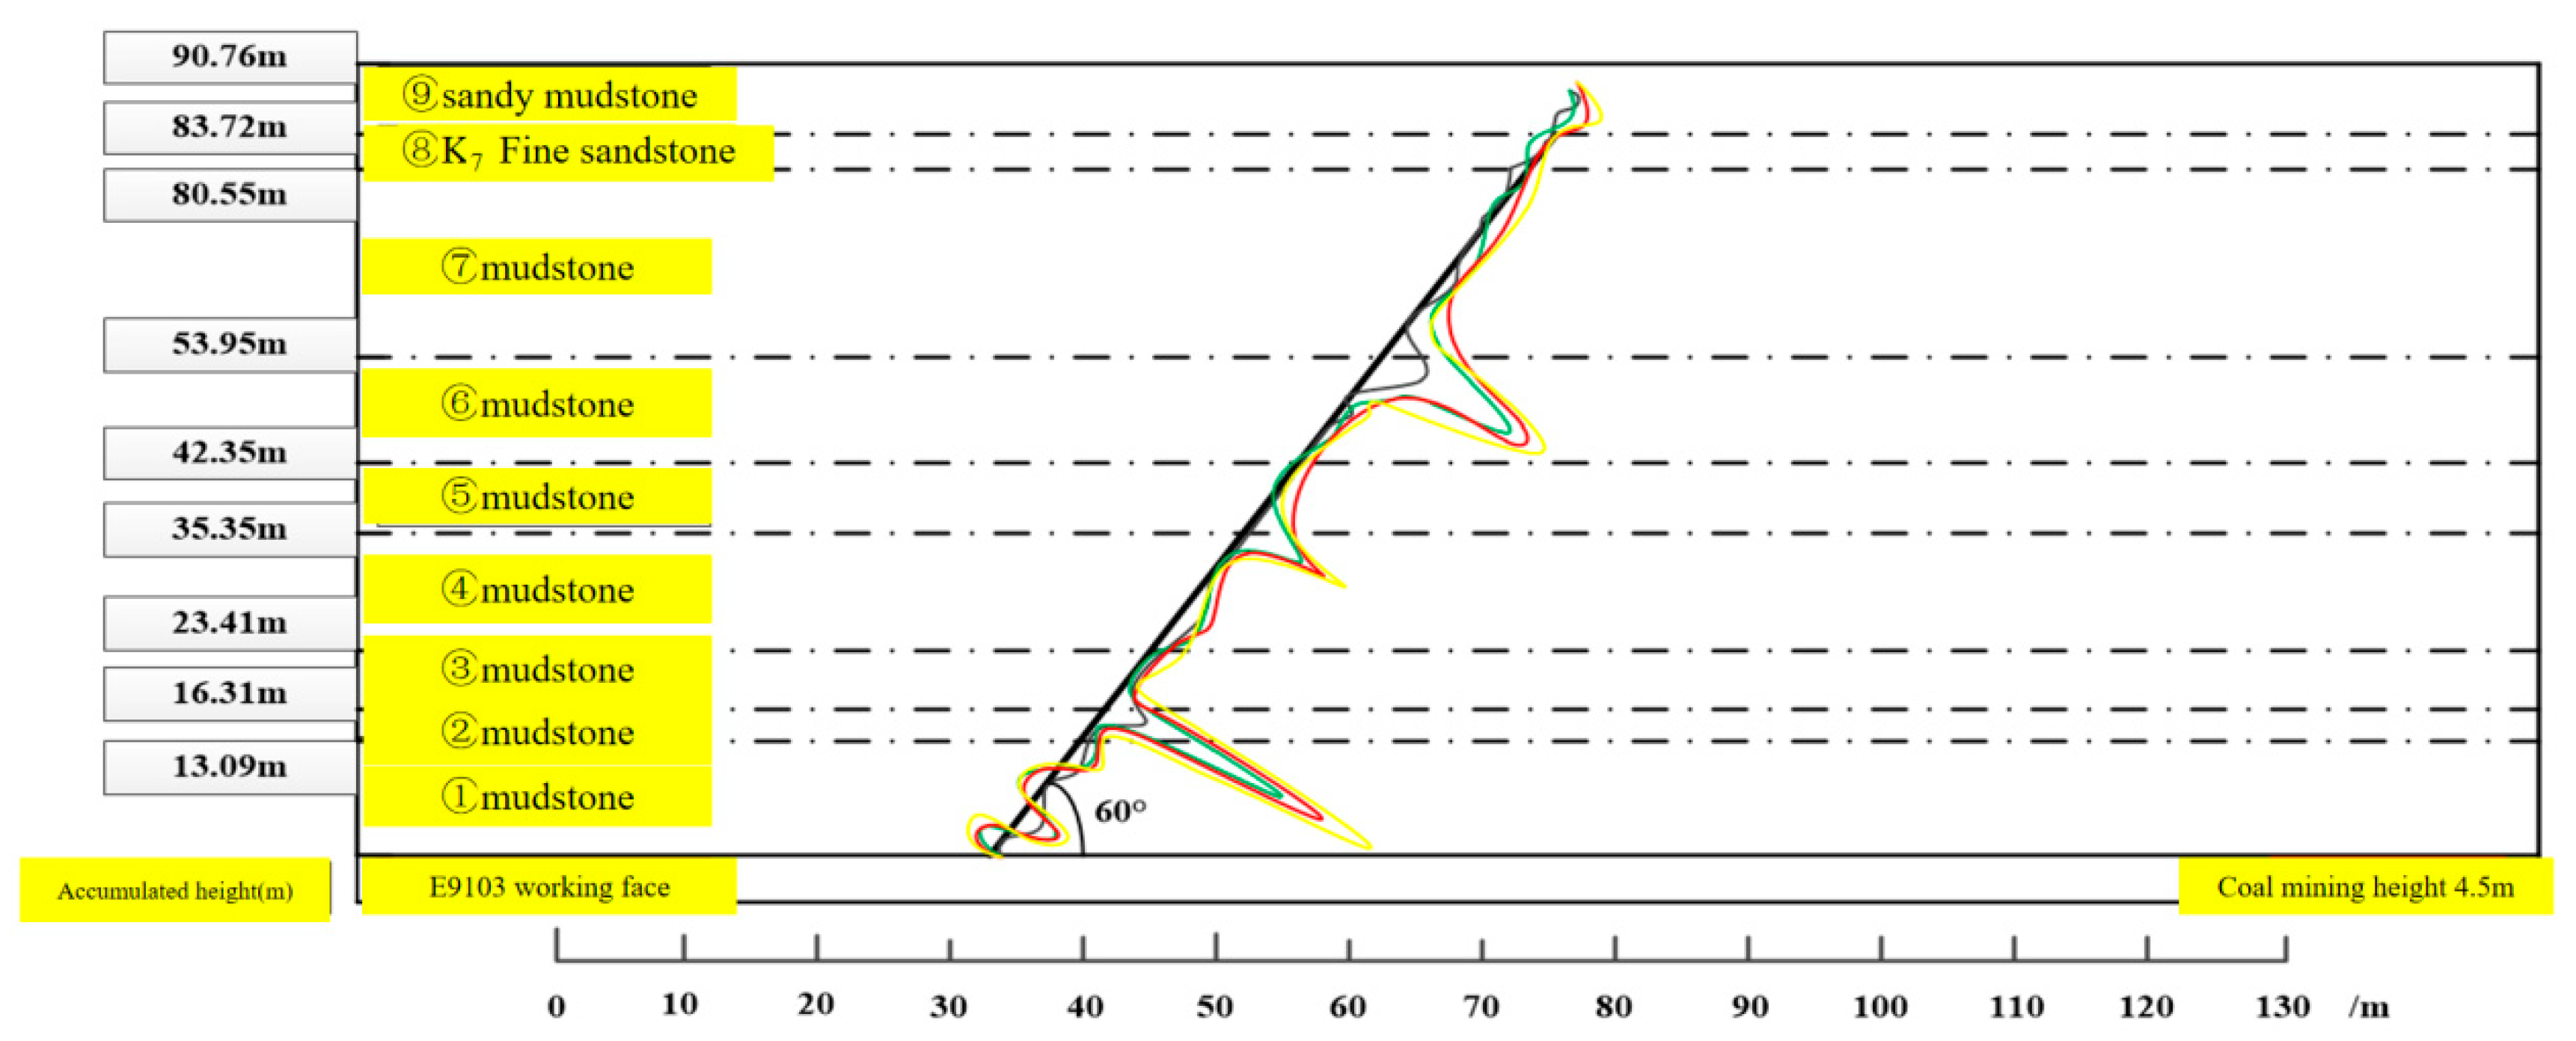
Figure 16 shows the correspondence between the strain distribution of the sensing fiber in Borehole 1# and the stratigraphy. It can be observed that the strain distribution of the optical fiber correlates well with the lithology of the strata: segments of the sensing fiber embedded in rock layers with higher elastic moduli exhibit relatively smaller strain values (some even remain almost undeformed), such as in the ③ limestone, ⑤ fine sandstone, siltstone, and ⑦ K5 sandstone; whereas segments in rock layers with relatively lower elastic moduli show larger strain values. This indicates that under mining-induced stress, the vertical compression of the rock layers is inversely proportional to their elastic modulus. Data measured at different advancing positions of the working face show that mining activities affect the overlying strata, with the magnitude of strain measured by the distributed optical fiber increasing as the measurement station becomes closer to the working face.
Figure 16.
Correlation between optical fiber strain distribution and stratigraphy in Borehole 1#.
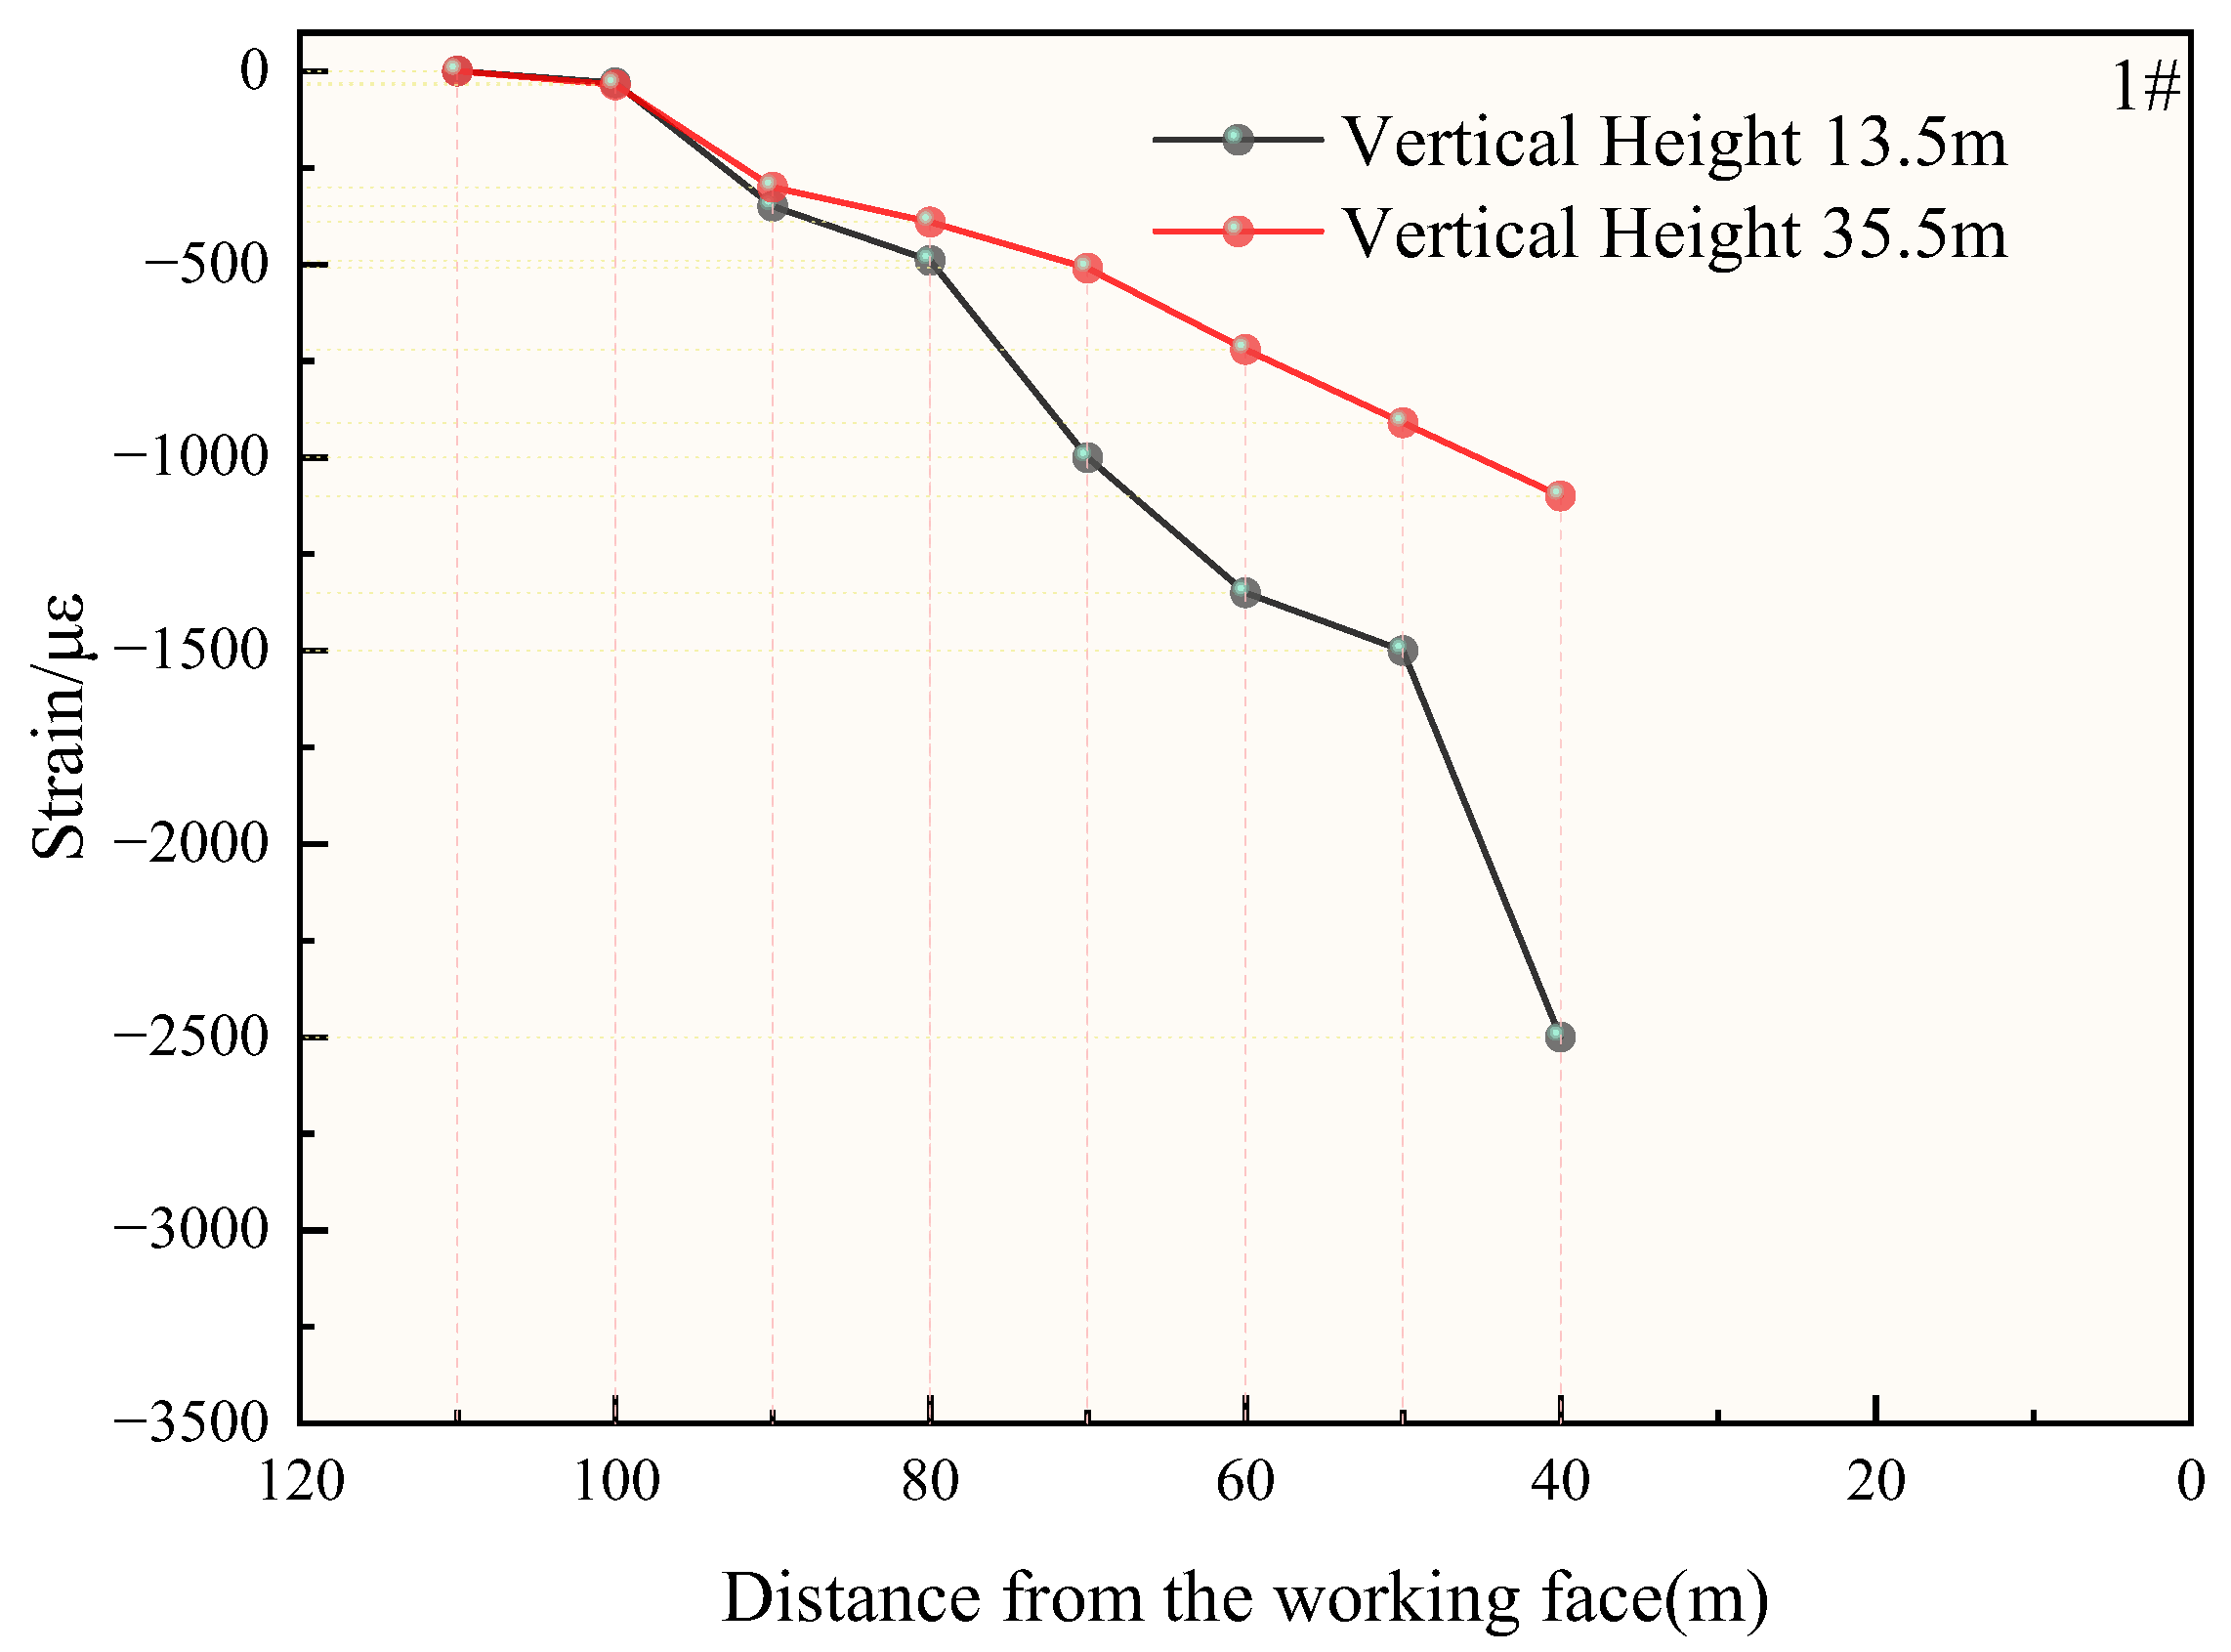
Figure 17 shows the strain variation curves of the sensing fiber at depths of 18.5 m and 50 m in Borehole 1# as the working face advances. The monitoring point at 18.5 m is located near the interface between ① K2 limestone and ② coal/mudstone, with a vertical height of 13.5 m above the roof of the fully mechanized top-coal caving face E9103. As the working face approached, the compressive strain of the optical fiber increased significantly until the fiber was damaged due to rock stratum failure, reaching a maximum compressive strain of approximately −2450 με. At this stage, the horizontal distance from the working face to the monitoring point was about +40 m (positive indicates ahead of the face, negative behind). The monitoring point at 50 m depth is situated at the top of ④ mudstone and the bottom of ⑤ fine sandstone and siltstone, with a vertical height of 35.35 m. As the face advanced toward this point, the compressive strain increased gradually at a relatively lower rate, peaking at around −1000 με. When the working face advanced to within 50–40 m of the monitoring point, a reduction in compressive strain was observed at the shallower point (13.5 m height at the top of ① K2 limestone), likely caused by bedding separation between the K2 limestone and the underlying mudstone. After the fiber passed this point, the compressive strain of the optical fiber increased again.
Figure 17.
Strain variation at different monitoring heights versus face advance. (1# represent the number of the borehole).
- (2)
- Strain Distribution and Evolution Characteristics in Borehole 2#
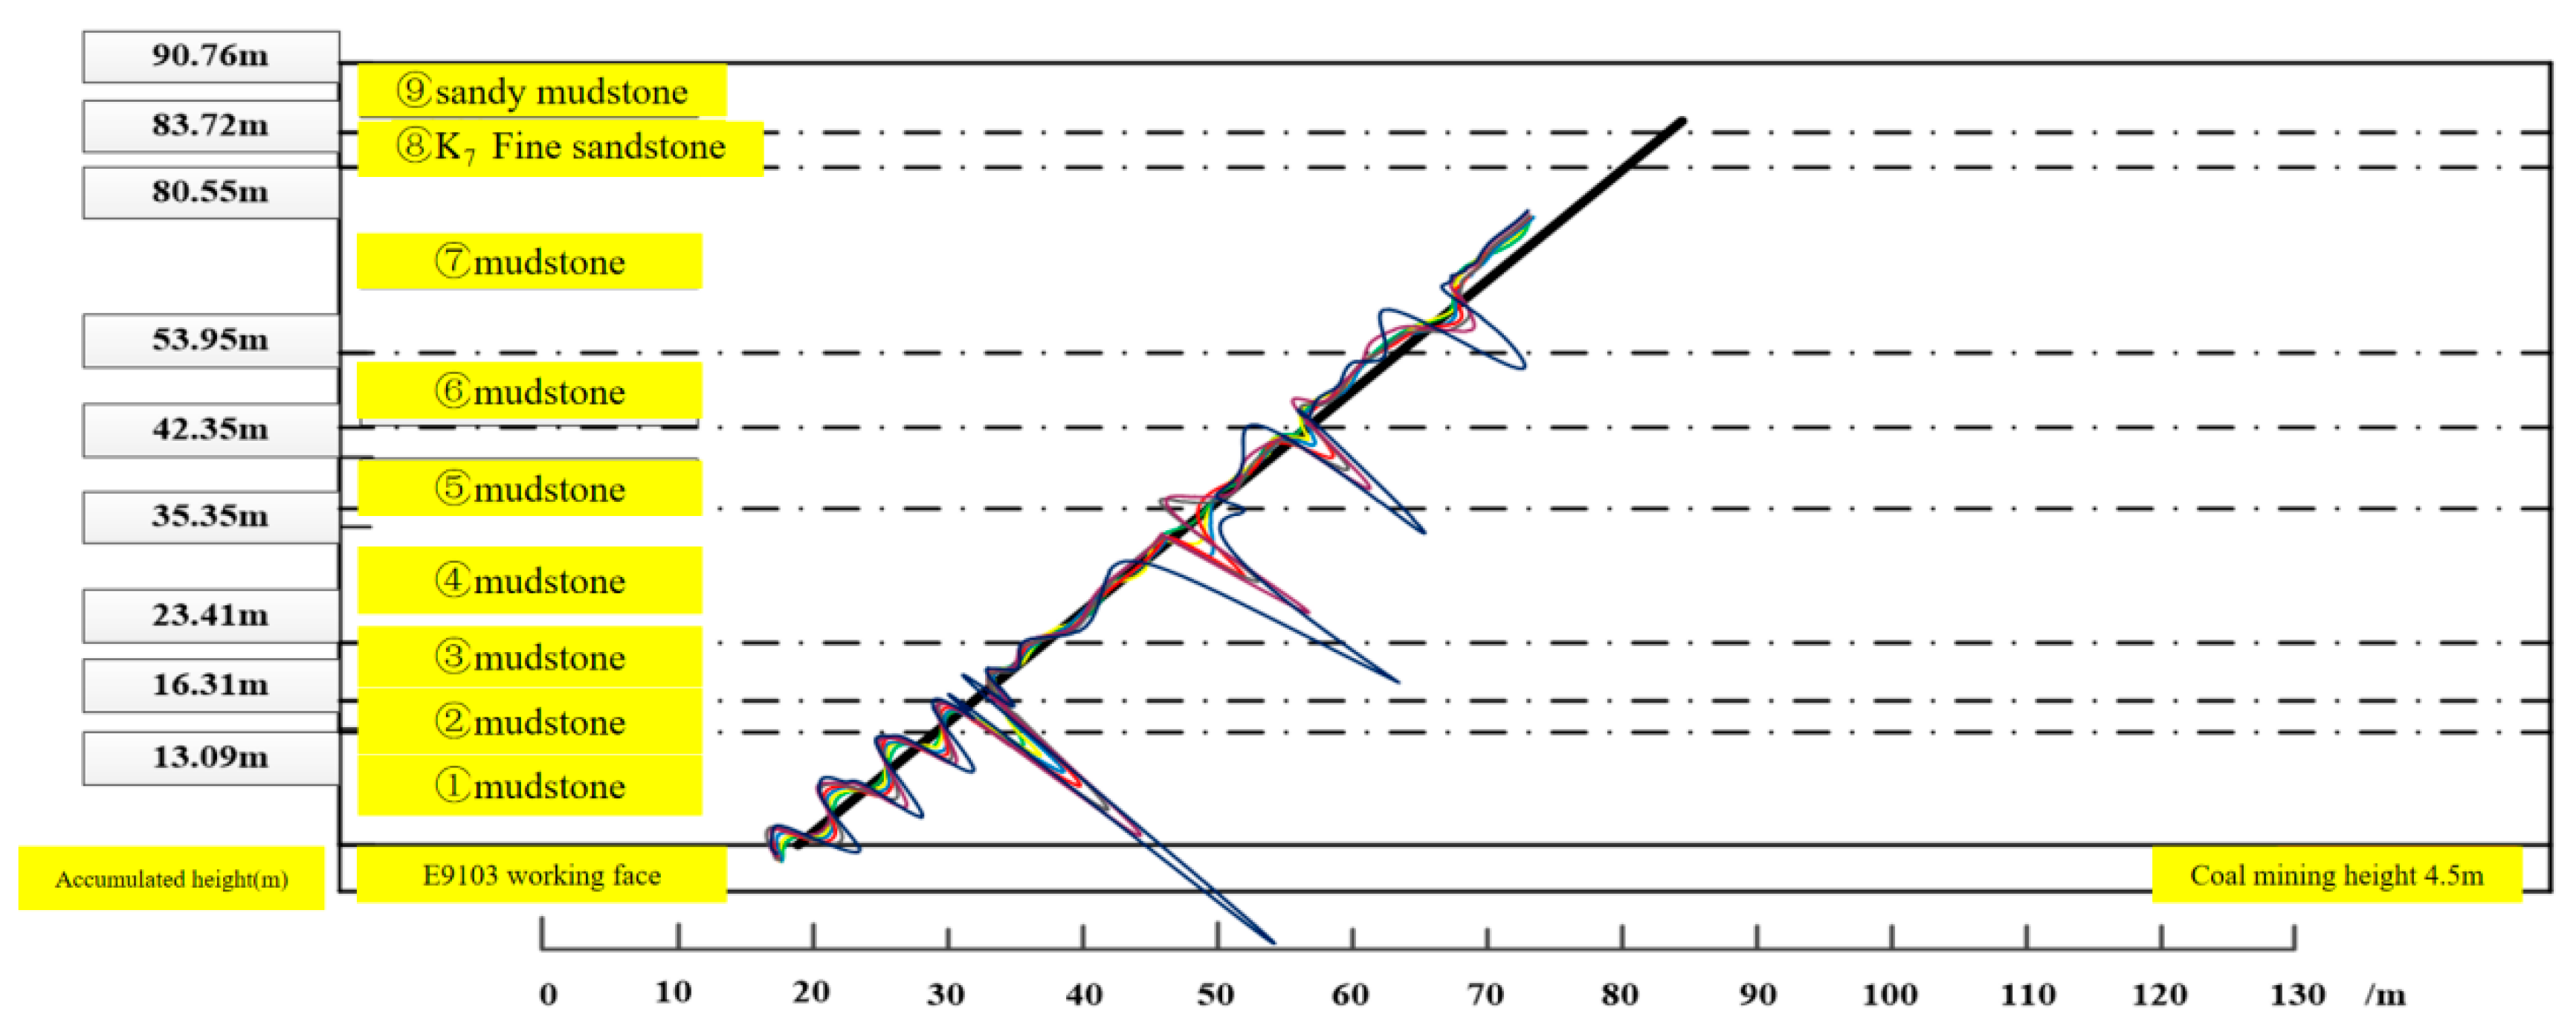
The measured strain values vary at different depths within Borehole 2#, with the maximum compressive strain reaching approximately –2600 με at a depth of about 17.1 m. This indicates that the overburden strata undergo near-vertical compression under mining-induced influence. As the working face approached the borehole, the compressive strain in the sensing fiber gradually increased, reflecting the rising advance abutment pressure on the overlying strata. With further increase in abutment pressure, the overburden eventually fractured, developing cracks and breaks that led to corresponding failures and breakpoints in the optical fiber. Figure 16 shows the correlation between the optical fiber strain distribution and the stratigraphy in Borehole 2#. A clear correspondence can be observed between the strain profile and the lithology, which is consistent with the patterns observed in Borehole 1#. Segments of the fiber embedded in rock layers with higher elastic moduli exhibited relatively smaller strain values, as notably observed near the interfaces between ① K2 limestone and ② mudstone, and between ④ mudstone and ⑤ siltstone. The strain distribution plot visually demonstrates the relationship between strain variation and rock layers, with most significant deformations occurring in zones of lower rock strength. Changes in fiber strain indicate the development of fractures within the corresponding rock strata.
Figure 18 presents the strain variation curves of the sensing fiber at depths of 17.1 m, 46.5 m, and 60 m in Borehole 2# as the working face advanced. The monitoring point at 17.1 m depth is situated near the interface between ① K2 limestone and ② coal/mudstone, with a vertical height of 13.5 m above the roof of the fully mechanized top-coal caving face E9103. As the working face approached, the compressive strain of the optical fiber increased significantly and eventually led to fiber damage due to strata failure, reaching a maximum compressive strain of approximately –2600 με. At this stage, the horizontal distance from the working face to the monitoring point was about 45 m (positive values indicate positions ahead of the face, negative values behind it).
Figure 18.
Correlation between optical fiber strain distribution and stratigraphy in Borehole 2#.
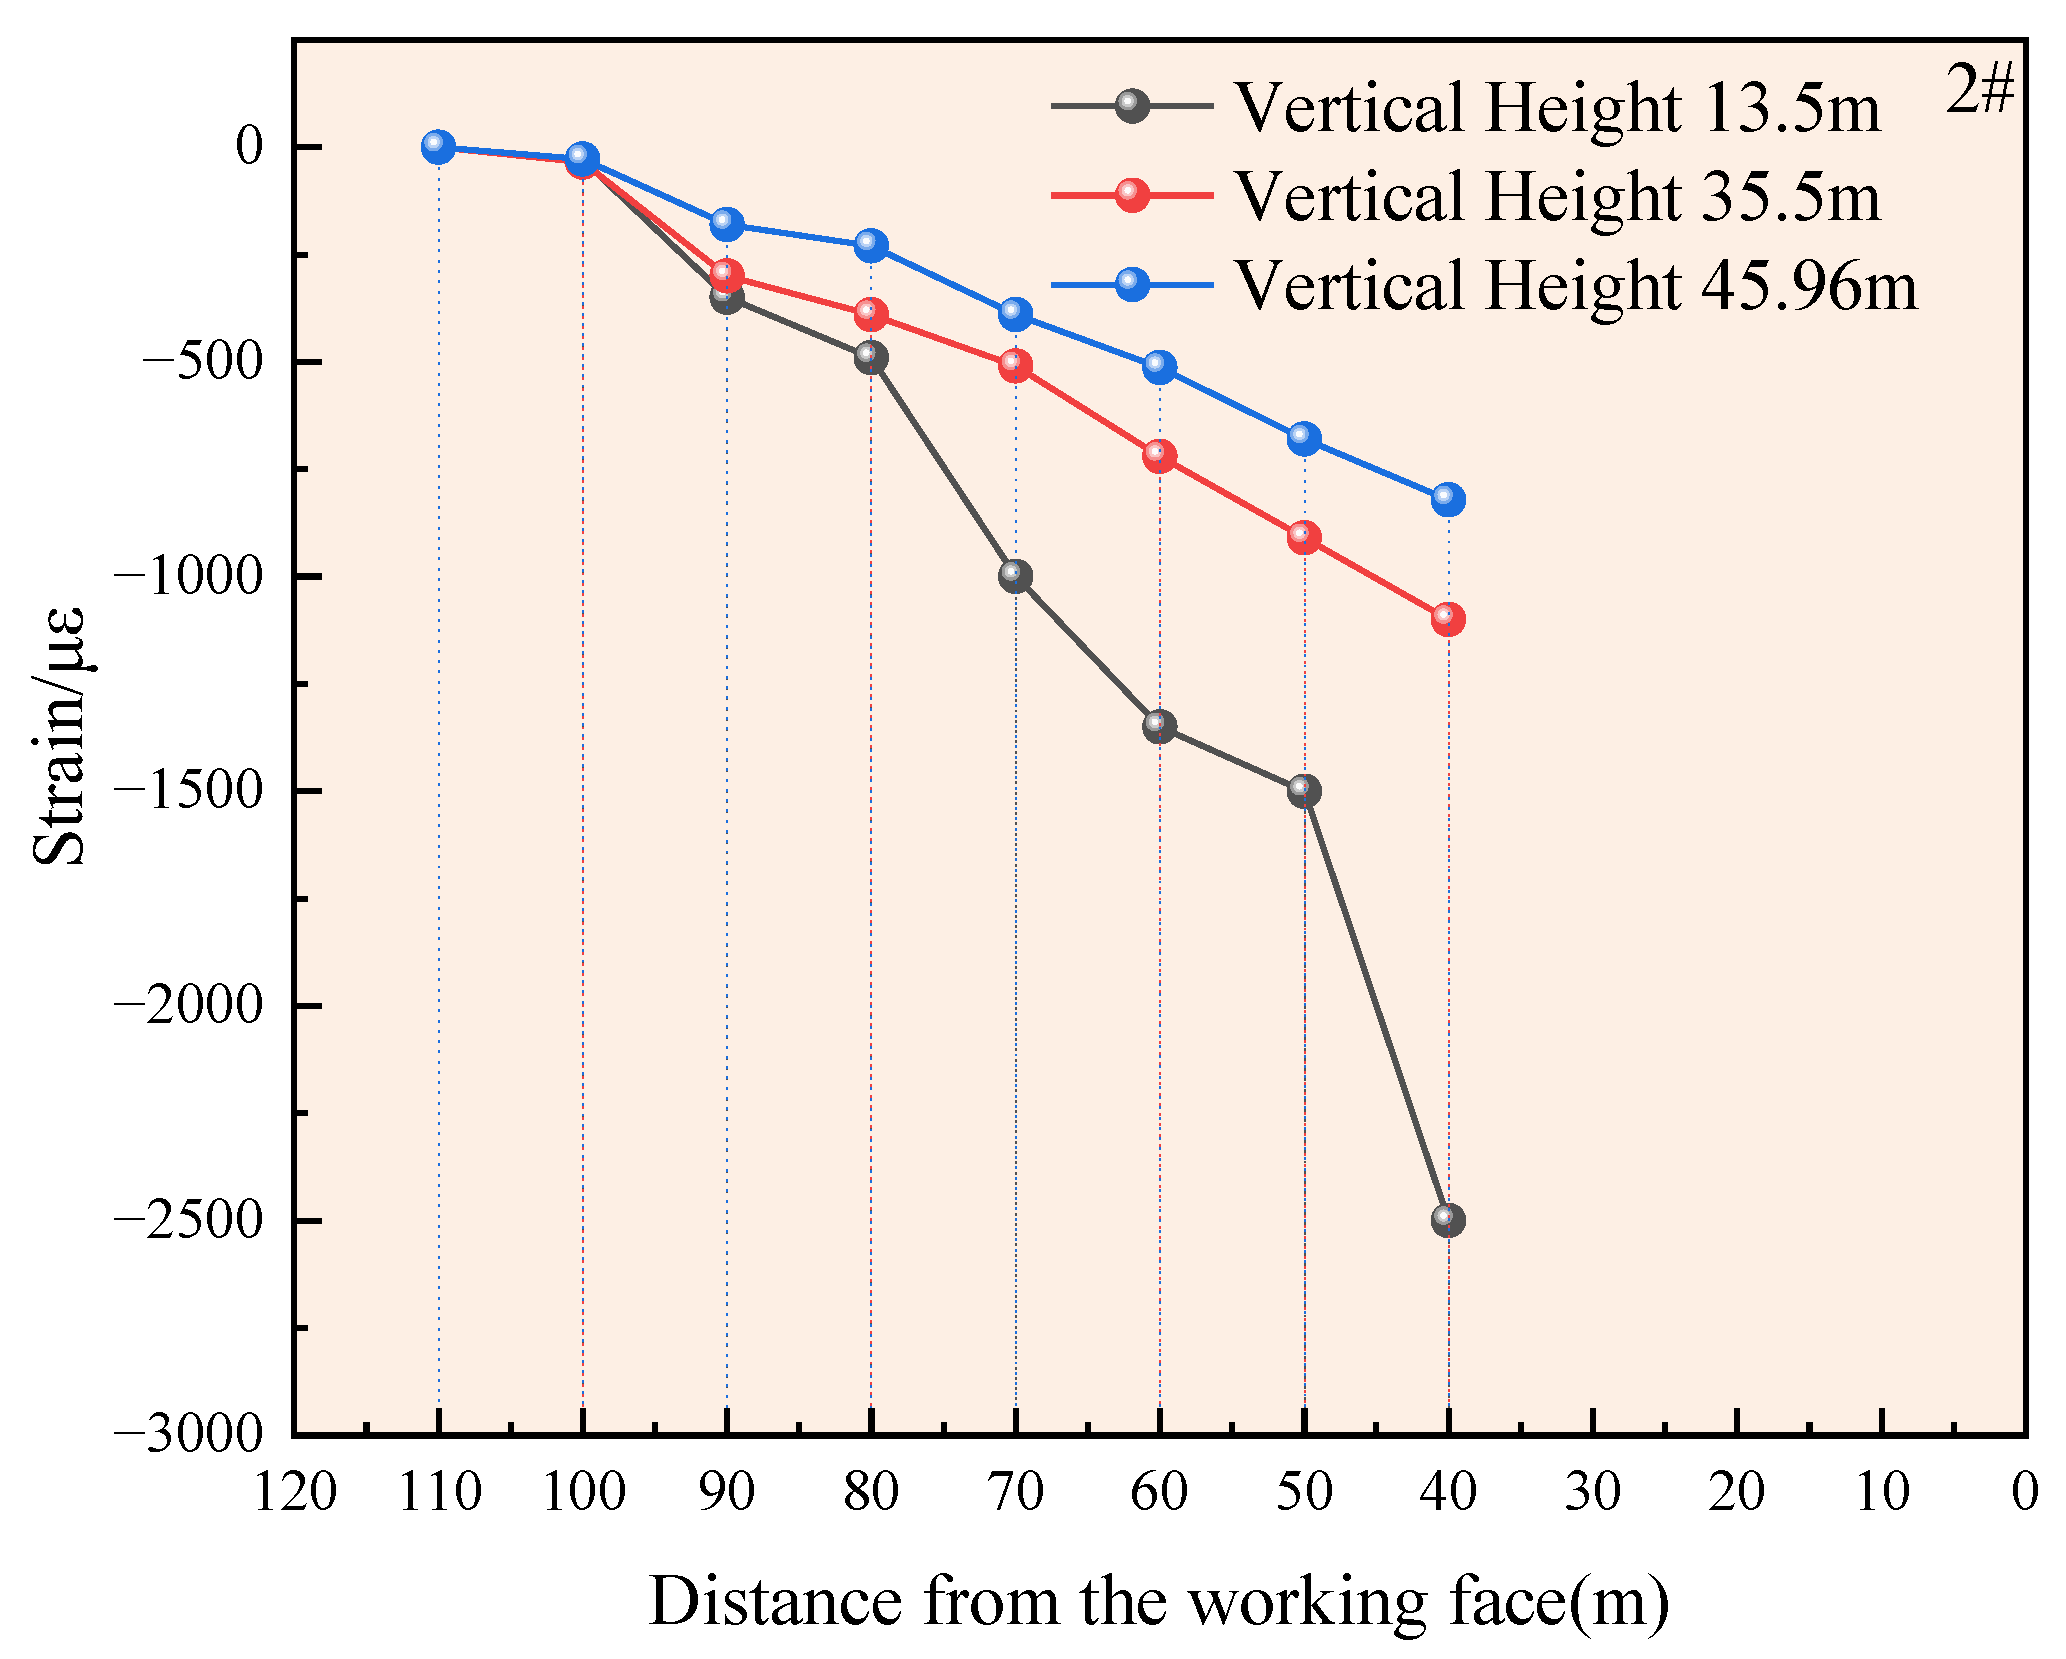
The monitoring points at 46.5 m and 60 m depths are located at the roof of ④ mudstone and the floor of ⑤ fine sandstone/siltstone, and at the floor of ⑤ fine sandstone/siltstone and the floor of ⑥ K5 sandstone, with vertical heights of 35.5 m and 45.96 m, respectively. As the face advanced toward these points, the compressive strain increased gradually but at a relatively lower rate compared to the point at 17.1 m depth, as shown in Figure 19. The maximum compressive strain observed at the point within the interface between ③ K3 limestone and ④ mudstone, at a height of 35.5 m, was about –1050 με. When the working face advanced to between 55 m and 45 m from the monitoring point, a reduction in compressive strain was observed at the shallower point (13.5 m height within the top of ① K2 limestone), likely resulting from bedding separation between the K2 limestone and the underlying mudstone. After the fiber passed this point, the compressive strain of the optical fiber increased again. Ultimately, the sensing fiber experienced a breakage due to the failure of the surrounding rock strata.
Figure 19.
Strain variation curves at different heights in Borehole 2# versus face advance.
- (3)
- Strain Distribution and Evolution Characteristics in Borehole 3#
Figure 20 illustrates the correspondence between the distributed optical fiber strain profile and the stratigraphy in Borehole 3#. As shown, a strong correlation exists between the strain distribution and the lithology: segments embedded in rock layers with higher elastic moduli, such as ③ K3 limestone, ⑤ fine sandstone, siltstone, and ⑦ K5 sandstone, exhibit relatively smaller strain values. In contrast, segments within layers with relatively lower elastic moduli show larger strain values. This indicates that under mining-induced stress, the vertical compression of the rock strata is inversely proportional to their elastic modulus. Data measured at different advancing positions of the working face demonstrate that mining activity affects the overlying strata, with the magnitude of strain measured by the distributed optical fiber increasing as the measurement point becomes closer to the working face. The strain distribution profile visually reflects the relationship between strain variation and lithology. Significant strain changes often occur in zones with lower rock strength, indicating the development of fractures or bedding separations at these locations.
Figure 20.
Correlation between optical fiber strain distribution and stratigraphy in Borehole 3#.
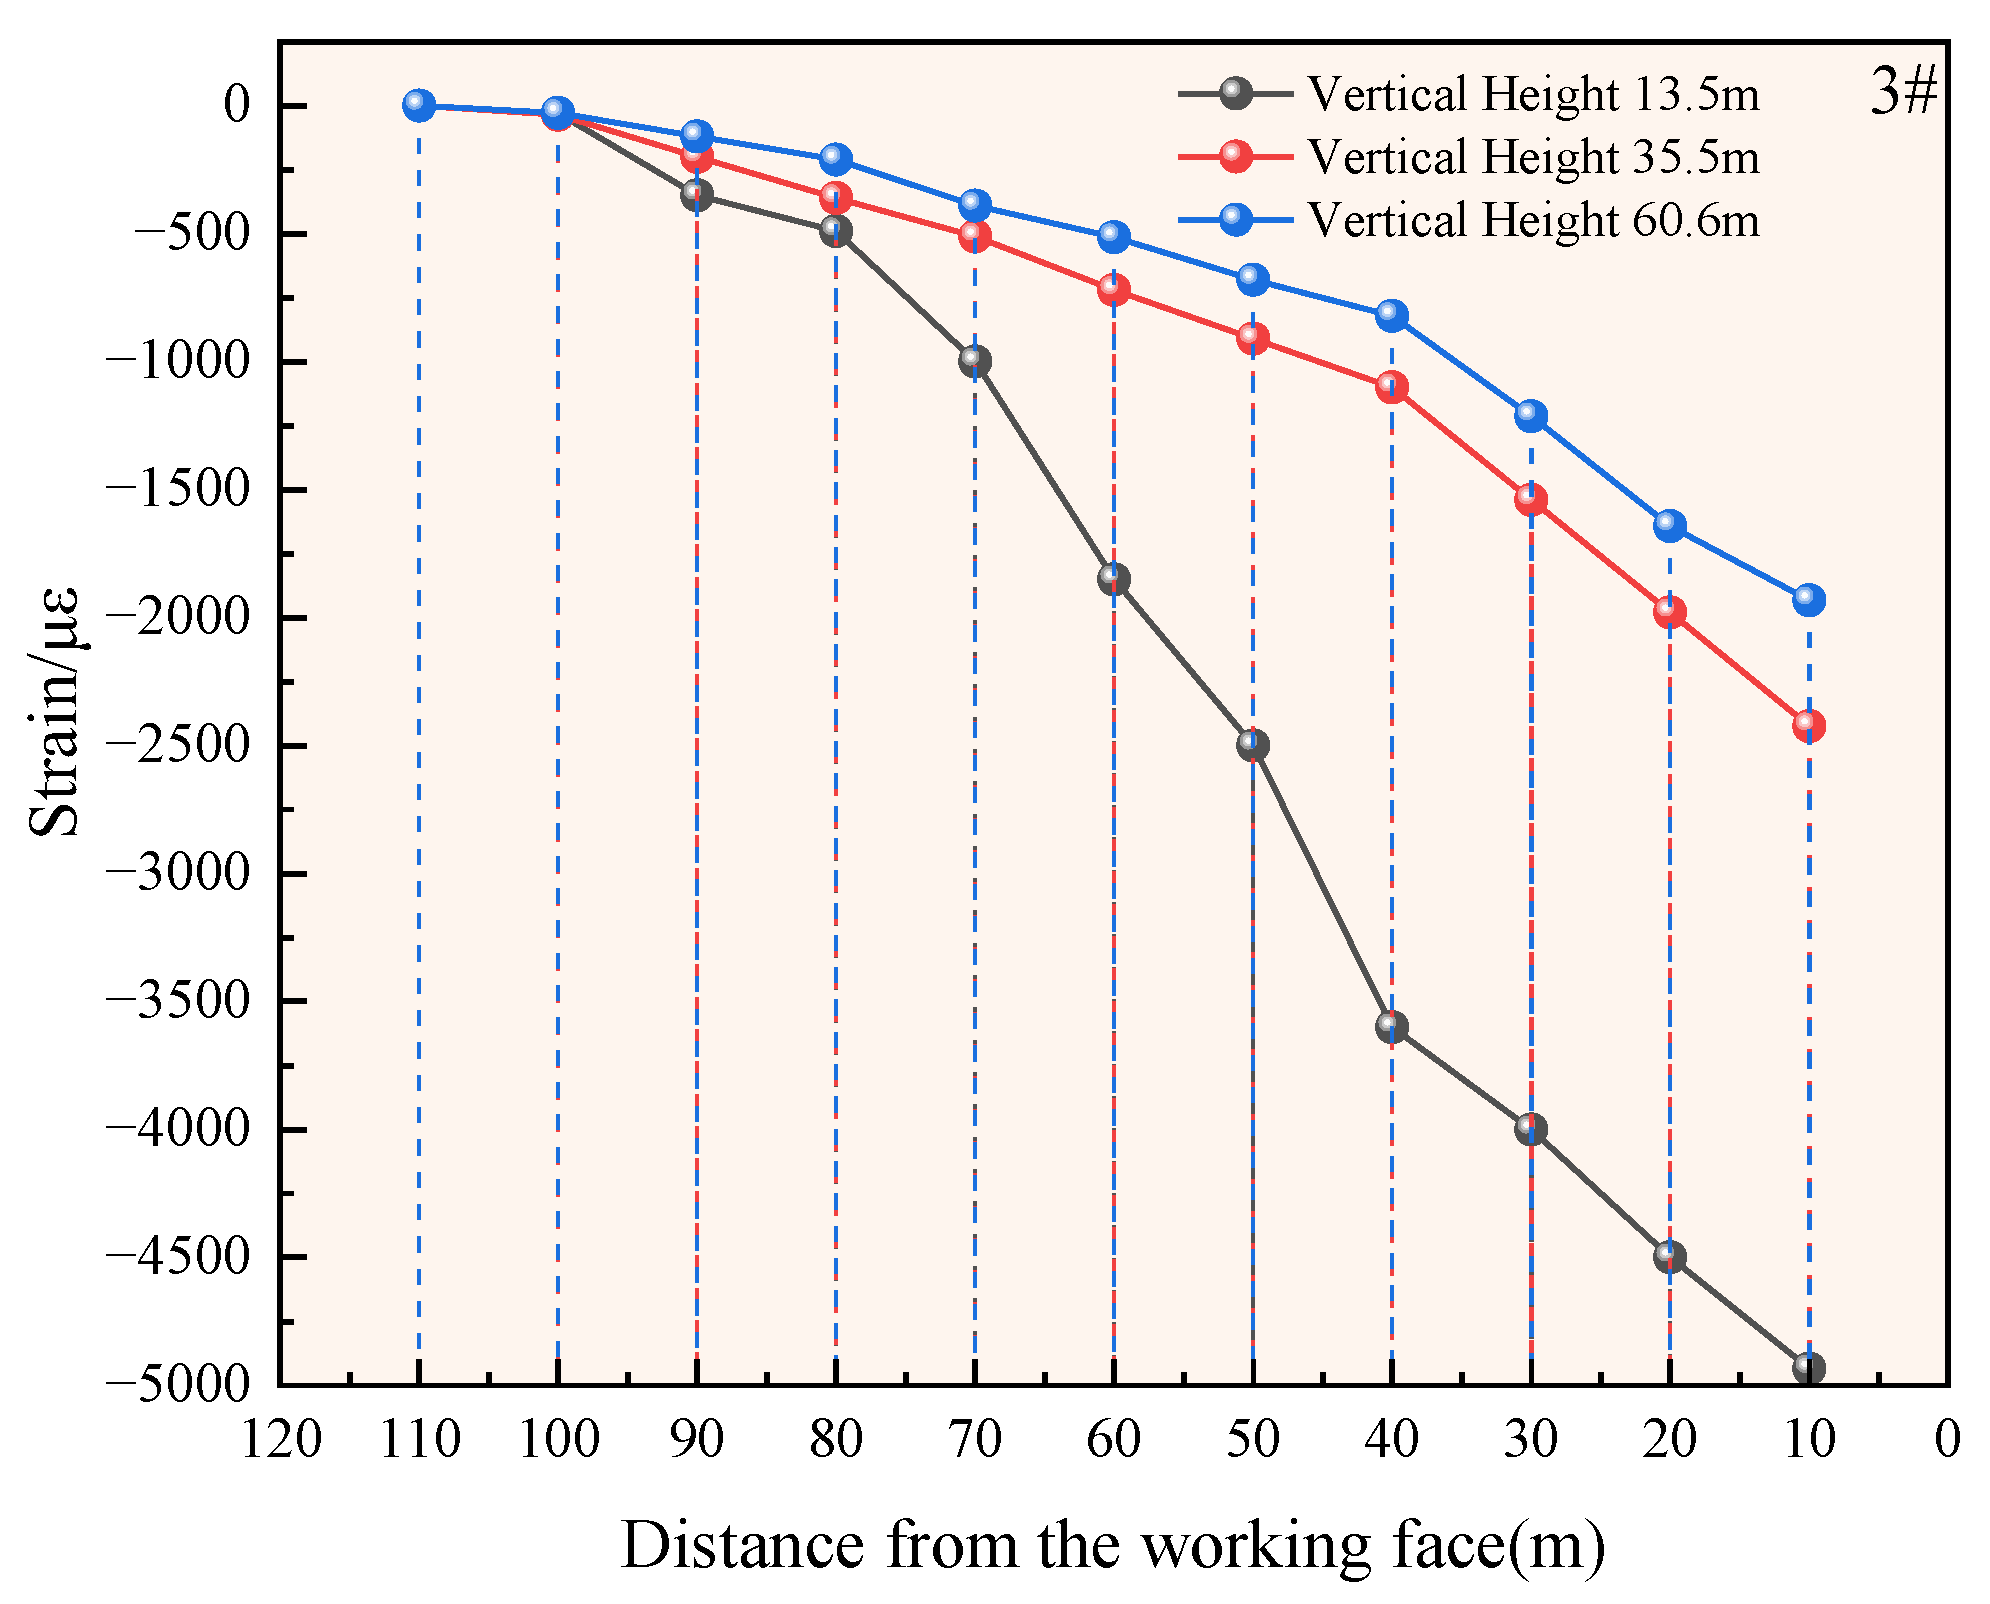
Figure 21 shows the strain variation curves of the sensing fiber at depths of 15.6 m and 70 m in Borehole 3# as the working face advanced. The monitoring point at 15.6 m depth is located at the interface between the top of ① K2 limestone and the underlying ② coal and mudstone, with a vertical height of 13.5 m. As the working face approached, the compressive strain of the optical fiber increased significantly, reaching a maximum value of approximately −1850 με. The monitoring point at 70 m depth is situated within the upper section of ⑥ K5 sandstone, at a vertical height of 60.6 m above the roof of the 9 + 10 coal seam. The maximum compressive strain measured at this point was about −750 με, showing a gradual increase as the face advanced. Ultimately, the sensing fiber was broken due to the failure of the surrounding rock strata.
Figure 21.
Strain variation at different monitoring heights in 3# versus face advance.(3# represent the number of the borehole.)
Analysis of the distributed optical fiber strain data from Boreholes 1#, 2#, and 3# indicates that as the fully mechanized top-coal caving face advanced, the overlying strata progressively experienced deformation, damage, and failure. This resulted in localized tension, compression, and bending of the optical fiber, ultimately leading to fiber breakage. By correlating the characteristics of the strain distribution and the positions of high optical loss with the lithology and thickness of the overlying strata, the development heights of the water-conducting fracture zone and the caved zone were comprehensively determined. Severe signal attenuation and maximum strain were observed in both Borehole 1# and Borehole 2# near the interface between the ① K2 limestone and the underlying ② 8# coal seam and mudstone. The consistent data from these two boreholes suggest that the caved zone developed near the interface between the ① K2 limestone and the ② mudstone, with an estimated height of approximately 13.1 m. Significant strain was also detected in the upper section of the ⑦ K5 sandstone in Borehole 2#, and notable tensile strain was observed below the ⑧ 6# coal seam and mudstone, indicating that the water-conducting fracture zone extended into these strata. Comprehensive analysis places the upper boundary of the fracture zone at the interface between the ⑦ K5 sandstone and the overlying ⑧ 6# coal seam and mudstone, with an estimated development height ranging from 45.96~60.6 m.
5. Analysis of Overburden Evolution Mechanism Based on Fiber Optic Monitoring
At the initial stage of coal mining, the influenced zone had not yet reached the area where the optical fiber was installed. At this point, the developed water-conducting fracture zone and the fiber sensing region were spatially separated. As mining progressed, the caved zone and fractured zone gradually expanded toward the monitoring boreholes. The sensing fiber within the test boreholes began to respond to mining-induced stresses, showing measurable strain. During this period, the fractured zone became tangent to the fiber monitoring area. Subsequently, the fractured zone further extended and started to overlap with the fiber-sensed region, entering an intersecting state. With continued face advance, the caved zone also reached and affected the fiber monitoring area. This analysis reveals the evolutionary mechanism of overburden failure, characterized by bottom–up progression, layered asynchronous movement, and periodic breaking. A schematic diagram illustrating the spatial relationship between the caved zone, fractured zone, and the borehole position is shown in Figure 22.
Figure 22.
Diagram of Overburden Evolution: (I) Separation, (II) Tangency, (III) Intersection.
Distributed optical fiber sensing technology enables precise identification of overburden failure zones and the developmental extent of fractured strata. By correlating fiber strain responses with lithology, roof fracturing is observed to exhibit a layered behavior, with initial failure occurring at interfaces of weaker rock layers. Influenced by mining-induced stresses, damage first emerges in areas closer to the working face and progressively extends upward as mining advances.
The failure process follows a bottom–up progression, initiating in the roof strata directly above the coal seam and propagating upward gradually. Key strata positions can be identified by characteristic “platforms” or abrupt changes in strain curves. Before the rupture of a key stratum, underlying strata undergo larger deformations while overlying strata remain relatively stable. Rupture of a key stratum generates a significant strain pulse, influencing both upper and lower rock layers.
The connectivity of strain peak points reveals bed separation beneath competent layers and illustrates upward fracture propagation, ultimately forming the three distinctive zones: caved, fractured, and bent zones. With sufficient monitoring duration, the periodic breakage intervals of key strata can be derived from regularly spaced peaks in strain curves, indicating cyclic failure patterns.
6. Conclusions
Distributed fiber optic measurement is an efficient method for studying the deformation of overlying strata in mining, and the research results provide key parameters for mine safety production. The method of using distributed fiber optic sensing technology to determine the mining caving zone and water conducting fracture zone of the E9103 fully mechanized mining face in the 9 + 10 coal seam yields the following conclusions:
- (1)
- Through numerical calculations, it is found that the relationship between the height of the overburden caving zone and the advancing distance of the working face is not significant. The height of the caving zone increases slowly with the increase in the advancing distance of the working face, with a development height ranging from 7.2 to 13.13 m. The development height of the water-conducting fracture zone increases rapidly with the increase in the advancing distance of the working face. After the working face is once squared, the development height of the water-conducting fracture zone tends to be stable and remains at a steady value, with a development height ranging from 30.8 to 59.2 m.
- (2)
- We have innovatively integrated distributed optical fibers with rigid metal skeletons to develop a new type of in-hole measurement station. This structure can effectively deliver optical fibers to designated locations, providing key technical support for reliable strain monitoring throughout the entire development process of the “three zones” in mining-induced overburden strata.
- (3)
- Based on the strain distribution characteristics and variation process of the sensing fiber, as well as the highest position of the fiber breakpoint, combined with the lithology and combination of the roof strata, it can be determined that the height of the caving zone is 13.1~16.3 m, and the development height of the water conducting fracture zone is 58–60.6 m.
- (4)
- The use of distributed fiber optic sensing technology can achieve full process monitoring of the deformation and failure process of overlying strata during coal seam mining, providing a new technical means for determining the caving zone and water conducting fracture zone of overlying strata.
Author Contributions
S.H.: Methodology, Formal analysis, Data curation, Writing—original draft preparation. X.M.: Conceptualization, Methodology, Software, Supervision, Funding acquisition. G.Z.: Supervision, Funding acquisition. X.C.: Data curation, Software. X.W.: Writing—review and editing. K.X.: Writing—review and editing. All authors have read and agreed to the published version of the manuscript.
Funding
This research was funded by the National Natural Science Foundation of China (52404068, 52374074), the Excellent Scientific Research and Innovation Team of Universities in Anhui Province (2022AH010053), and the School Research Start-up Fund Project (24KQ114).
Institutional Review Board Statement
Not applicable.
Informed Consent Statement
Not applicable.
Data Availability Statement
Data will be made available on request.
Conflicts of Interest
The authors declare that they have no known competing financial interests or personal relationships that could have appeared to influence the work reported in this paper.
References
- Qian, M.; Shi, P. Mining Pressure and Rock Control; China University of Mining and Technology Press: Xuzhou, China, 2003. [Google Scholar]
- Yavuz, H. An estimation method for cover pressure re-establishment distance and pressure distribution in the goaf of longwall coal mines. Int. J. Rock Mech. Min. Sci. 2004, 41, 193–205. [Google Scholar] [CrossRef]
- Cheng, G.; Ma, T.; Tang, C.; Liu, H.; Wang, S. A zoning model for coal mining—Induced strata movement based on microseismic monitoring. Int. J. Rock Mech. Min. Sci. 2017, 94, 123–138. [Google Scholar] [CrossRef]
- Liu, Y.; Kong, D.; Li, P.; Wen, Z.; Li, F.; Zuo, Y.; Wu, G. The migration and evolution law of overlying strata and the instability and failure characteristics of end face roof under the condition of ascending mining in close distance coal seam: Case study. Eng. Fail. Anal. 2024, 165, 108809. [Google Scholar] [CrossRef]
- Jiang, L.; Wu, Q.; Wu, Q.; Wang, P.; Xue, Y.; Kong, P.; Gong, B. Fracture failure analysis of hard and thick key layer and its dynamic response characteristics. Eng. Fail. Anal. 2019, 98, 118–130. [Google Scholar] [CrossRef]
- Jing, Q.; Wang, P.; Wu, Q.; Zhang, P. Evolution laws and prediction of separated stratum space under overlying high-position magmatic rocks. Chin. J. Geotech. Eng. 2015, 37, 1769–1779. [Google Scholar]
- Mirghaderi, S.R.; Taheri, G.; Ebrahimi, S. Improving a Conventional Connection of Beam-to-Weak Axis of H-shaped Column to Modify Load Path in Panel Zone. J. Earthq. Tsunami 2024, 18, 2450001. [Google Scholar] [CrossRef]
- Gao, B.; Wang, X.; Zhu, M.; Zhou, J. The dynamic development characteristics of the “two zones” of overlying rock in the fully mechanized top coal caving face with high gas content and thick coal seam composite roof. J. Rock Mech. Eng. 2012, 31 (Suppl. S1), 3444–3451. [Google Scholar]
- Li, Y.; Yang, J.; Gao, X. Fault slip amplification mechanisms in deep mining due to heterogeneous geological layers. Eng. Fail. Anal. 2025, 169, 109155. [Google Scholar] [CrossRef]
- Lu, D.; Wu, W. Controlling Borehole Geometry as a Feasible Strategy for Optimization of Heat Extraction in Geothermal Systems. Rock Mech. Rock Eng. 2024, 57, 7461–7472. [Google Scholar] [CrossRef]
- Ganguwar, S.; Nistane, V.M. Numerical Study on the Determination of Crack Initiation Angle, Stress Field and Stress Triaxiality at Crack Tip in a Cracked Beam of Functionally Graded Material. J. Fail. Anal. Prev. 2024, 24, 2847–2862. [Google Scholar] [CrossRef]
- Kim, S.D.; Kim, S.S.; Ju, Y.K. Strength evaluation of beam–column connection in the weak axis of H-shaped column. Eng. Struct. 2008, 30, 1699–1710. [Google Scholar] [CrossRef]
- Zhu, P.; Wang, J.; Yan, S.; Wang, J. Analysis of dynamic response and impact resistance of corrugated plate-reinforced concrete under simulated rockfall. Eng. Fail. Anal. 2025, 167, 108922. [Google Scholar] [CrossRef]
- Xu, X.; He, F.; Li, X.; He, W. Research on mechanism and control of asymmetric deformation of gob side coal roadway with fully mechanized caving mining. Eng. Fail. Anal. 2021, 120, 105097. [Google Scholar] [CrossRef]
- Li, Z.X.; Yin, D.W.; Liu, H.M.; Tan, Y.; Li, X.-L. Mechanical properties of cemented coal gangue–flyash backfill under coupled effects of water pressure and chloride salt erosion. J. Cent. South Univ. 2024, 31, 1574–1591. [Google Scholar] [CrossRef]
- Wang, E.; Yin, S.; Cheng, Z.; Xie, S.; Chen, L.; Kang, Q.; Duan, Y. Failure mechanism analysis of ultra-large-section soft-rock roadway in kilometer deep coal mine and its collaborative control of "grouting-anchoring-pouring. Eng. Fail. Anal. 2025, 170, 109338. [Google Scholar] [CrossRef]
- Huang, X.; Zhang, C.; Ren, Z. Parameter determination and effect evaluation of gob-side entry retaining by directional roof cutting and pressure releasing. Eng. Fail. Anal. 2024, 156, 107847. [Google Scholar] [CrossRef]
- Feng, W.; Li, M.; Zhang, J.; Wang, H.; Liu, S.; Wang, W. Load-bearing deformation and strength evolution of a filling body prepared by compacting a gangue waste–slurry mixture. J. Clean. Prod. 2025, 493, 144990. [Google Scholar] [CrossRef]
- Sun, Q.; Zhang, J.X.; Yin, W.; Zhou, N.; Liu, Y. Study of stability of surrounding rock and characteristic of overburden strata movement with longwall roadway backfill coal mining. J. China Coal Soc. 2017, 42, 404–412. [Google Scholar] [CrossRef]
- Zhang, C.; Bai, Q.; Han, P. A review of water rock interaction in underground coal mining: Problems and analysis. Bull. Eng. Geol. Environ. 2023, 82, 157. [Google Scholar] [CrossRef]
- Liu, A.; Liu, S. A fully-coupled water-vapor flow and rock deformation/damage model for shale and coal: Its application for mine stability evaluation. Int. J. Rock Mech. Min. Sci. 2021, 146, 104880. [Google Scholar] [CrossRef]
- Zhang, J.; Sun, Q.; Zhang, Q. The Study of Roadway Backfill Coal Mining Technology with Water-Preserved in Western Eco-Environment Frangible Area. In Proceedings of the 12th International Conference on Mining with Backfill 2017: 12th International Conference on Mining with Backfill, Denver, CO, USA, 19–22 February 2017. [Google Scholar]
- Fedorko, M.T.M. Influence of selected characteristics on failures of the conveyor belt cover layer material. Eng. Fail. Anal. 2018, 94, 145–156. [Google Scholar] [CrossRef]
- Zhu, Y.; Li, C.; Jiang, X.; Zhao, Y.; Tulujun, G.; Zhang, B. Differential salt-related structural deformation in the Eastern segment of the Qiulitage fold and thrust belt, Kuqa Foreland Basin: Evidences from seismic interpretation and numerical simulation analysis. J. Struct. Geol. 2025, 194, 105372. [Google Scholar] [CrossRef]
- Barrias, A.; Casas, J.R.; Villalba, S. A Review of Distributed Optical Fiber Sensors for Civil Engineering Applications. Sensors 2016, 16, 748. [Google Scholar] [CrossRef] [PubMed]
- Arslan Kelam, A.; Akgün, H.; Kokar, M.K. Application of an optical fiber-based system for mass movement monitoring. Environ. Earth Sci. 2022, 81, 170. [Google Scholar] [CrossRef]
- Chen, E.; Li, Y.; Zhang, S. Quantitative monitoring of localized pitting corrosion in steel bars through a combined use of distributed optical fiber sensors and finite element analyses. Constr. Build. Mater. 2024, 438, 136970. [Google Scholar] [CrossRef]
- Jiang, L. The Study of Analysis Method for Engineering Geological Structure Model and Basic Information of Geological Condition. Sci. Technol. Innov. Her. 2016, 13, 174–175. [Google Scholar]
- Zhang, T.; Gan, Q.; Zhao, Y.; Zhu, G.; Nie, X.; Yang, K.; Li, J. Investigations into Mining-Induced Stress–Fracture–Seepage Field Coupling Effect Considering the Response of Key Stratum and Composite Aquifer. Rock Mech. Rock Eng. 2019, 52, 4017–4031. [Google Scholar] [CrossRef]
- Han, P.; Wang, K.; Pang, J.; Ji, X.; Zhang, C. Response properties of geometries of coal penetrating fracture on seepage behavior. Int. J. Min. Sci. Technol. 2025, 35, 191–211. [Google Scholar] [CrossRef]
- Yang, J.; Hu, B.; Wang, Z. Study on distribution characteristics of collapse zone, fissure zone and curved subsidence zone and layered settlement of overburden on 8.8 m super–large mining height coal mining face. J. Coal Sci. Technol. 2020, 48, 42–48. [Google Scholar] [CrossRef]
- Wang, Y.; Guo, W.; Bai, E.; Zhang, Z.; Kang, Y.; Chai, H.; Chen, J. Characteristics and mechanism of overlying strata movement due to high-intensity mining. J. Coal Ind. 2018, 43 (Suppl. S1), 28–35. [Google Scholar] [CrossRef]
- Cheng, X.; Qiao, W.; Li, L.; Jiang, C.; Ni, L. Coupling model of stress-seepage and water inflow prediction in coal seam overburden mining fractures. J. China Coal Soc. 2020, 45, 2890–2900. [Google Scholar]
- GB 50218-2014; Standard for Engineering Classification of Rock Masses. National Standard of the People’s Republic of China; China Planning Press: Beijing, China, 2014.
- Barton, N.; Lien, R.; Lunde, J. Engineering classification of rock masses for the design of tunnel support. Rock Mech. Rock Eng. 1974, 6, 279–315. [Google Scholar] [CrossRef]
- Bieniawski, Z.T. Engineering Rock Mass Classifications; John Wiley & Sons: Hoboken, NJ, USA, 1989. [Google Scholar]
- Jaeger, J.C.; Cook, N. Fundamentals of Rock Mechanics, 2nd ed.; Publication of Chapman & Hall: London, UK, 1976. [Google Scholar]
- Saroglou, C. The Challenge of Rock Mass Classification of Anisotropic Rockmasses. Rock Mech. Rock Eng. 2025, 58, 11195–11215. [Google Scholar] [CrossRef]
- Hoek, E.; Brown, E.T.; Corkum, B. Hoek-Brown failure criterion—2002 edition. In Proceedings of the North American Rock Mechanics Society Annual Meeting, Toronto, ON, Canada, 7–10 July 2002. [Google Scholar]
- Jaeger, J.C.; Cook, N.G.W.; Zimmerman, R.W. Fundamentals of Rock Mechanics, 4th ed.; Blackwell Publishing: Ames, IA, USA, 2007. [Google Scholar]
- State Administration of Work Safety; National Coal Mine Safety Administration; National Energy Administration; National Railway Administration. Guiding Regulations for Coal Pillar Design and Mining Under Structures, Water Bodies, Railways and Main Shafts and Tunnels; State Administration of Coal Mine Safety: Beijing, China, 2017. [Google Scholar]
- Yu, G.; Han, Y.; Ren, B.; Wei, T.; Zheng, Q.; Wang, Y.; Mou, W. Research on mining-induced failure of grouted rock mass around collapse column based on micro-seismic monitoring. Coal Mine Saf. 2024, 55, 206–213. [Google Scholar] [CrossRef]
- Bin, S.; Xing, W. The Monitoring of Segments Dislocation Deformation in Shield Tunnel Based on BOFDA. In Engineering Challenges for Sustainable Underground Use, Proceedings of the GeoMEast 2017. Sustainable Civil Infrastructures, Sharm Elsheikh, Egypt, 15–19 July 2017; Agaiby, S., Grasso, P., Eds.; Springer: Cham, Switzerland, 2018. [Google Scholar]
Disclaimer/Publisher’s Note: The statements, opinions and data contained in all publications are solely those of the individual author(s) and contributor(s) and not of MDPI and/or the editor(s). MDPI and/or the editor(s) disclaim responsibility for any injury to people or property resulting from any ideas, methods, instructions or products referred to in the content. |
© 2025 by the authors. Licensee MDPI, Basel, Switzerland. This article is an open access article distributed under the terms and conditions of the Creative Commons Attribution (CC BY) license (https://creativecommons.org/licenses/by/4.0/).