Article

Optimization of the Hard Anodizing Process in Acidic Baths on AA6063 Aluminum Alloy Using Response Surface Methodology

by
José Cabral-Miramontes
1,
Citlalli Gaona-Tiburcio
1,*,
Erick Maldonado-Bandala
2,*,
Lino Juarez-Alejandro
1,
Miguel Angel Baltazar-Zamora
2,
Francisco Estupiñan-Lopez
1,
Laura Landa-Ruiz
2,
Javier Olguin-Coca
3,
Luis Daimir Lopez-Leon
3,
Demetrio Nieves-Mendoza
2,
Jesus Manuel Jaquez-Muñoz
4 and
Facundo Almeraya-Calderon
2
1
Universidad Autónoma de Nuevo León, Facultad de Ingenieria Mecanica y Electrica, Centro de Investigación e Innovación en Ingeniería, Aeronáutica (CIIIA), San Nicolás de los Garza 66455, Mexico
2
Facultad de Ingeniería Civil, Universidad Veracruzana, Xalapa 91000, Mexico
3
Área Académica de Ingeniería y Arquitectura, Universidad Autónoma del Estado de Hidalgo, Carretera Pachuca-Tulancingo Km. 4.5, Pachuca 42082, Mexico
4
Centro de Ciencias de la Ingeniera, Universidad Autonóma de Aguascalientes, Aguascalientes 20340, Mexico
*
Authors to whom correspondence should be addressed.
Coatings 2025, 15(11), 1306; https://doi.org/10.3390/coatings15111306 (registering DOI)
Submission received: 20 October 2025 / Revised: 4 November 2025 / Accepted: 7 November 2025 / Published: 9 November 2025

Abstract

The characteristics of aluminum alloys make them the most extensively used material in the aerospace sector. Aluminum, in a natural way, when interacting with oxygen, forms a protective layer of aluminum oxide, Al2O3, that enhances its properties, for example, resistance to corrosion and fatigue. This work aims to optimize the anodizing process by identifying the optimum values and combination of factors that allow the formation of an alumina layer with a thickness of 12 µm and the maximum Vickers microhardness. The parameters to be evaluated will include time, current density, and sulfuric acid concentration, which were considered variables at two levels: 15 and 20 min, 2.5 and 3.5 A/dm2, and 180 and 350 g/L, respectively. We used the response surface methodology (RSM) with a composite central design (CCD). The results of the optimization MSR reveal that to obtain the optimum Type III hard anodizing on AA6063 aluminum alloy with a target thickness of 11.85 µm and a Vickers microhardness of 297.14, a combination consisting of 15 min, 2.55 A/dm2, and 333.15 g/L of H2SO4 is required.

1. Introduction

The second most popular materials in the metal industry are aluminum and its alloys because of their many valuable qualities, including their low density, light weight, strong resistance to corrosion, ductility, and superior mechanical characteristics [1,2]. With magnesium and silicon as the primary alloying constituents, the 6XXX series stands out among all alloys as the most appropriate for structural engineering applications. Within this series, the aluminum alloy 6063 has been widely used as a construction material in architectural applications due to its malleability and high-quality surface finish.
One of the most well-known phenomena occurs when aluminum encounters oxygen, naturally forming a heterogeneous layer of aluminum oxide (Al2O3), with a thickness ranging from 0.003 to 0.01 µm, rendering it a corrosion-resistant metal. Due to this property, aluminum has found extensive applications across various industries [3,4]. Despite its natural protection, the layer is heterogeneous and does not provide sufficient protection against aggressive environments; therefore, if the formation of this layer can be controlled, it is possible to develop a thicker, more homogeneous oxide coating with enhanced properties such as improved corrosion resistance, higher wear resistance, and dielectric behavior. This is achieved through an electrochemical surface treatment known as anodizing, which purposefully enhances and extends the natural oxidation of aluminum.
Anodizing involves the electrolytic oxidation of the aluminum surface under controlled conditions. Critical process parameters such as electrolyte type and concentration, current density, process temperature, anodizing duration, and the incorporation of additives directly affect the morphological and mechanical properties of the anodic layer [5,6,7,8]. For industrial applications, the goal is typically to achieve rapid oxide growth with high uniformity and mechanical integrity, particularly in layer thickness and microhardness.
Changing one variable at a time while holding the others constant has been the primary method used in previous studies to examine the impact of specific parameters on anodic coatings. However, this method can overlook possible interactions between variables, potentially leading to inaccurate conclusions. To overcome this limitation, response surface methodology (RSM) is applied to assess multiple variables simultaneously and understand their interactive effects on the properties of anodic aluminum oxide coatings.
In some studies, RMS has been used to optimize the anodizing process. In a study presented by Pouyafard and Meshkabadi in 2024, they included the parameters of current density, time, and concentration of oxalic acid as an electrolyte. They found that the concentration of oxalic acid and the interaction between time and oxalic concentration and the quadratic of current density and process time have a significant effect on hardness. Thickness is influenced by current density, time, and the interaction between time and oxalic acid concentration. With their optimized process on 6063 aluminum, they found hardnesses of 434 HV and thicknesses of 93.6 µm [9,10,11]. In another study involving the anodizing of 6061-T6 aluminum, current density, duty cycle, and frequency were used as factors at three different evaluation levels: 1, 3, and 5 A/dm2, 20, 50, and 80%, and 10, 100, and 1000 Hz, respectively. Through process optimization, a combination of 5 A/dm2, 40%, and 75 Hz was obtained as the optimal current, duty cycle, and frequency to achieve a maximum thickness of 163.1 µm and microhardness of 482.2 HV [12]. Finally, in another study, certain properties such as thickness, hardness, and wear resistance were improved using response surfaces with variables such as duty cycle, frequency, and maximum and minimum current density. The optimal anodizing conditions were obtained with a duty cycle of 65%, a frequency of 326 Hz, a maximum current of 3.5 A/dm2, and a minimum current of 0.5 A/dm2, yielding estimated values of 170 µm, 526 HV0.1, and 2.12 × 10⁻⁷ g/N·m for thickness, microhardness, and wear rate, respectively [13].
RSM integrates mathematical modeling with experimental design to establish predictive models and determine optimal process conditions. A standard design, as the central composite design (CCD), is typically used to evaluate the effects of multiple variables due to its effectiveness in predicting for three or more factors (multivariable), as it enables a second-order design that considers variable interactions and quadratic effects, by using a multiple linear regression model rather than just a linear regression model based on a 3 k factorial design where experiments exists at central and axis points [14,15,16].
y = β 0 + i = 1 K β 1 x i + j = 2 k i = 1 j 1 β ij x i x j + i = 1 K β ii x 2 + e
In this framework, the response variable Y is defined by the sum of linear β 1 x i , interactions β ij x i x j and quadratic β ii x 2 terms. Optimization is carried out using desirability functions for responses based on an adjusted model that completes the following three rules: denies the null hypothesis using α = 0.05, uses a hierarchical model, and R-sq > 70% [17,18,19,20,21]. Recently, there is more interest in using DOE, particularly in industrial and scientific settings. It is a key idea for obtaining accurate results, saving time, completing fewer tests, and streamlining procedures. DOE aids in determining the ideal values or circumstances for answers that are compatible. Furthermore, RSM is a method for creating experiments with several independent variables that have an impact on one or more dependent variables. By lowering the number of tests and establishing a mathematical relationship between the variables, this approach seeks to maximize the responses. RSM is a popular method because it is useful in identifying the best or nearly best replies over a series of tests [22,23].
This research aims to optimize the hard anodizing process in acidic baths using RMS and CCD, thereby revealing the relationship between key variables such as time, current density, and bath concentration to achieve maximum microhardness values and optimal thickness.

2. Materials and Methods

2.1. Materials

Commercial aluminum alloy AA 6063 was used as a 150 mm × 50 mm × 0.5 mm bar in the received condition. Table 1 shows the chemical composition of AA6063 aluminum as determined via X-ray fluorescence (XRF, Olympus DELTA XRF, Richmond, TX, USA) [24].

2.2. Hard Anodizing Process

The samples underwent cleaning and pickling treatment before the anodizing process, designated as pretreatment. To produce hard anodizing, sulfuric acid (H2SO4) was used as an electrolytic solution with concentrations ranging from 180 to 350 g/L, and the anodizing time was 15 to 20 min. The current densities used for anodizing ranged from 2.5 to 3.5 A/dm2, as indicated by the CCD. All of the different combinations of anodizing parameters were carried out at 0 ± 5 °C to avoid dissolution of the alumina layer. Following the anodizing procedure, the components were sealed for 30 min at 40 °C in deionized water [25]. The cathode was a sheet of AA6063 aluminum alloy measuring 150 mm × 50 mm × 0.5 mm and was positioned 25 mm parallel to the anode.

2.3. Response Surface Methodology (RSM)

This study used RSM and CCD with three continuous factors and three dependent variables that are essential for the anodizing process: (1) time, (2) current density, and (3) sulfuric acid solution concentration. These variables were evaluated at two different levels to determine the ideal setting for the anodizing coating, where a target thickness of 12 µm and maximum Vickers microhardness are obtained. Table 2 specifies the variables represented by each factor in their coded and current form and the operating levels necessary to carry out the optimization process [26,27].
For the elaboration of the experimental matrix, Minitab 21 statistical software was employed, and the RSM was used to develop a CCD with three continuous factors to optimize the process. Vickers microhardness (HV) and coating thickness 12 (µm) were chosen as response factors.
Twenty runs were obtained by combining these variables. The use of a CCD can result in the creation of axial points (experiments) outside the cube or area of interest, leading to combinations with values that exceed the operating limits [28,29,30]. For this reason, the runs that were within the limits were filtered to carry out the experiments [31,32]. Fourteen runs were performed that remained within the parameters. Table 3 displays the experimental variables together with their actual and coded values.

2.4. Characterization of Anodized Coatings

2.4.1. Measurements of Anodizing Thickness

To facilitate handling, samples of 6063 aluminum alloy were immersed in epoxy resin and subsequently polished in compliance with ASTM E3 requirements for measurement using scanning electron microscopy [33]. Silicon carbide abrasive sheets with grain sizes ranging from 120 to 4000 were used for polishing. Diamond paste with a particle size of 1 μm was used for the last fine polishing process.
Using optical microscopy, a Zeiss Axio Observer 7 Materials microscope (Zeiss, Oberkochen, Germany) was employed to determine the anodized layers’ thickness in accordance with ASTM B487-85 [34]. Each sample had five thickness measurements in two separate fields, for a total of ten measurements.
Zeiss Sigma 300 VP scanning electron microscopy (SEM) (Oberkochen, Baden-Württemberg, Germany) was used at magnifications of 500× and 2000× to obtain the surface morphology, and the cross-section was performed at 2000×. Five measurements were taken on the optimized sample using computer software to determine the thickness in the cross-section. The surface and cross-sectional morphology were examined using backscattered electrons (BSEs) with a beam energy of 20 kV.

2.4.2. Vickers Microhardness (HV)

Using a microhardness tester (Wilson Tester 402 MVD, Lake Bluff, IL, USA), the cross-section of the anodized specimen was evaluated for the Vickers microhardness test. Ten measurements per sample were obtained using a load of 10 gf and a 15 s dwell period, as specified in ASTM E92 [35].

2.4.3. Corrosion Measurements

To evaluate the corrosion resistance of the manufactured anodized coatings, this test was performed on two random samples from the 14 manufactured samples, on the optimized sample, and on the substrate without anodizing. Corrosion studies were conducted using three-electrode cells. The working electrodes were anodized samples, a platinum mesh counter electrode, and a saturated calomel electrode as a reference (SCE). The ZRA Solartron 1287A (Bognor Regis, Arun, West Sussex, UK) potentiostat/galvanostat was utilized. Every test was duplicated and involved dipping in a 3.5 wt.% NaCl solution at ambient temperature [34,35,36,37,38]. The anodized components’ corrosion resistance was evaluated using cyclic potentiodynamic polarization curve testing (CPPC), in accordance with ASTM G61-11 [39], using a potential sweep from −0.3 to 1.0 V of OCP, a scan rate of 0.06 V/min, and a complete polarization cycle.

3. Results and Discussion

3.1. Analysis of Response Surface Methodology

Using the information in Table 4, a design of experiments (DOE) was carried out. The analysis consisted of a mixture of completely quadratic terms and interactions, with a significance level of 5% (α = 0.05) [40]. The factors and combinations were eliminated from the design based on the null hypothesis H0. Following a hierarchical model, only the factors significant for optimization were used [41,42,43,44,45,46,47].

3.2. Analysis of Response Surface Regression for Thickness (Y1)

Table 5 shows the analysis of variance (ANOVA) by thickness and the summary of the model used. It reveals an R-sq of 82.43%, higher than the 70% required for a good predictive model. The outcomes of the ANOVA analysis for the thickness and hardness responses are displayed in Table 5 and Table 6. The p-value and F-value are crucial metrics for assessing the model, the parameters, and their interactions. Higher values are preferred for each input variable in the data distribution indicated by the F-value. Each term’s relevance in the response is shown by the p-value, where values less than 0.05 denote significance for each variable. Any variable is considered insignificant if its p-value is higher than 0.1. Determining the legitimacy of the response requires this analysis [39,40]. The most significant factors for thickness were current density (B), sulfuric acid concentration (C), and the second power of time (A2), which are less than 0.05, as can be seen in the p-values in Table 5. This suggests that they have a significant impact on the sample’s thickness.
The normal probability graph presented exhibits a linear trend in Figure 1a,b. Because of this, it can be concluded that the model is capable of explaining the responses and therefore makes an adequate prediction for thickness. According to Figure 1b and Table 5 of the Pareto diagram, the standardized effects of anodizing parameters, time, and interacting variables (such as (Curr. Dens.)2, (H2SO4 Conc.)2, are presented. Curr. Dens. × H2SO4 Conc. and their different interactions are not significant in the model response to predict thickness since their p-values are low for the level of significance [45,46].
Therefore, Equation (2) refers to the second-order response surface models that have been developed for coating thickness:
Thickness (Y1) = 126.3 − 13.68 A + 5.10 B − 0.02680 C + 0.387 A2
where A is time, B is current density, and C is H2SO4 concentration.
When it can be observed, when sulfuric acid concentration and current density increase, the oxide layers’ thickness [47,48], the response surface graphs of thickness at different concentrations of sulfuric acid, time, and current density are shown in Figure 2, the effect of current density and sulfuric acid concentration on thickness remains linear; that is, if both are increased, the thickness of the layer formed will increase. Thicknesses greater than 12 µm are achieved with anodizing current densities above 3 A/dm2 and short anodizing times (Figure 2). In contrast, the maximum anodizing thickness is achieved when the sulfuric acid concentration does not exceed 250 g/L, even though the time varies, as it will remain at values above 14 µm in anodizing times between 15 and 20 min. The porosity of the oxide coating layer decreases as the current density increases because a larger voltage is needed to generate the anodic layer. The anodic layer thickens as a result. Sulfuric acid concentration and current density both have an impact on thickness; thicker layers are produced by higher values [49,50].

3.3. Response Surface Regression for Vickers Microhardness (Y2)

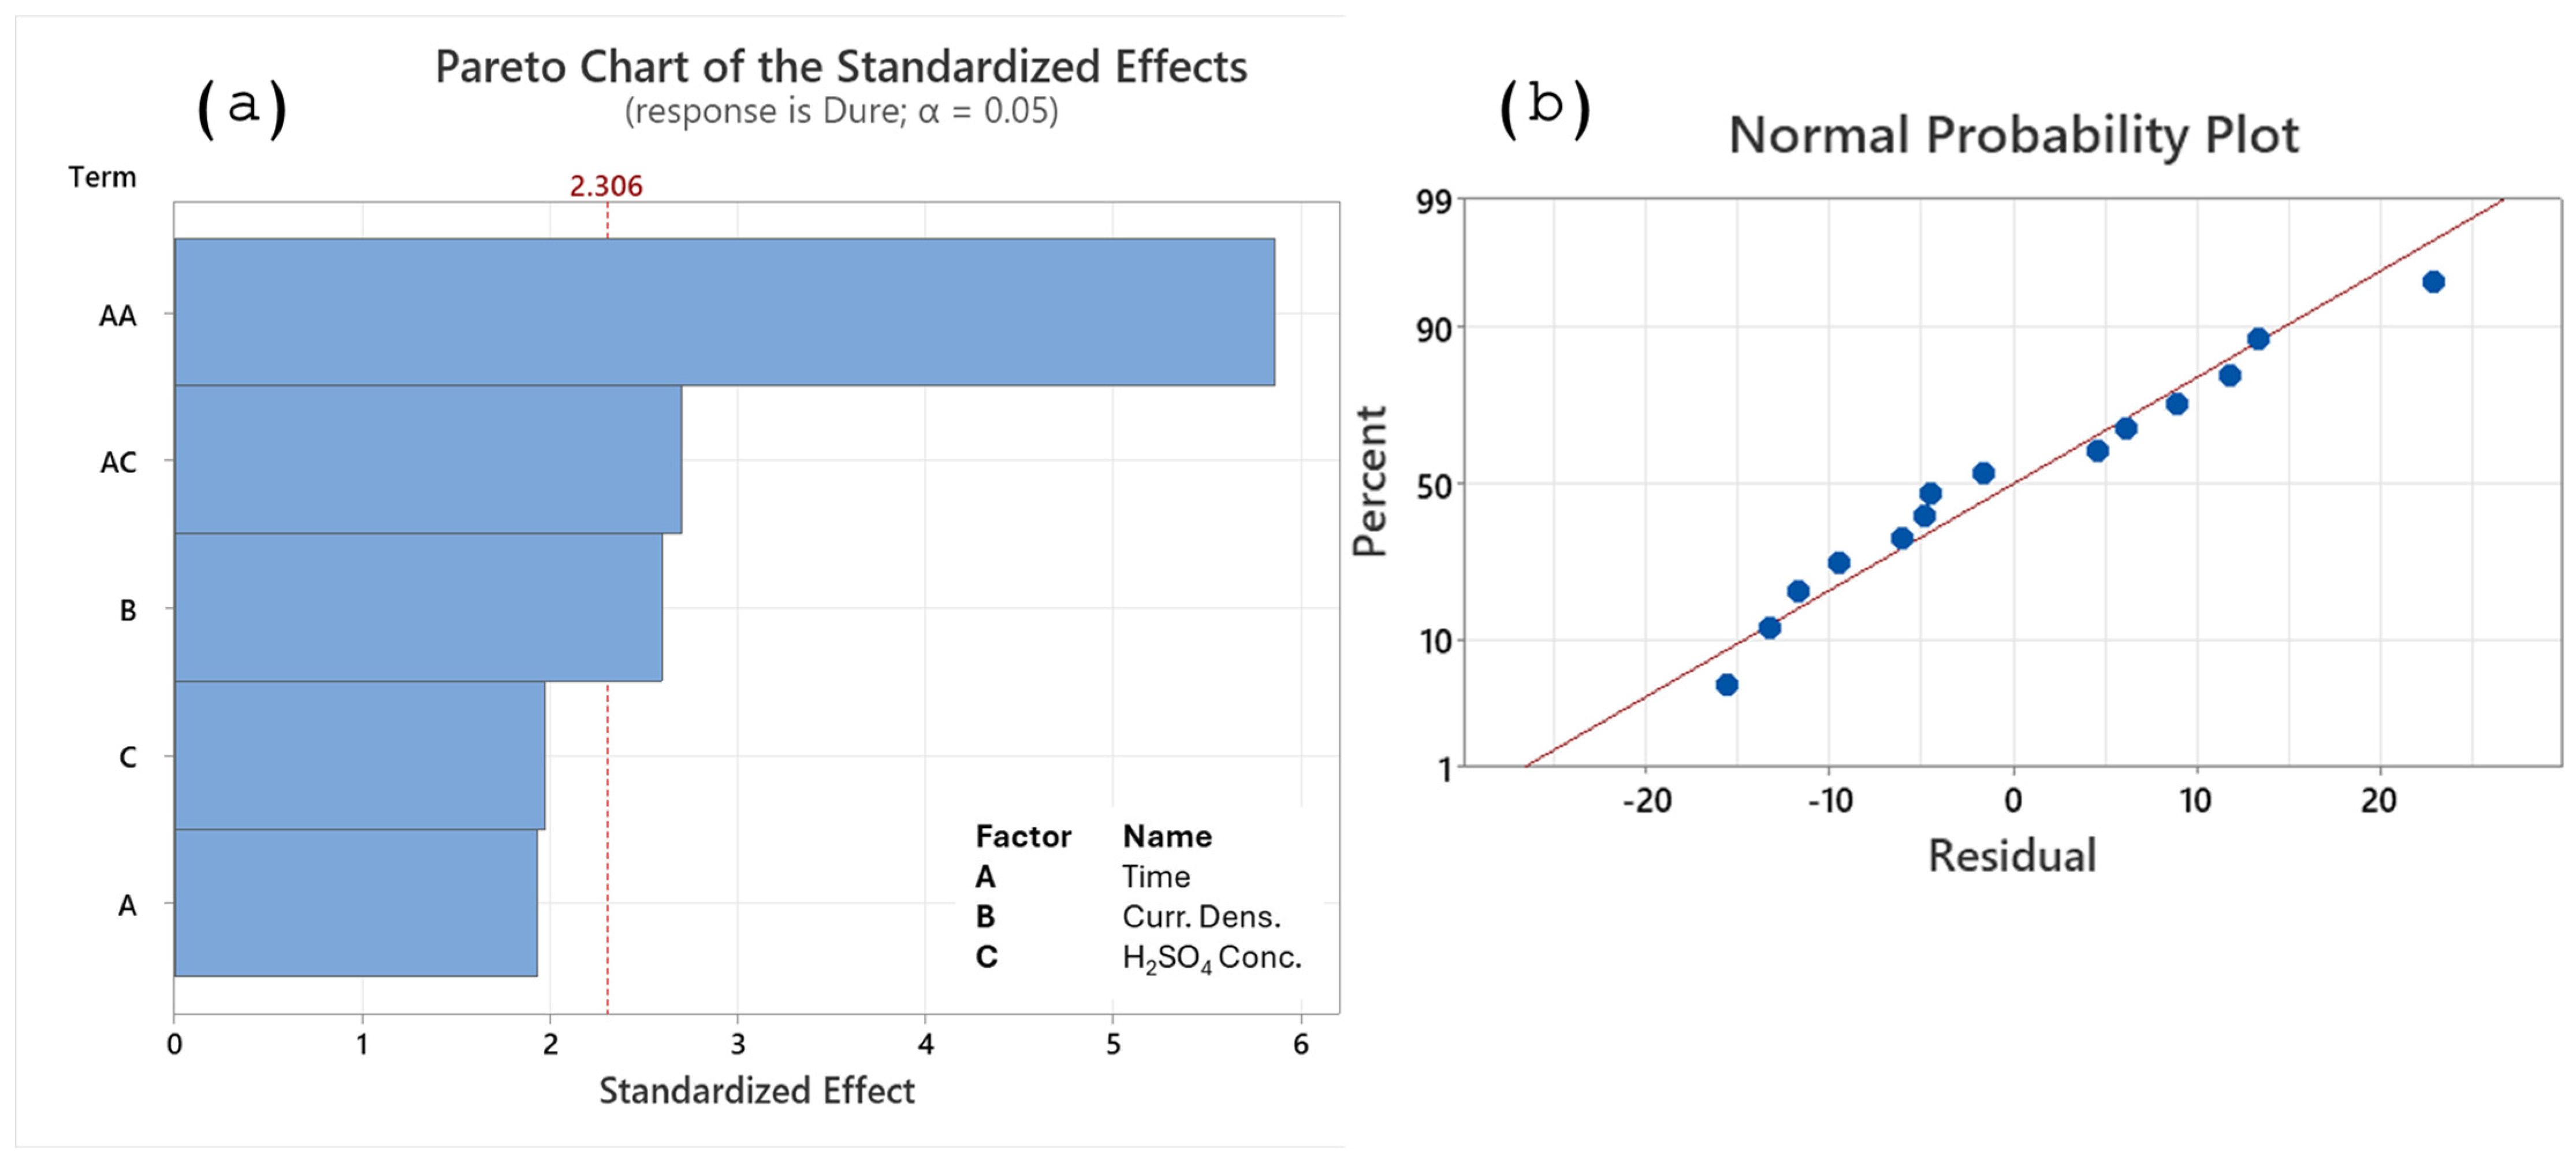
Table 6 shows the ANOVA and a summary of the model. The latter reveals that the model has an R-sq value of 87.49%, which is higher than the 70% required for an acceptable predictive model. Table 6 shows that the square of time (A2), the interaction between time and sulfuric acid concentration (AC), and current density (B) all have p-values less than 0.05. This means that they significantly influence the Vickers microhardness of the anodized samples. The statistical significance of the quadratic model was assessed using a Fisher F-test with a significance threshold of 0.05. For models to fit, non-significant values of lack of fit (>0.05) are desired. Table 5 and Table 6 demonstrate that the values of both outputs are negligible. This attests to the model’s validity and the data accuracy. To improve the model’s accuracy, factors with a p-value greater than 0.1 are excluded. The remaining parameters are those shown in Table 5 and Table 6. Table 6 indicates that the model has a very low chance of occurrence and a significant F-value of 11.19. B, AC, and A2 are important model terms; A, B, and the other interaction terms are not significant in the Vickers microhardness response model because their p-value is less than their significance value. With a Lack-of-Fit F-value of 1.29, the pure error is negligible, which is ideal for a strong model fit [51,52].
According to Figure 3a of the Pareto diagram, the standardized effects of the anodizing parameters AA, AC, and B are significant. Meanwhile, in the same figure, the time and concentration of sulfuric acid, as well as their different interactions and squares, are not significant in the model’s response to predict Vickers microhardness, since their p-values are low for the level of significance [45,53]. The normal probability graph shows a linear trend, so it can be said that the model can explain the responses and, therefore, makes an adequate prediction of Vickers microhardness, as shown in Figure 3b. The CCD values for the anodized layers’ Vickers microhardness were used to produce Equation 3, which was stated in real factors.
Vickers microhardness (Y2) = 2293 − 245.2 A − 26.8 B + 1.267 C + 7.39 A2 − 0.0656 AC
where A is time, B is current density, and C is H2SO4 concentration
Figure 4 shows the 3D response surfaces, which illustrate the interaction of the parameters affecting the Vickers microhardness of the coating. The two-parameter interaction effect has been examined under the assumption that the values of the other parameters stay constant and at the middle of their respective ranges. These results show that the coating’s Vickers microhardness is not significantly affected by variations in current density or sulfuric acid concentration. Increasing the sulfuric acid concentration increases the hardness of the coating. However, the highest concentration of sulfuric acid and the lowest anodizing durations were associated with the highest hardness value.
When examining the combined impact of sulfuric acid concentration and process time while holding all other variables constant, it is shown that variations in process time do not affect the coating’s Vickers microhardness, which decreases as process time increases. However, increasing the sulfuric acid concentration causes an increase in the hardness of the coating.
As current density and anodizing duration increase, the voltage required to generate the anodic layer increases, reducing porosity and pore size. The anodic oxide layer becomes harder as a result of this. Two forms of dissolution—chemical and field-assisted electrical—occur during anodizing. Field-assisted dissolution is brought on by a rise in electric current and thermal heating, whereas the electrolyte concentration and working duration impact chemical dissolution. A higher current density, a higher sulfuric acid concentration, and a brief processing time are necessary to produce a high-hardness coating [54,55,56].

3.4. Optimization of the Anodization Process

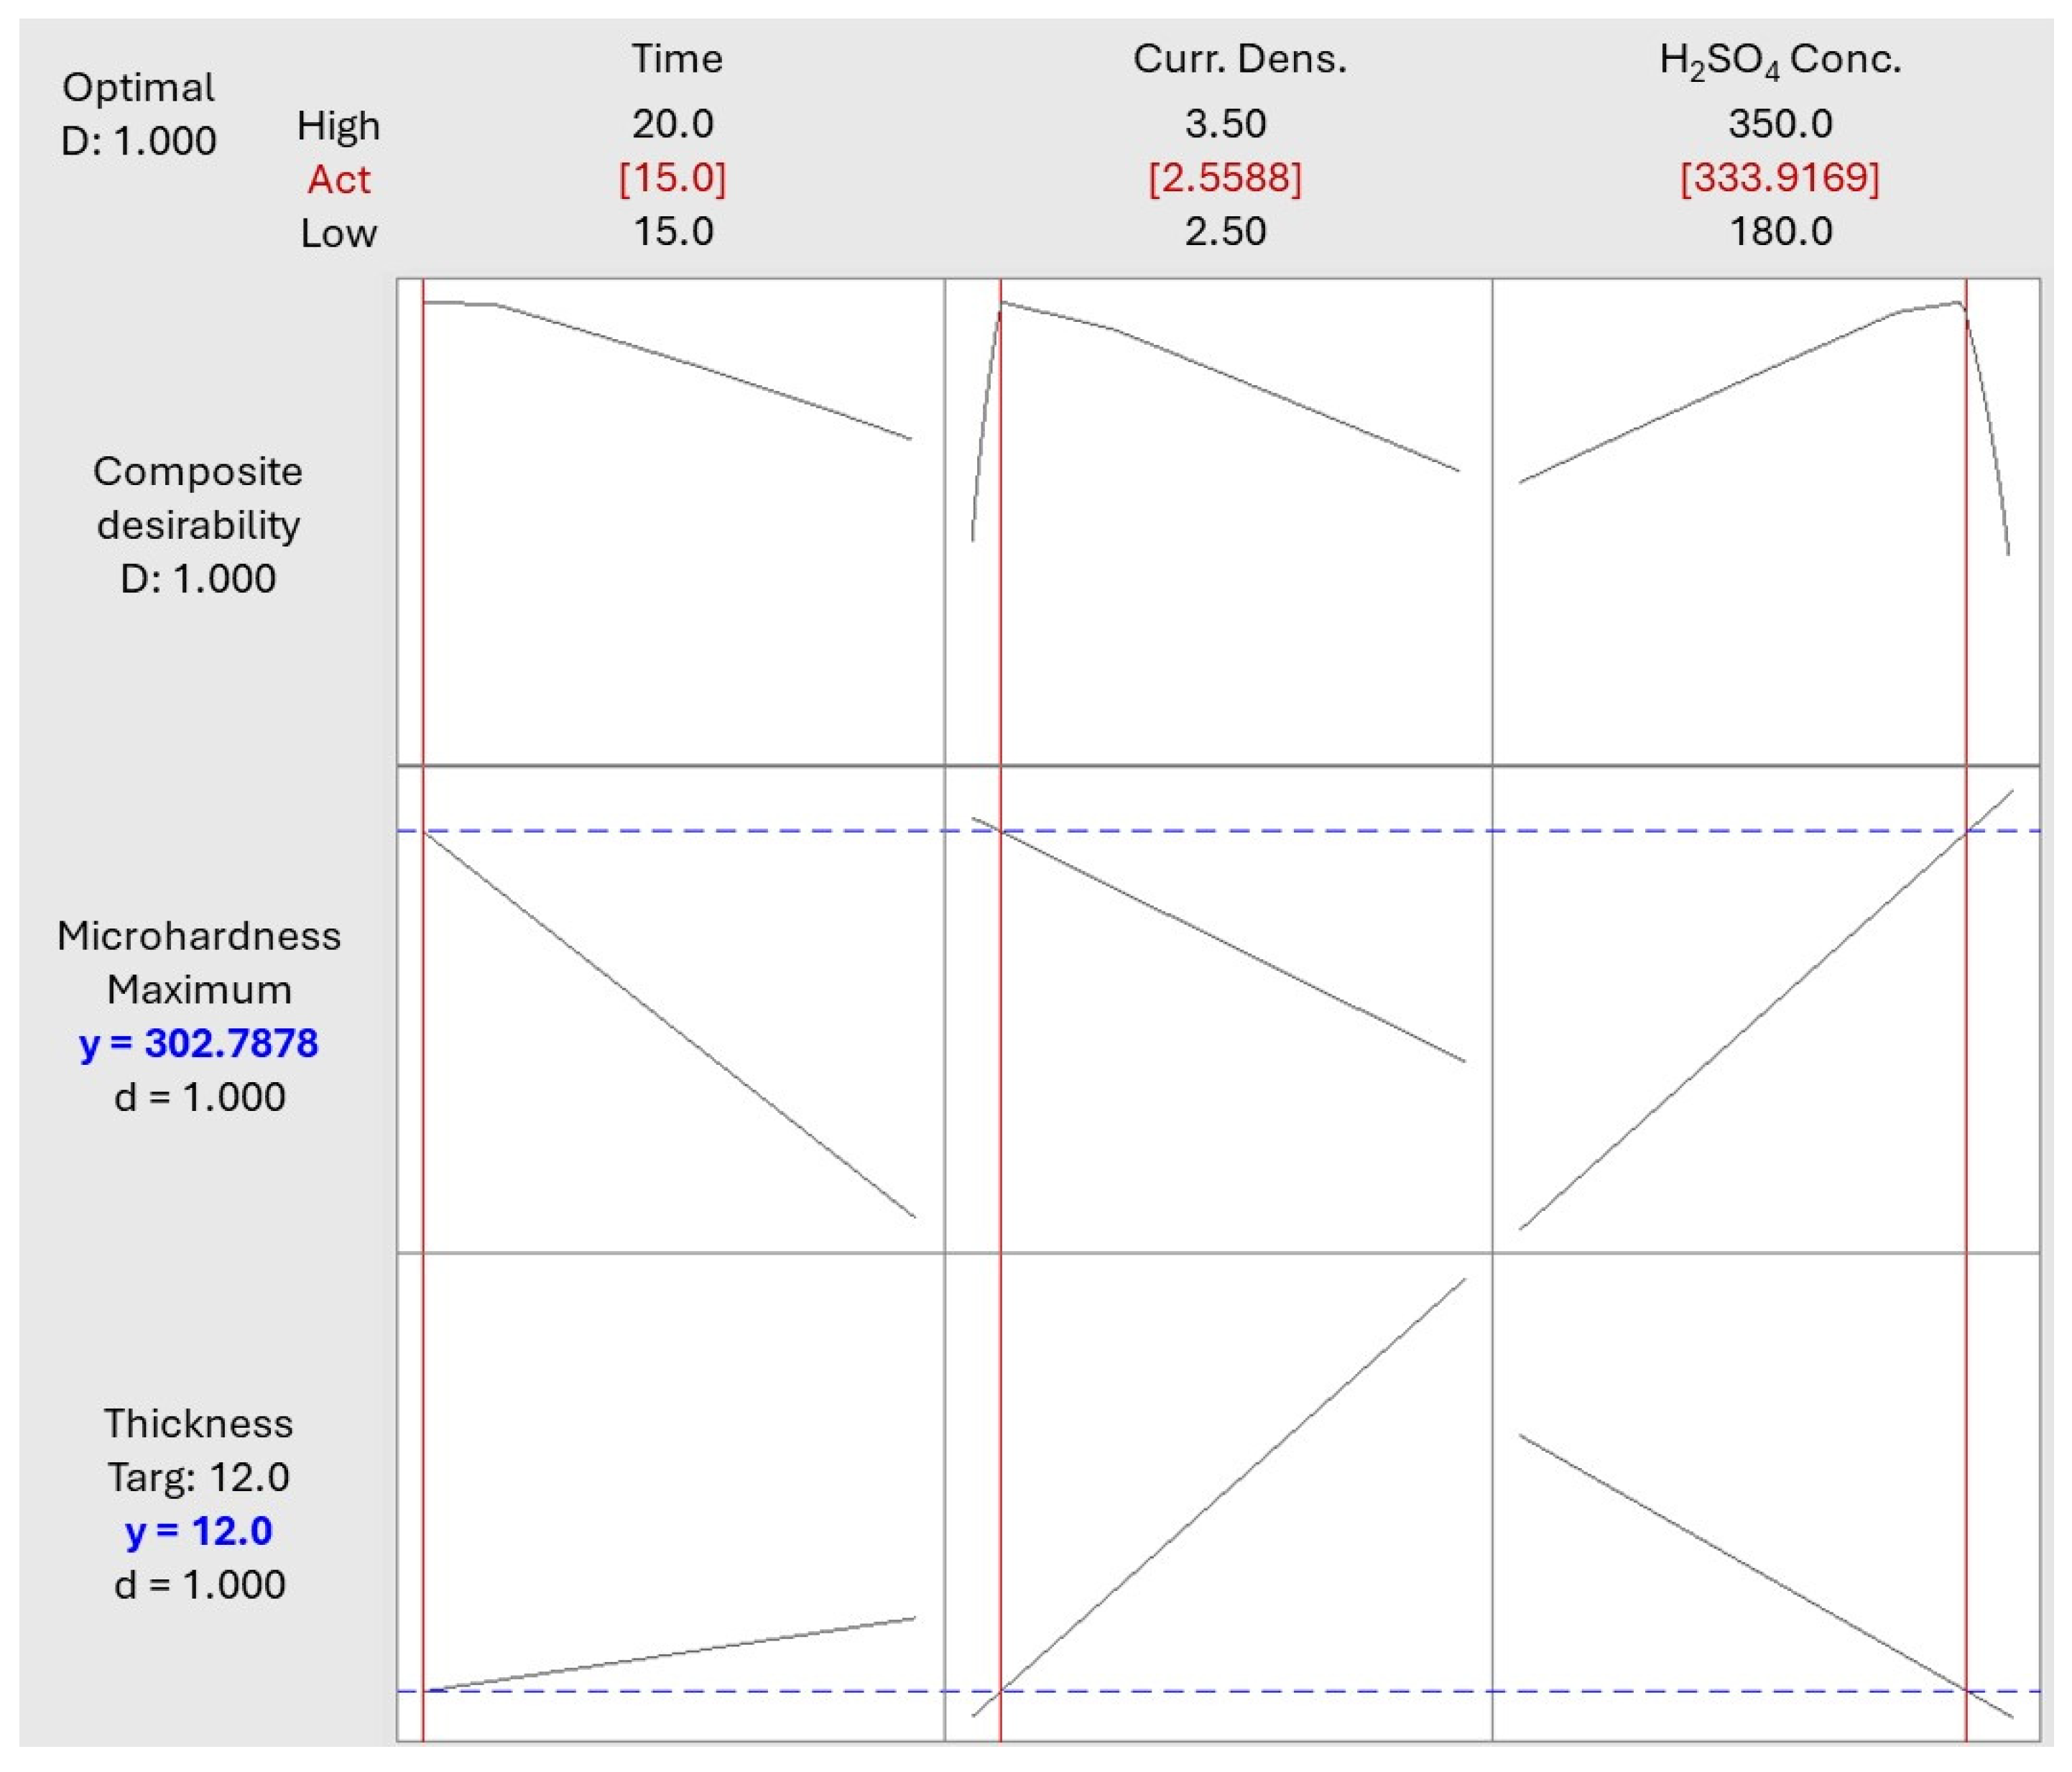
After identifying the variables that affect system performance, the next step is to adjust them to find the ideal circumstances for achieving the optimum outcome. It is necessary to optimize the anodizing process settings, which entails figuring out the range of input parameters, including sulfuric acid concentration, process time, and current density. The objective of this research is to maximize Vickers microhardness and achieve a target thickness of 12 µm. For this purpose, Minitab 21 software was utilized, employing the combined function to optimize Vickers microhardness and achieve a target thickness of 12 µm, as previously mentioned. The optimization of the anodizing process with the previously mentioned values is shown in Figure 5. The results show that if the anodizing procedure is carried out with a 15 min process duration, a current density of 2.55 A/dm2, and a sulfuric acid concentration of 333.91 g/L, a Vickers microhardness of 302.7 HV and objective thickness of 12 μm can be achieved.

3.5. Characterization of AA6063 Anodized Coatings

3.5.1. Analysis of Coating Anodized Thickness

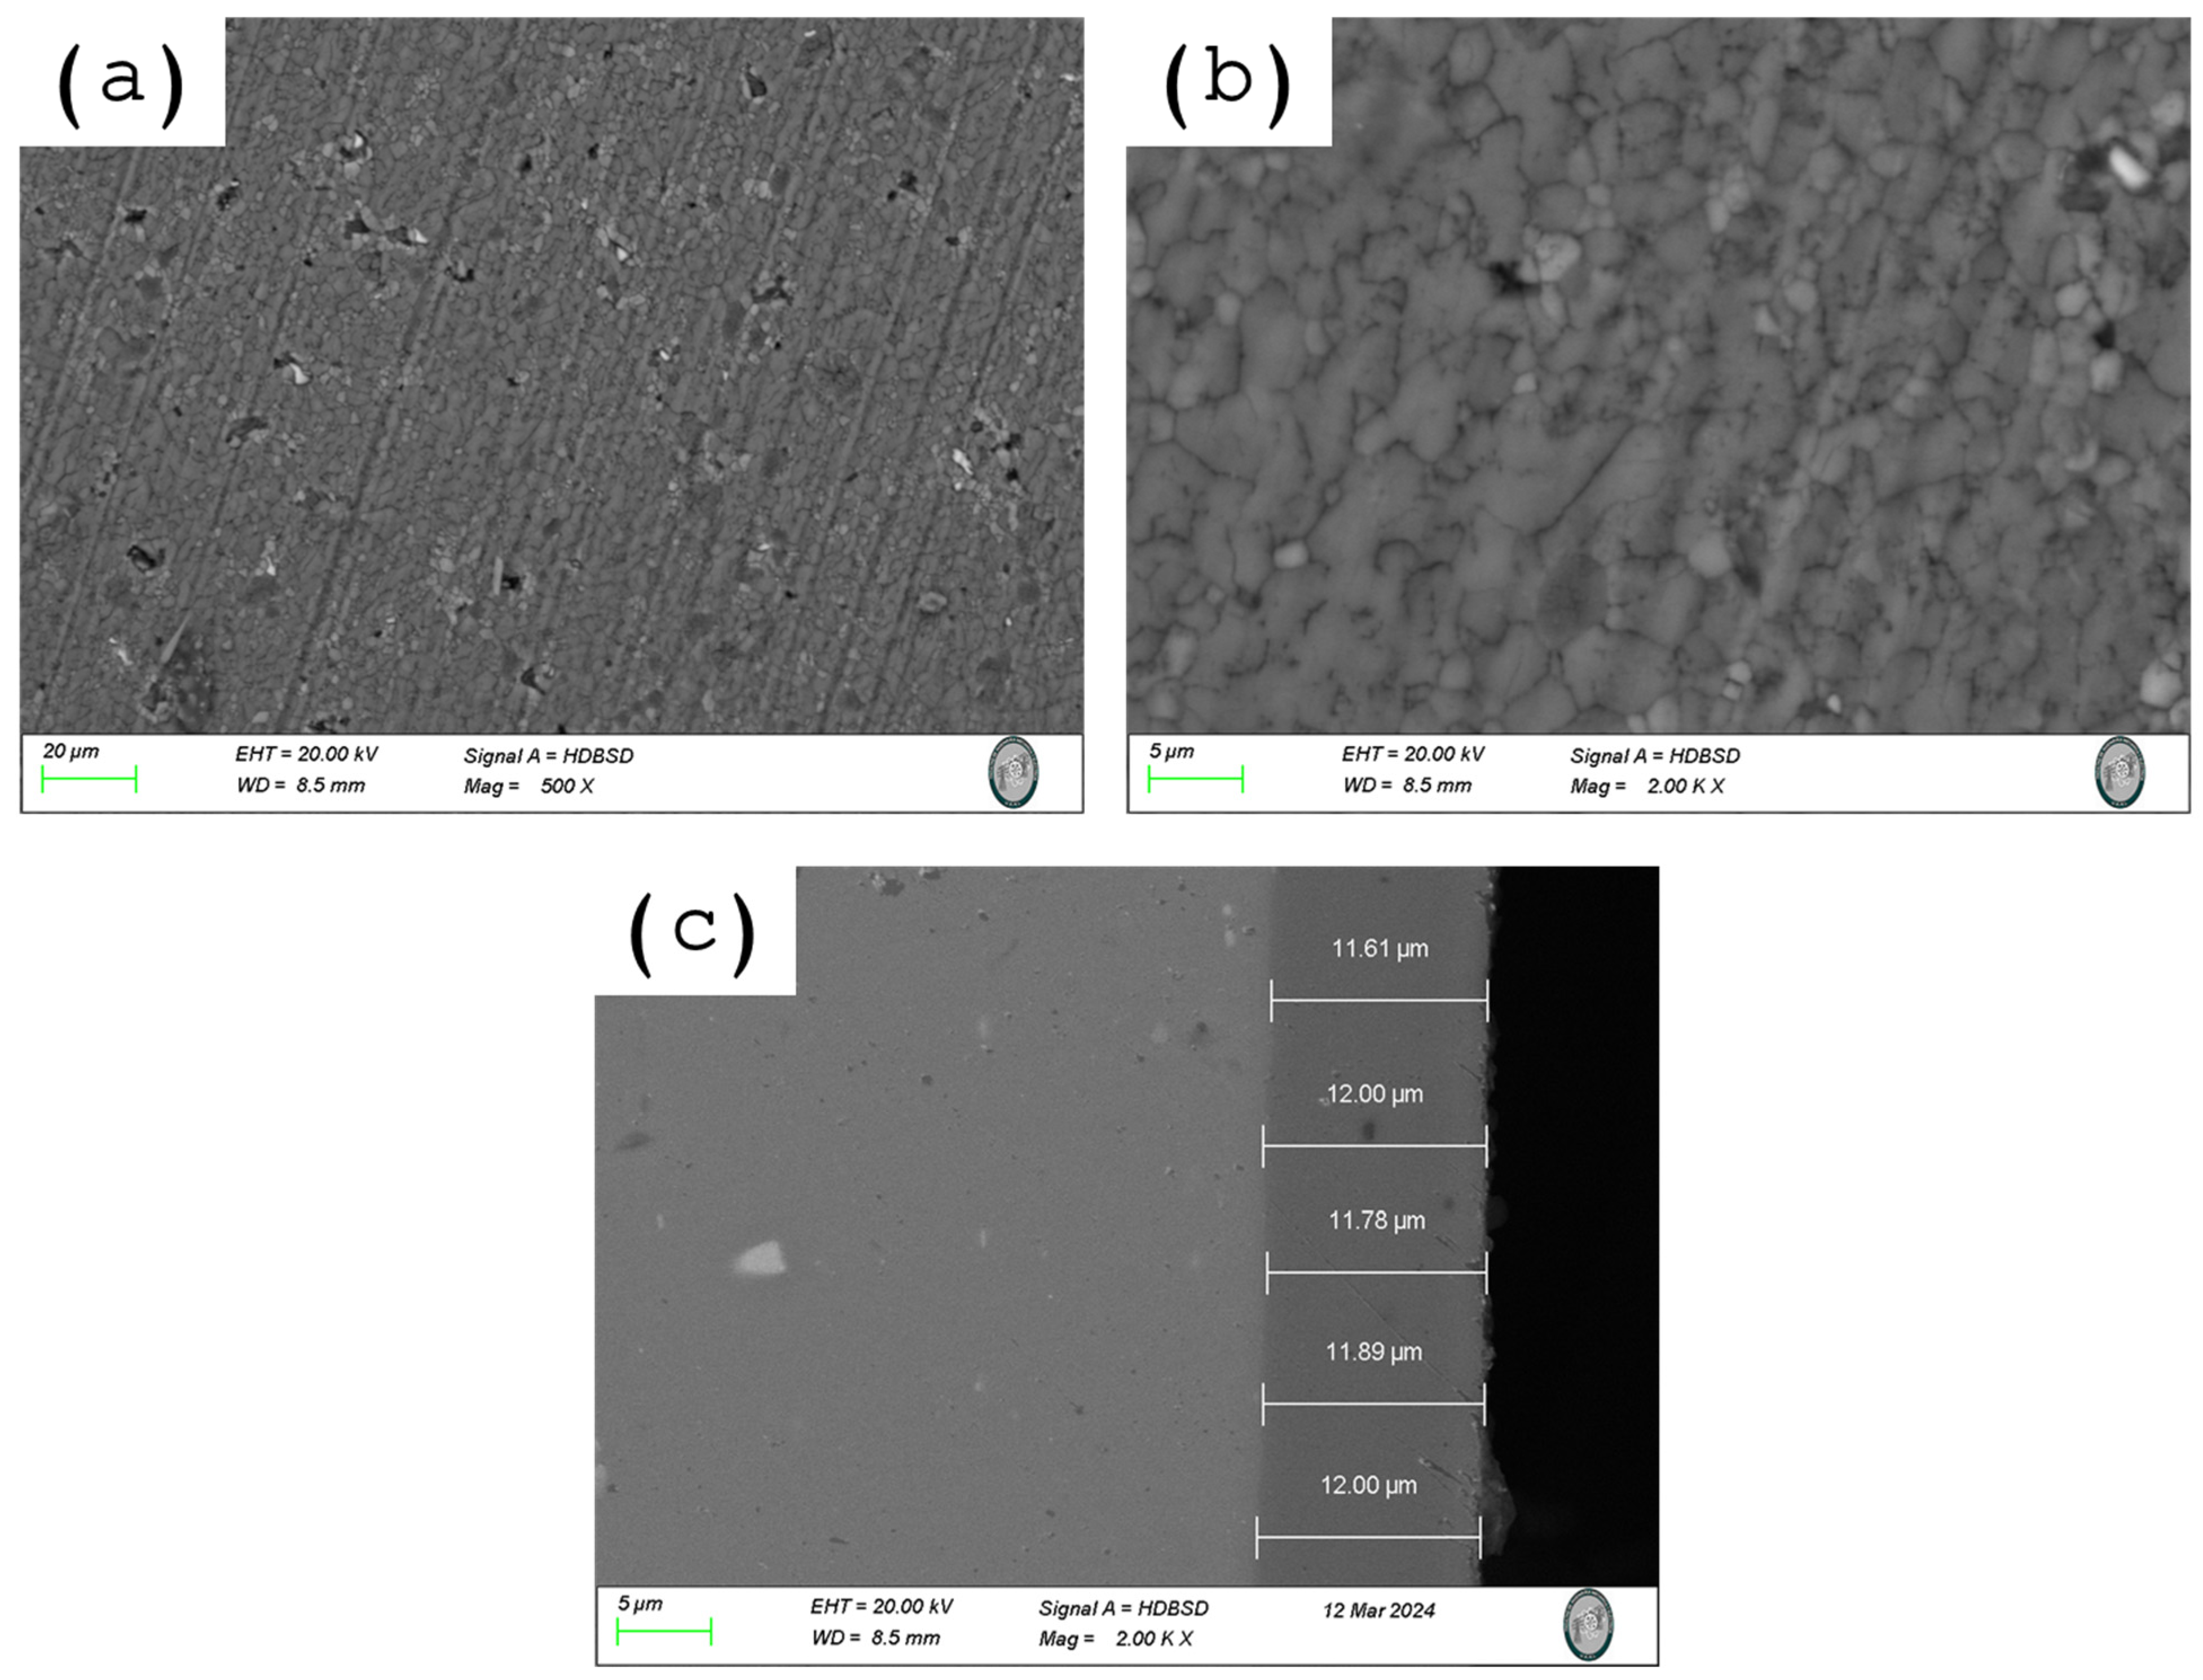
Figure 6 shows SEM images of the anodized sample under optimal conditions, both the surface morphology and the cross-sectional surface after metallographic preparation. The images of the polished sample in Figure 6 are provided for comparison purposes and show the final result of the process optimization. The measured hardness of the sample was 297.6 HV, and its thickness was 11.85 µm, both within the expected ranges of 12 and 302.7 HV. In Figure 6a,b, the absence of cracks or detachments in the coating corroborates the effectiveness of the parameters applied in the optimal anodizing process. This observation serves to reaffirm that the selection of the anodizing conditions and the process were appropriate [57]. As can be seen from the cross-section image in Figure 6c, the interface between the substrate and the coating appears uniformly smooth. The anodizing technique has effectively produced porous aluminum matrices in sulfuric acid electrolytes. A thin, porous oxide layer is created on the surface of alloy 6063 during the anodizing process, which uses direct current. Thanks to this layer, the electrolyte can reach deeper levels, which also acts as a foundation for future growth. Oxygen evolves on the alloy surface because of the applied current, which reacts with the alloy metal ions and causes the creation of metal oxide compounds. The anodizing procedure is repeated until the oxide layer achieves the required thickness [58,59,60]. Anodizing generally results in the homogeneous and regulated production of metal oxides on the AA6063 alloy’s surface, improving its visual appeal and resistance to corrosion.

3.5.2. Corrosion Properties

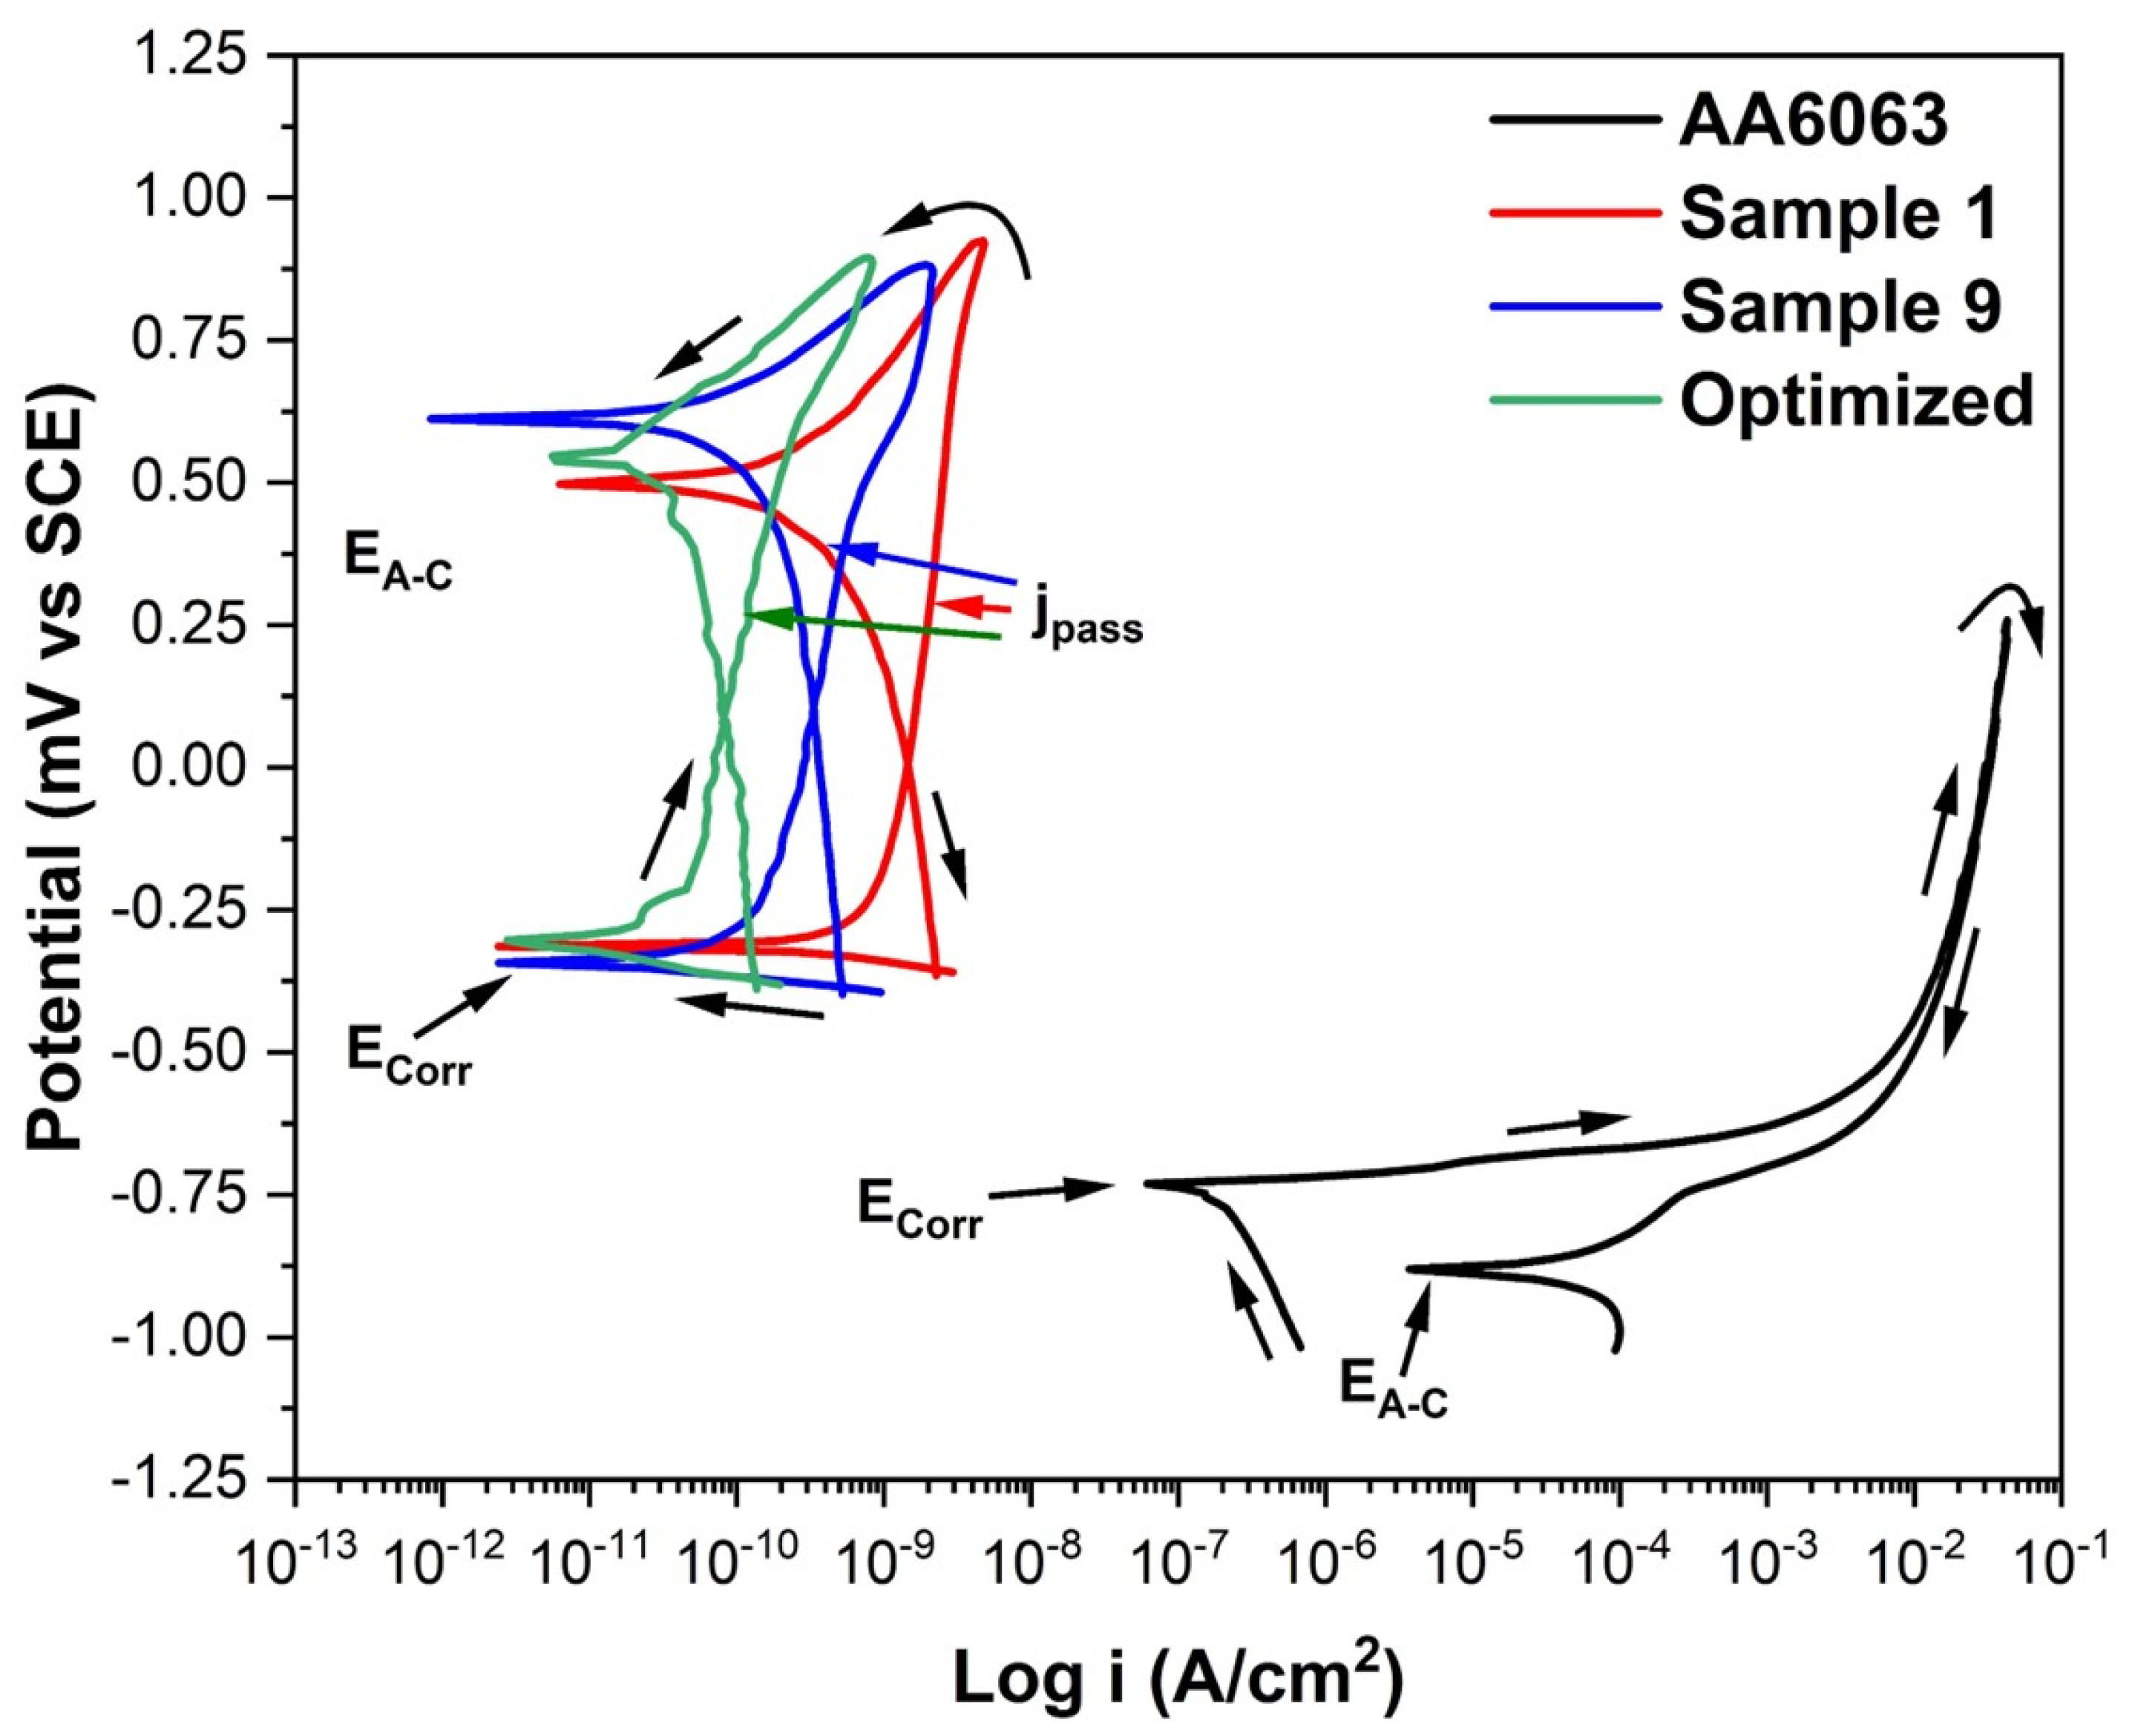
Figure 7 depicts the cyclic potentiodynamic polarization curve (CPPC) of the three selected samples, corresponding to samples AA6063 aluminum alloy substrate, No. 1 (15 min, 2.5 A/dm2, 180 g/L), and No. 9 (17.5 min, 3.0 A/dm2, 265 g/L), and optimized sample (15 min, 2.55 A/dm2, 333.91 g/L), in the 3.5 wt.% NaCl solution. The corrosion process was examined using the CPPC, which provides data on the anodic, cathodic, and hysteresis ranges of the anodized samples in relation to the corrosion phenomena. Nobler corrosion potential (ECorr) values indicate that anodized samples are more resistant to corrosion [57,58,59,60,61,62]. The potential needed when the anodic current density changes with the cathodic current density is known as the anodic-to-cathodic transition potential (EA–C). The EA–C and ECorr are compared to determine the persistence of the passive film. If EA–C is more noble than ECorr, the passive layer will not be stable in positive hysteresis. However, in the presence of negative hysteresis, if EA–C is more noble than Ecorr, the passive layer will be stable and has the possibility of regenerating [63]. The passive layer will persist and show positive hysteresis if the ECorr is more noble than the EA–C [64]. Instead, the absence of a hysteresis loop for these samples, indicating the absence of localized corrosion, may suggest widespread corrosion and an active surface in the potential sweep. Negative hysteresis is linked to general corrosion, and positive hysteresis is related to crevice corrosion or pitting [65].
For anodized materials, the ECorr is very similar across all samples, which is more noble than the unanodized material, meaning that these anodized samples will tend to corrode similarly. The anodic–cathodic transition potential EA–C is more noble for all anodized materials, indicating that the oxide layer formed during the process is stable. At the same time, the 6063 aluminum sample has a more negative EA–C than ECorr, indicating that the naturally formed oxide layer is unstable and tends to dissolve in this type of electrolyte. The non-anodized sample (Aluminum Alloy 6063) did not exhibit passivation current density (jPass), which means that it remained in activation and dissolution of the material throughout the test. The anodized samples under different conditions presented different jPass values, which are related to the anodizing conditions. In the case of corrosion current density (jCorr), the non-anodized sample had the highest jCorr value and the optimized sample presented a lower jCorr value, which means that this sample will have the lowest corrosion rate of the samples analyzed [66]. Regarding the type of hysteresis, the AA6063 aluminum substrate sample presented positive hysteresis, which is associated with pitting corrosion. In contrast, the anodized samples presented negative hysteresis, which is indicative of a type of generalized corrosion. Table 7 presents the data obtained from the CPPC in this study.
The increase in properties such as the Vickers microhardness and corrosion resistance of the anodized material is largely due to a combination of factors, such as the optimized anodized coating having low porosity and virtually no cracking in the cross section, as can be seen in Figure 6a,c. Additionally, aluminum 6063 has low alloy element content (see Table 1), which causes the oxide layer formed during the anodizing process to be continuous and with few defects, thereby increasing Vickers microhardness and corrosion resistance. The corrosion resistance of the anodized samples is the result of the reaction between aluminum and oxygen that occurs during the process, as shown in Equation (4):
2 Al + 3 O Al 2 O 3
The decrease in corrosion current density and passivation current density in the anodized material is due to the quality of the Al2O3 layer formed in the optimized process.

4. Conclusions

  • Using response surface methodology (RSM) and a central composite design (CCD), it was possible to create an experimental matrix with 20 combinations to obtain the response factors necessary to design response surface experiments.
  • The analysis yielded models for both responses (thickness and microhardness) with an R-sq greater than 80%, sufficient to define the relationship between the variation in the model and the variation explained by the analysis.
  • The most influential parameters in creating the alumina layer for thickness are current density, H2SO4 concentration, and the quadratic term for time.
  • The results indicate that for Vickers microhardness, the most influential variables are the quadratic of time, the interaction between time and current density, and the concentration of H2SO4.
  • With response optimization, a thickness of 11.85 µm and a Vickers microhardness of 297.7 were achieved, with an anodizing time of 15 min, a current density of 2.55 A/dm2, and an H2SO4 concentration of 333.91 g/L.
  • The corrosion resistance of the anodized material also increases when anodized under the optimal conditions obtained, presenting low corrosion and passivation current densities and a more noble corrosion potential than the rest of the samples evaluated.

Author Contributions

Conceptualization, J.C.-M., F.A.-C., and C.G.-T.; methodology, J.C.-M., L.J.-A., F.E.-L., M.A.B.-Z., J.O.-C., and L.D.L.-L.; validation, C.G.-T., D.N.-M., E.M.-B., L.L.-R., and J.M.J.-M.; formal analysis, J.M.J.-M., L.J.-A., D.N.-M., E.M.-B., J.C.-M., and L.D.L.-L.; investigation, L.J.-A., L.L.-R., and M.A.B.-Z.; data curation, J.C.-M., C.G.-T., E.M.-B., D.N.-M., J.O.-C., and F.E.-L.; writing—original draft preparation, J.C.-M., L.J.-A., C.G.-T., and E.M.-B.; writing—review and editing, J.C.-M., F.A.-C., and C.G.-T.; supervision, F.A.-C. All authors have read and agreed to the published version of the manuscript.

Funding

This research was funded by “Programa de Apoyo a la Ciencia, Tecnología e Innovación 2023, 2024 y 2025 de la Universidad Autónoma de Nuevo León”, grant number 133-IDT-2023, and 15-IDT-2024 and 15-IDT-2025.

Data Availability Statement

The original contributions presented in this study are included in the article. Further inquiries can be directed to the corresponding authors.

Acknowledgments

The authors would like to thank the UANL-CA-316 working group and the Universidad Autónoma de Nuevo León (UANL) for providing the facilities that enabled the development of this investigation and the student Ing. Daniel Vera Cervantes and M. C. Miguel Esneider Alcala for their collaboration in this work.

Conflicts of Interest

The authors declare no conflicts of interest.

Abbreviations

The following abbreviations are used in this manuscript:
RSMResponse surface methodology
CCDComposite central design
XRF X-ray fluorescence
HVVickers microhardness
Curr. Dens.Current density
H2SO4 Conc.H2SO4 solution concentration
SCESaturated calomel electrode
CPPCCyclic potentiodynamic polarization curve
DOEDesign of experiments
ANOVAAnalysis of variance
Std DevStandard Deviation
Y1Thickness
Y2Vickers microhardness (HV)
ECorrCorrosion potential
EA-CAnodic-to-cathodic transition potential
jPassPassivation current density
jCorrCorrosion current density

References

  1. Runge, J.M. A Brief History of Aluminum and Its Alloys. In The Metallurgy of Anodizing Aluminum; Springer: Cham, Switzerland, 2018; Volume XXII, pp. 1–63. [Google Scholar]
  2. Raj, V.; Rajaram, M.P.; Balasubramanian, G.; Vincent, S.; Kanagaraj, D. Pulse Anodizing—An Overview. Trans. IMF 2003, 81, 114–121. [Google Scholar] [CrossRef]
  3. Abdel-Salam, O.E.; Shoeib, M.A.; Elkilany, H.A. Characterization of the hard anodizing layers formed on 2014-T3 Al alloy, in sulphuric acid electrolyte containing sodium lignin sulphonate. Egypt. J. Petrol. 2017, 27, 497–504. [Google Scholar] [CrossRef]
  4. Roshani, M.; Rouhaghdam, A.S.; Aliofkhazraei, M.; Astaraee, A.H. Optimization of mechanical properties for pulsed anodizing of aluminum. Surf. Coat. Technol. 2017, 310, 17–24. [Google Scholar] [CrossRef]
  5. Cabral Miramontes, J.A.; Gaona Tiburcio, C.; Estupiñan López, F.; Lara-Banda, M.; Zambrano Robledo, P.; Nieves-Mendoza, D.; Maldonado Bandala, E.; Chacón Nava, J.; Almeraya Calderón, F. Corrosion Resistance of Hard Coat Anodized AA 6061 in Citric–Sulfuric Solutions. Coatings 2020, 10, 601. [Google Scholar] [CrossRef]
  6. Martínez Viademonte, M.; Abrahami, S.T.; Hack, T.; Burchardt, M.; Terryn, H. A Review on Anodizing of Aerospace Aluminum Alloys for Corrosion Protection. Coatings 2020, 10, 1106–1136. [Google Scholar] [CrossRef]
  7. Kwolek, P. Hard anodic coatings on aluminum alloys. Adv. Manuf. Sci. Technol. 2017, 41, 35–46. [Google Scholar]
  8. Gabe, D.R. Hard anodizing—What do we mean by hard? Met. Finish. 2002, 100, 52–58. [Google Scholar] [CrossRef]
  9. Vergara Guillén, L.E.; Nerey Carvajal, L.M.; Guedez Torcates, V.M. Modelo predictivo del espesor de la capa de óxido y microdureza en aluminio Al3003-B14 y Al6063-T6 anodizado usando análisis multifactorial. Ingeniare Rev. Chil. Ing. 2011, 19, 186–195. [Google Scholar] [CrossRef]
  10. Ferreira, S.L.; Bruns, R.E.; Ferreira, H.S.; Matos, G.D.; David, J.M.; Brandão, G.C.; da Silva, E.G.; Portugal, L.A.; dos Reis, P.S.; Souza, A.S.; et al. Box-Behnken design: An alternative for the optimization of analytical methods. Anal. Chim. Acta 2007, 597, 179–186. [Google Scholar] [CrossRef]
  11. Pouyafar, V.; Meshkabadi, R. Experimental investigation, modeling and optimization of parameters in hard anodizing of 6063 aluminum alloy using central composite design. Arab. J. Sci. Eng. 2024, 49, 11015–11029. [Google Scholar] [CrossRef]
  12. Nabavi, R.; Sarraf, S.; Soltanieh, M. Optimization of Hard Anodizing Process Parameters on 6061-T6 Aluminum Alloy Using Response Surface Methodology. J. Mater. Eng. Perform. 2024, 33, 10048–10061. [Google Scholar] [CrossRef]
  13. Samaniego-Gámez, P.O.; Almeraya-Calderon, F.; Maldonado-Bandala, E.; Cabral-Miramontes, J.; Nieves-Mendoza, D.; Olguin-Coca, J.; Lopez-Leon, L.D.; Silva Vidaurri, L.G.; Zambrano-Robledo, P.; Gaona-Tiburcio, C. Corrosion Behavior of AA2055 Aluminum-Lithium Alloys Anodized in the Presence of Sulfuric Acid Solution. Coatings 2021, 11, 1278. [Google Scholar] [CrossRef]
  14. Alishavandi, M.; Ebadi, M.; Kokabi, A.H. Optimization of parameters for the friction stir processing and welding of aa1050 aluminum alloy. Iran. J. Mater. Sci. Eng. 2021, 18, 1–11. [Google Scholar]
  15. Pulido, H.G.; De la Vara Salazar, R.; Carrasco, A.C.; Sánchez, M.O. Análisis y Diseño de Experimentos, 2nd ed.; McGraw-Hill/Interamericana Editores: Ciudad de México, Mexico, 2008; pp. 413–420. [Google Scholar]
  16. Khuri, A.; Mukhopadhyay, S. Response Surface Methodology. Wiley Interdiscipl. Rev. Comput. Stat. 2010, 2, 128–149. [Google Scholar] [CrossRef]
  17. Samaniego-Gámez, P.; Almeraya-Calderón, F.; Martin, U.; Ress, J.; Gaona-Tiburcio, C.; Silva-Vidaurri, L.; Cabral-Miramontes, J.; Bastidas, J.M.; Chacón-Nava, J.G.; Bastidas, D.M. Efecto del tratamiento de sellado en el comportamiento frente a corrosión de la aleación anodizada de aluminio-litio AA2099. Rev. Met. 2020, 56, e180. [Google Scholar] [CrossRef]
  18. Chen, W.-H.; Uribe, M.C.; Kwon, E.E.; Lin, K.-Y.A.; Park, Y.-K.; Ding, L.; Saw, L.H. A comprehensive review of thermoelectric generation optimization by statistical approach: Taguchi method, analysis of variance (ANOVA), and response surface methodology (RSM). Renew. Sustain. Energy Rev. 2022, 169, 112917. [Google Scholar] [CrossRef]
  19. Antony, J. Design of Experiments for Engineers and Scientists, 2nd ed.; Elsevier: Waltham, MA, USA, 2023; pp. 73–76. [Google Scholar]
  20. Rashid, K.H.; Khadom, A.A.; Mahood, H.B. Aluminum ASA 6061 anodizing process by chromic acid using Box-Wilson central composite design: Optimization and corrosion tendency. Met. Mater. Int. 2021, 27, 4059–4073. [Google Scholar] [CrossRef]
  21. Moradi, M.; Hashemi, R.; Kasaeian-Naeini, M. Experimental investigation of parameters in fused filament fabrication 3D printing process of ABS plus using response surface methodology. Int. J. Adv. Manuf. Technol. 2023, 1–18. [Google Scholar] [CrossRef]
  22. Elhami, S.; Razfar, M.R.; Farahnakian, M.; Rasti, A. Application of GONNS to Predict Constrained Optimum Surface Roughness in Face Milling of High-Silicon Austenitic stainless Steel. Int. J. Adv. Manufact. Technol. 2012, 66, 975–986. [Google Scholar] [CrossRef]
  23. Cabral-Miramontes, J.; Almeraya-Calderón, F.; López, F.E.; Lara Banda, M.; Olguín-Coca, J.; López-León, L.D.; Castañeda-Robles, I.; Alcalá, M.Á.E.; Zambrano-Robledo, P.; Gaona-Tiburcio, C. Citric Acid as an Alternative to Sulfuric Acid for the Hard-Anodizing of AA6061. Metals 2021, 11, 1838. [Google Scholar] [CrossRef]
  24. Georgantzia, E.; Gkantou, M.; Kamaris, G.S. Aluminium alloys as structural material: A review of research. Eng. Struct. 2021, 227, 111372. [Google Scholar] [CrossRef]
  25. Alwitt, R.S.; McClung, R.C.; Jacobs, S. Anodized Aluminum Coatings for Thermal Control, Part I: Coating Process and Stresses. In Proceedings of the AIAA Materials Specialist Conference, Dallas, TX, USA, 16–17 April 1992; pp. 39–45, AIAA-922158-CP, AAIA Technical Papers (A92-31285 12-23). [Google Scholar]
  26. Martinez-Ramos, C.; Gaona-Tiburcio, C.; Estupiñan-López, F.; Cabral-Miramontes, J.; Maldonado-Bandala, E.; Nieves-Mendoza, D.; Baltazar-Zamora, M.A.; Landa-Ruiz, L.; Galvan-Martinez, R.; Almeraya-Calderón, F. Smart Corrosion Monitoring in AA2055 Using Hidden Markov Models and Electrochemical Noise Signal Processing. Materials 2025, 18, 2865. [Google Scholar] [CrossRef]
  27. Belwalkar, A.; Grasing, E.; Van Geertruyden, W.; Huang, Z.; Misiolek, W. Effect of Processing Parameters on Pore Structure and Thickness of anodic Aluminum Oxide (AAO) Tubular Membranes. J. Membr. Sci. 2008, 319, 192–198. [Google Scholar] [CrossRef]
  28. Curioni, M.; Gionfini, T.; Vicenzo, A.; Skeldon, P.; Thompson, G.E. Optimization of anodizing cycles for enhanced performance. Surf. Interface Anal. 2013, 45, 1485–1489. [Google Scholar] [CrossRef]
  29. Almeraya-Calderón, F.; Montoya-Rangel, M.; Nieves-Mendoza, D.; Jáquez-Muñoz, J.M.; Diaz-Olivares, A.; Lara-Banda, M.; Maldonado-Bandala, E.; Estupinan-Lopez, F.; Cabral-Miramontes, J.; Olguin-Coca, J.; et al. Corrosion Behavior of Advanced High-Strength Steels (AHSS) in Chloride Solutions for Automotive Applications. Metals 2025, 15, 1116. [Google Scholar] [CrossRef]
  30. Bensalah, W.; Elleuch, K.; Feki, M.; Wery, M.; Ayedi, H. Optimization of anodic layer properties on aluminium in mixed oxalic/sulphuric acid bath using statistical experimental methods. Surf. Coat. Technol. 2007, 201, 7855–7864. [Google Scholar] [CrossRef]
  31. Montgomery, D.C. Design and Analysis of Experiments; Wiley: New York, NY, USA, 2001. [Google Scholar]
  32. Biles, W.E.; Swain, J.J. Optimization and Industrial Experimentation, 1st ed.; Wiley: New York, NY, USA, 1980. [Google Scholar]
  33. ASTM E3-95; Standard Practice for Preparation of Metallographic Specimens. ASTM International: WEST Conshohocken, PA, USA, 1995.
  34. ASTM B487-85; Standard Test Method for Measurement of Metal and Oxide Coating Thickness by Microscopical Examination of Cross Section. ASTM International: WEST Conshohocken, PA, USA, 2020.
  35. ASTM E92-17; Standard Test Method for Vickers Hardness of Metallic Materials. ASTM International: WEST Conshohocken, PA, USA, 2017.
  36. Franco, M.; Krishna, T.H.; Pillai, A.M.; Rajendra, A.; Sharma, A.K. A comparative study on the corrosion behavior of hard anodic coatings on AA6061 obtained using dc and pulsed dc power sources. Acta Metall. Sin. Engl. Lett. 2013, 26, 647–656. [Google Scholar] [CrossRef]
  37. Gaona-Tiburcio, C.; Almeraya-Calderón, F.; Chacon-Nava, J.G.; Matutes-Aquino, J.A.; Martinez-Villafañe, A. Electrochemical response of permanente magnets in different solutions. J. Alloys Compd. 2004, 369, 78–80. [Google Scholar] [CrossRef]
  38. Loto, R.T.; Adeleke, A.J. Corrosion of aluminum alloy metal matrix composites in neutral chloride solutions. Fail. Anal. Prev. 2016, 16, 874–885. [Google Scholar] [CrossRef]
  39. ASTM G61-86; Standard Test Method for Conducting Cyclic Potentiodynamic Polarization Measurements for Localized Corrosion Susceptibility of Iron-, Nickel-, or Cobalt-Based Alloy. ASTM International: West Conshohocken, PA, USA, 2018.
  40. Li, W.; Hu, S.J.; Cheng, S.W. Robust design and analysis for manufacturing processes with parameter interdependency. J. Manuf. Syst. 2002, 21, 93–100. [Google Scholar] [CrossRef]
  41. Chen, D.C.; Chen, C.F. Use of Taguchi method to study a robust design for the sectioned beams curvature during rolling. J. Mater. Process. Technol. 2007, 190, 130–137. [Google Scholar] [CrossRef]
  42. Brahmi, M.; Ba, M.; Hidri, Y.; Hassen, A. factorial experimental design intended for the optimization of the alumina purification conditions. J. Mol. Struct. 2018, 1157, 567–578. [Google Scholar] [CrossRef]
  43. Martínez-Ramos, C.; Olguin-Coca, J.; Lopez-Leon, L.D.; Gaona-Tiburcio, C.; Lara-Banda, M.; Maldonado-Bandala, E.; Castañeda-Robles, I.; Jaquez-Muñoz, J.M.; Cabral-Miramontes, J.; Nieves-Mendoza, D.; et al. Electrochemical Noise Analysis Using Experimental Chaos Theory, Power Spectral Density and Hilbert–Huang Transform in Anodized Aluminum Alloys in Tartaric–Phosphoric–Sulfuric Acid Solutions. Metals 2023, 13, 1850. [Google Scholar] [CrossRef]
  44. Marwan, N.; Webber, C.L.; Macau, E.E.N.; Viana, R.L. Introduction to Focus Issue: Recurrence Quantification Analysis for Understanding Complex Systems. Chaos 2018, 28, 85601. [Google Scholar] [CrossRef]
  45. Figueiredo, J.; Vila, M.; Fiúza, A.; Góis, J.; Futuro, A.; De Dinis, M.L.; Martins, D. A Holistic Approach in Re-Mining Old Tailings Deposits for the Supply of Critical-Metals: A Portuguese Case Study. Minerals 2019, 9, 638. [Google Scholar] [CrossRef]
  46. Man, L.; Kumar, P.; Teng, T.T.; Wasewar, K. Design of Experiments for Malachite Green Dye Removal from Wastewater Using Thermolysis–Coagulation–Flocculation. Desalin. Water Treat. 2012, 40, 260–271. [Google Scholar] [CrossRef]
  47. Rajendra, A.; Parmar, B.J.; Sharma, A.K.; Bhojraj, H.; Nayak, M.M.; Rajanna, K. Hard anodisation of aluminium and its application to sensorics. Surf. Eng. 2005, 21, 193–197. [Google Scholar] [CrossRef]
  48. Mohammadi, I.; Afshar, A.; Ahmadi Seyedkhani, S. Nanoporous anodized aluminum thickness optimization through pulse current mode. J. Adv. Mater. Process. 2015, 3, 11–24. [Google Scholar]
  49. Garcia-Vergara, S.J.; Skeldon, P.; Thompson, G.E.; Hashimoto, T.; Habazaki, H. Compositional evidence for flow in anodic films on aluminum under high electric fields. J. Electrochem. Soc. 2007, 154, C540. [Google Scholar] [CrossRef]
  50. De Graeve, I.; Terryn, H.; Thompson, G.E. Influence of local heat development on film thickness for anodizing aluminumin sulfuric acid. J. Electrochem. Soc. 2003, 150, B158–B165. [Google Scholar] [CrossRef]
  51. Almeraya-Calderon, F.; Villegas-Tovar, M.; Maldonado-Bandala, E.; Nieves-Mendoza, D.; Méndez-Ramírez, C.T.; Baltazar-Zamora, M.A.; Olguín-Coca, J.; Lopez-Leon, L.D.; Santiago-Hurtado, G.; Almaguer-Cantu, V.; et al. Electrochemical Noise Analysis in Passivated Martensitic Precipitation-Hardening Stainless Steels in H2SO4 and NaCl Solutions. Metals 2025, 15, 837. [Google Scholar] [CrossRef]
  52. Baiwei, Z.; Seifeddine, S.; Persson, O.Å.; Jarfors Anders, E.W.; Leisner, P.; Zanella, C. A study of formation and growth of the anodized surface layer on cast Al-Si alloys based on different analytical techniques. Mater. Des. 2016, 101, 254–262. [Google Scholar]
  53. Chen, K.S.; Chen, H.T.; Chang, T.C. The construction and application of Six Sigma quality indices. Int. J. Prod. Res. 2017, 55, 2365–2384. [Google Scholar] [CrossRef]
  54. Schneider, M.; Liebmann, T.; Langklotz, U.; Michaelis, A. Microelectrochemical investigation of anodic oxide formation on the aluminum alloy AA2024. Electrochim. Acta 2017, 249, 198–205. [Google Scholar] [CrossRef]
  55. O’sullivan, J.P.; Wood, G.C. The morphology and mechanism of formation of porous anodic films on aluminium. Proc. R. Soc. Lond. A 1970, 317, 511–543. [Google Scholar]
  56. Kikuchi, T.; Takenaga, A.; Natsui, S.; Suzuki, R. Advanced hard anodic alumina coatings via etidronic acid anodizing. Surf. Coat. Technol. 2017, 326, 72–78. [Google Scholar] [CrossRef]
  57. Totaro, P.; Khusid, B. Multistep Anodization of 7075–T6 Aluminum Alloy. Surf. Coat. Technol. 2021, 421, 127407. [Google Scholar] [CrossRef]
  58. Stępniowski, W.; Moneta, M.; Karczewski, K.; Michalska-Domańska, M.; Czujko, T.; Mol, J.M.C.; Buijnsters, J. Fabrication of copper nanowires via electrodeposition in anodic aluminum oxide templates formed by combined hard anodizing and electrochemical barrier layer thinning. J. Electroanal. Chem. 2017, 809, 59–66. [Google Scholar] [CrossRef]
  59. Han, X.Y. Improved two-step anodization technique for ordered porous anodic aluminum membranes. J. Electroanal. Chem. 2011, 655, 56–64. [Google Scholar] [CrossRef]
  60. Mehdizade, M.; Soltanieh, M.; Eivani, A.R. Investigation of anodizing time and pulse voltage modes on the corrosion behavior of nanostructured anodic layer in commercial pure aluminum. Surf. Coat. Technol. 2018, 358, 741–752. [Google Scholar] [CrossRef]
  61. Lerner, L.M. Hard anodizing of aerospace aluminium alloys. Trans. Inst. Met. Finish. 2010, 88, 21–24. [Google Scholar] [CrossRef]
  62. Khamaj, J.A. Cyclic polarization analysis of corrosion behavior of ceramic coating on 6061 Al/SiCp composite for marine applications. Prot. Met. Phys. Chem. Surf. 2016, 52, 886–893. [Google Scholar] [CrossRef]
  63. Silverman, D.C. Practical Corrosion Prediction Using Electrochemical Techniques, 3rd ed.; John Wiley & Sons, Inc.: Hoboken, NJ, USA, 2011; pp. 1129–1166. [Google Scholar]
  64. Mansouri, K.; Ibrik, K.; Bensalah, N.; Abdel-Wahab, A. Anodic dissolution of pure aluminum during electrocoagulation process: Influence of supporting electrolyte, initial pH and current density. Ind. Eng. Chem. Res. 2011, 50, 13362–13372. [Google Scholar] [CrossRef]
  65. Zhao, X.; Wei, G.; Meng, X.; Zhang, A. High Performance Alumina Films Prepared by Direct Current Plus Pulse Anodisation. Surf. Eng. 2014, 30, 455–459. [Google Scholar] [CrossRef]
  66. Ali, H. Review of Porous Anodic Aluminium Oxide (AAO) Applications for Sensors MEMS Biomedical devices. Trans. IMF 2017, 95, 290–296. [Google Scholar] [CrossRef]
Figure 1. (a) Pareto diagram of standardized effects of anodizing parameters for the thickness and (b) normal probability plot for the thickness.
Coatings 15 01306 g001
Figure 2. Three-dimensional response surface graphics display the interaction between the thickness response parameters.
Coatings 15 01306 g002
Figure 3. (a) Pareto diagram of standardized effects of anodizing parameters and (b) normal probability plot for the Vickers microhardness (HV).
Coatings 15 01306 g003
Figure 4. Three-dimensional response surface plots of the interaction between parameters for the Vickers microhardness response.
Coatings 15 01306 g004
Figure 5. Optimization of response parameters by maximizing Vickers microhardness and objective thickness of 12 µm.
Coatings 15 01306 g005
Figure 6. SEM images of the surface morphology: (a) magnification 500×, (b) magnification 2000×, and (c) cross-section anodized under the optimized condition (2000×).
Coatings 15 01306 g006
Figure 7. The CPPC of AA6063 before and after the anodizing process under different conditions, and the optimized process is exposed in the 3.5 wt.% NaCl solution.
Coatings 15 01306 g007
Table 1. Chemical composition of AA 6063 aluminum alloy (wt.%).
MaterialElements
AlSiFeCuMnMgCrTiZn
AA6063Bal0.550.060.0040.0060.830.0020.0020.007
Table 2. Operating levels for CCD experiment design.
FactorVariableNameMinimumMaximum
ATimeTime (min)1520
BCurrent densityCurr. Dens. (A/dm2)2.53.5
CH2SO4 solution concentrationH2SO4 Conc. (g/L)180350
Table 3. DCC’s three independent variables are combined into a matrix and expressed in real units.
Sample Run OrderDesign Variables
Time
(min)
Current Density
(A/dm2)
H2SO4 Conc.
(g/L)
Actual ValueAActual ValueBActual ValueC
1115−12.5−1180−1
2620+12.5−1180−1
3715−13.5+1180−1
41720+13.5+1180−1
51315−12.5−1350+1
6820+12.5−1350+1
71615−13.5+1350+1
81120+13.5+1350+1
9517.50302650
10917.50302650
111217.50302650
122017.50302650
131517.50302650
141017.50302650
Table 4. CCD matrix with the observed thickness and Vickers microhardness as the response.
SamplesTime
(min)
Current Density
(A/dm2)
H2SO4 Conc.
(g/L)
Coating
Thickness (Y1)
(µm)
Std
Dev
Thickness (Y1)
(µm)
Microhardness (Y2)
(HV)
Std Dev
Microhardness (Y2)
(HV)
1152.518014.67 0.128273.5 14.448
2202.518016.02 0.027265.1 15.266
3153.518023.01 0.203223.2 12.531
4203.518020.10 0.149247.4 17.941
5152.535011.56 0.556296.7 17.023
6202.535012.25 0.161268.2 14.512
7153.535016.65 0.154296.5 14.828
8203.535015.11 0.123229.3 8.416
917.53.026514.89 0.425214.7 10.737
1017.53.026514.84 0.214225.2 11.261
1117.53.026512.96 0.751206.8 10.340
1217.53.026510.44 0.746211.4 10.573
1317.53.026514.49 0.305200.8 10.048
1417.53.026514.91 0.223239.2 11.965
Table 5. Analysis of variance for coating thickness (Y1).
SourceGLAjust. SS Ajust. MS F-Value p-Value
Model4114.25628.563910.560.002
Lineal394.16731.389011.600.002
Time10.7270.72700.270.617
Curr. Dens.151.92251.922119.190.002
H2SO4 Conc.141.51841.517915.340.004
Cuadratic120.08820.08857.420.023
Time × Time120.08820.08857.420.023
Error924.3532.7059
Lack-of-Fit48.3832.09570.660.648
Pure error515.9703.1941
Total13138.609
S = 1.64496 R-sq(adj) = 74.62%
R-sq = 82.43% R-sq(pre) = 59.22%
Table 6. Analysis of variance for the Vickers microhardness (Y2).
SourceGLAjust. SS Ajust. MS F-Value p-Value
Model511,927.12385.411.190.002
Lineal33065.31021.84.790.034
Time1797.6797.63.740.089
Curr. Dens.11435.41435.46.730.032
H2SO4 Conc.1832.3832.33.900.084
Cuadratic17308.87308.834.290.000
Time × Time17308.87308.834.290.000
Interaction of 2 factors11552.91552.97.280.027
Time × H2SO4 Conc.11552.91552.97.280.027
Error81705.4213.2
Lack-of-Fit3745.2248.41.290.373
Pure error5960.2192.0
Total1313,632.5
S = 14.6004 R-sq(adj) = 79.67%
R-sq = 87.49% R-sq(pre) = 50.99%
Table 7. Corrosion parameters of the CPPC of AA6063 before and after the anodizing process exposed to 3.5 wt.% NaCl solution.
SampleEcorr
(V vs. SCE)
EA–C
(V vs. SCE)
jpass
(A/cm2)
jCorr
(A/cm2)
Hysteresis
AA6063−0.751−0.880---1.91 × 10⁻⁷Positive
No. 1−0.3140.4992.01 × 10−94.65 × 10⁻¹⁰Negative
No. 9−0.3440.6114.13 × 10−95.57 × 10⁻¹¹Negative
Optimized−0.2380.5401.21 × 10−106.69 × 10⁻¹³Negative
Disclaimer/Publisher’s Note: The statements, opinions and data contained in all publications are solely those of the individual author(s) and contributor(s) and not of MDPI and/or the editor(s). MDPI and/or the editor(s) disclaim responsibility for any injury to people or property resulting from any ideas, methods, instructions or products referred to in the content.