1. Introduction
Y
2O
3, as a ceramic material, demonstrates a high melting point (approximately 2700 K) [
1], chemical stability in various reactive environments, and low thermal conductivity (around 27 W/(m·K) at 300 K) [
2], endowing it with exceptional resistance to plasma erosion. As a result, it is widely used in high-temperature applications such as thermal barrier coatings for gas turbines, protective films in nuclear reactors, and corrosion-resistant layers in semiconductor equipment [
3,
4,
5]. In semiconductor etching processes, the inner walls of the chamber are exposed to highly corrosive halogen-based plasma (e.g., CF
4, Cl
2). To protect devices from erosion and contaminant formation, numerous oxide ceramics such as Al
2O
3 and SiO
2 are employed as plasma-resistant inner wall materials [
6,
7,
8,
9]. However, due to increased power applications within plasma equipment, Al
2O
3 or SiO
2 coatings are prone to rapid corrosion, leading to particle contamination that shortens equipment lifespan and induces wafer defects [
10,
11]. Owing to its excellent chemical inertness, low sputtering yield, and high resistance to halogen plasma erosion, Y
2O
3 coating is considered as an ideal protective material for the inner walls of semiconductor etching chambers [
12,
13,
14].
Common methods for preparing Y
2O
3 coatings include chemical vapor deposition (CVD), physical vapor deposition (PVD), and thermal plasma spraying [
15,
16]. Vapor deposition techniques often suffer from low production rates and involve complex processes [
17,
18]. In contrast, plasma spraying is considered as an effective method for producing high-performance Y
2O
3 coatings, owing to its high deposition rate and relatively simple preparation process [
19,
20]. Related studies have been reported by researchers worldwide. For instance, the authors of reference [
21] employed atmospheric plasma spraying (APS) to fabricate Y
2O
3 coatings and found that lower porosity significantly enhances corrosion resistance. Similarly, the authors of reference [
22] produced Y
2O
3 coatings on graphite substrates using APS, characterizing the coatings’ phase composition, microstructure, and thermal stability. Their results demonstrated that dense, well-adhered coatings can be deposited at a power of 24 kW [
22].
However, using APS technology to prepare Y
2O
3 coatings, the predominant use of micron-sized powders often results in coatings with microcracks and high porosity, which limits their performance in highly corrosive plasma environments [
23,
24,
25,
26]. In contrast, Suspension Plasma Spray (SPS) emerges as a highly promising alternative. Since the feeding process in SPS is based on a suspension, it is not constrained by the shape of the powder particles [
27]. Moreover, it enables the introduction of nano-sized particles into the plasma flame via the suspension, thereby facilitating the deposition of dense, nano-structured Y
2O
3 coatings with low porosity.
Table 1 provides a detailed comparison of the APS and SPS spraying methods [
28,
29,
30].
In the SPS method, deionized water is typically employed as the solvent for the suspension, serving as a carrier for the solute particles during the spraying process. Upon being injected into the plasma flame together with the particles, it absorbs heat and evaporates [
31,
32,
33,
34]. Subsequently, the particles are heated to melt and carried by the gas flow within the plasma towards the substrate. Upon impact with the substrate surface, they cool and adhere to form the coating [
35,
36,
37]. However, during their flight, the molten particles are influenced by the gas flow, causing some to distribute around the periphery of the plasma flame rather than its central region. Particles distributed at the periphery of the flame experience less heating compared to those in the central region, potentially preventing them from melting sufficiently [
38,
39,
40]. Nevertheless, these particles will ultimately impact the substrate surface. This leads to increased porosity and surface roughness within the coating, ultimately compromising its corrosion resistance within halogen plasma environments.
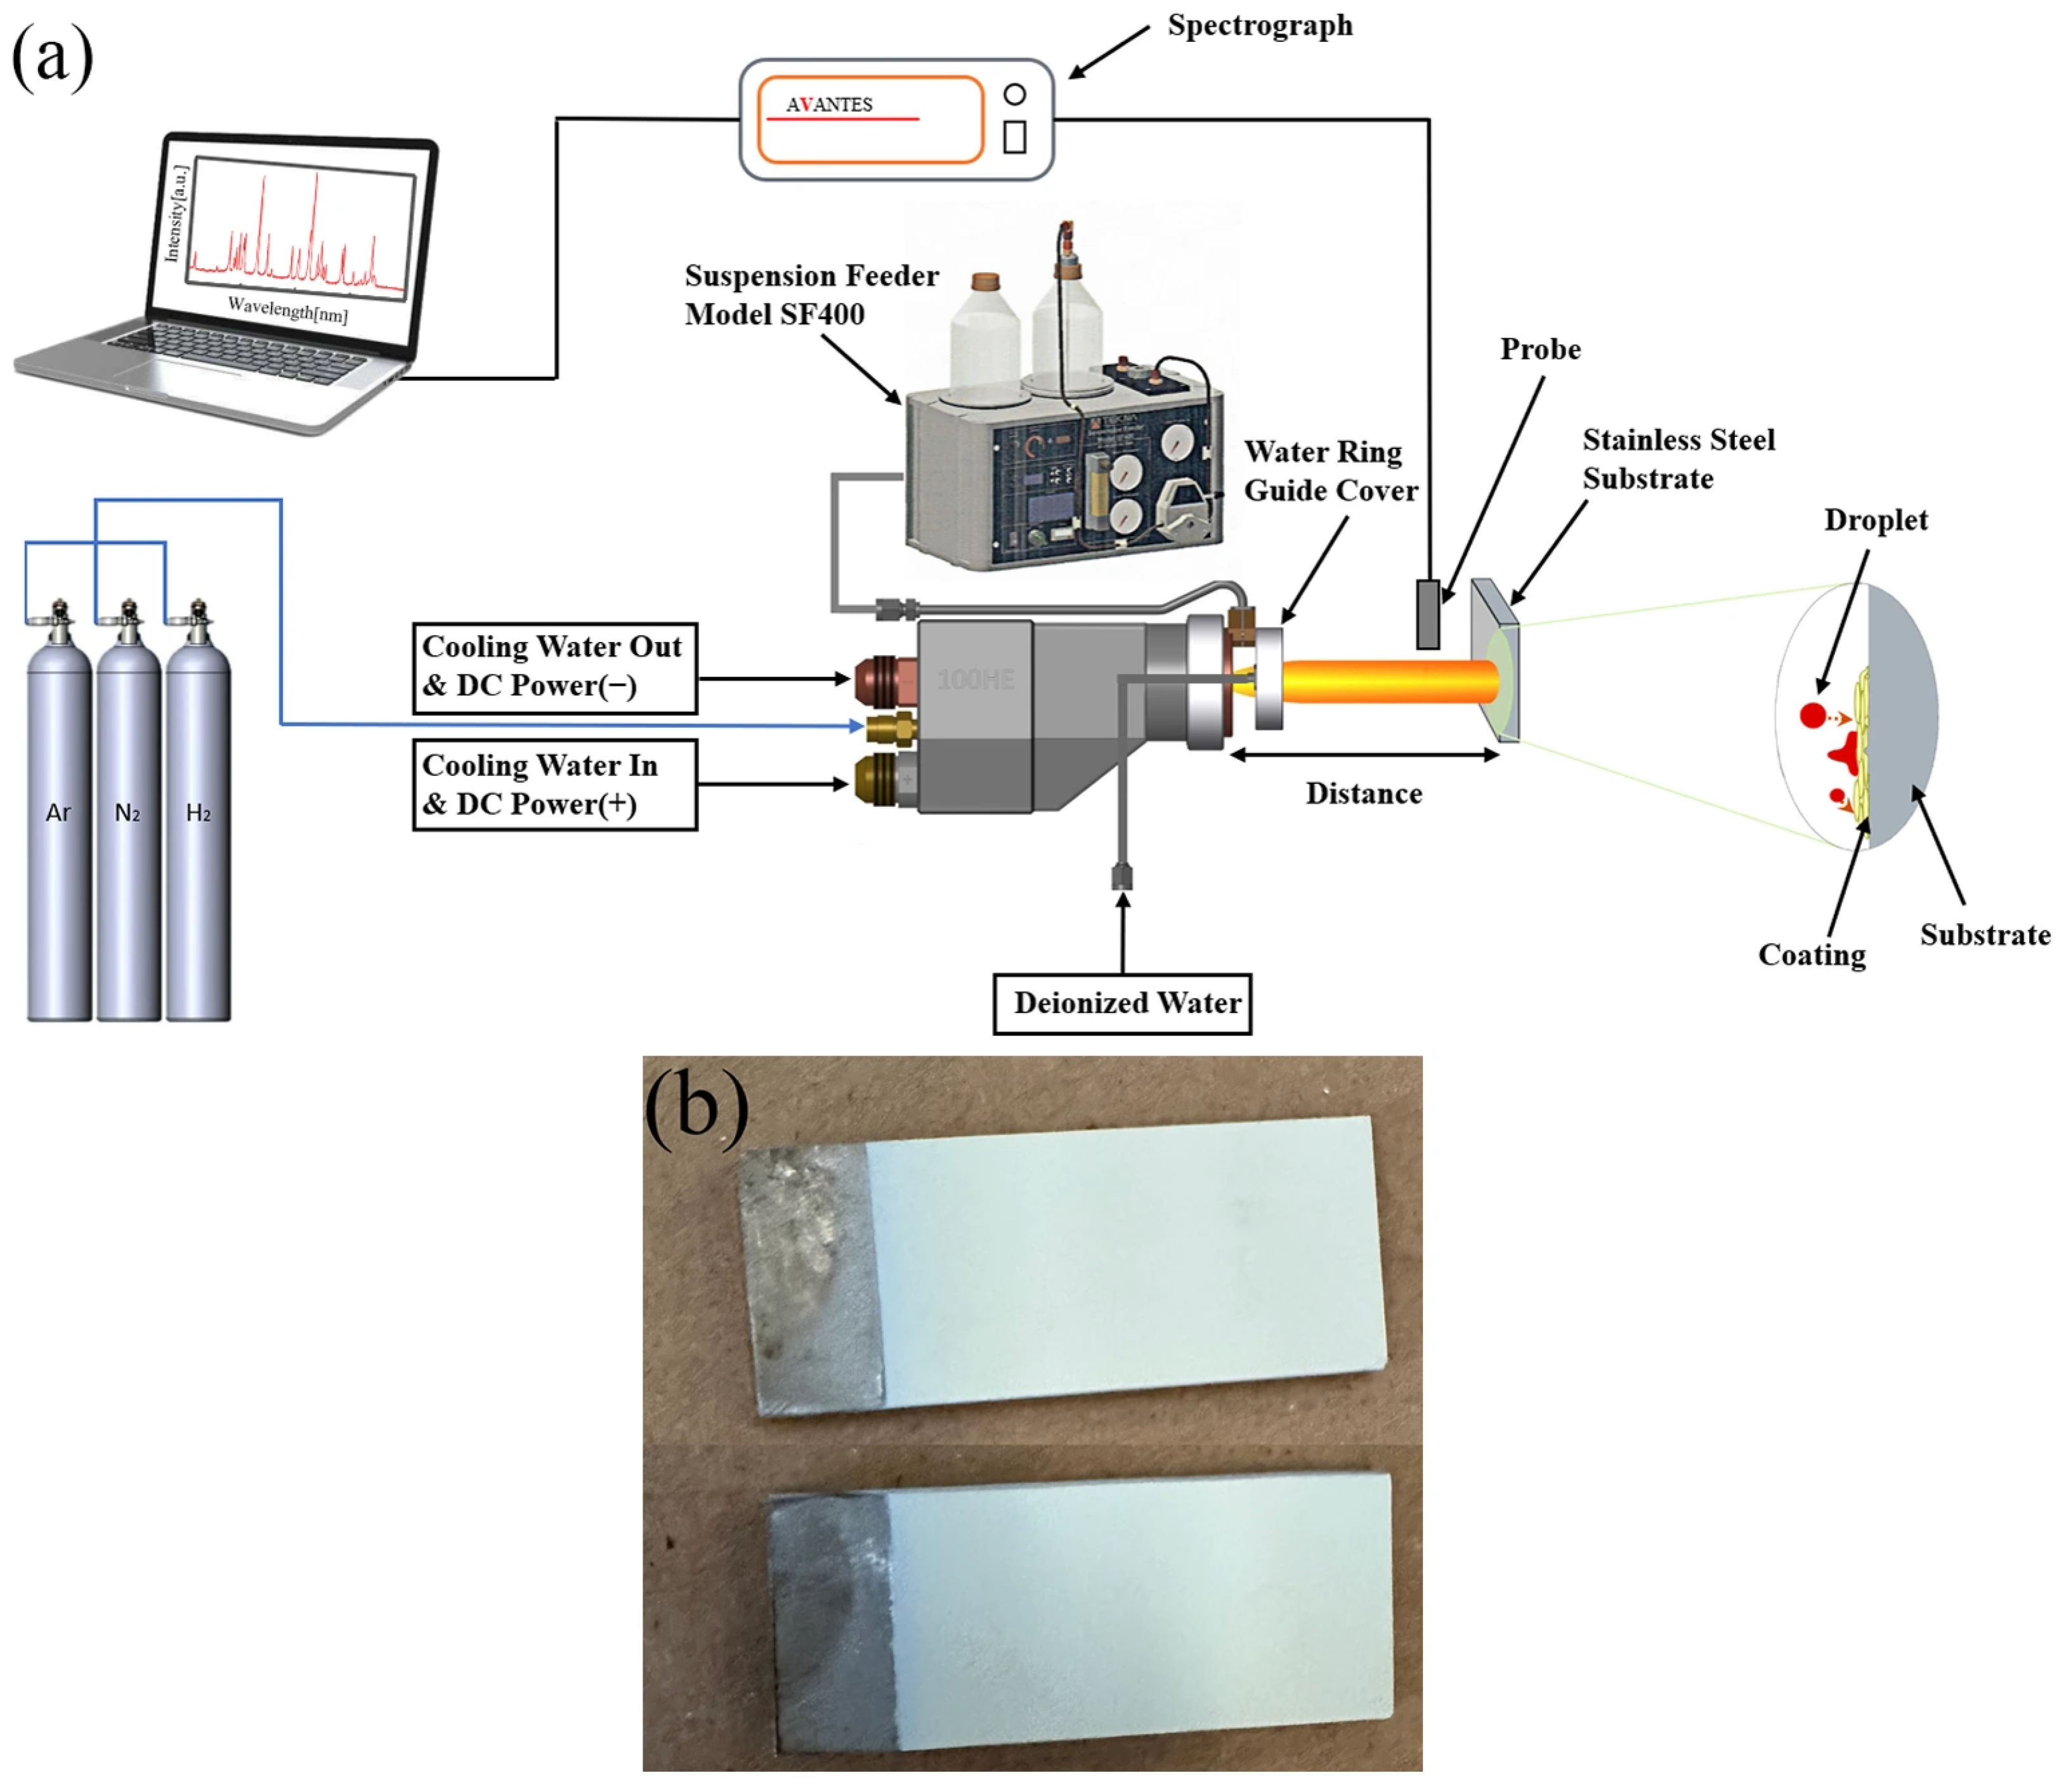
In this experiment, a water ring guide cover was installed at the outlet of the plasma torch, which directs deionized water toward the center of the plasma flame. This configuration helps to concentrate Y2O3 particles toward the core of the flame, thereby improving their heating and melting. However, excessive water injection into the flame can lead to significant heat absorption, reducing the thermal energy available for melting Y2O3 particles and potentially degrading coating performance. Thus, the ratio of the water ring flow rate to the suspension feed rate is a critical parameter influencing coating quality in the SPS process. Nevertheless, few studies have investigated the effect of this ratio on the properties of Y2O3 coatings prepared by SPS. In this study, Y2O3 coatings were deposited on stainless steel substrates using SPS, and the microstructure, porosity, adhesion strength, and surface roughness of coatings fabricated with different water ring flow rate ratios were analyzed. The findings are expected to provide practical guidance for coating manufacturing, ultimately extending the service life of etching chambers and improving wafer yield.
The remainder of this article is structured as follows. The experimental procedure is described in
Section 2. Results and discussion are given in
Section 3. In
Section 4, we give our conclusions.
3. Results and Discussion
Figure 2 displays the plasma spectra acquired before and after powder feeding. The spectrum recorded prior to powder injection shows characteristic atomic emission lines of argon, nitrogen, and hydrogen. In addition, oxygen atomic lines are observed at 746.9 nm, 821.6 nm, and 868.1 nm, which are likely attributable to the dissociation of oxygen and water vapour from the ambient air. In contrast, the spectrum obtained after powder feeding exhibits, besides the lines from the plasma-forming gases and oxygen, numerous new emission lines in the short-wavelength ultraviolet and visible regions. Most of these new lines are emitted by excited yttrium atoms. Notably, the two most intense lines in the visible region, located at 598.9 nm and 615.1 nm, along with a prominent line at 437.8 nm—which serves as a key analytical line for yttrium ions—are clearly observed. The emergence of these yttrium-related lines, particularly the line at 437.8 nm, provides direct evidence of the excitation of yttrium species and confirms the presence of Y
2O
3 in plasma. A full quantitative diagnosis of the plasma characteristics (e.g., temperature, species concentration) was beyond the scope of this coating-focused study but represents an interesting avenue for future fundamental research.
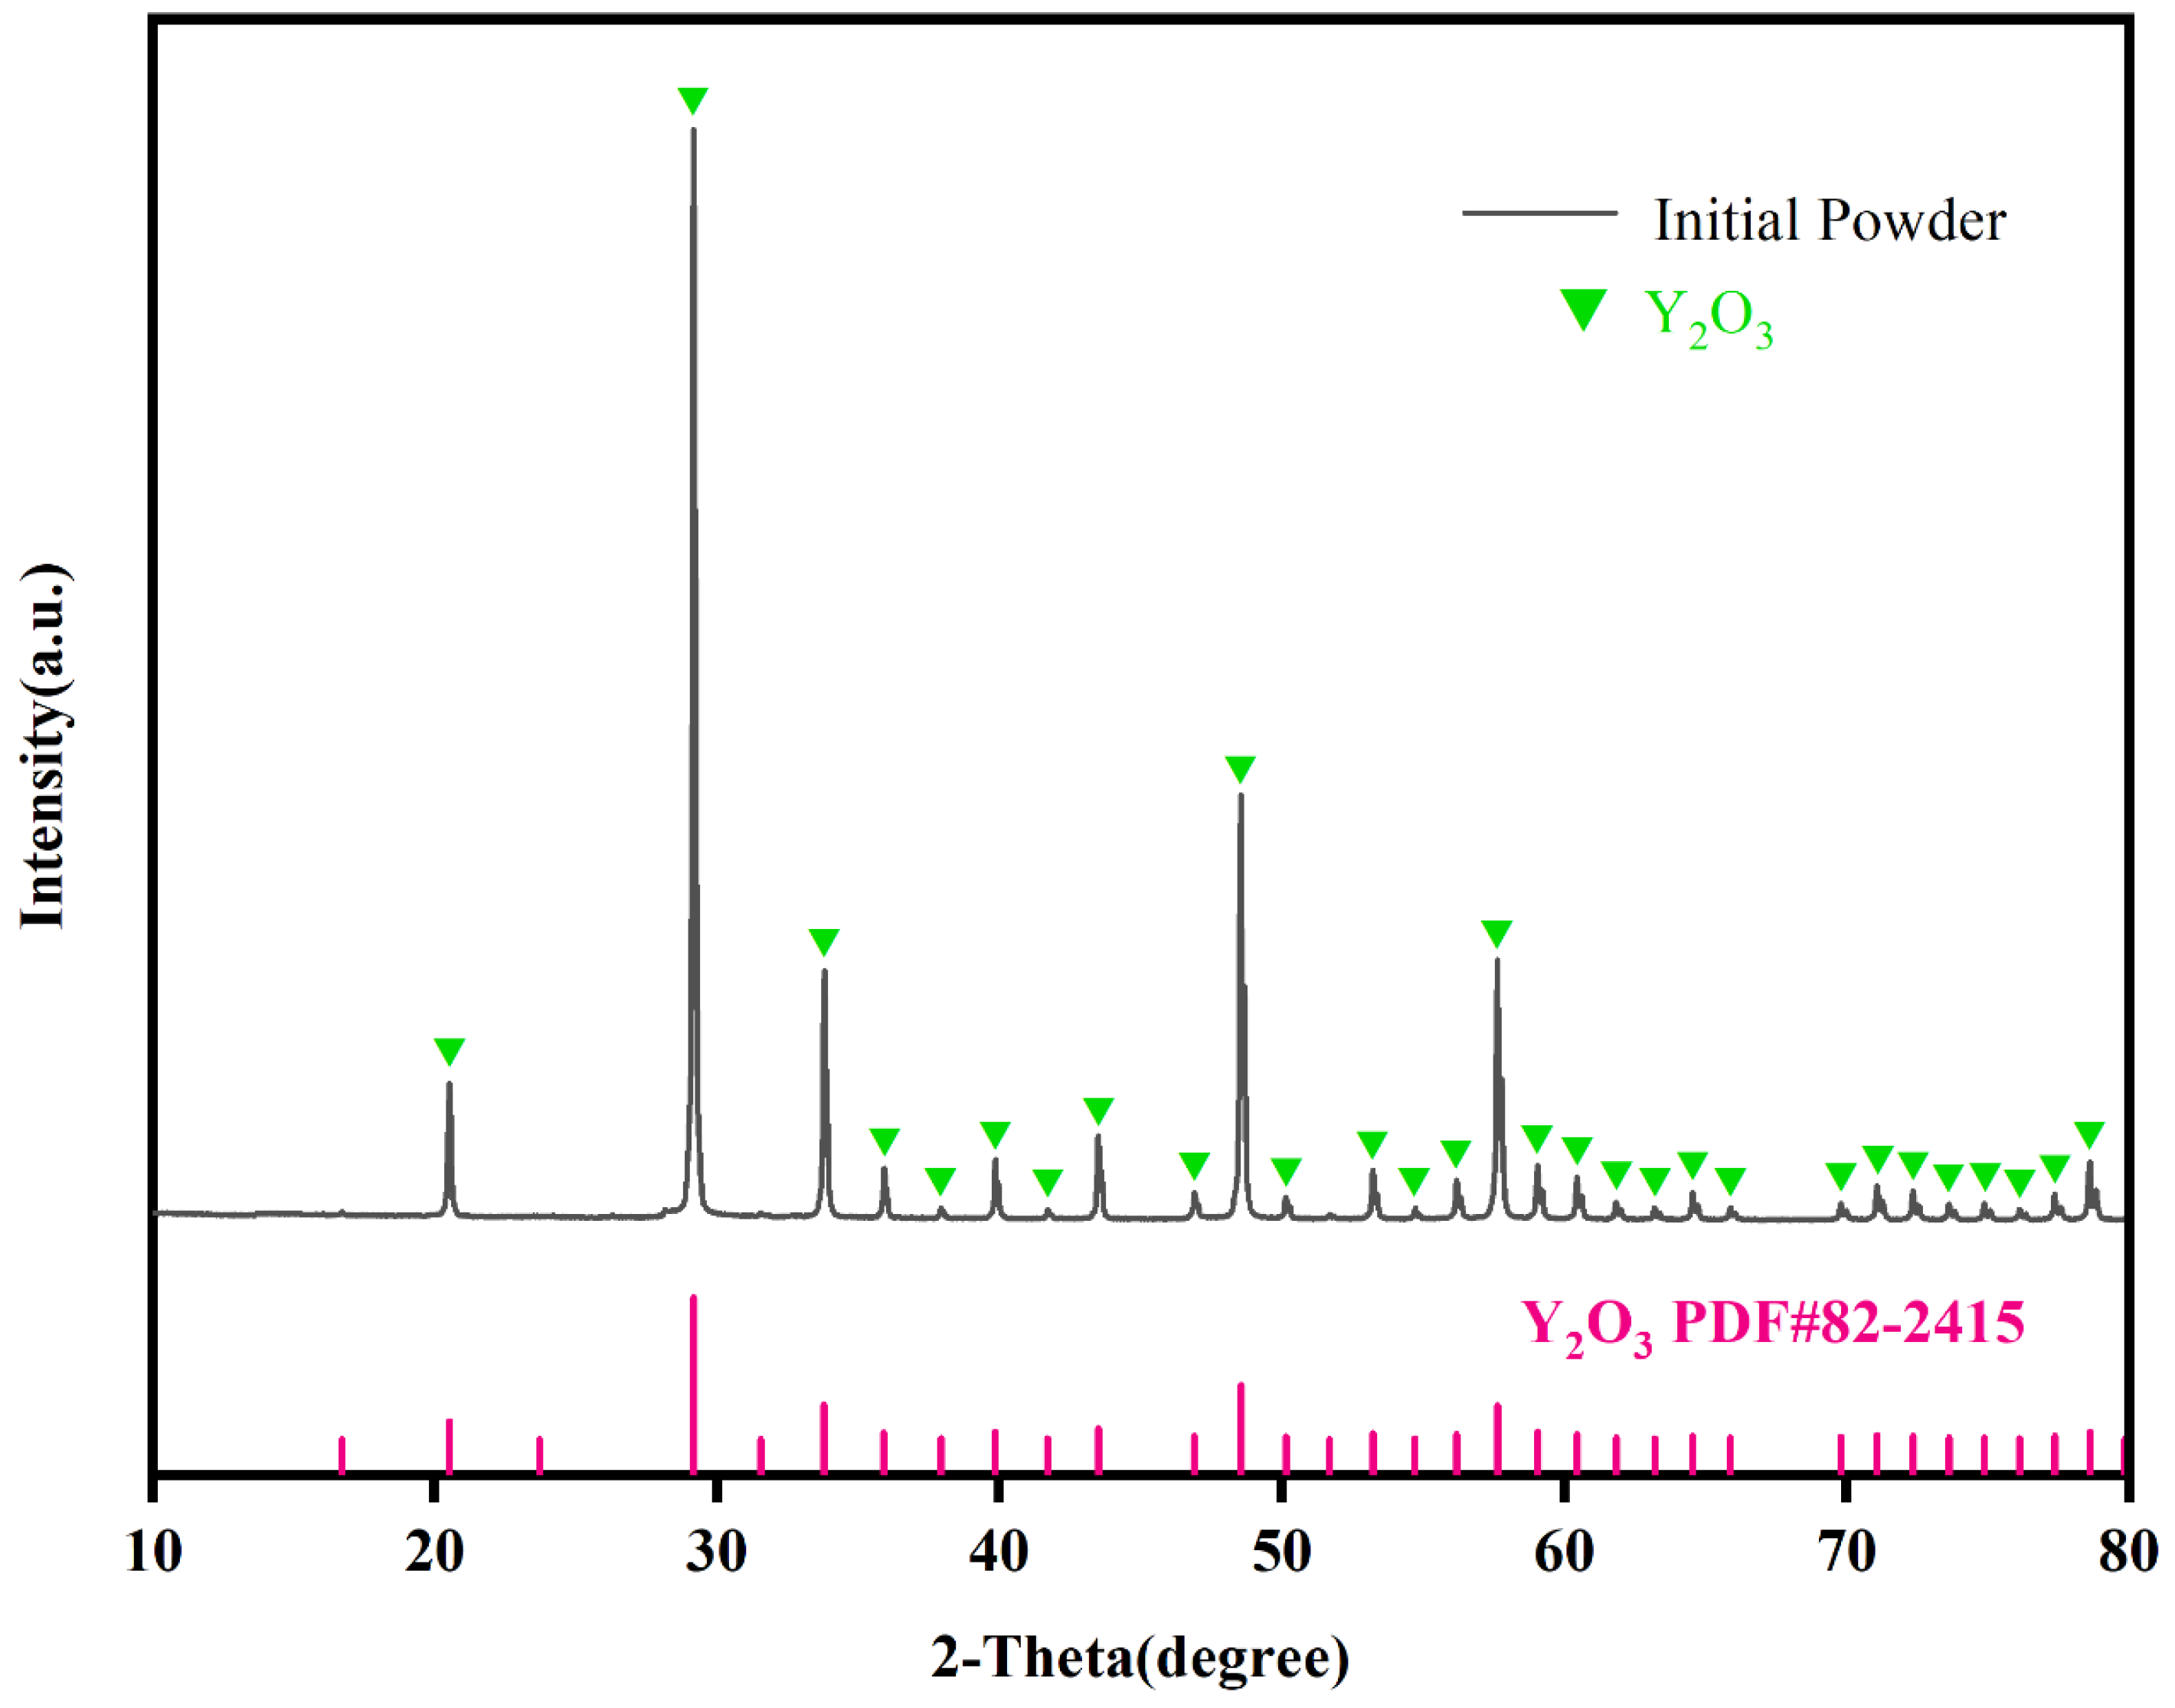
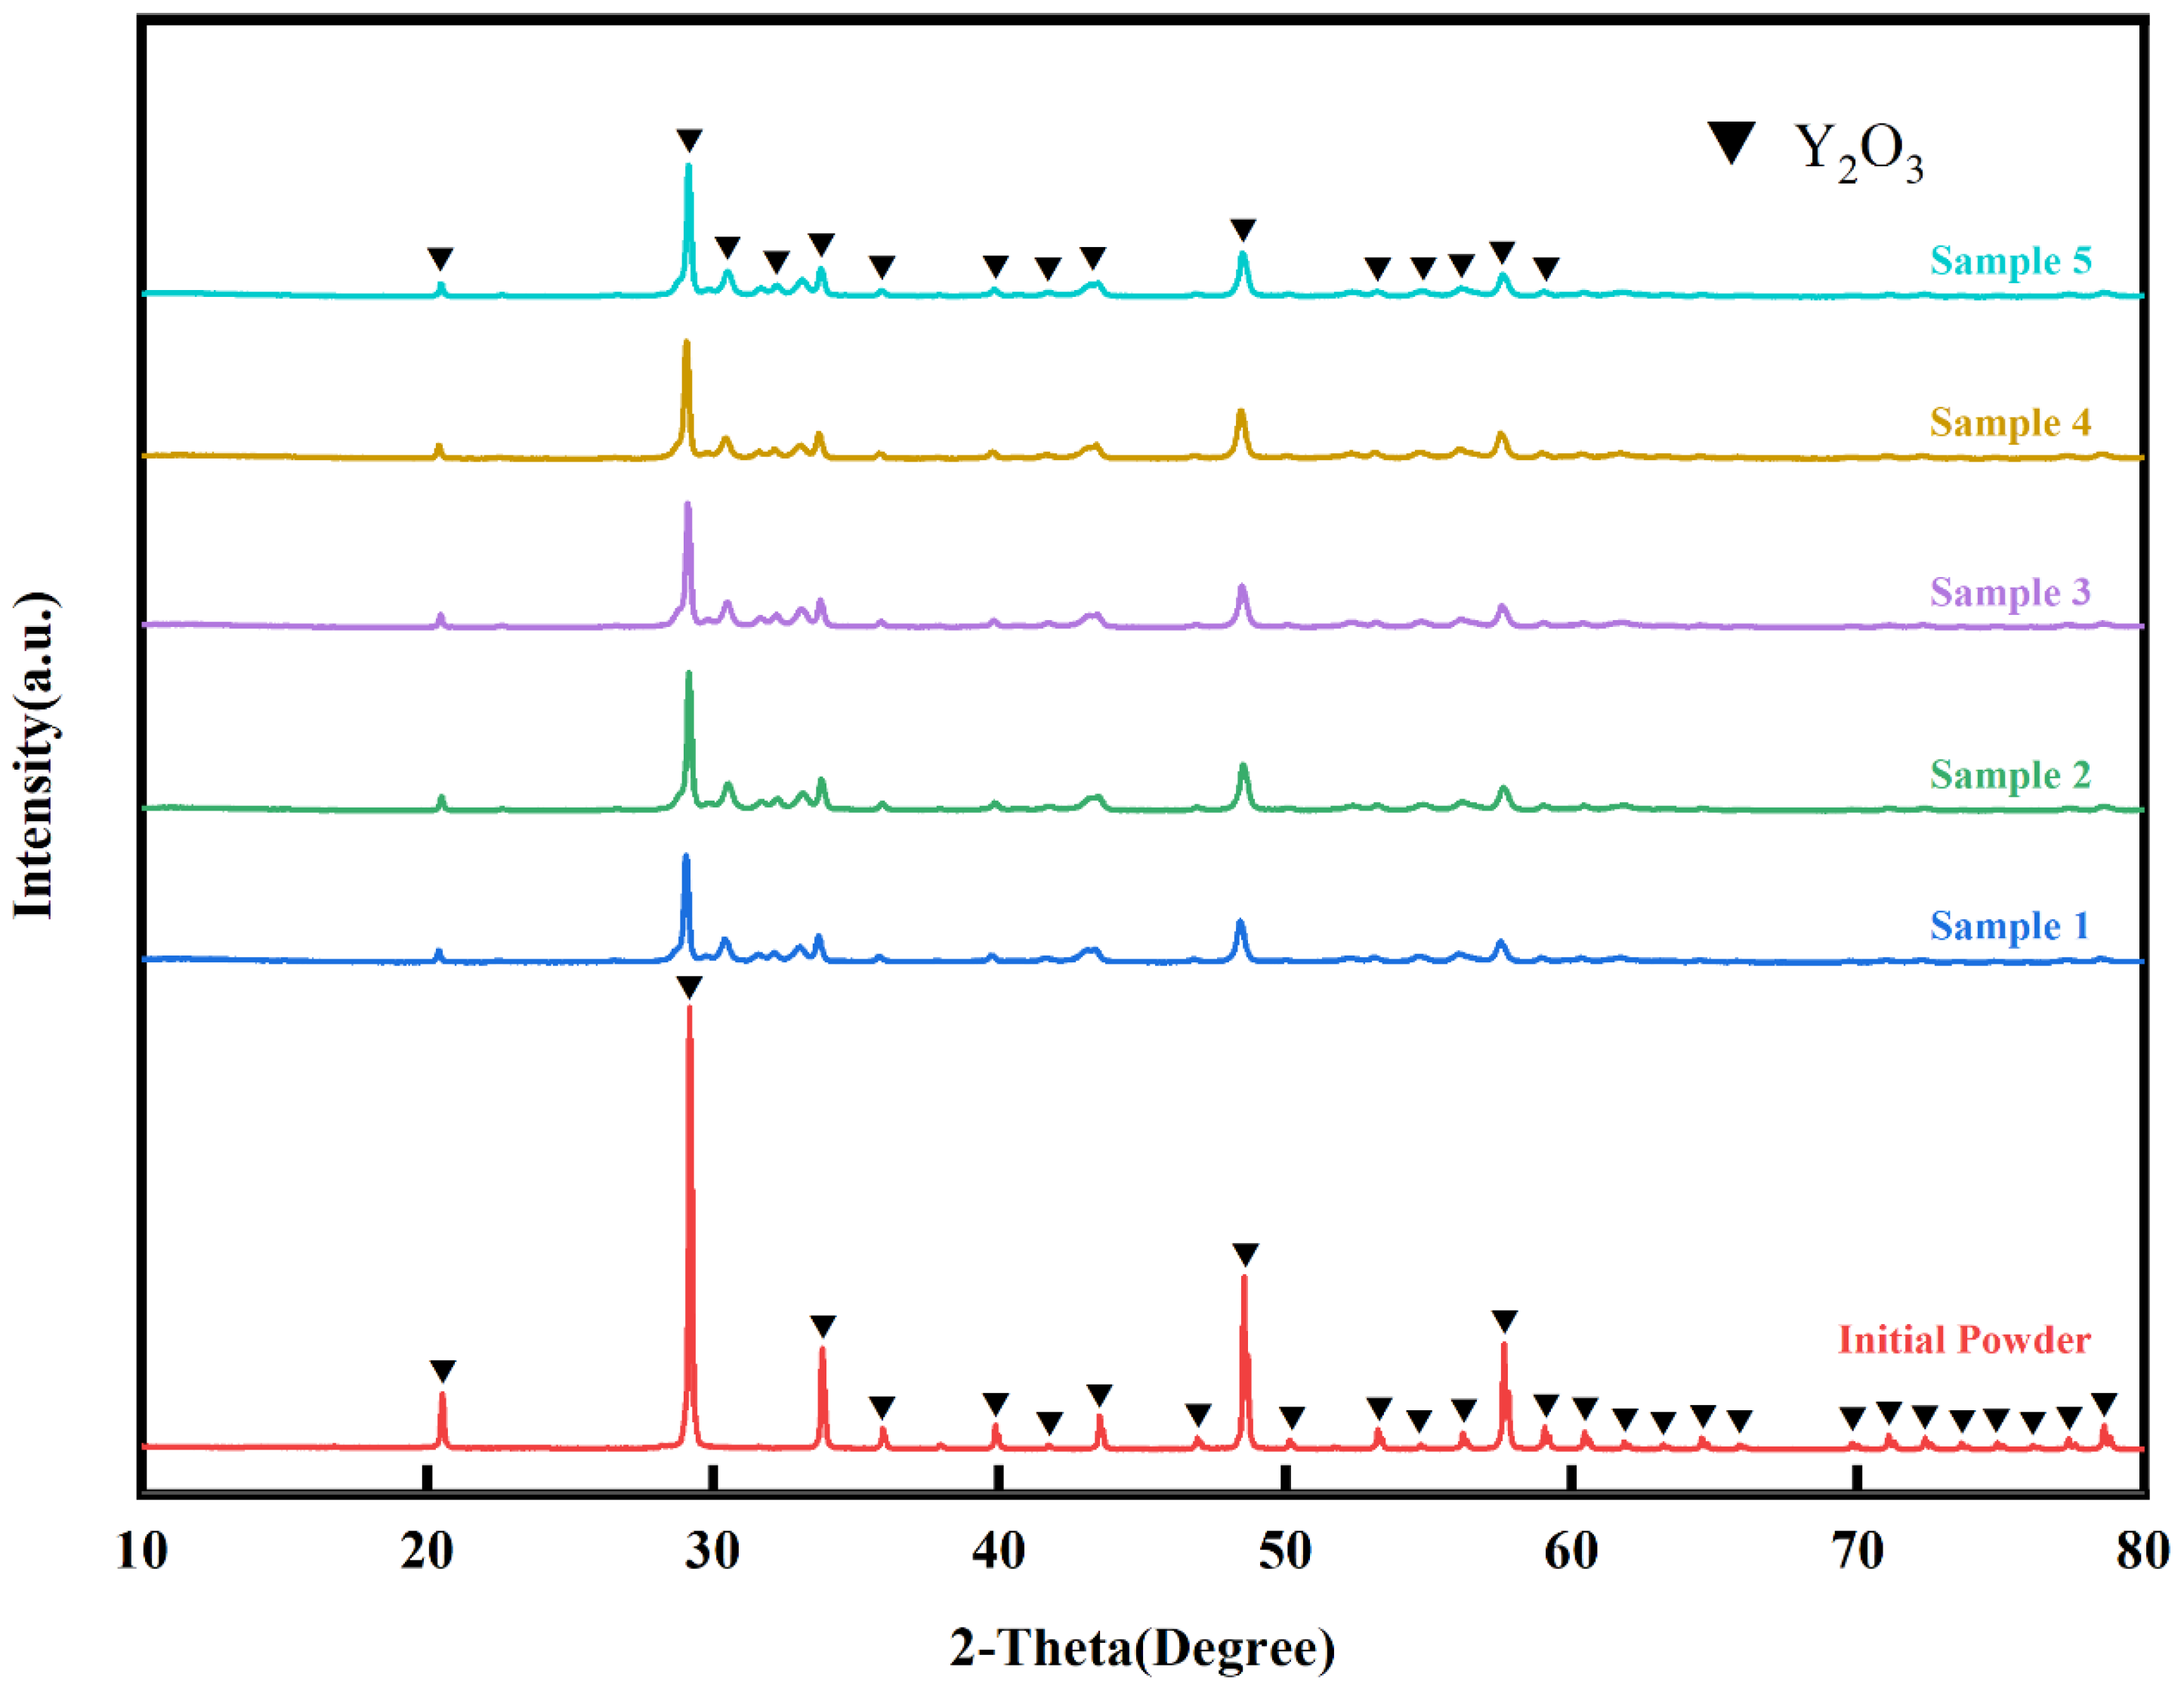
Figure 3 and
Figure 4 show the XRD patterns of the initial Y
2O
3 powder and the SPS coating, respectively. It can be observed that both the powder and the coating consist primarily of the cubic phase of Y
2O
3, indicating that the phase composition remains essentially unchanged after the spraying process, which is attributed to the high phase stability of the material itself.
The diffraction peaks of the initial powder are noticeably sharper and more intense than those of the coating. This difference can be explained by thermal and mechanical processing of the particles during suspension plasma spraying. When the particles are injected into the plasma jet, they are heated, melted, and subsequently accelerated onto the substrate surface. Upon impact, they undergo rapid flattening, deformation, and solidification. This process results in significant plastic deformation and grain refinement within the splats, leading to a reduction in diffraction peak intensity and a noticeable broadening of the peaks in the coating.
The estimated crystallite sizes, calculated using the Scherrer equation from the (222) diffraction peak, are summarized in
Table 4, where
β denotes full width at half maximum (FWHM). All coatings exhibit a nanocrystalline structure, with crystallite sizes confined to a narrow range of approximately 37.6 to 39.2 nm. The relatively small variation suggests that the water ring flow rate ratio, within the investigated window, is not a primary factor governing crystal growth. Instead, the nanocrystalline nature is predominantly a consequence of the rapid solidification intrinsic to the SPS process, which imposes a high quenching rate on the molten droplets, suppressing extensive crystal growth.
The XRD analysis (
Figure 3 and
Figure 4) not only confirms the phase purity but also provides an indirect clue about the crystal perfection. Therefore, the broadening of the diffraction peaks is attributed to a combination of fine crystallite size and microstrain within the coatings. The latter is particularly interesting, as it likely originates from the non-equilibrium nature of the SPS process. The extreme thermal gradients and rapid solidification can introduce point defects, such as oxygen vacancies and cation interstitials, which cause localized lattice distortions [
41,
42,
43].
In comparison to well-annealed, bulk Y
2O
3, our coatings are thus expected to contain a higher concentration of such defects. Drawing parallels with similar oxides like Sc
2O
3 and Al
2O
3 [
41], where point defects are known to strongly influence thermal transport, it is plausible that the defects in our Y
2O
3 coatings would also act as effective phonon scattering sites. This suggests that the SPS process, through the introduction of point defects, may inherently contribute to achieving a lower intrinsic thermal conductivity, which is a desirable property for thermal barrier applications. A definitive quantification of these defects, however, requires future dedicated study.
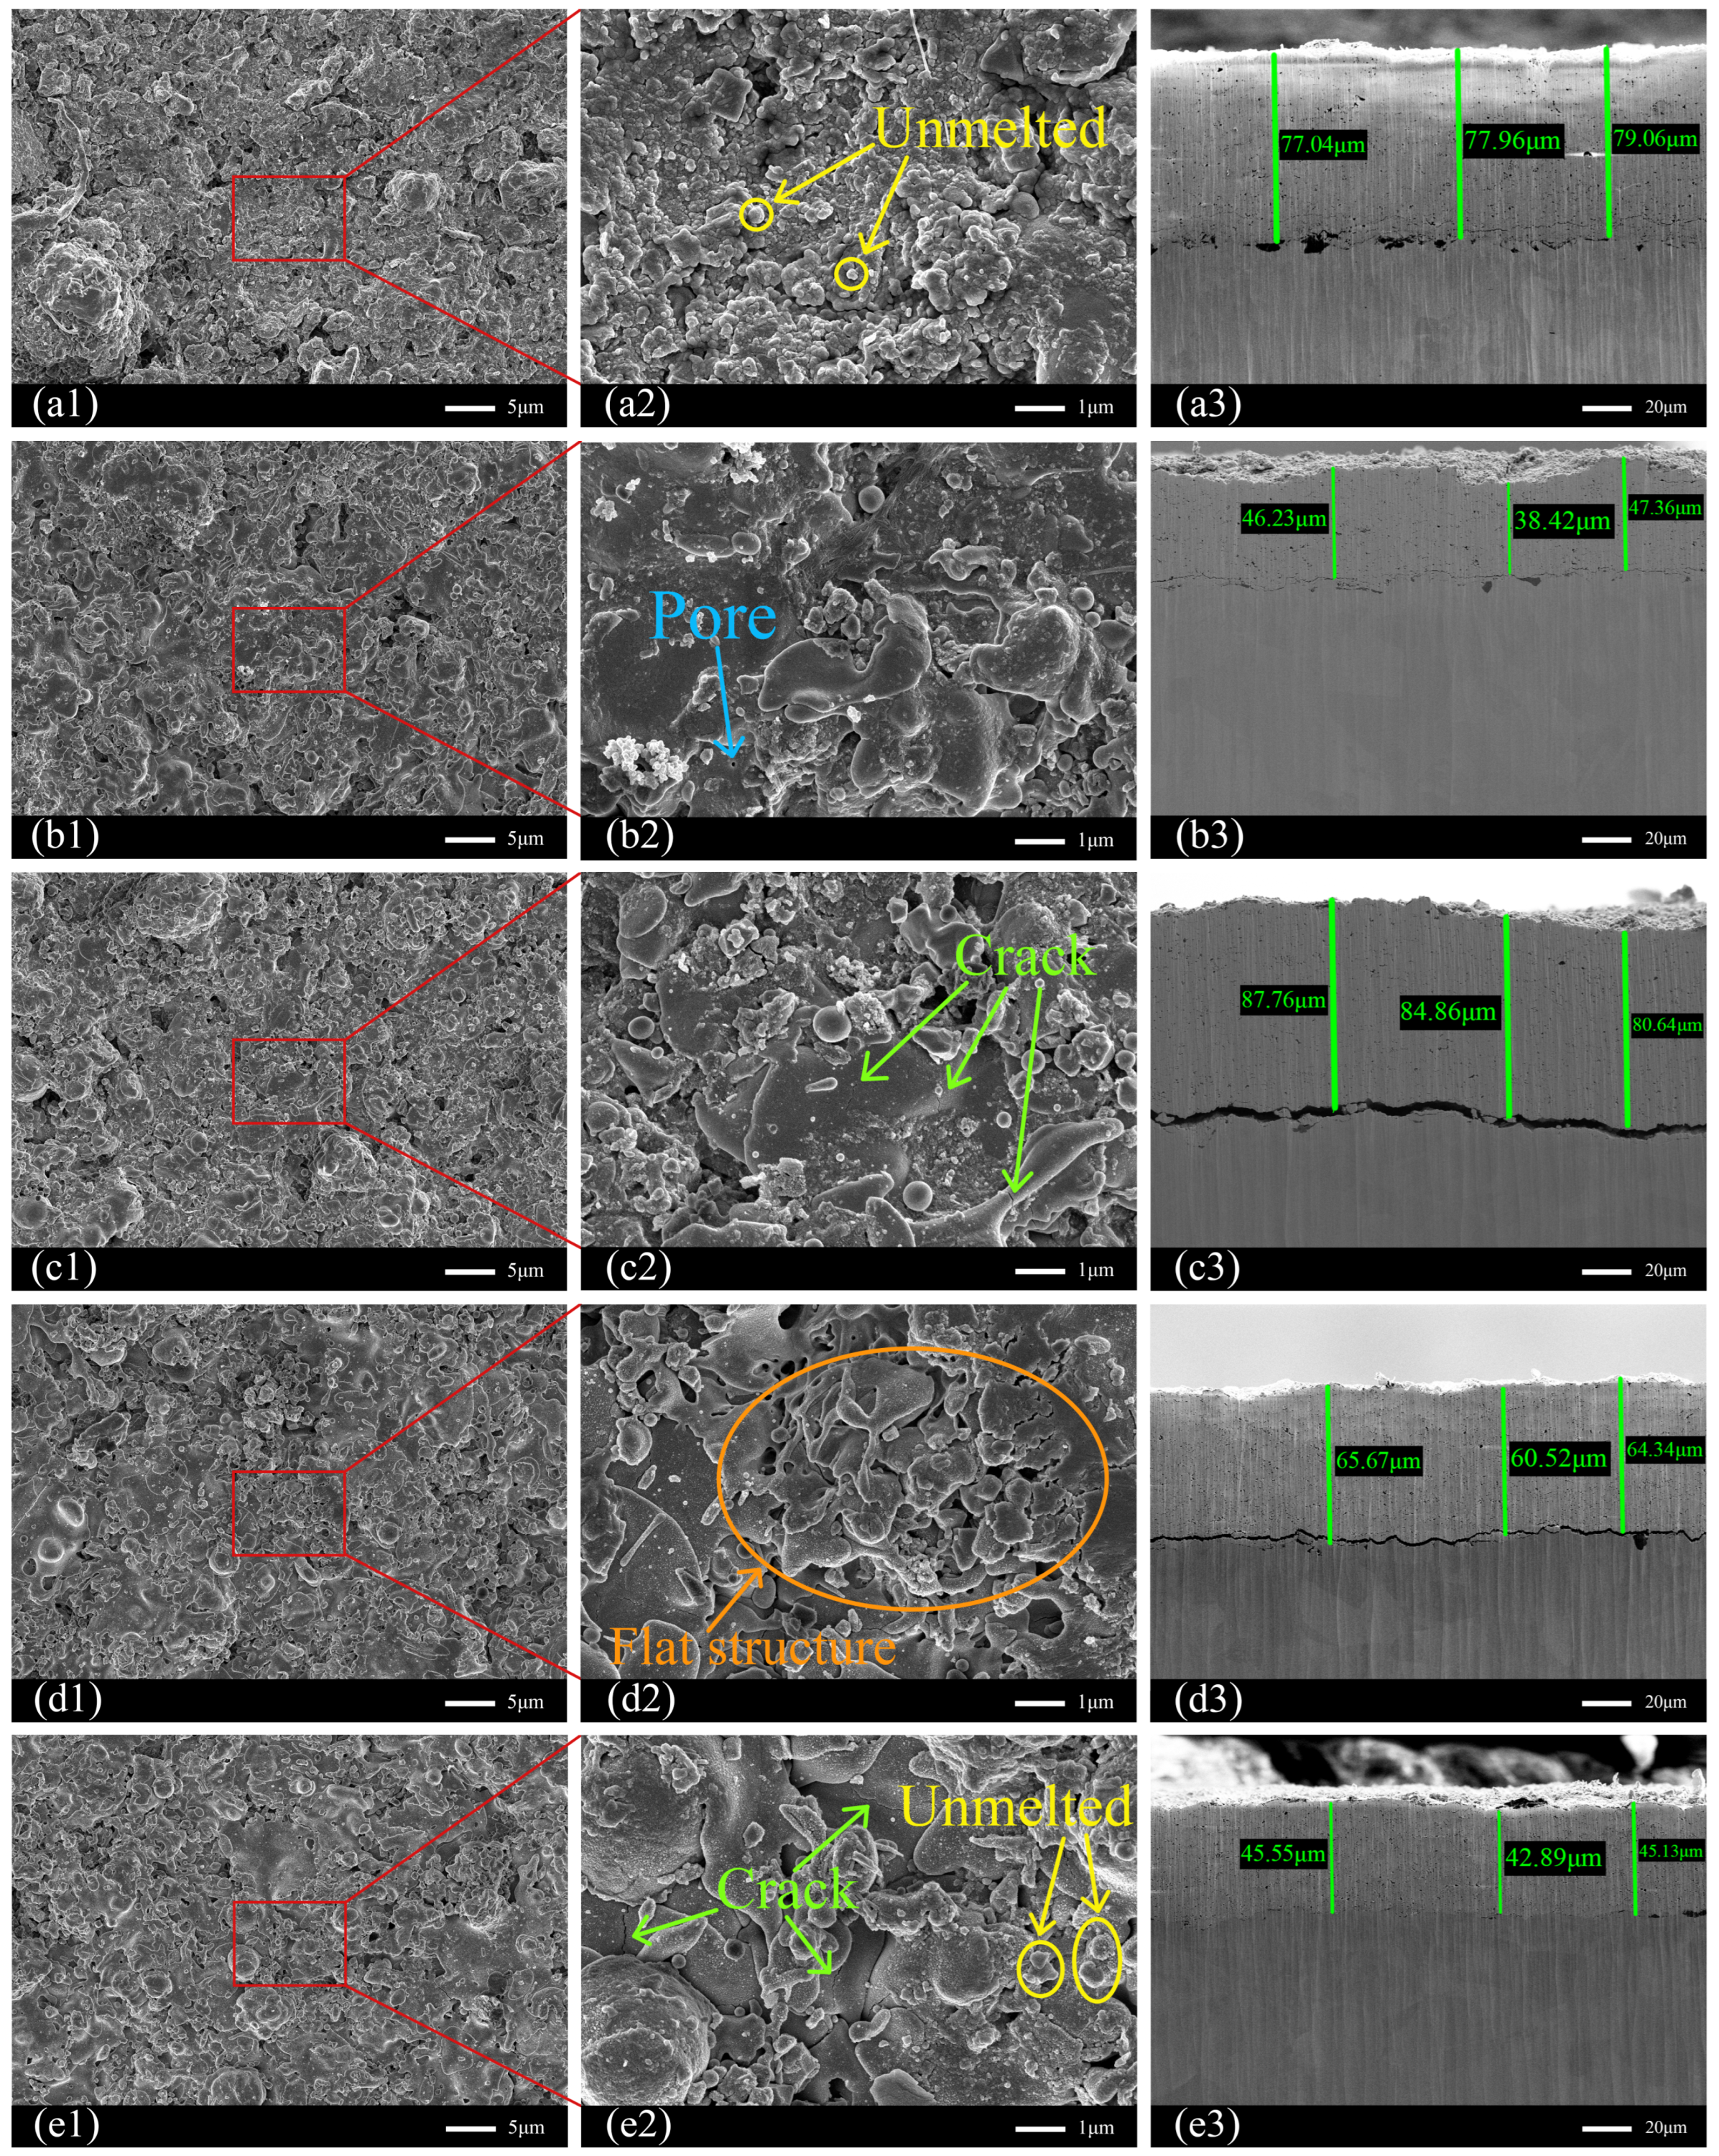
Figure 5 presents the surface and cross-sectional morphologies of the five coating samples (Samples 1–5), with
Figure 5(a–e) corresponding to Samples 1 to 5, respectively. Subfigures labeled a1 to e1 show the surface morphologies of each sample,
Figure 5(a2–e2) display higher-magnification views of the corresponding surface regions, and
Figure 5(a3–e3) depict the cross-sectional microstructures of samples 1 to 5.
Observation of the surface morphologies reveals that all samples exhibit varying degrees of porosity, microcracks, fully molten regions, and partially unmelted particles. During the spraying process, particles that fully absorb heat within the plasma flame become completely molten prior to impacting the substrate. Upon impact, these particles spread extensively, forming smooth, flat, and densely layered splat structures. In contrast, particles that absorb insufficient heat may retain a solid core despite having a molten surface. When such particles strike the substrate, only limited spreading occurs, resulting in the formation of raised, partially unmelted particles on the coating surface.
Sample 1 (Water Ring Flow Rate Ratio: 79.66%) exhibits a considerable number of distinctly raised unmelted particles, which is likely attributable to the relatively high powder feed rate combined with the comparatively low water ring flow rate. An increase in the powder feed rate raises the number of Y
2O
3 particles and the amount of water introduced into the plasma flame per unit time. The higher particle injection rate reduces the average heat absorbed per particle, while the evaporation of additional water extracts more heat from the plasma, further diminishing the thermal energy available for each Y
2O
3 particle. Consequently, a significant proportion of particles in Sample 1 remained inadequately molten, resulting in the observed surface features (
Figure 5(a2)).
Compared to Sample 1 (Water Ring Flow Rate Ratio: 79.66%), Sample 2 (Water Ring Flow Rate Ratio: 85.45%) was prepared with the same water ring flow rate but a reduced powder feed rate. This resulted in fewer unmelted particles and the appearance of some lamellar flattened structures formed by fully molten particles impacting the substrate at high velocity. A small number of micropores could also be observed on the surface (
Figure 5(b2)).
Compared to Sample 1 (Water Ring Flow Rate Ratio: 79.66%), Sample 3 (Water Ring Flow Rate Ratio: 84.13%) exhibits a reduced feed rate coupled with an increased water ring rate, resulting in a higher proportion of water ring rate. Its surface displays more flake-like flattened structures alongside a small number of microcracks, whilst unmelted particles are markedly reduced. This transformation stems from the increased water ring rate, concentrating particle distribution, thereby facilitating more effective heating and melting (
Figure 5(c2)).
In contrast, Sample 4 (Water Ring Flow Rate Ratio: 82.09%) was fabricated with the same powder feed rate as Sample 1 (Water Ring Flow Rate Ratio: 79.66%) but with an increased water ring flow rate. Its surface showed a significant increase in lamellar flattened structures resulting from fully molten particles, along with a notable reduction in unmelted particles. Therefore, a higher water ring flow rate can alter the trajectory of particles injected into the plasma flame, narrowing their distribution and concentrating them more effectively within the central region of the flame. This promotes more efficient heating and melting of the particles in the high-temperature zone.
However, Sample 4 (Water Ring Flow Rate Ratio: 82.09%) also exhibited a greater number of larger pores compared to Sample 1 (Water Ring Flow Rate Ratio: 79.66%). This is attributed to the extensive splashing of fully molten droplets upon high-speed impact on the substrate, which can entrap gas or create voids within the flattened splats during solidification, leading to increased porosity (
Figure 5(d2)).
Compared to Sample 4 (Water Ring Flow Rate Ratio: 82.09%), both the powder feed rate and the water ring flow rate were further increased in Sample 5 (Water Ring Flow Rate Ratio: 80.28%). However, the surface of Sample 5 exhibited more pronounced cracks and a greater number of unmelted particles. This degradation in coating quality can be attributed to a reduced water ring flow rate ratio, which broadens the particle size distribution. Consequently, a significant proportion of particles is distributed within the low-temperature zone surrounding the plasma flame, preventing complete melting. This results in an increase in unmelted particles and the formation of cracks (
Figure 5(e2)).
Figure 5(a3,b3,c3,d3,e3) present the cross-sectional SEM morphologies of Samples 1 to 5, respectively. Three locations were randomly selected from each sample to mark the coating thickness, while
Table 5 presents the measured values, mean, and standard deviation for each sample’s thickness. The results indicate that the thickness of different samples exhibits some variation, but each sample exhibits relatively uniform thickness without significant local thickening or thinning. Furthermore, no horizontal or vertical cracks were observed within the coatings. No continuous oxide layer or contamination layer was detected at the coating-substrate interface of any sample.
However, noticeable separation between the coating and the substrate occurred in Samples 3 and 4. This delamination is likely attributable to the high spraying velocity. Under these conditions, molten particles impacting the substrate may not have cooled and solidified sufficiently before subsequent particles were deposited onto the surface. This rapid deposition process can prevent the timely release of thermal stresses generated within the coating, ultimately leading to interfacial detachment (
Figure 5(c3,d3)).
The porosity of the coatings was determined by randomly selecting ten locations within the cross-sectional SEM images of each sample, calculating the porosity at each point using image analysis, and then averaging the values to obtain the overall coating porosity. The adhesion strength of the coatings was measured via bond strength tests.
Table 6 presents test data on the relationship between process parameters and coating properties.
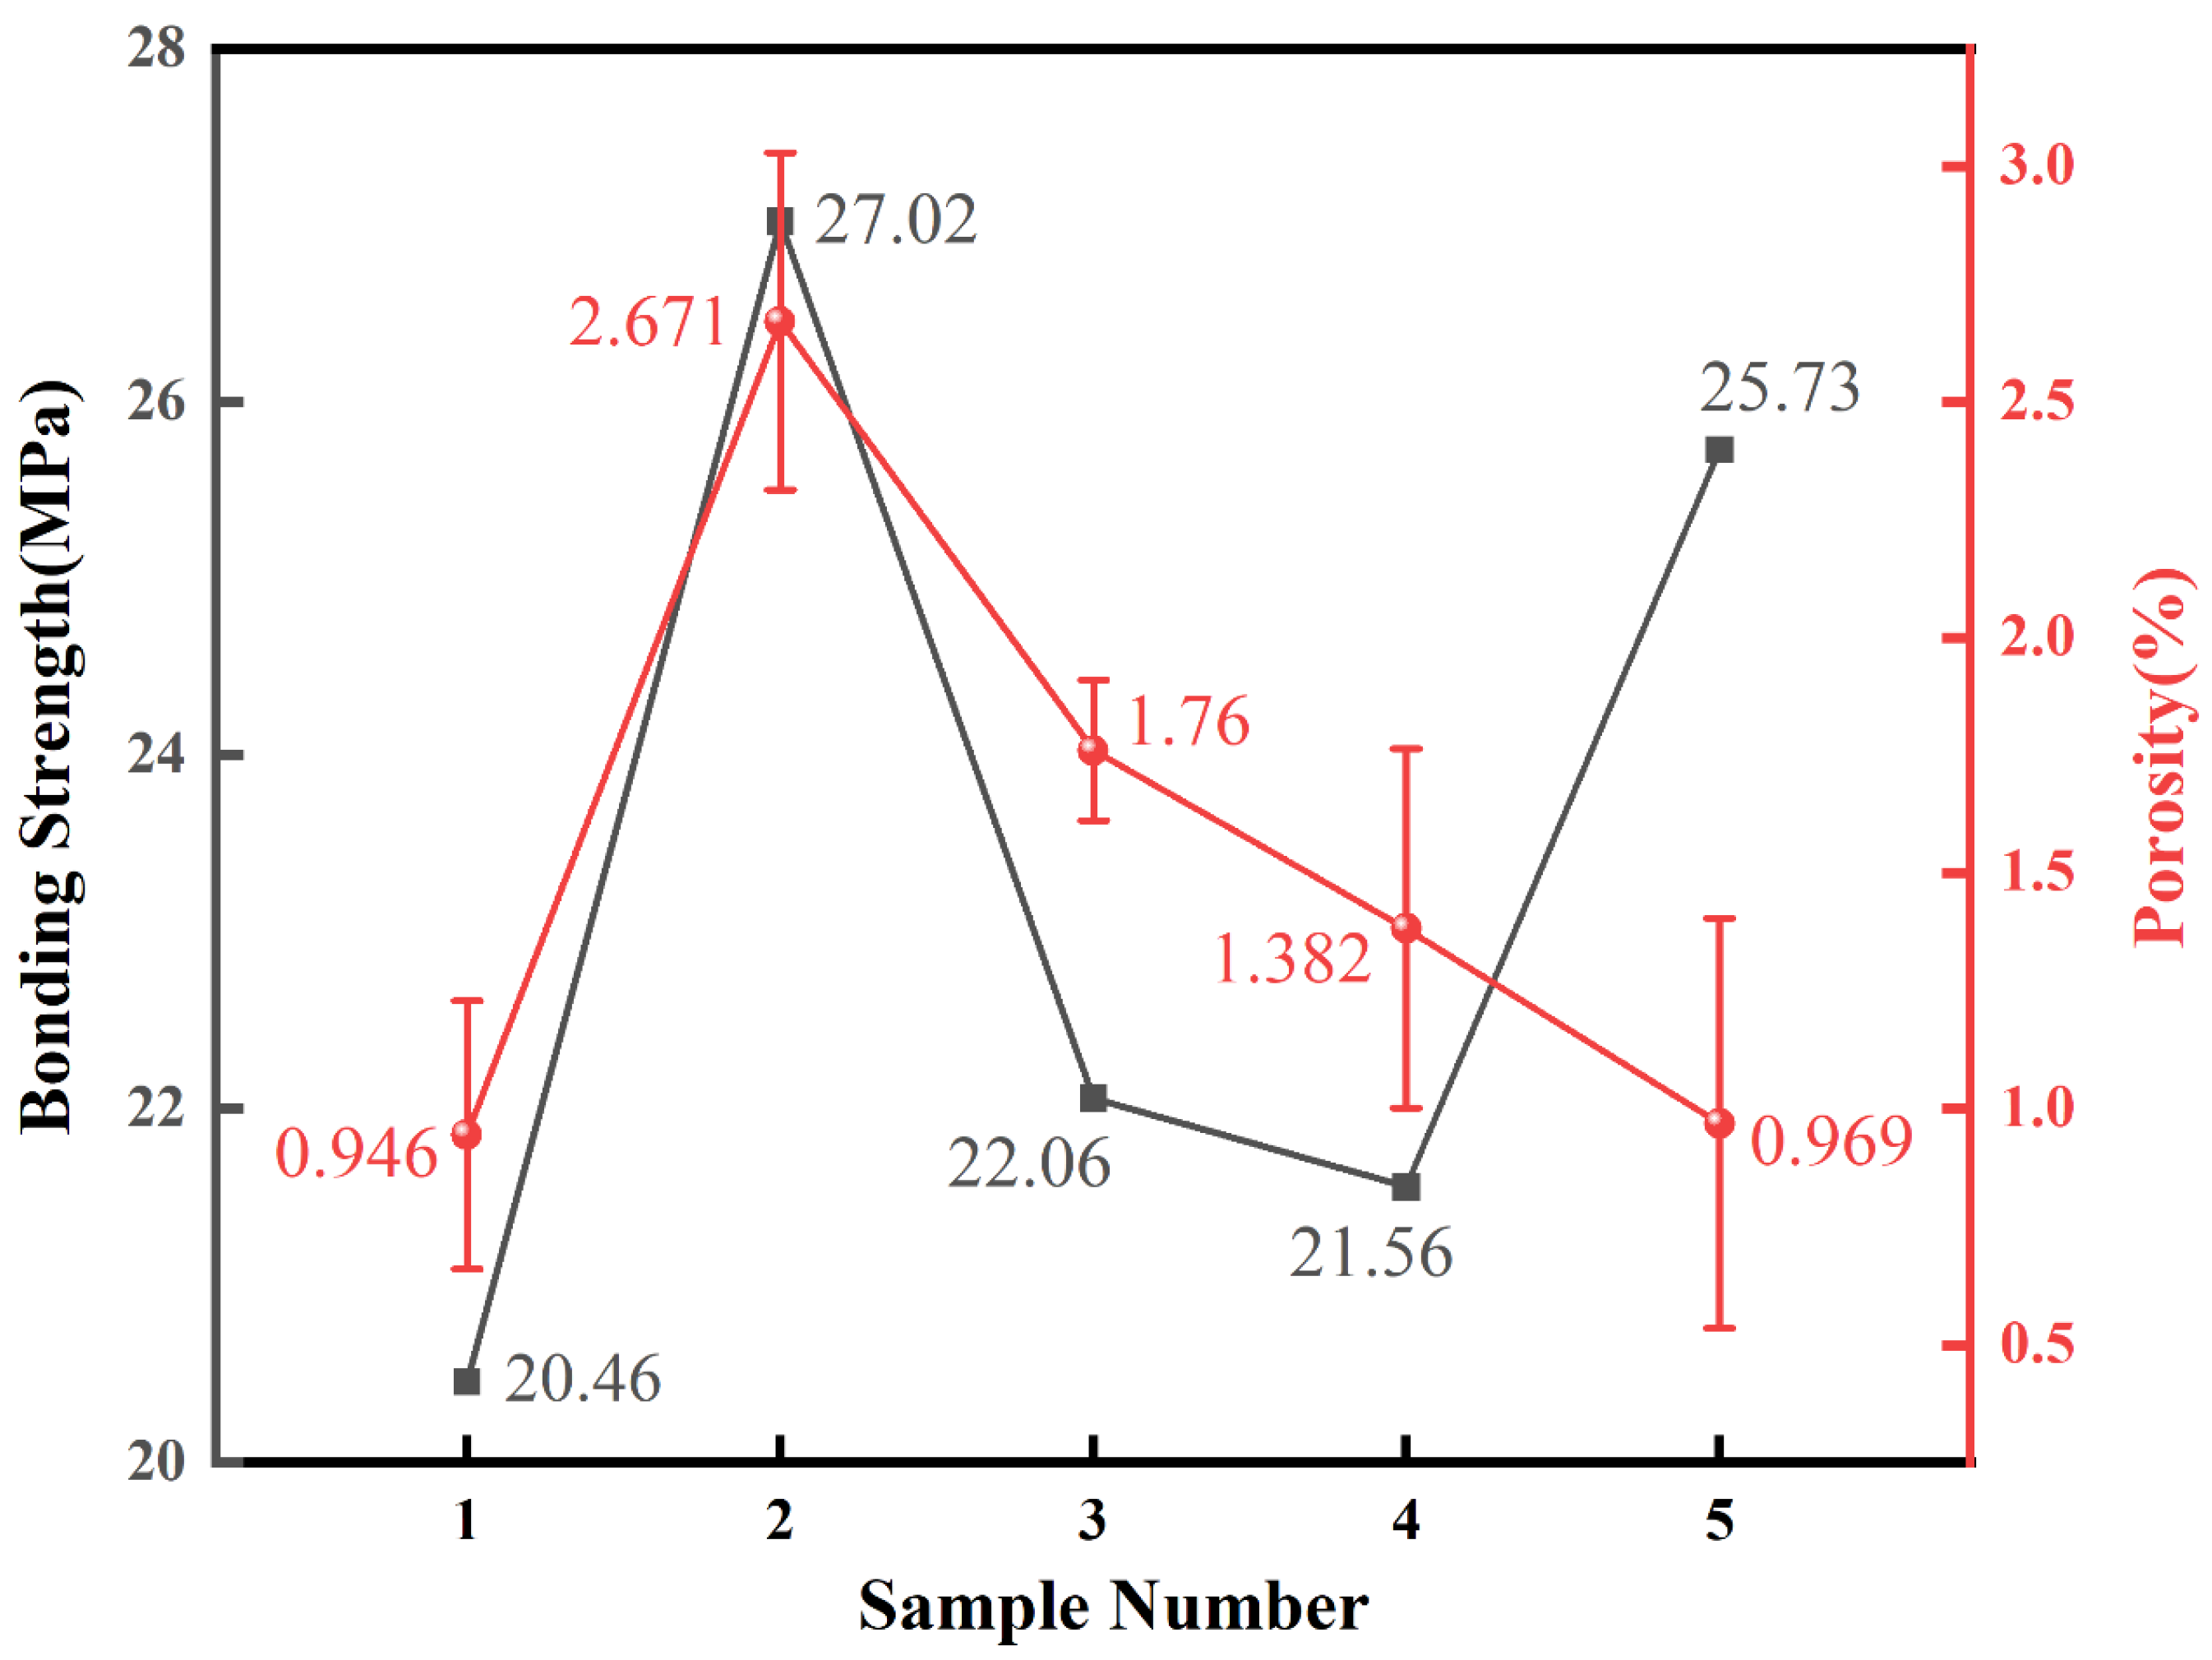
Figure 6 presents the calculated porosity values with statistical errors and the measured adhesion strengths for all five samples. The results indicate a positive correlation between the porosity and the proportion of the water ring flow rate: a higher proportion of water ring flow rate corresponds to greater coating porosity. Sample 1 (Water Ring Flow Rate Ratio: 79.66%), with the lowest water ring flow rate proportion of 79.66%, exhibited the lowest porosity among all samples, measuring 0.946%. Sample 5 (Water Ring Flow Rate Ratio: 80.28%) had the next lowest porosity value of 0.969%, with a water ring flow rate proportion of 80.28%. Based on the coating thickness data presented in
Table 5, it can be observed that the thicknesses of Sample 2 (Water Ring Flow Rate Ratio: 85.45%) and Sample 5 (Water Ring Flow Rate Ratio: 80.28%) are relatively close, with average thicknesses of 44 μm and 44.52 μm, respectively. However, their porosities differ significantly. Consequently, no clear correlation has been demonstrated between coating thickness and porosity.
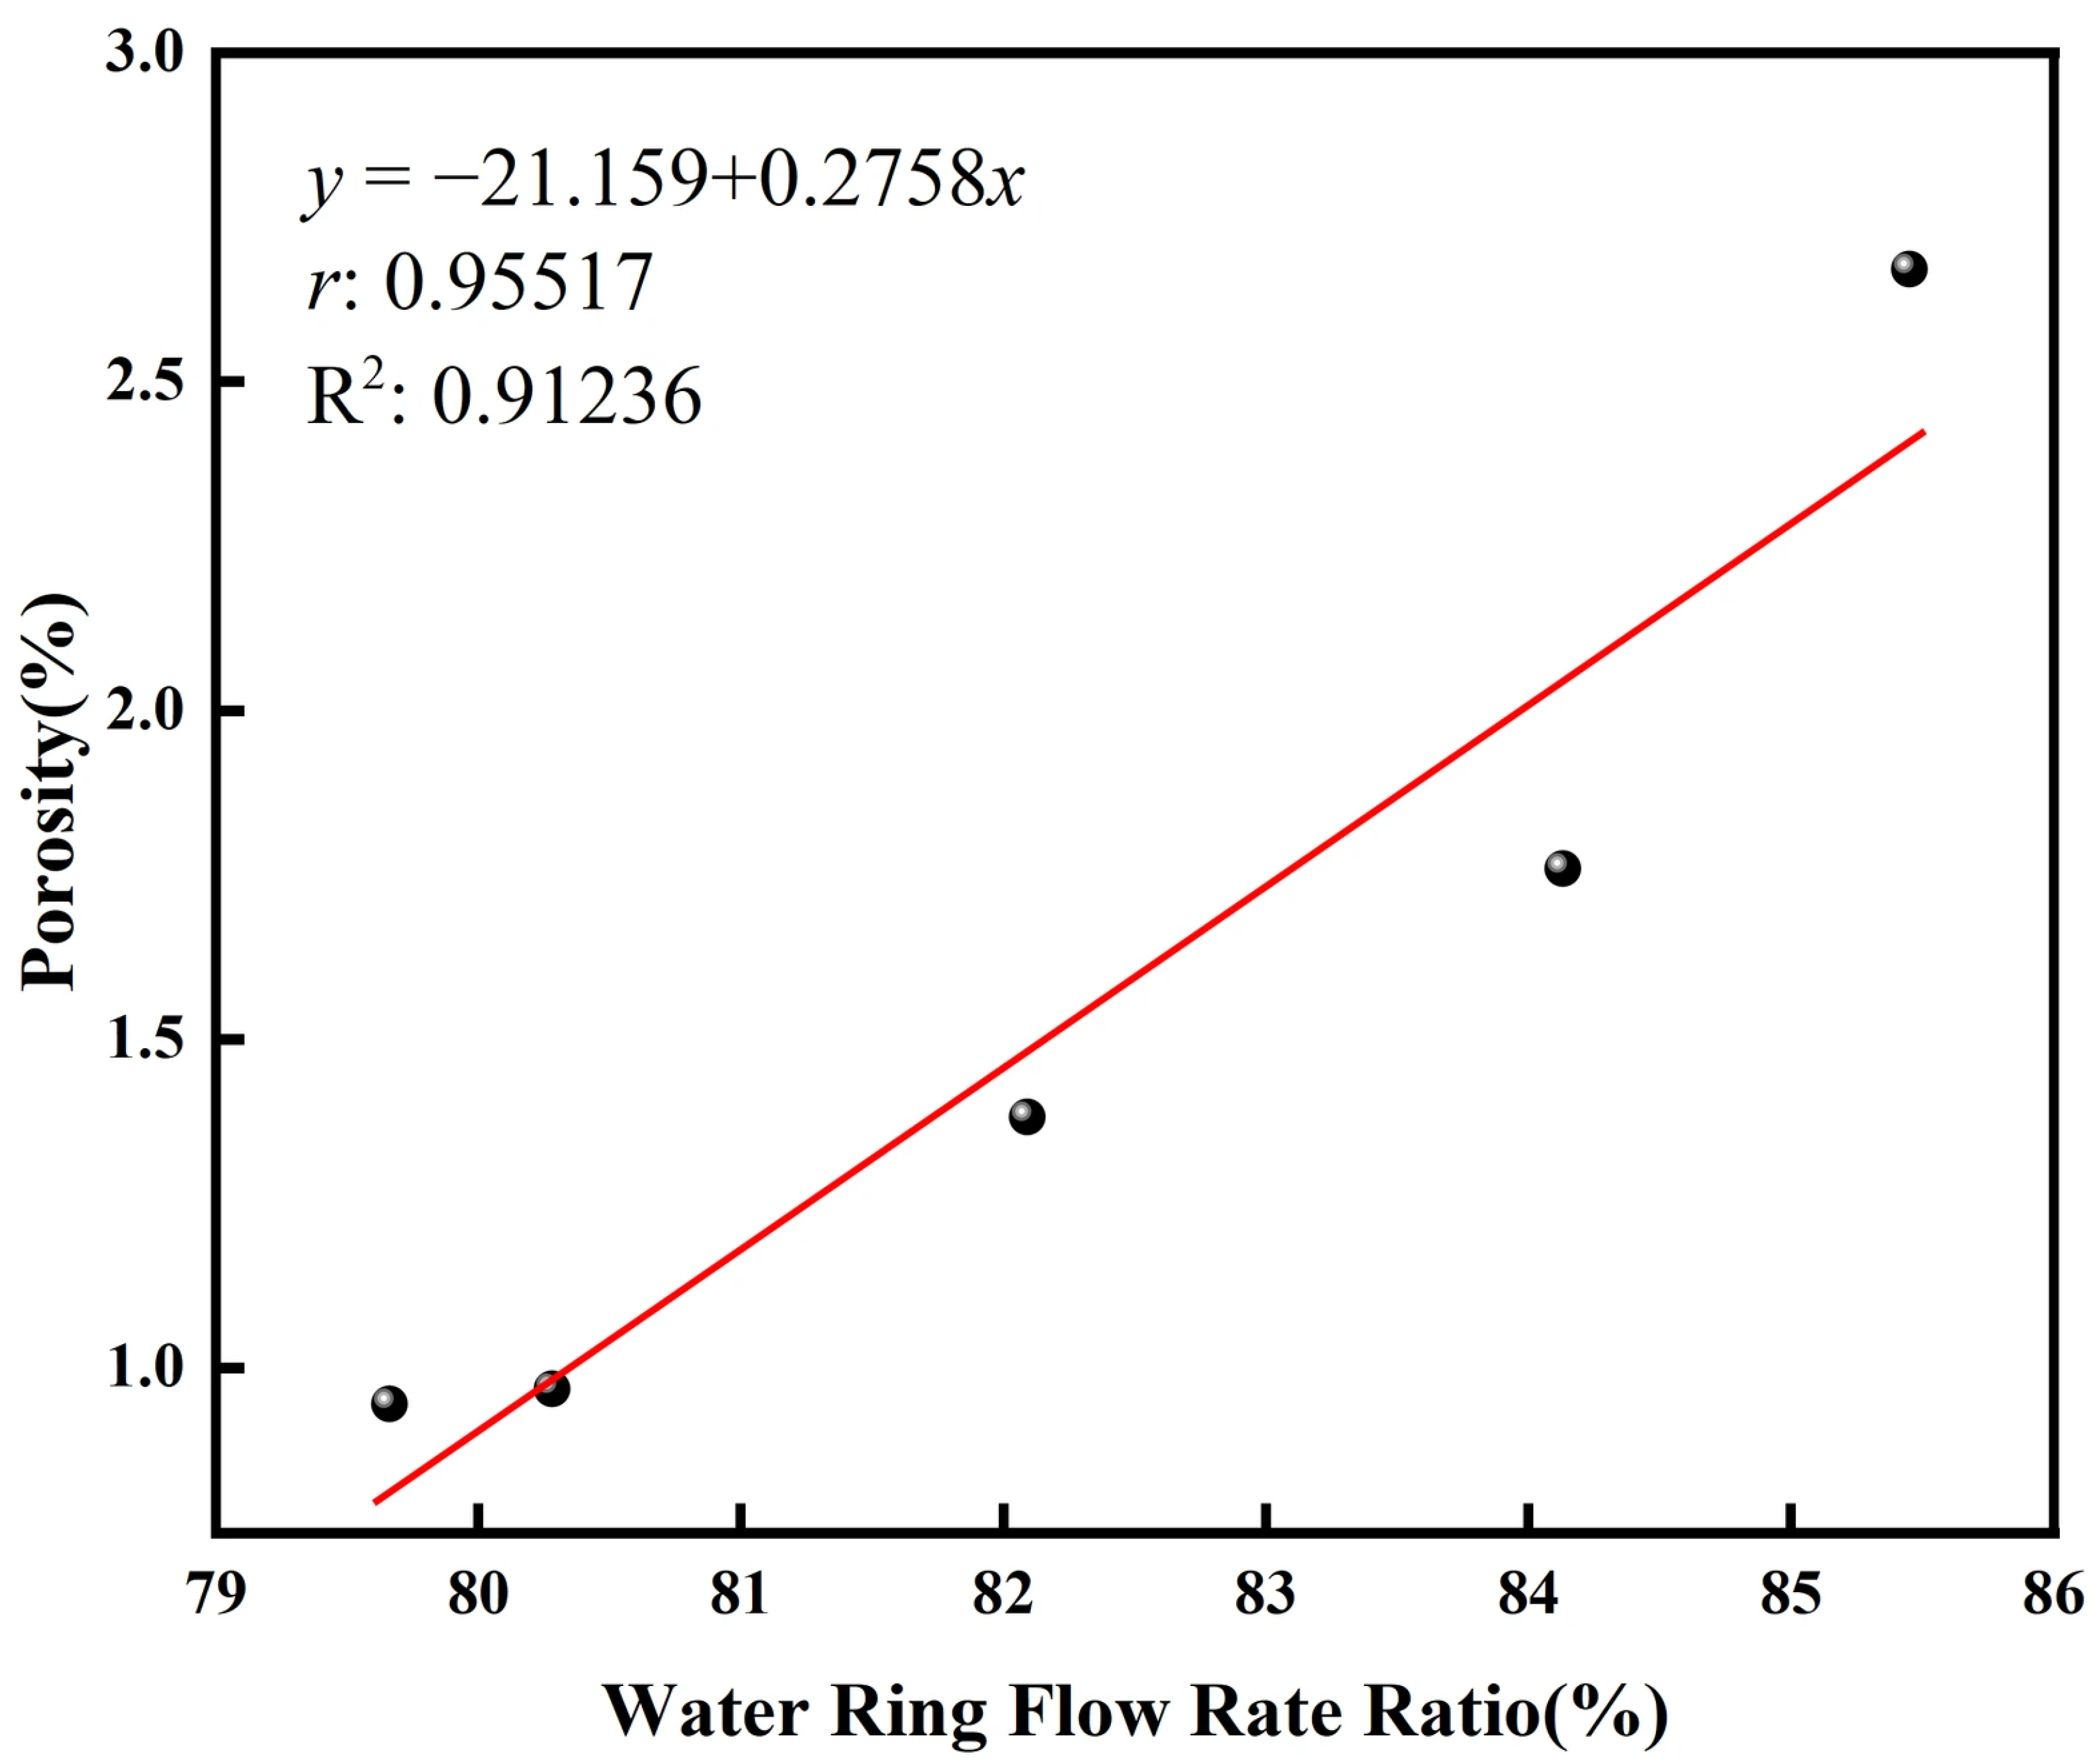
The quantitative relationship between the water ring flow rate ratio and the resulting coating porosity is unequivocally demonstrated in
Figure 7. A linear fit to the experimental data reveals a strong positive correlation, with a high Pearson correlation coefficient (
r) of 0.95517 and a high coefficient of determination (R
2) of 0.91236. This statistically significant trend confirms that the water ring flow rate ratio is a dominant process parameter controlling the coating’s density within the tested parameter range.
The observed increase in porosity with a higher ratio can be attributed to alterations in the evaporation atomization process of the suspension. It is postulated that an elevated ratio modifies the gas-liquid interaction dynamics, potentially leading to an increase in the average droplet size or a broader droplet size distribution. Larger droplets experience higher momentum and inferior heat transfer efficiency due to their lower surface-area-to-volume ratio. Consequently, these particles may not achieve complete melting or sufficient deformation upon impact with the substrate. This results in inadequate splat formation and poor inter-splat bonding, ultimately manifesting as increased inter-lamellar porosity in the deposited coating.
The results of the bond strength test indicate that failure in all samples primarily occurred at the interface between the coating and the substrate. Samples 3 (Water Ring Flow Rate Ratio: 84.13%) and 4 (Water Ring Flow Rate Ratio: 82.09%) showed relatively lower values. This is consistent with the noticeable interfacial separation observed in their cross-sectional SEM images, which is likely caused by excessively high spraying velocity.
Sample 2 (Water Ring Flow Rate Ratio: 85.45%), which had the highest water ring flow rate proportion of 85.45%, also achieved the highest adhesion strength of 27.02 MPa. Observations of Samples 1 (Water Ring Flow Rate Ratio: 79.66%), 2 (Water Ring Flow Rate Ratio: 85.45%), and 5 (Water Ring Flow Rate Ratio: 80.28%) suggest a positive correlation between the adhesion strength and the proportion of the water ring flow rate: a higher proportion of water ring flow rate corresponds to greater coating adhesion strength. This trend indicates that reducing the powder feed rate while increasing the water ring flow rate promotes a stronger interfacial bond between the coating and the substrate. However, no similar pattern emerged between coating thickness and adhesion strength. Sample 1 (Water Ring Flow Rate Ratio: 79.66%) exhibited the lowest adhesion strength at 20.46 MPa, yet its average coating thickness of 78.02 μm was neither the highest nor the lowest among the five samples.
The relationship between coating porosity and adhesion strength reveals a significant deviation from the often-reported inverse correlation. As detailed in
Table 6 and
Figure 6, the data exhibits a trend where increasing porosity is associated with an overall increase in adhesion strength. This counter-intuitive observation suggests that the role of porosity in coating adhesion is more complex than a simple determinant of weakness.
We postulate that the water ring flow rate ratio, as the governing process parameter, triggers a transition in the dominant adhesion mechanism. At lower ratios, the coating formation is likely dominated by the deposition of well-melted splats. While this produces a dense structure (low porosity), the adhesion may be primarily based on a relatively flat interfacial contact area.
As the ratio increases, the resulting changes in droplet kinematics and thermal history might induce two competing effects: (1) an increase in porosity due to less optimal splat stacking, and (2) a strengthening of the coating–substrate interface. The latter could be due to enhanced mechanical interlocking from higher-impact particle deformation, creating a rougher interfacial zone, or a reduction in detrimental residual stresses due to the accommodating nature of the porous structure. In this specific process window, the strengthening effect on the interface appears to outweigh the weakening effect of the higher porosity, leading to the observed positive trend.
This finding emphasizes that a single microstructural characteristic like porosity cannot unilaterally predict the mechanical performance of SPS coatings. The process parameters can alter the very mechanisms by which the coating adheres, making the understanding of these parameter-structure-property linkages crucial for targeted coating design.
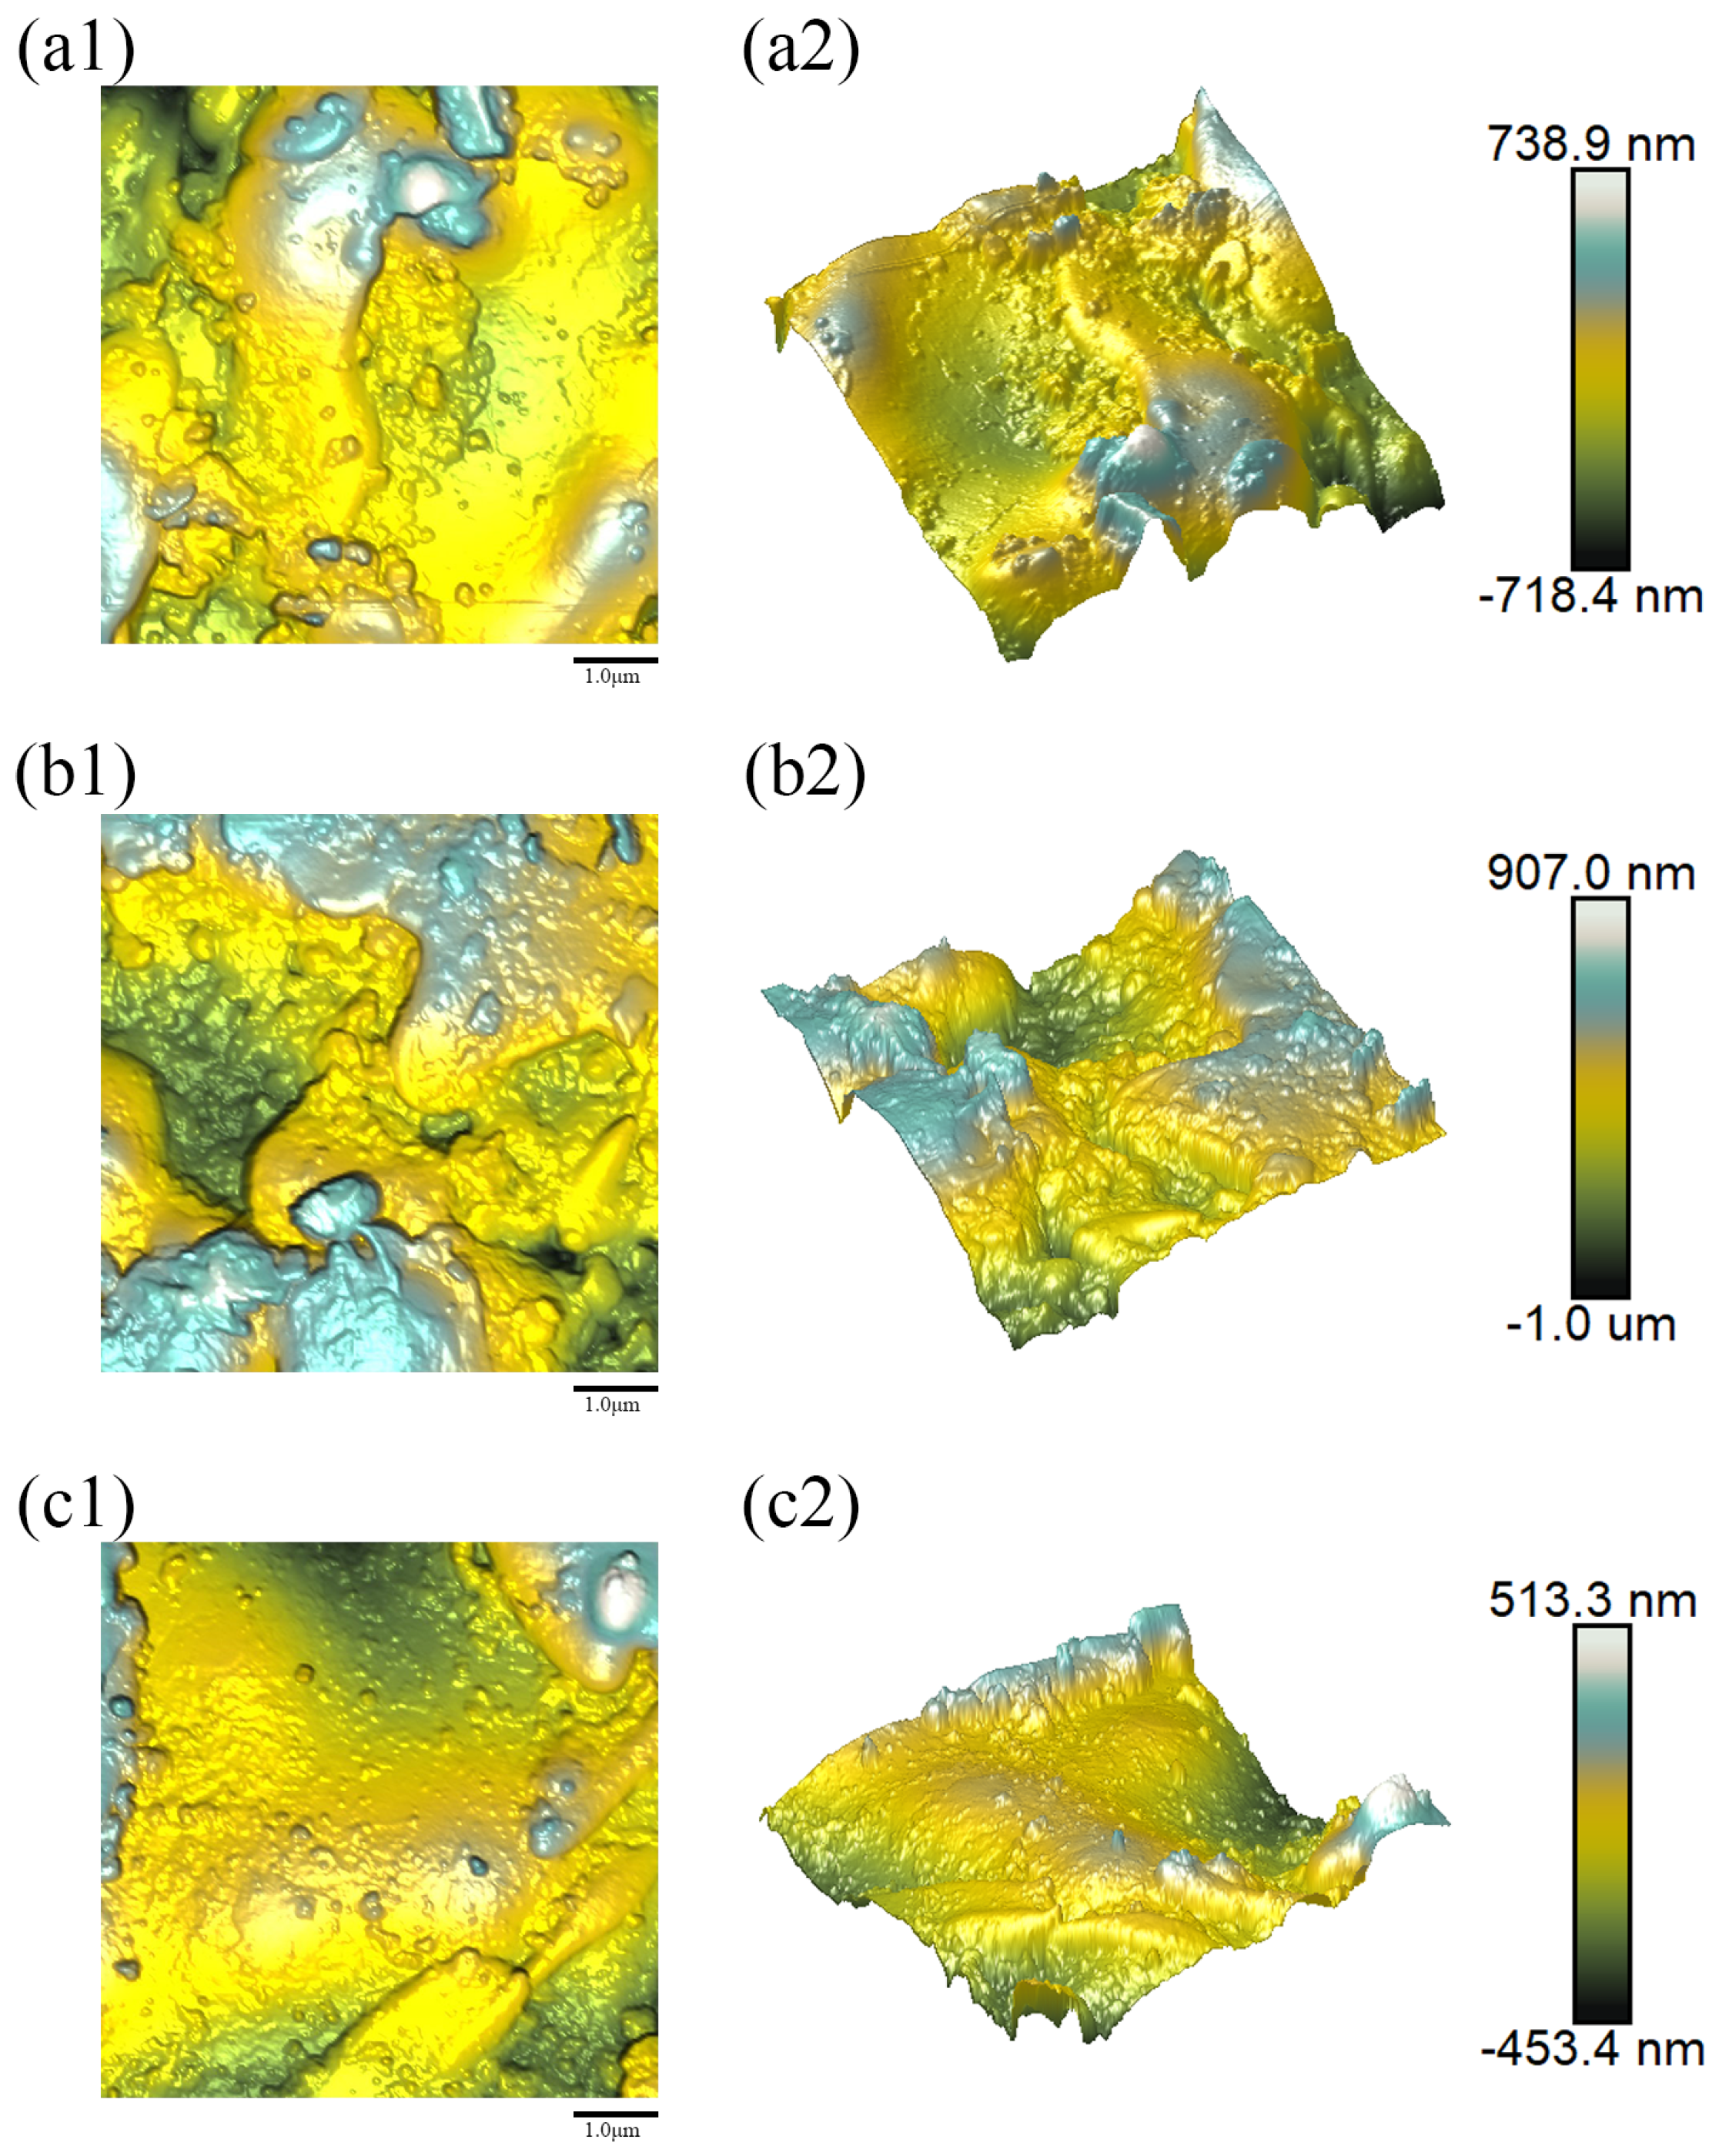
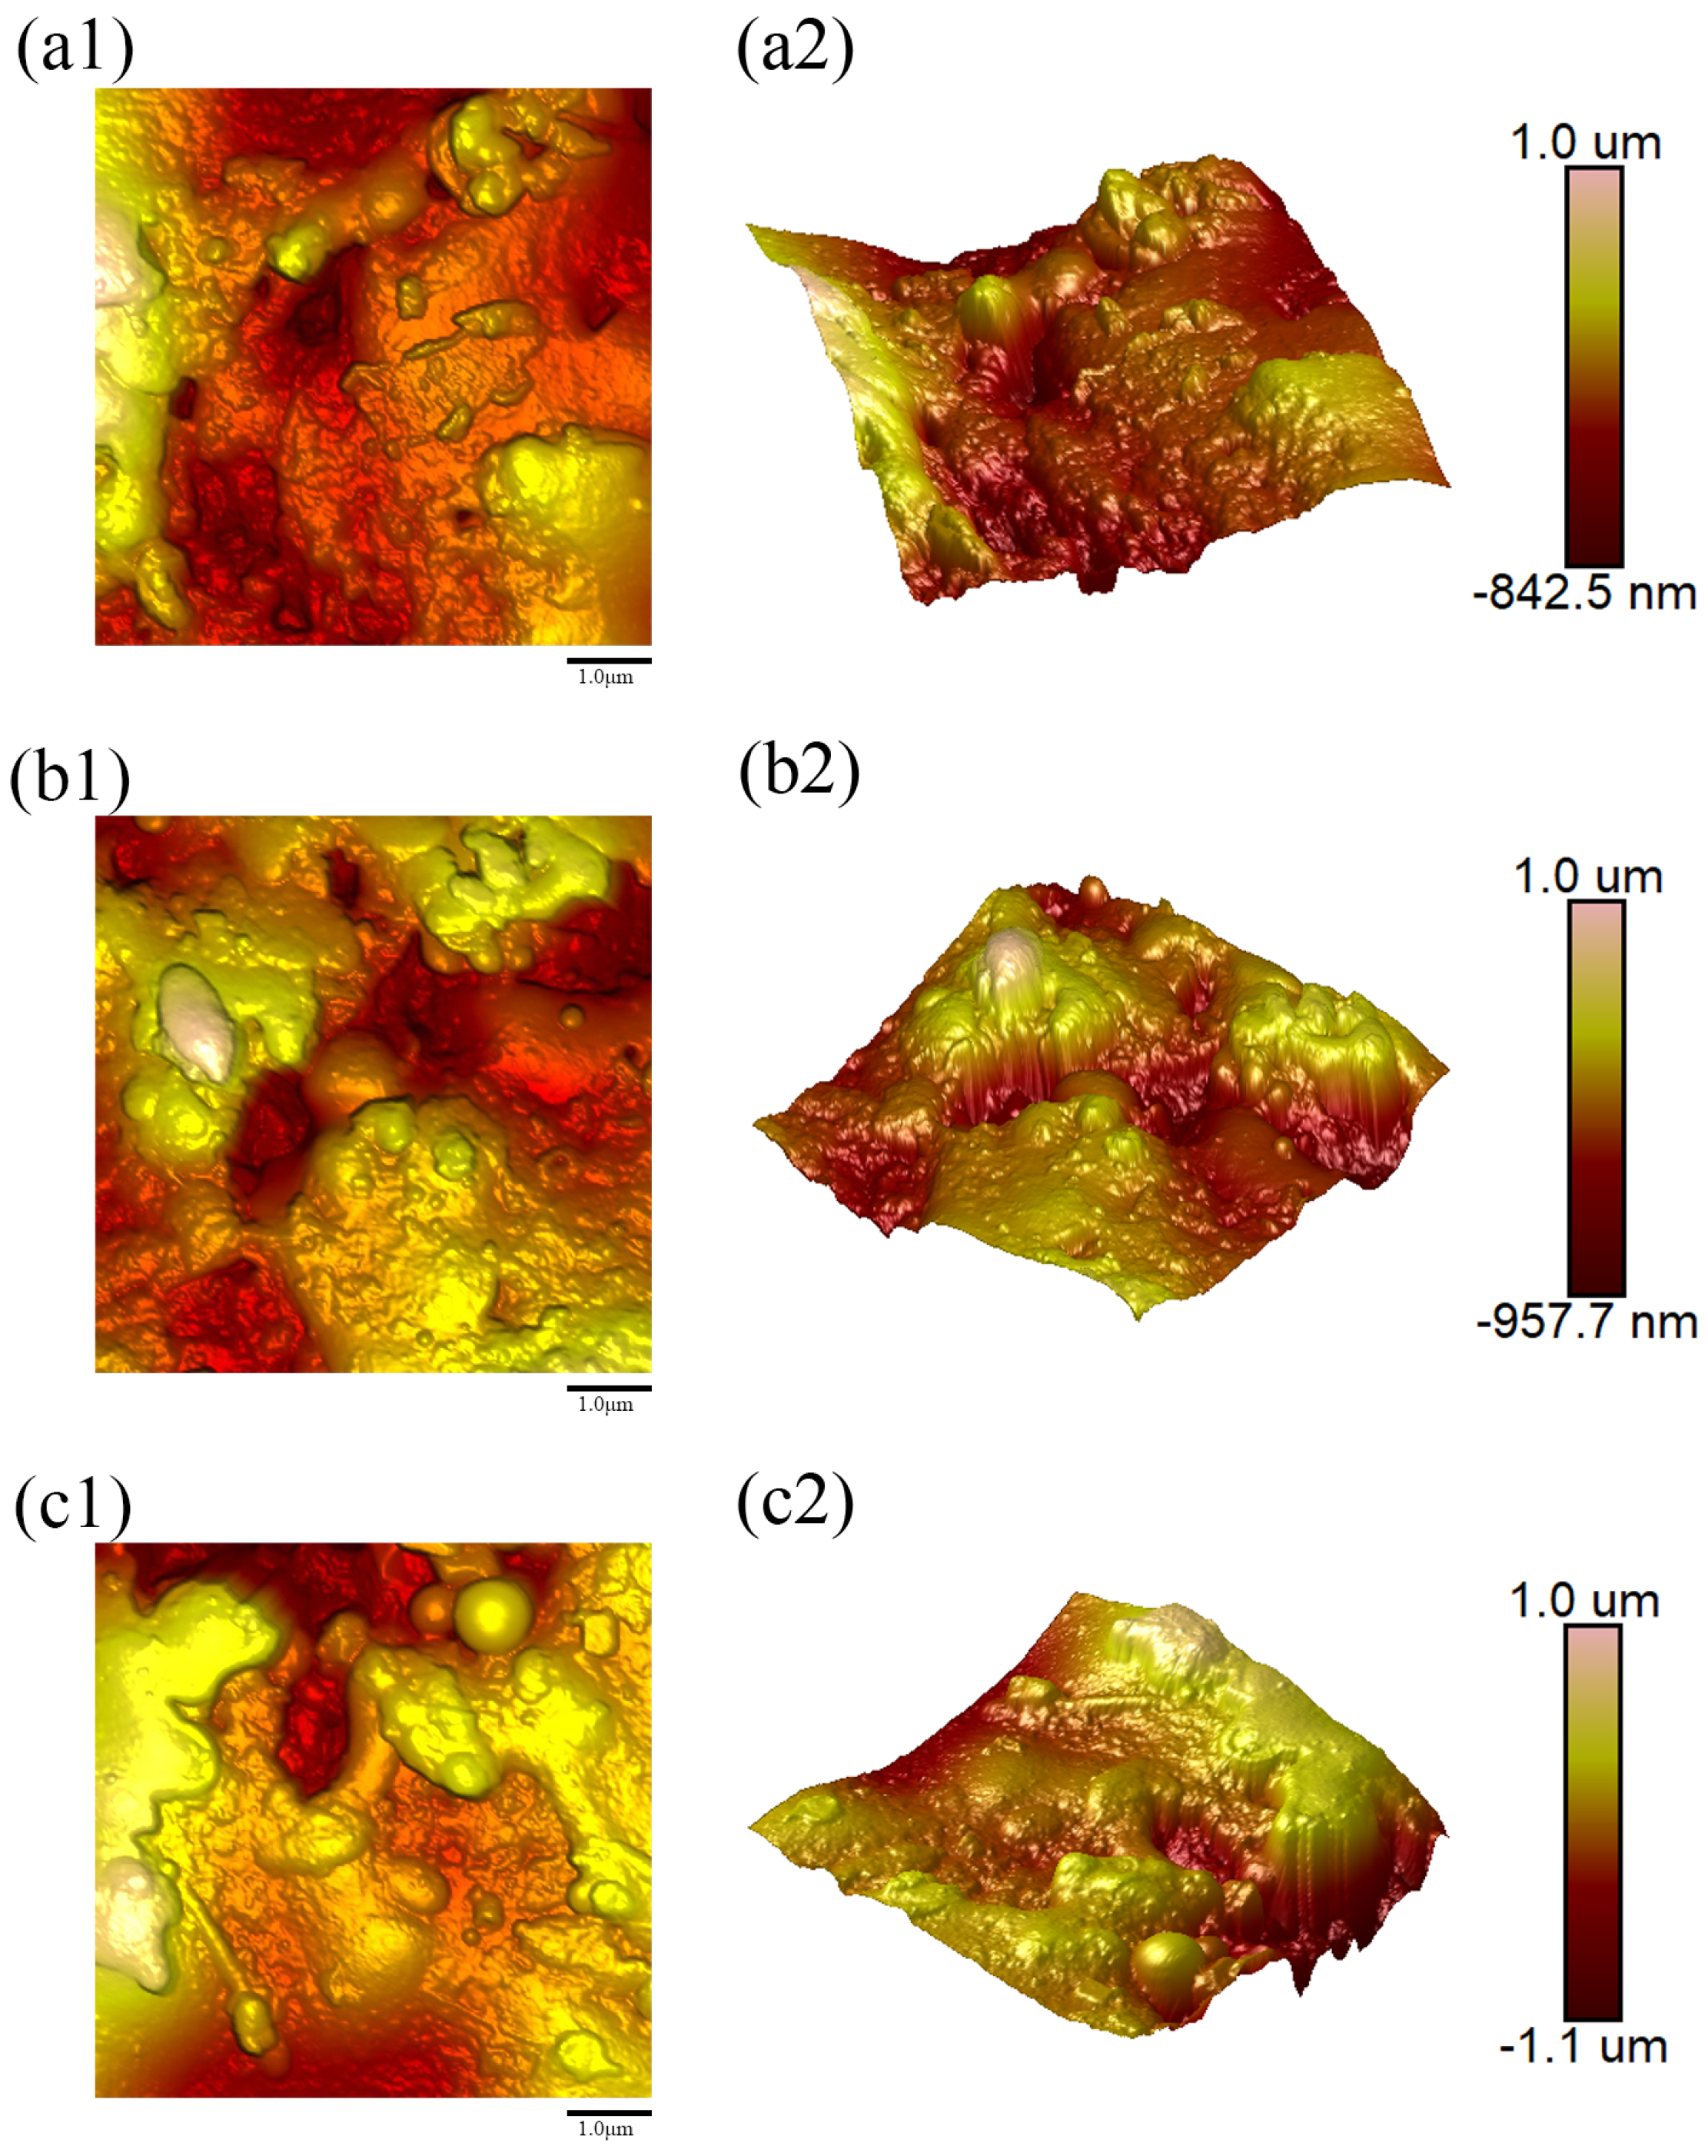
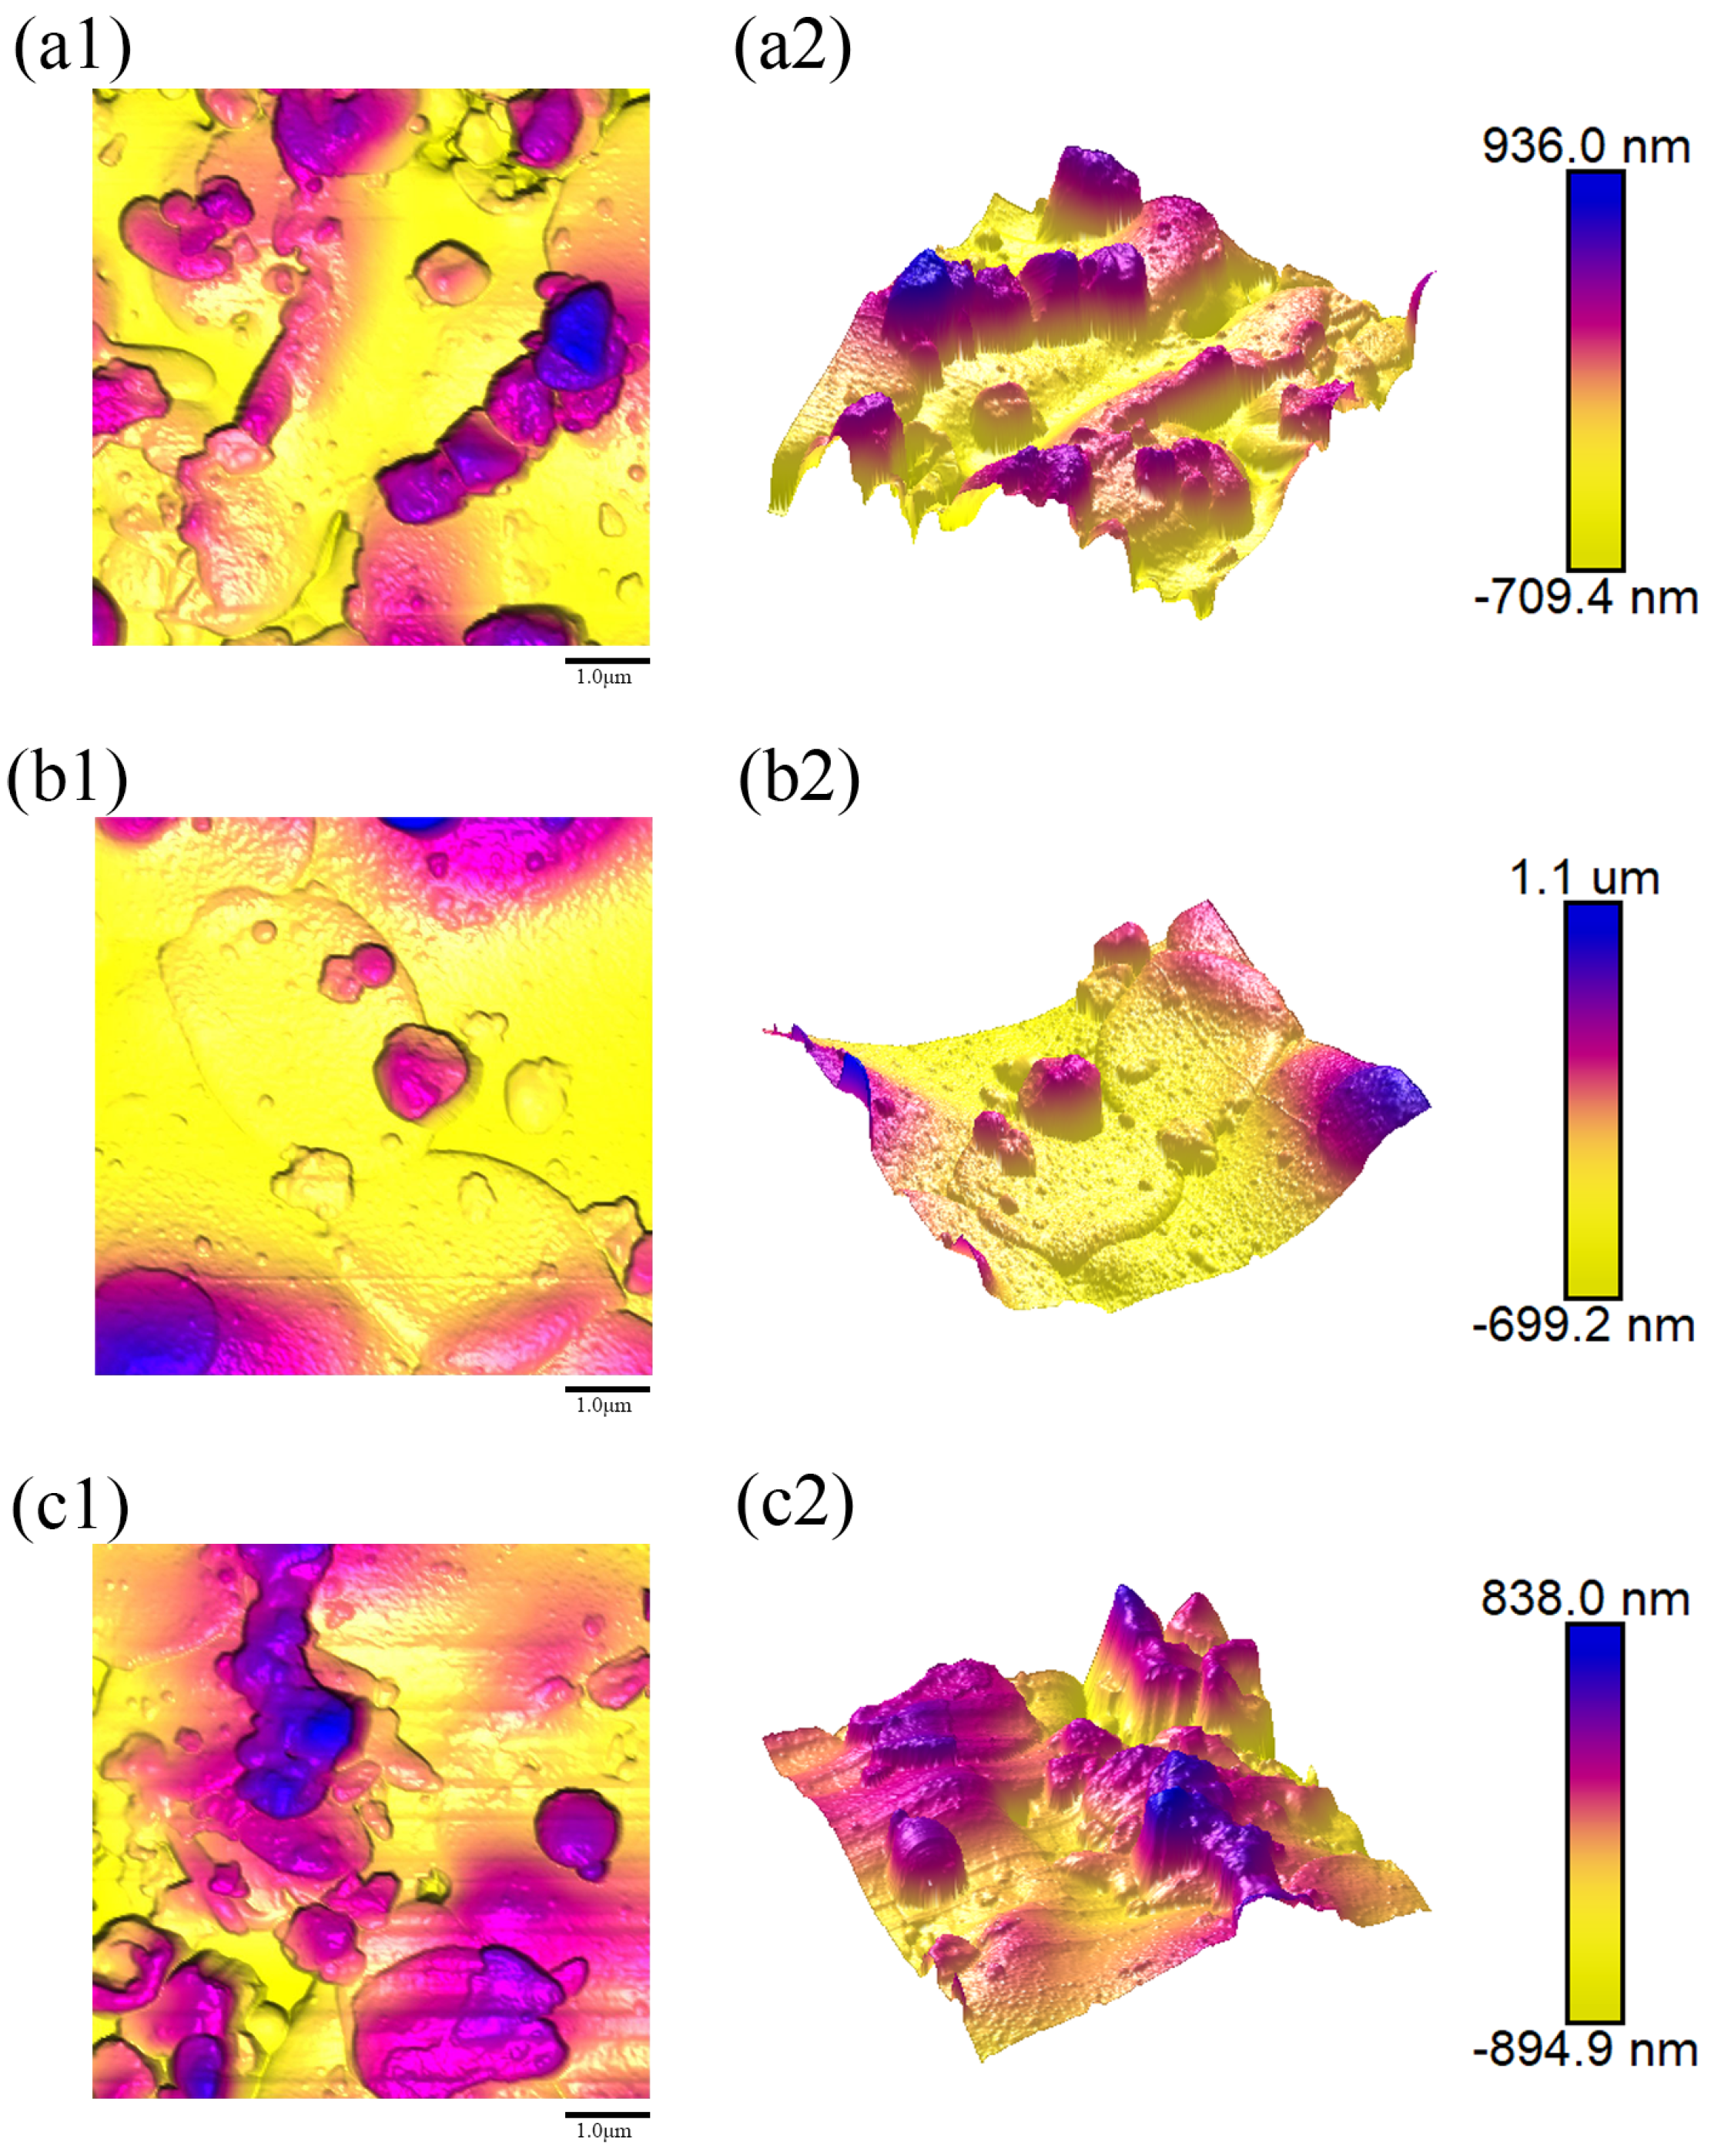
Figure 8(a1–c1),
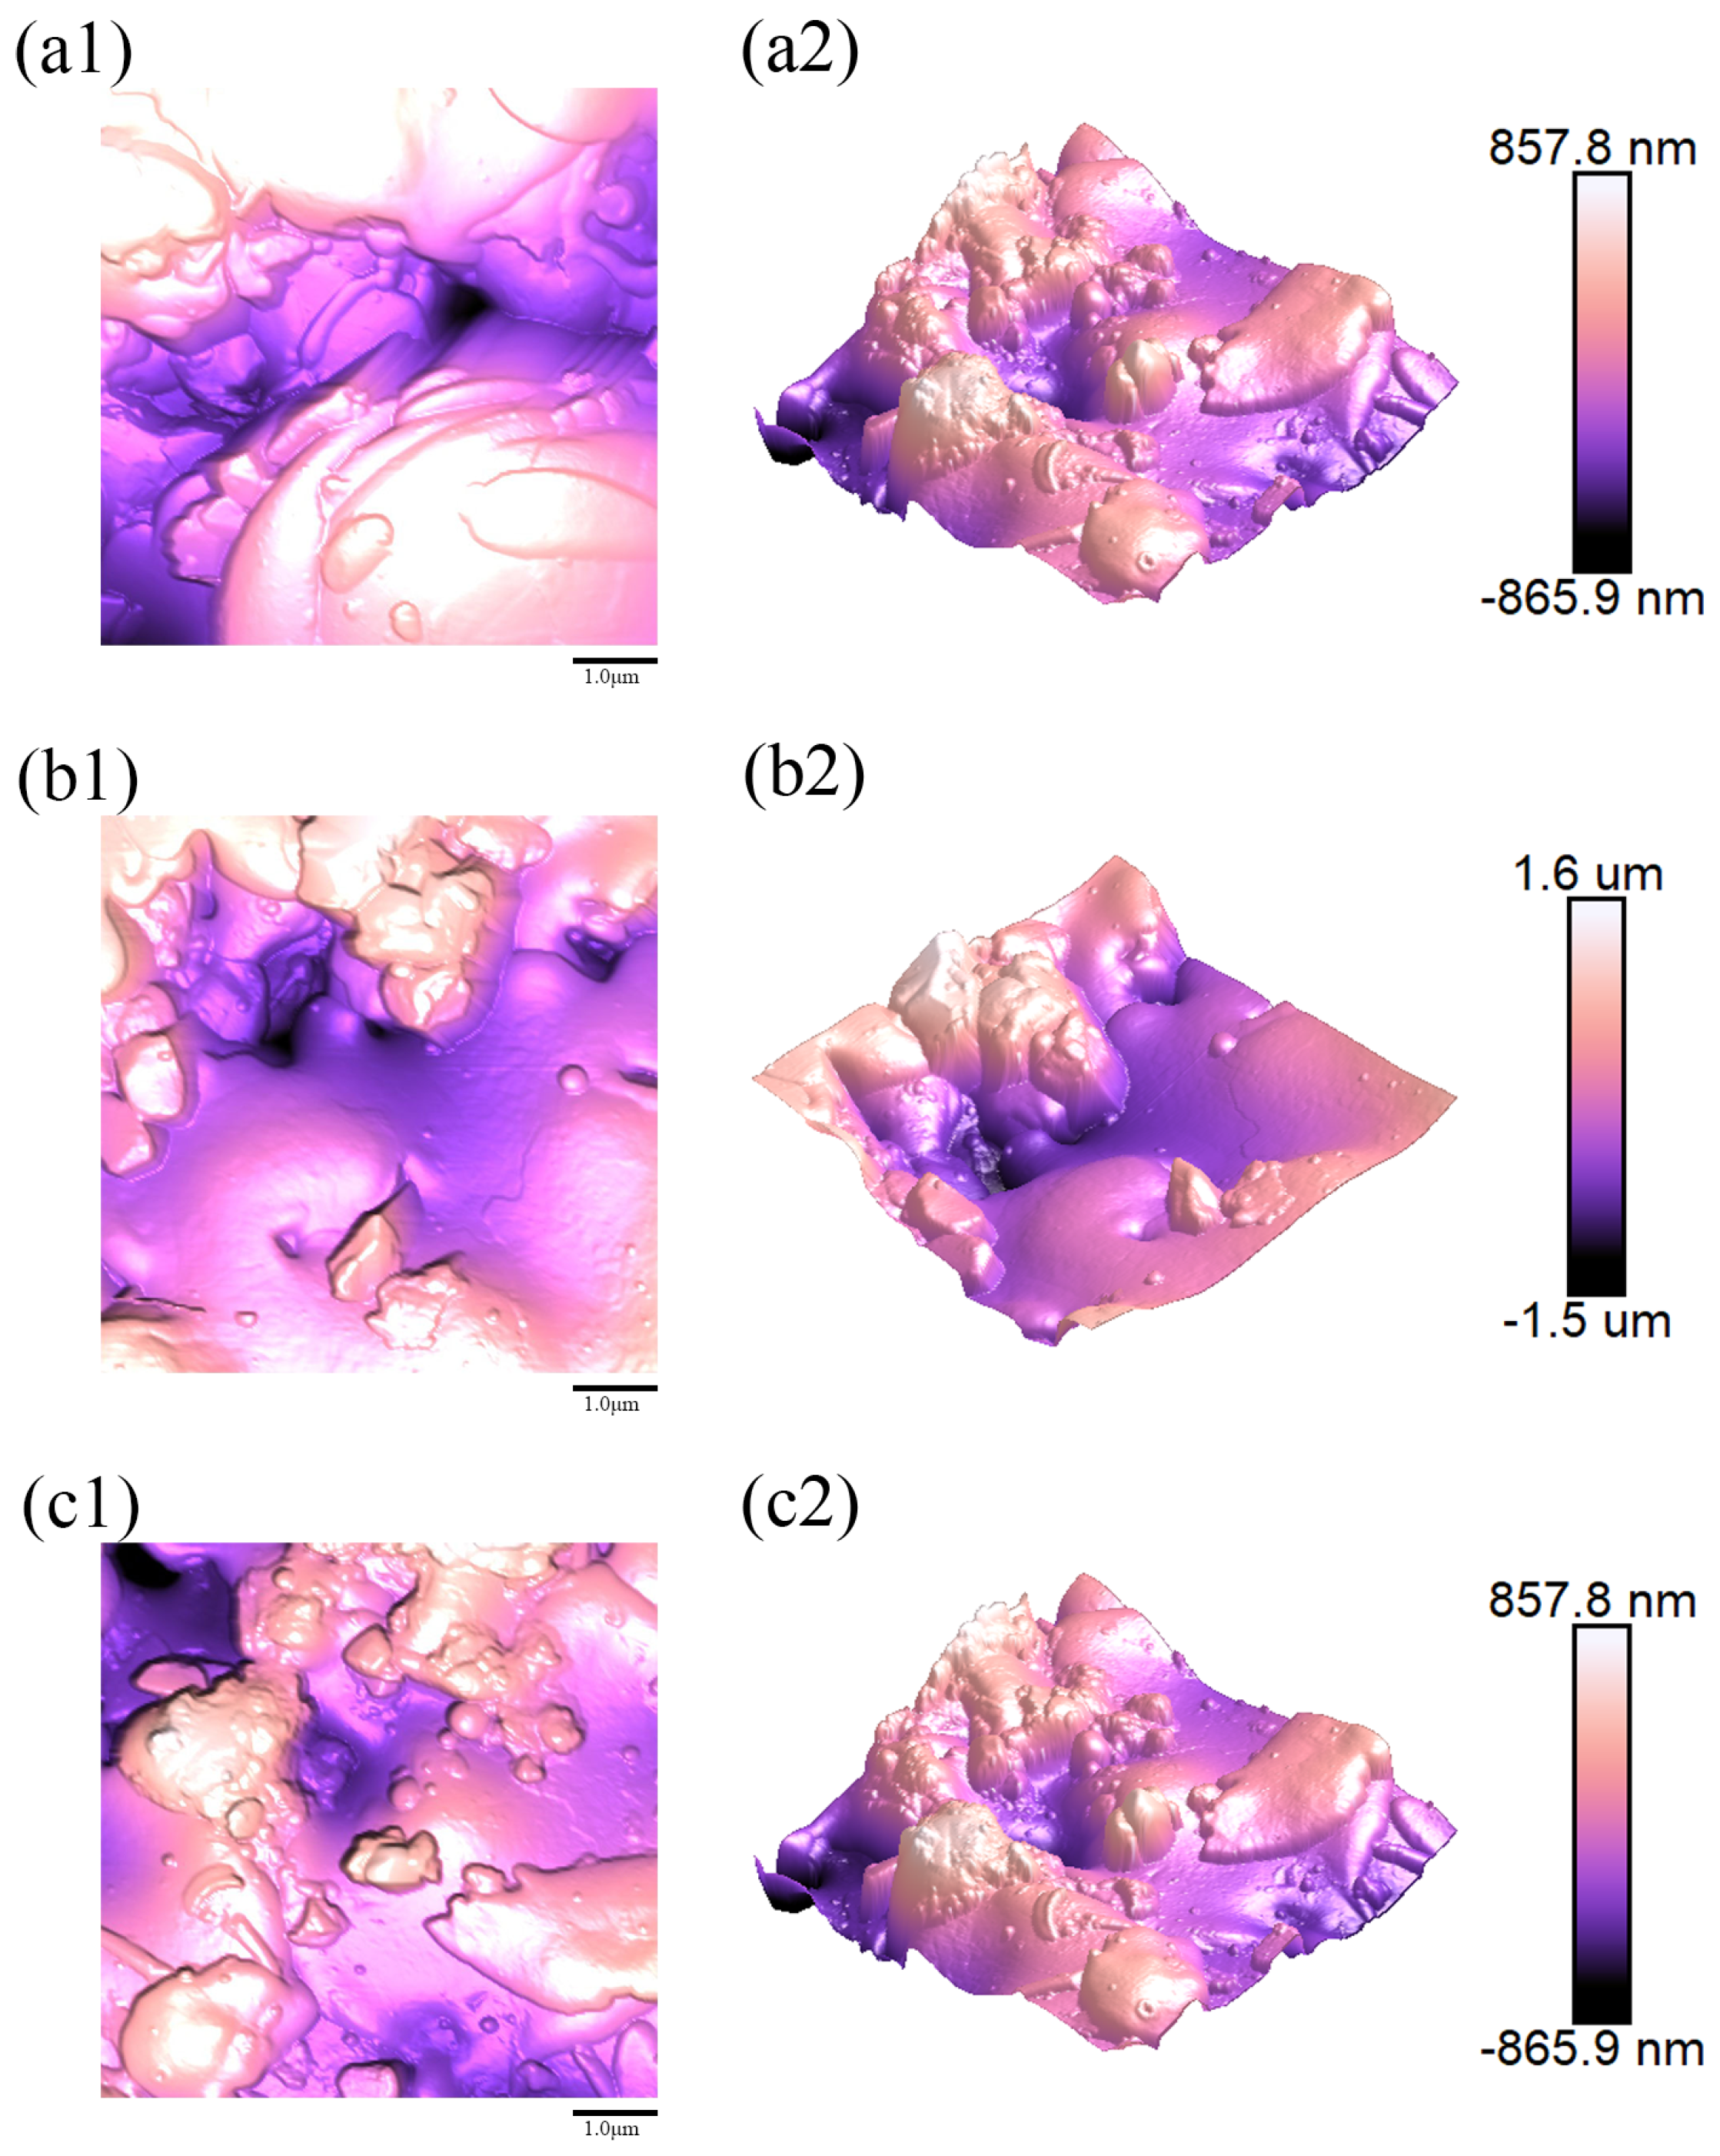
Figure 9(a1–c1),
Figure 10(a1–c1),
Figure 11(a1–c1) and
Figure 12(a1–c1), respectively, display the two-dimensional (2D) AFM surface topography images obtained from three distinct regions on the surfaces of samples 1–5;
Figure 8(a2–c2),
Figure 9(a2–c2),
Figure 10(a2–c2),
Figure 11(a2–c2) and
Figure 12(a2–c2) represent the corresponding three-dimensional (3D) surface morphology images. The image dimensions for the test area were uniformly 5 μm × 5 μm. For each sampling region, the mean roughness (
Ra), root mean square roughness (
Rq), maximum height difference (
Rmax), and surface area variation were determined. The average values across these three locations were then calculated to evaluate the overall surface roughness of the coating. All data are presented in
Table 7.
The surface topography of the Y
2O
3 coatings (
Figure 8,
Figure 9,
Figure 10,
Figure 11 and
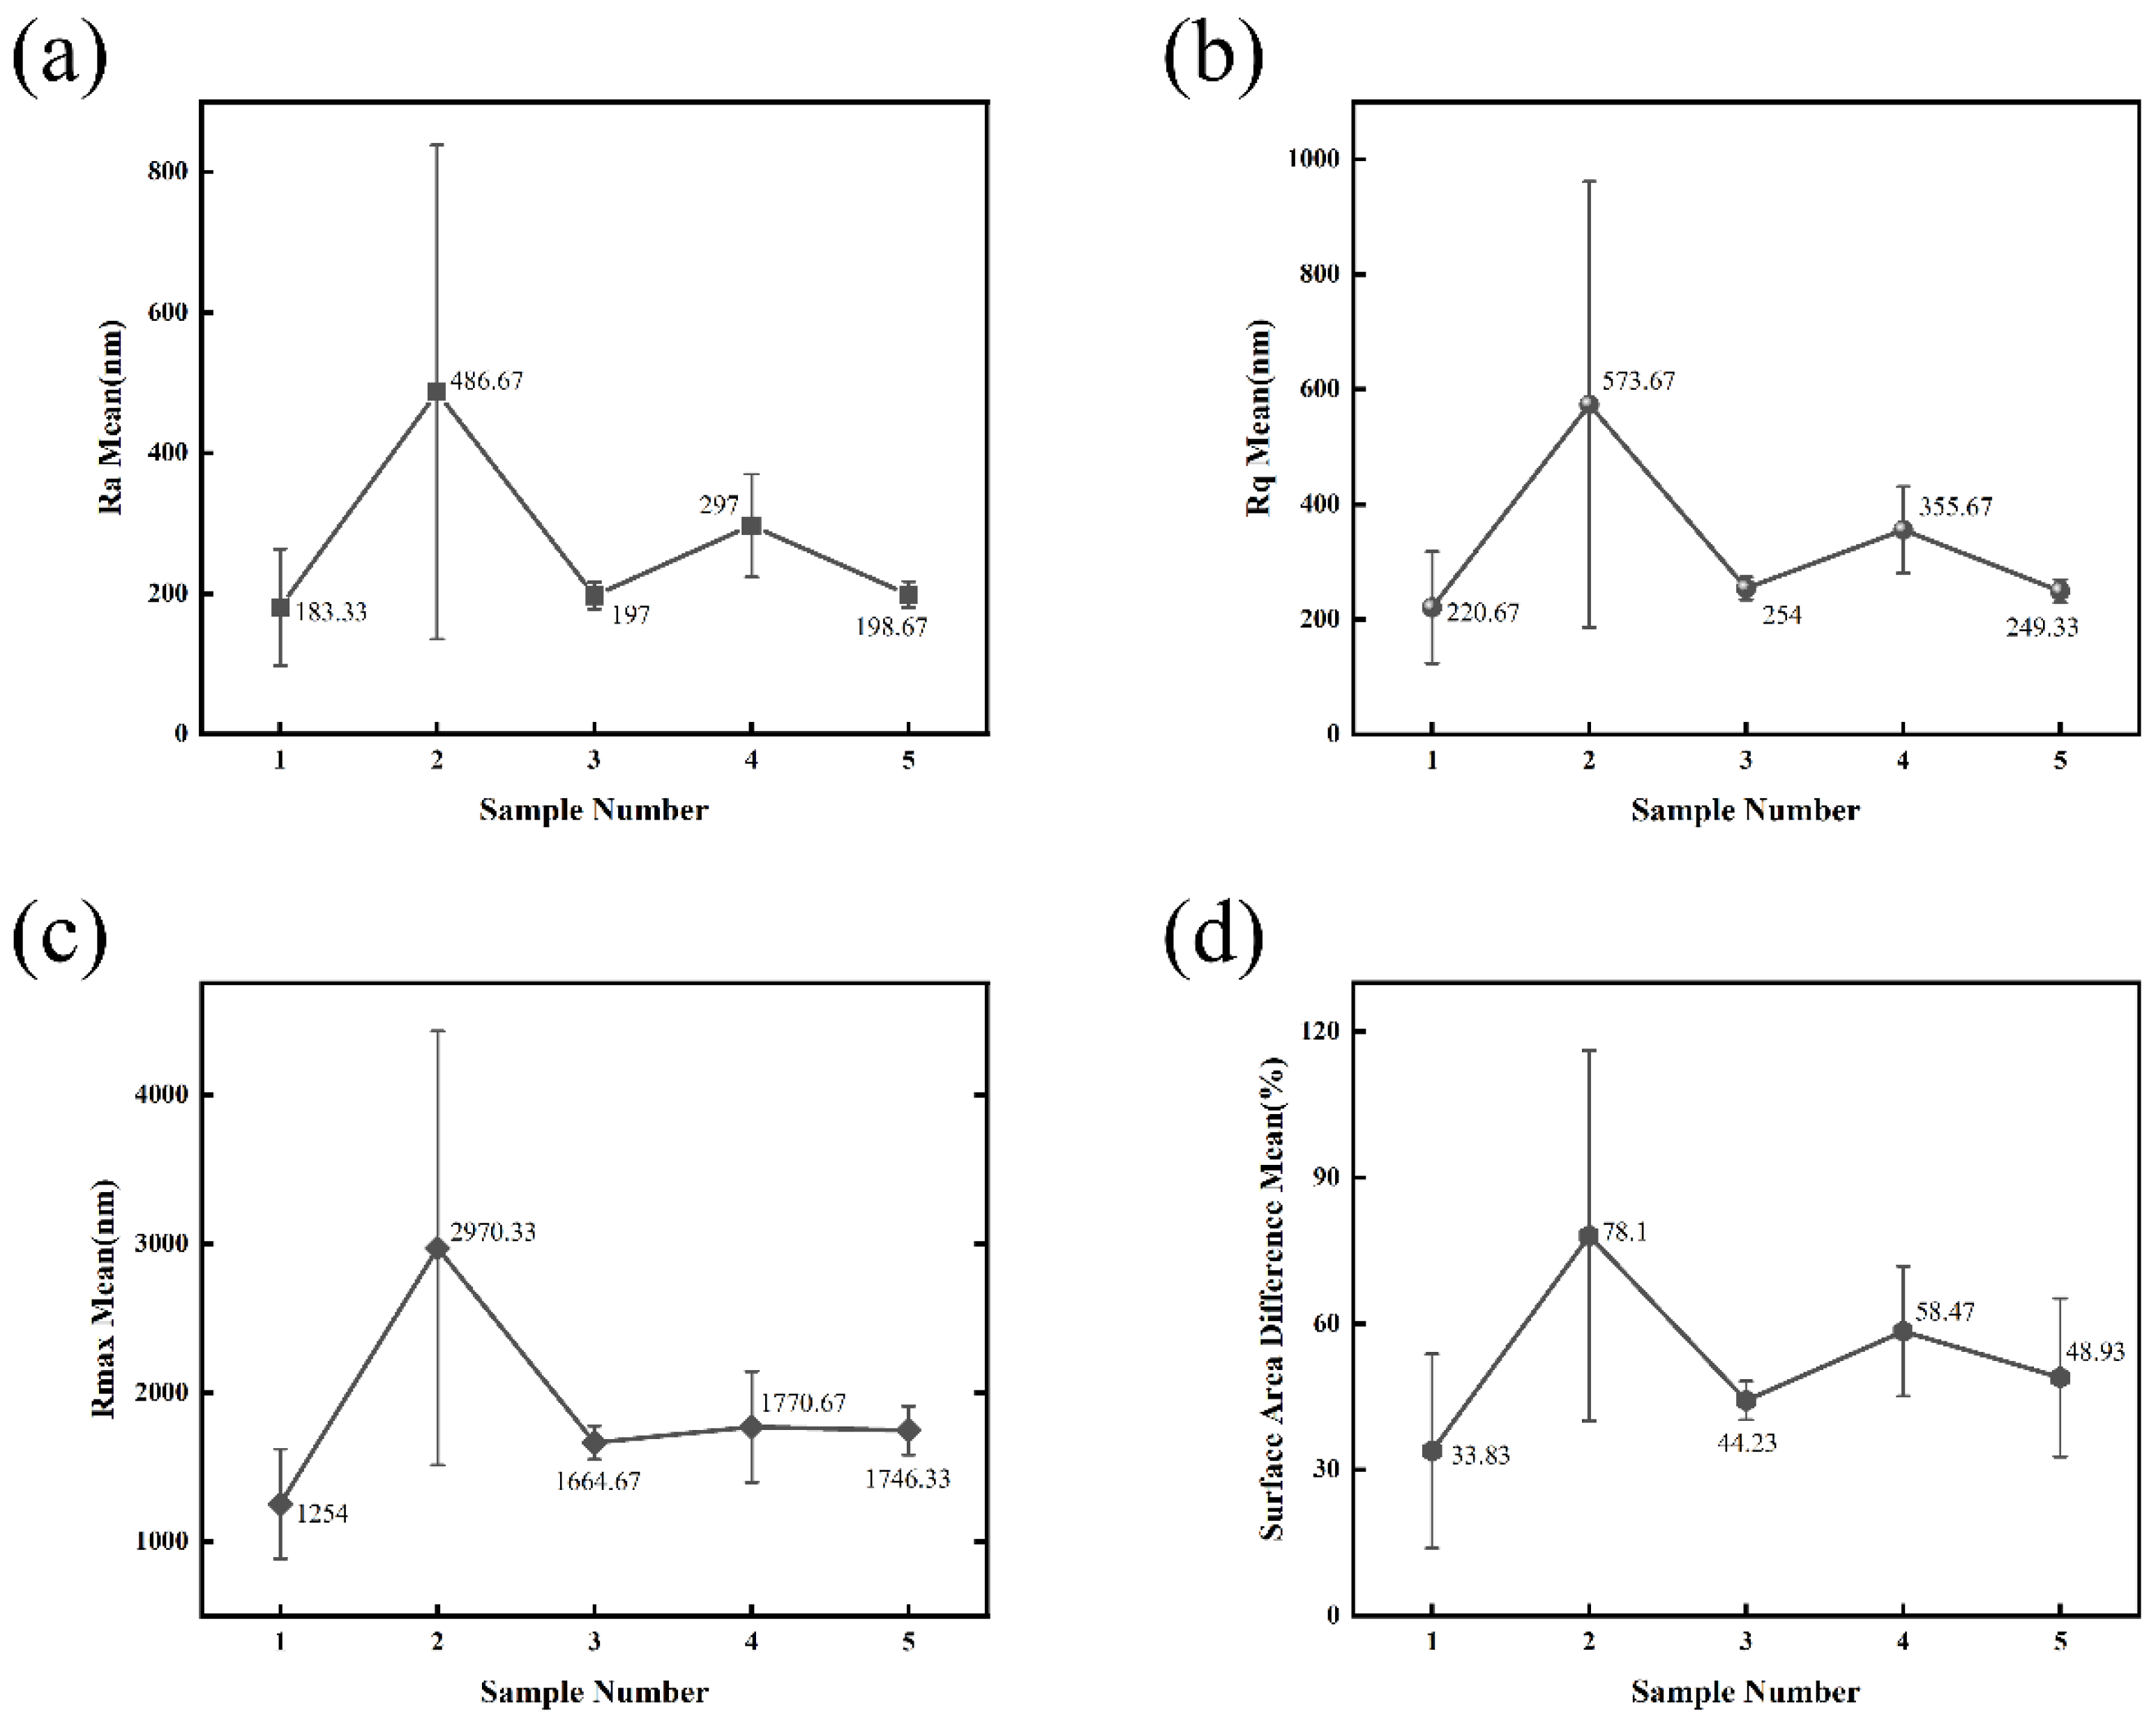
Figure 12), as characterized by AFM, and the corresponding statistical roughness parameters (
Figure 13) reveal a pronounced and non-monotonic dependence on the water ring flow rate ratio. This complex relationship provides critical insights into the suspension atomization and coating formation mechanisms during the SPS process.
The coating fabricated with the lowest water ring flow rate ratio (Sample 1 (Water Ring Flow Rate Ratio: 79.66%)) exhibited the smoothest surface (
Ra = 180.33 nm), characterized by a homogeneous morphology of fine, well-flattened splats (
Figure 8). This suggests that at this low ratio, the melting process produces droplets with an optimal size distribution and momentum, which undergo sufficient melting and deformation upon impact with the substrate, leading to dense and uniform splat stacking.
A dramatic transition occurs as the ratio increases. Sample 2 (Water Ring Flow Rate Ratio: 85.45%), processed with the highest water ring flow rate ratio, displayed a significant surge in all roughness parameters (
Ra,
Rq,
Rmax), achieving the roughest surface among all samples (
Figure 9). We postulate that an excessively high ratio introduces excessive water evaporation or disrupts the stability of the injection plume. This likely leads to the formation of a broad distribution of droplet sizes, including a substantial population of fine, unmelted or partially melted particles that fail to spread adequately upon impact, and/or large, inadequately atomized droplets that create irregular protrusions. The resultant coating is thus highly heterogeneous, with poor inter-splat bonding and elevated porosity, as corroborated by the SEM and porosity data (
Figure 5 and
Figure 6).
With a subsequent decrease in the water ring flow rate ratio (Samples 3–5), a clear decreasing trend in roughness is observed (
Figure 13). This indicates a gradual return to a more favorable atomization and deposition regime. As the ratio moves away from its extreme maximum, the droplet formation and in-flight heating characteristics improve, promoting better splat spreading and a more continuous microstructure. Notably, Sample 5 (Water Ring Flow Rate Ratio: 80.28%), with the second-lowest ratio, achieved a surface roughness (
Ra = 198.67 nm) comparable to the optimal Sample 1 (Water Ring Flow Rate Ratio: 79.66%) (
Figure 13). This confirms that the most favorable coating conditions are achieved at the lower end of the investigated water ring flow rate ratio spectrum.
The differences in average Ra values across samples did not reach statistical significance via one-way analysis of variance (ANOVA) (p = 0.202), which is likely attributable to the limited number of measurements per group (n = 3) and the intrinsic variability of the coating surfaces. However, the consistent ranking of samples and the parallel trends observed across all other roughness parameters (Rq, Rmax, and Surface Area Difference) strongly indicate a systematic effect of the water ring flow rate ratio on the surface topography. The consistency of this non-monotonic trend across all four roughness parameters (Ra, Rq, Rmax, and Surface Area Difference) underscores the robustness of this finding. It conclusively demonstrates that the water ring flow rate ratio is not merely a process variable but a critical parameter governing the suspension atomization efficiency and, consequently, the final topography of SPS coatings. An optimal window exists at lower ratios, while exceeding a certain threshold triggers a deterioration in surface quality.
The analysis of the water ring flow rate ratio’s influence reveals a complex interplay between the coating properties. There appears to be a trade-off between achieving low porosity and maximizing adhesion strength. For instance, Sample 1 offers the highest density, while Sample 2 provides superior adhesion strength. Similarly, surface roughness does not exhibit a simple linear relationship with the ratio. This interplay suggests that the definition of an ‘optimal’ coating is not universal but is inherently application-specific, depending on which property is deemed most critical for the intended service environment.
4. Conclusions
The effect of water ring flow rate ratio on the preparation of yttrium oxide coatings by suspension plasma spray has been studied in this work. Our work shows that the water ring flow rate ratio exhibits a positive correlation with the coating porosity, with a linear regression coefficient R2 of 0.91236. When the water ring flow rate ratio is as low as 79.66%, the porosity can reach a minimum of 0.946% (Sample 1). As the water ring flow rate ratio increases, the adhesion strength shows an overall upward trend. The maximum adhesion strength of 27.02 MPa was achieved at a water ring flow rate ratio of 85.45% (Sample 2).
Because the core objective of this study focuses on investigating the influence of the water ring flow rate ratio upon the microstructure and properties of the coating, it does not address the real-time variation in porosity during the deposition process or its evolution over time following deposition. Future work will investigate the thermal stability and long-term evolution of the microstructure, including porosity, under simulated service conditions to assess the coating’s performance durability. At the same time, we recognize that to accurately quantify the adhesion strength and its trend of change, multiple repeatability tests must be conducted. Future work will focus on reliably quantifying interface characteristics through statistically significant numbers of bond strength tests.
Measurements of coating thickness indicate that the thickness varies within a certain range across different samples, though each sample exhibits relatively uniform thickness. The mechanical properties of the coating (porosity, adhesion strength) show no apparent correlation with thickness, being primarily influenced by the critical parameter of water ring flow rate ratio.
The AFM surface analysis unequivocally demonstrates that the surface roughness of the Y2O3 coatings is not a linear function of the water ring flow rate ratio but exhibits a distinct non-monotonic dependence. The most significant finding is that the highest roughness was achieved at the highest ratio (Sample 2 (Water Ring Flow Rate Ratio: 85.45%)), not the lowest, indicating a threshold effect in the process. As the ratio decreases from this peak, the surface quality systematically improves, with the lowest roughness values being achieved at the lowest ratio (Sample 1 (Water Ring Flow Rate Ratio: 79.66%)). This trend, which is consistent across all statistical roughness parameters (Ra, Rq, Rmax), conclusively identifies the water ring flow rate ratio as a critical and precise control parameter for tailoring coating topography.
Based on the comprehensive evaluation of all investigated parameters—porosity, adhesion strength, and surface roughness—the definition of the optimal coating is necessarily nuanced:
For applications where minimized porosity and superior surface smoothness are the primary objectives (e.g., for corrosion or diffusion barriers), the coating deposited with the lowest water ring flow rate ratio (Sample 1) presents the most favorable characteristics. Conversely, if maximizing adhesion strength is the paramount requirement, even at the expense of higher porosity, then a moderate ratio (e.g., Sample 5) would be the optimal choice.
Considering the overall balance of properties for a high-integrity coating, Sample 1 (lowest ratio) is identified as providing the most robust and desirable combination, offering the best compromise by simultaneously delivering the lowest porosity, a sufficiently high adhesion strength, and the smoothest surface. Therefore, from a general coating performance perspective, a lower water ring flow rate ratio is recommended.
In short, this work not only clarifies the role of the water ring flow rate ratio in SPS but also provides a crucial map of the property trade-offs. It establishes that optimal coating design is application-locked and offers clear guidance for selecting process parameters to achieve targeted coating performance. Future work will focus on expanding the parameter space and directly testing the performance of these tailored coatings in specific application environments.
