Article

Synchronous Measurement of Optical Transmission and Viscoelastic Properties of Polymer Optical Fibers

1
Civil Engineering Faculty, University of Belgrade, 11000 Belgrade, Serbia
2
Faculty of Technology and Metallurgy, University of Belgrade, 11000 Belgrade, Serbia
3
Department of Physical Chemistry, “Vinča” Institute of Nuclear Sciences—National Institute of the Republic of Serbia, University of Belgrade, Mike Petrovića Alasa 12-14, 11001 Belgrade, Serbia
4
Institute of Physics, University of Belgrade, Pregrevica 115, 11080 Belgrade, Serbia
*
Authors to whom correspondence should be addressed.
Coatings 2025, 15(11), 1295; https://doi.org/10.3390/coatings15111295
Submission received: 14 October 2025 / Revised: 1 November 2025 / Accepted: 3 November 2025 / Published: 6 November 2025
(This article belongs to the Special Issue Advanced Polymer Coatings: Materials, Methods, and Applications)

Abstract

In this paper, synchronous mechanical and optical measurements are proposed using the dual cantilever mode of dynamic mechanical analysis (DMA). It was demonstrated that this mode enables the detection of phase transitions in both the core and cladding materials of polymer optical fibers (POFs), with corresponding changes in optical signal intensity observed across different light wavelengths. In dual cantilever mode DMA, an increase in optical transmission was recorded between the two detected glass transition temperatures. The initial increase in transmission is attributed to cladding softening and the consequent reduction in internal stresses in the POF, while the maximum in optical transmission coincides with the beginning of the phase transition in the core material. To compare and interpret the optical and thermo-mechanical results, Differential scanning calorimetry (DSC) and Fourier transform infrared (FTIR) measurements were carried out on POF pieces, as well as separately on the core and cladding materials. This integrated technique yields quantitative data on a material’s viscoelasticity and light-transmission changes, making it valuable for quality control and for predicting the long-term behavior of advanced POFs in various applications.

1. Introduction

Dynamic mechanical analysis (DMA) [1,2,3] is one of the most powerful techniques for studying the behavior of polymer composite materials, and it can also be highly effective for simulating the performance of polymer optical fibers (POFs) under real application conditions. A POF consists primarily of a central core encased by a coated layer referred to as the cladding. The core is engineered to possess a higher refractive index than the cladding, enabling it to play a crucial role in guiding light. When light is introduced into the fiber at an incidence angle exceeding the critical angle, it is confined within the core by total internal reflection at the core–cladding boundary. This guiding mechanism traps the light in the core and supports its propagation over long distances with only minor losses arising from scattering and absorption. POFs serve as advanced sensing elements across a wide range of applications [4], notably in the structural integrity assessment of concrete structures and bridges, where they facilitate the detection of stress, strain, and potential cracking [5]. Additionally, in the medical field, polymer optical fibers are employed in minimally invasive procedures and diagnostics, enabling precise measurements in biological environments [6]. Their versatility and adaptability make them valuable tools in both engineering and healthcare. Since for POFs it is equally important to enhance both the mechanical and optical properties [7,8,9], the ability to perform synchronous measurements of optical characteristics during DMA would represent a significant advancement. Such an approach would substantially extend the scope of investigations on both standard and specialized POFs [10], whether studied alone or embedded within composite materials [11]. In classical synchronous optical and mechanical experiments using Instron machines for extension of POFs, it has been shown that both bending [12] and temperature [13] exert a significant influence on the transmission properties of POFs. Simultaneous optical and mechanical measurements on polymer optical fibers (POFs) using single cantilever mode DMA have also been reported [14]. The findings demonstrated that variations in optical transmission are correlated with the glass transition of the core material, and that the sensitivity depends on the wavelength employed [14,15].
Since the materials used for the POF core and cladding exhibit relatively high thermal conductivity, temperature gradients develop during heating and cooling. As a result, the core and cladding do not remain at the same temperature, and their thermal distribution varies across the fiber cross-section. This mismatch during fiber formation induces internal stresses at the core–cladding interface and leads to birefringence [16]. Internal stresses strongly affect both the mechanical and optical properties of POFs under varying temperatures and different types of applied loads during service [17]. Therefore, synchronous measurements using dual cantilever mode DMA are proposed as an effective approach to enhance the examination of POF behavior. Dual cantilever mode DMA is not primarily intended for investigations of fiber geometry samples, but some experiments of this type have been presented [18,19]. Dual cantilever bending in DMA provides several advantages over the single cantilever mode, particularly with respect to stress distribution, sensitivity, and applicability to certain polymer systems. In the dual cantilever mode, bending moments are applied symmetrically at both ends of the specimen. By contrast, in the single cantilever mode, the moment is generated at one fixed end while the opposite end oscillates freely [20]. Because the POF is fixed at two points, the stresses induced for the same applied displacement amplitude are greater than in the single cantilever mode. In this study, the dual cantilever mode DMA of POFs is carried out simultaneously with measurements of the transmitted optical signal intensity, and the results are presented and discussed. The results are compared with those obtained from Differential scanning calorimetry (DSC) and Fourier transform infrared (FTIR) measurements conducted on POF pieces, as well as separately on the core and cladding materials, and with DMA measurements performed under comparable conditions.
It has been demonstrated that dual cantilever mode DMA can be used to detect phase transitions in both the core and cladding materials of POFs, while the synchronously recorded optical signal intensities show a consistent correlation with these transitions. During dual cantilever DMA, an increase in optical transmission is observed between the two glass transition temperatures identified in the DMA results.

2. Materials and Methods

The polymer optical fibers used in this study consist of a poly (methyl methacrylate) PMMA core and a fluorinated cladding (ESKA GK-40, Mitsubishi Chemical, Tokyo, Japan), with an average diameter of 1 mm and a core diameter of 0.98 mm. It should also be noted that, according to the manufacturer’s specifications, the tolerances in both the fiber diameter and the core diameter can be as large as ±60 μm.
The FTIR spectra of the core and cladding in KBr pellets were recorded in transmission mode over the range 500–4000 cm–1, with a resolution of 4 cm−1, using a BOMEM spectrophotometer (Hartmann & Braun, MB series, Frankfurt, Germany).
The thermal properties of the entire POF, as well as of its core and cladding materials separately, were examined in a nitrogen atmosphere over the temperature range from room temperature to 200 °C at a heating rate of 10 °C/min using a differential scanning calorimeter DSC (Q10, TA Instruments, New Castle, DE, USA). Samples (5–10 mg) were hermetically sealed in aluminum pans and placed in the DSC cell, with an empty aluminum pan used as the reference. Measurements were performed under continuous nitrogen purge at a flow rate of 50 mL/min.
Dynamic temperature scan tests were carried out on a DMA instrument (Q800; TA Instruments, USA) over the range of approximately 40–130 °C. Measurements were performed in dual and single cantilever bending modes using a heating rate of 3 °C min−1, an oscillation frequency of 1 Hz, and a displacement amplitude of 20 μm.
Figure 1 presents the experimental setup for synchronous measurements, which is composed of two main subsystems: mechanical and optical.
Thermo-mechanical measurements and data acquisition were carried out using a DMA instrument interfaced with a personal computer (PC). Dynamic temperature scan tests in dual-cantilever mode were conducted on the POF samples. During these tests, light from a light-emitting diode (LED) was launched into the fiber under investigation, and the transmitted optical intensity was continuously recorded in real time.
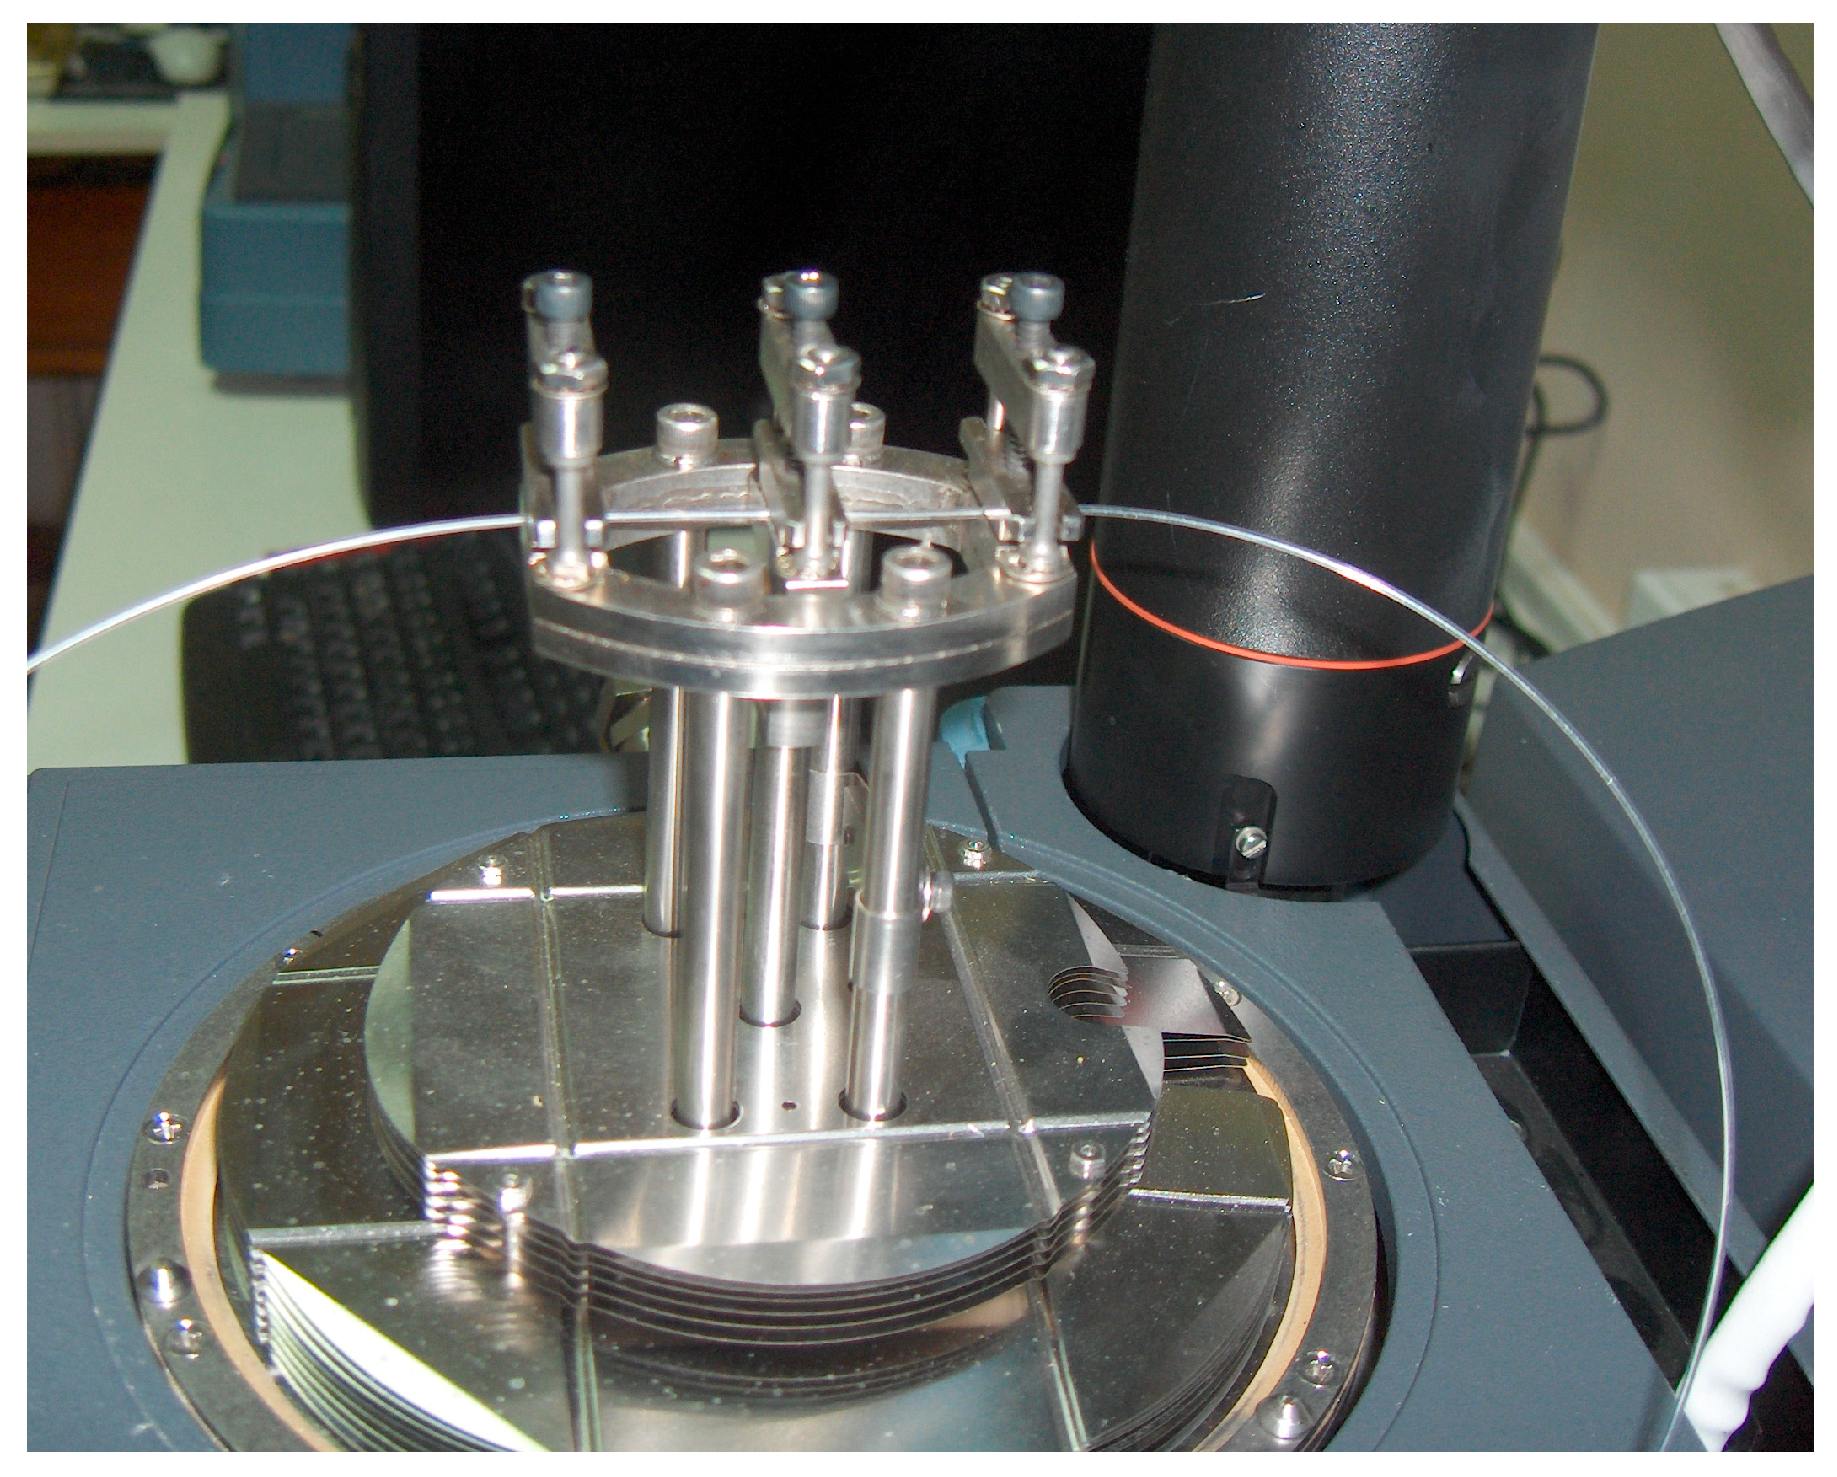
The investigated POF (ESKA GK-40) was mounted through the movable and stationary fixtures and placed inside the thermal chamber. The fiber length between the fixed clamps was 60 mm, with approximately 30 cm of the POF positioned inside the chamber. The total fiber length from the LED source to the photodetector was 3 m. The clamped sections of the optical fiber were not additionally protected during measurements. The clamping force was carefully adjusted to prevent the POF from slipping while ensuring it remained undamaged; this was verified after each test. A photograph of the clamped fiber inside the chamber is shown in Figure 2.
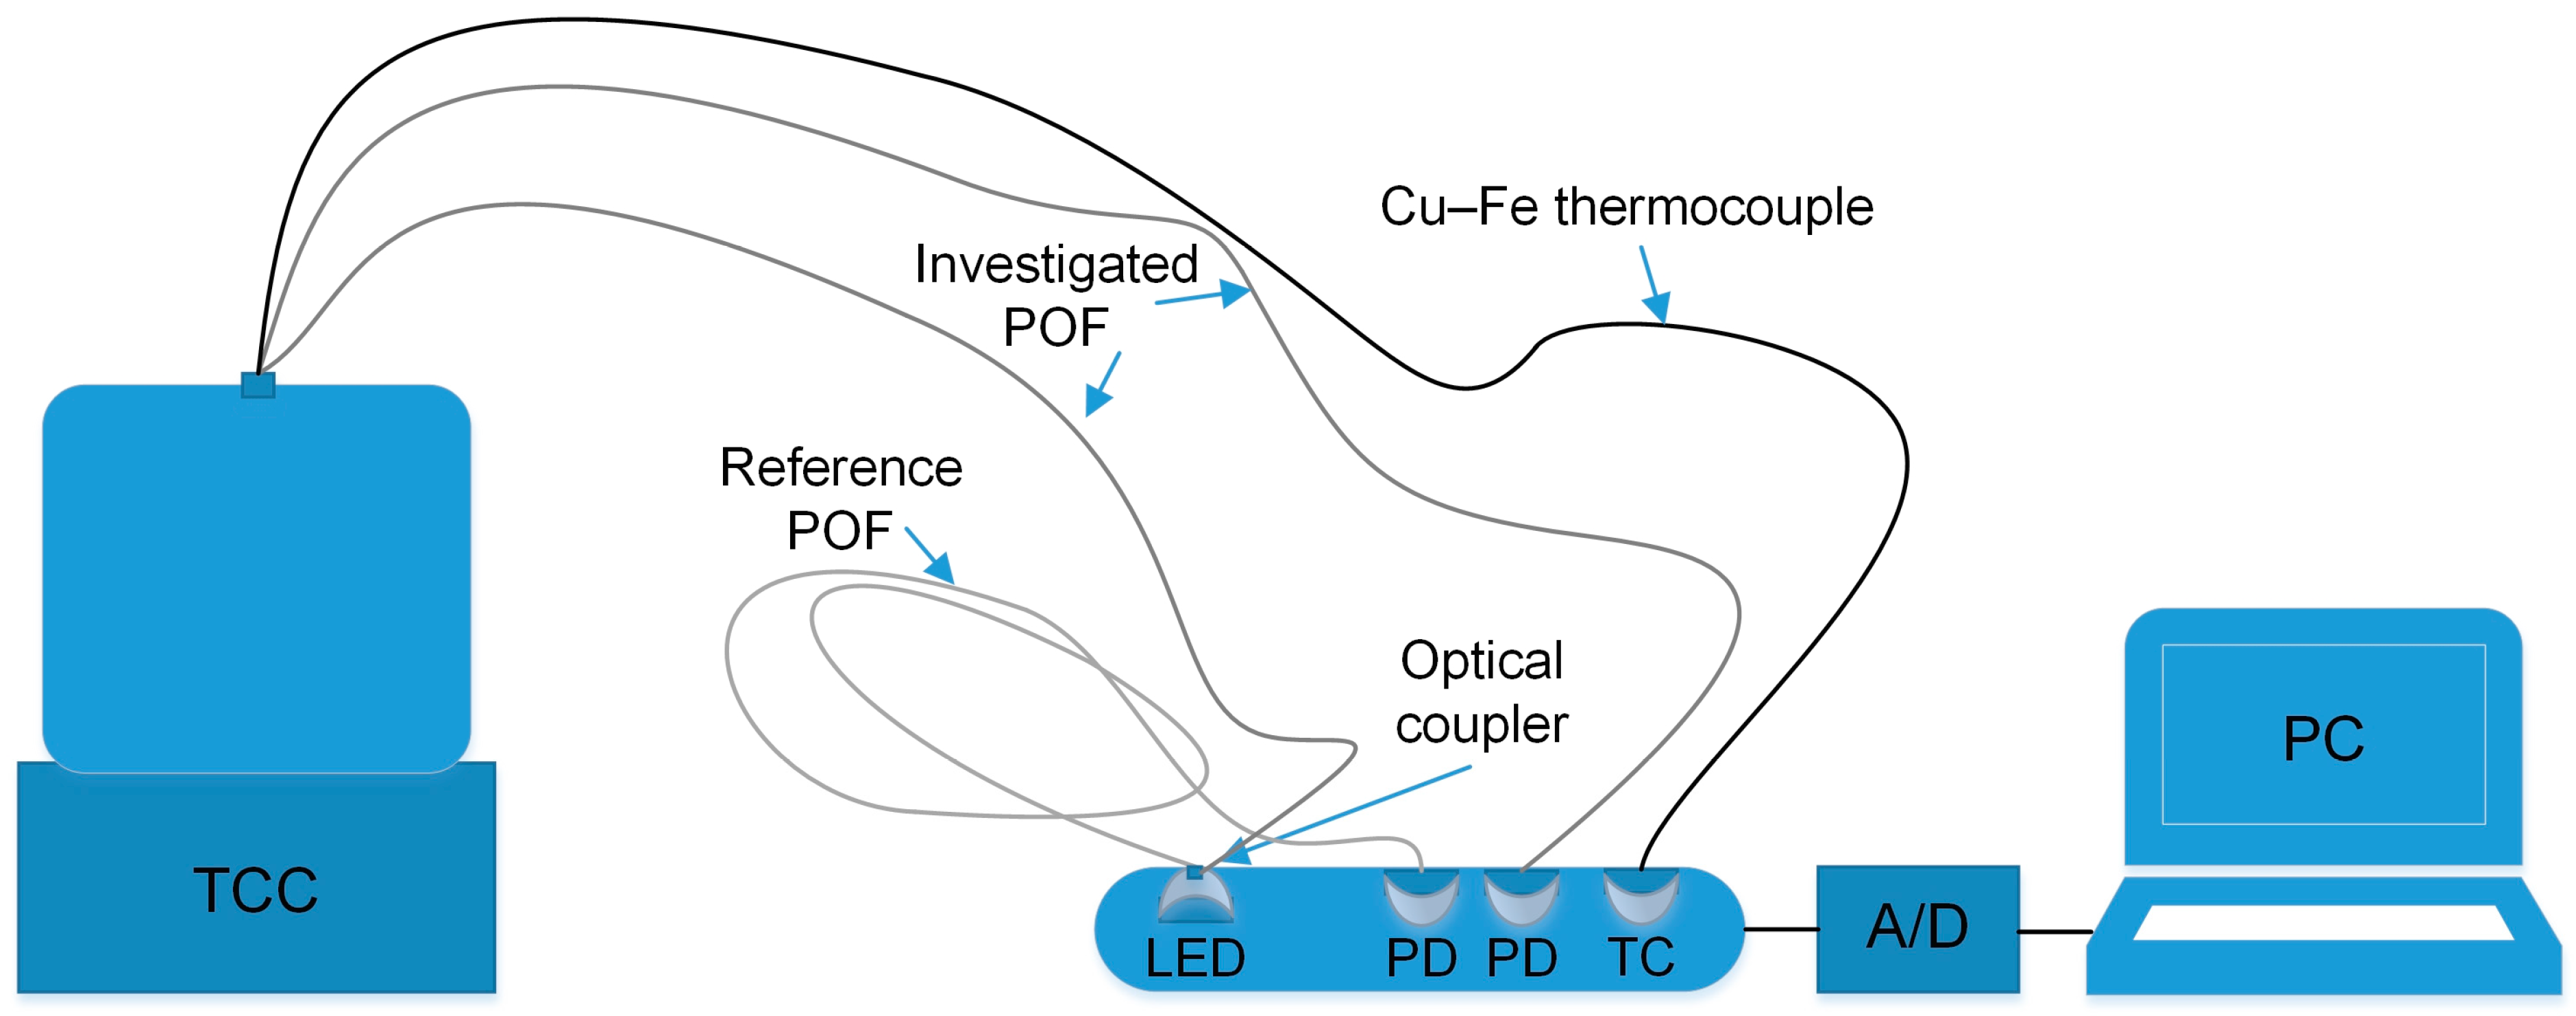
The free ends of the POF were guided out of the DMA instrument’s temperature chamber through an opening at the top and subsequently connected to the light source (LED) and the photodetector (PD) setup. To compensate for potential variations in light intensity, a reference POF was connected to the same light source via an optical coupler, with its opposite end linked to a second PD. The LEDs used had peak wavelengths of 840, 650, 470, and 400 nm. The PDs were phototransistors. Light from the LED source was coupled into both the measuring and reference POFs, and the transmitted intensities were recorded by the PDs. The PD outputs were connected to the acquisition system (Measurement Computing USB-1208FS) and a PC.
During testing, the storage modulus (E′), loss modulus (E″), and loss factor (tan δ) were recorded as functions of temperature. Two transition temperatures of the POF were identified. Previous single cantilever DMA tests on POF [14] demonstrated a significant influence of temperature on optical transmission. To decouple the effects of temperature and applied mechanical stress, the central 30 cm section of a 3 m POF was placed in a temperature-controlled chamber (TCC), and the optical signal intensity was recorded across the same temperature range used in the DMA tests (Figure 3). A reference POF was also connected to the optical system.
To compare and interpret the optical and thermo-mechanical results, DSC and FTIR measurements were performed on POF segments as well as on the core and cladding materials separately. Pure core and cladding components were obtained following the procedure described in the literature [7]. For core isolation, short POF pieces (3–4 cm) were immersed in 1,4-dioxane (diethylene dioxide), which dissolves the core and swells the cladding. After 10 min in the solvent, the samples were removed, and the swollen cladding was stripped off using soft paper and hands. The remaining cores were dried in a vacuum oven at about 60 °C. For cladding isolation, 3–4 cm POF segments were soaked in chloroform for 12 h, as only PMMA dissolves in it. To obtain pure cladding material, the 3–4 cm long pieces of POF were soaked in chloroform for 12 h, as only PMMA dissolves in this solvent. The recovered cladding pieces were taken out from the solution, wiped with soft paper, and dried in a vacuum oven below 55 °C.

3. Results

3.1. FTIR Measurements

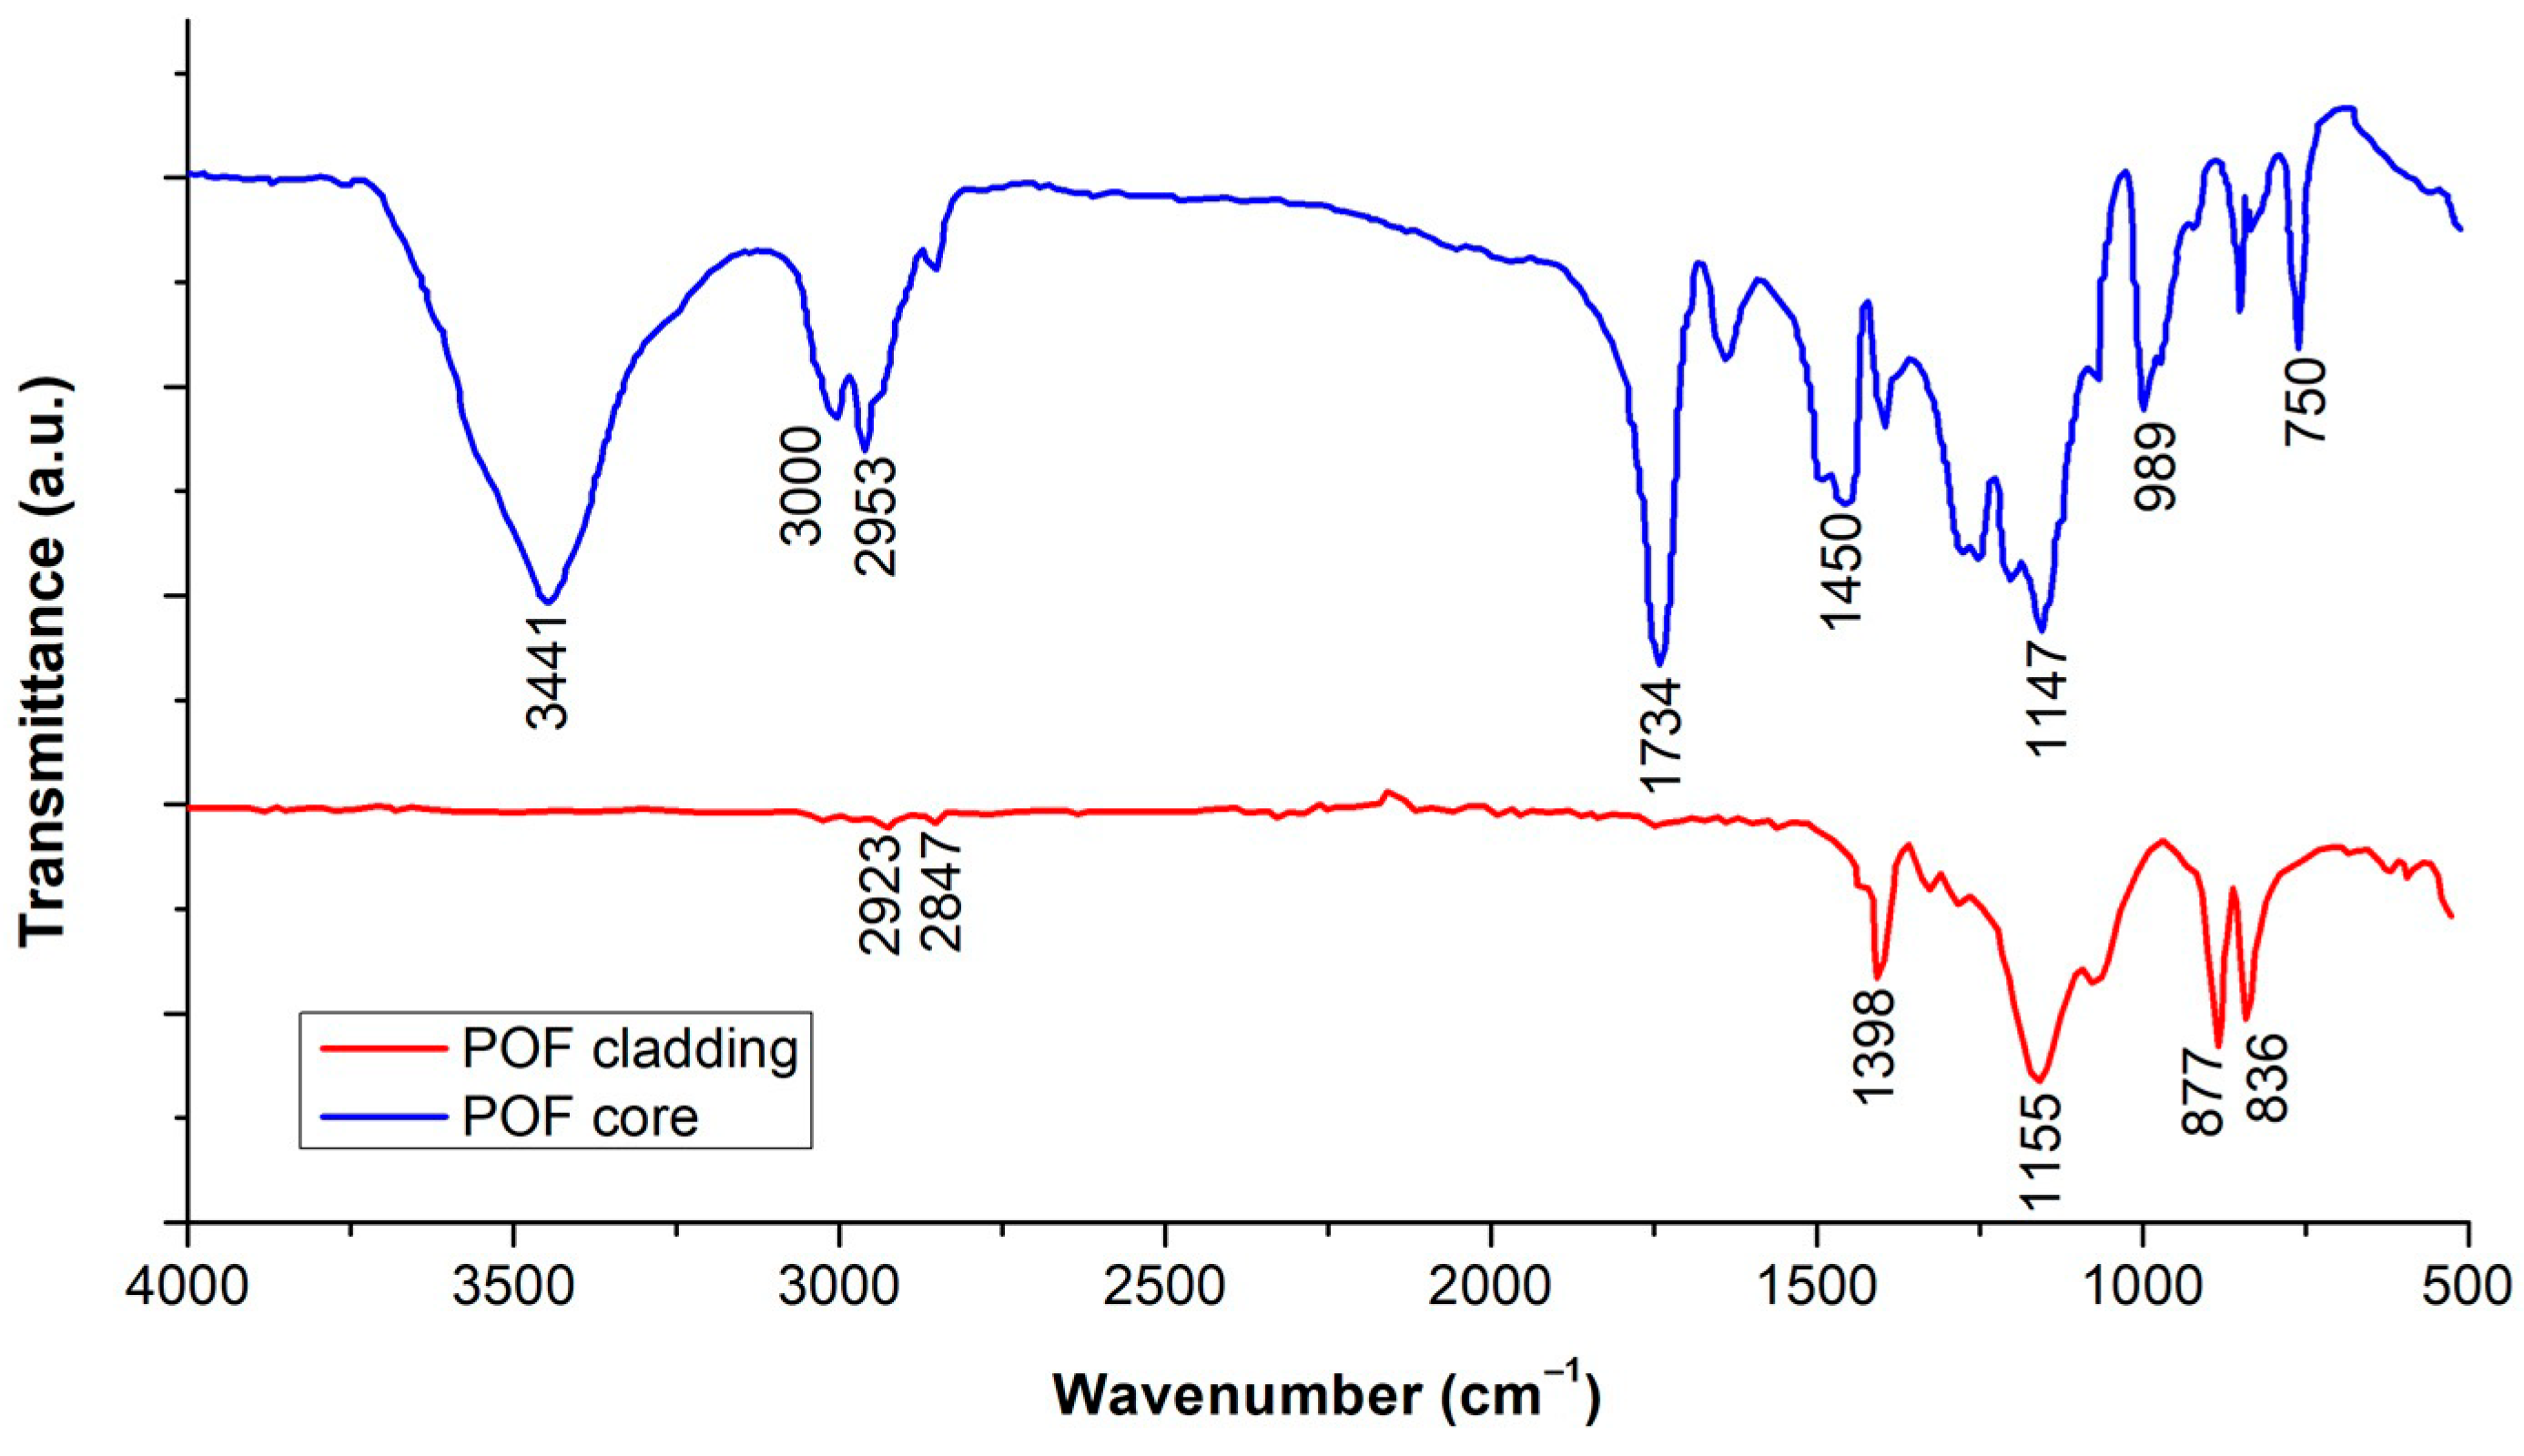
Obtained FTIR spectra of core and cladding materials are presented in Figure 4.
The FTIR spectrum of POF core indicates the details of functional groups as they are present in the literature for pure PMMA [21]. The broad peak at 3441 cm−1 can be explained owing to the O-H group stretching vibration. The peaks at 2953 cm−1 and 3000 cm−1 are assigned to methylene asymmetric stretching vibrations (CH2) and (CH3), respectively. A sharp, intense peak at 1734 cm−1 appeared due to the presence of ester C=O stretching vibration.
Peaks at 1450 cm−1 are assigned to CH3 deformation modes. The 1147 cm−1 is assigned to CH3 twisting modes. The peak 989 cm−1 typically corresponds to C-H bending, while the broad absorption band around 750 cm−1 is not attributed to C=O bending but rather to the stretching of C-O bonds in the ester group. A characteristic strong C=O stretching peak for PMMA appears at a much higher wavenumber, around 1734 cm−1, as noted by researchers [7]
FTIR spectra of cladding material show strong absorption bands in the region between 1155 cm−1 and 1398 cm−1, which is evidence of vibration absorption of C−F bonds in the polymer chain, and this is consistent with data reported in [7,22], and with the manufacturer’s technical specification [23], both of which identify the cladding as a fluoropolymer. Very small absorption bands in the region between 2847 cm−1 and 2923 cm−1 reveal the presence of a few C–H groups. Two strong absorption bands in the lower wavenumber area between 836 cm−1 and 877 cm−1 indicate that it could be the deformation vibrations absorption of C–H.
These results, which are very similar to those reported in [7], suggest that the cladding material is either a fluorinated polyolefin (polyfluoroolefin), a copolymer of olefins and fluorinated olefins, or a blend of polyolefins with fluorinated polyolefins.

3.2. DSC Measurements

DSC analysis of the POF core revealed a glass transition temperature (Tg) of approximately 119 °C, whereas the fluorinated cladding exhibited a melting temperature (Tm) near 127 °C. As shown in Figure 5, the DSC thermograms confirm the crystalline behavior of the cladding through its distinct melting point, while only a single glass transition at about 119 °C is observed, attributable to the amorphous PMMA core. Generally, homopolymers display only a single thermal anomaly in the DSC curve. Amorphous PMMA can exhibit additional relaxation processes, such as β and γ relaxations, but their intensities are usually insufficient to be detected by standard DSC techniques [24].
Table 1 provides a comparison of the glass transition (Tg) and melting (Tm) temperatures determined by DSC for the POF, as well as for the isolated core and cladding samples.

3.3. Dual Cantilever DMA on POF

Dynamic mechanical analysis is a sensitive technique used to characterize the thermo-mechanical response of materials by separating the dynamic responseinto elastic (E′) and viscous (E″) components [25]. The complex modulus (E*) is defined as E* = E′ + iE″, where E′ represents the stored energy and E″ the dissipated energy. The mechanical loss factor (tan δ), defined as the ratio of loss modulus to storage modulus (tan δ = E″/E′), serves as a key parameter for comparing the viscoelastic behavior of materials [26,27]. DMA is valued for its rapid analysis, high accuracy, and ability to probe materials across wide temperature and frequency ranges, and it is often more sensitive than DSC in detecting phase transitions [28,29]. DSC is utilized to determine the glass transition temperature, which is indicated by a change in heat capacity. This can be assessed from the onset, midpoint, or inflection point of the transition observed on the DSC curve. In contrast, DMA assesses the glass transition temperature using various methods, including the onset of the storage modulus, the peak of the loss modulus, or the peak of the dynamic mechanical loss factor. Because DSC and DMA measure different physical responses of the polymer (heat flow versus mechanical stiffness), the numerical Tg you extract from each method will generally differ. Obviously, when reporting Tg by different modes of DMA, it is necessary to specify the used method since the difference between the techniques can vary as much as 25 °C [1,30]. Additionally, various types of PMMA, such as syndiotactic and isotactic forms, along with different molar masses of PMMA polymers, can exhibit distinct Tg temperatures [31].
The described simultaneous tests were performed at four different light wavelengths: 400, 470, 650, and 840 nm. Using the previously presented transmission spectral characteristics of this POF from [14], it is evident that 470 and 650 nm lie in the central, nearly constant region of the spectrum where maximum transmission occurs. In contrast, the other selected wavelengths, 400 and 840 nm, correspond to the near-ultraviolet and near-infrared edges of the spectrum, respectively, where the transmission changes significantly with wavelength and reaches approximately half of the maximum value.
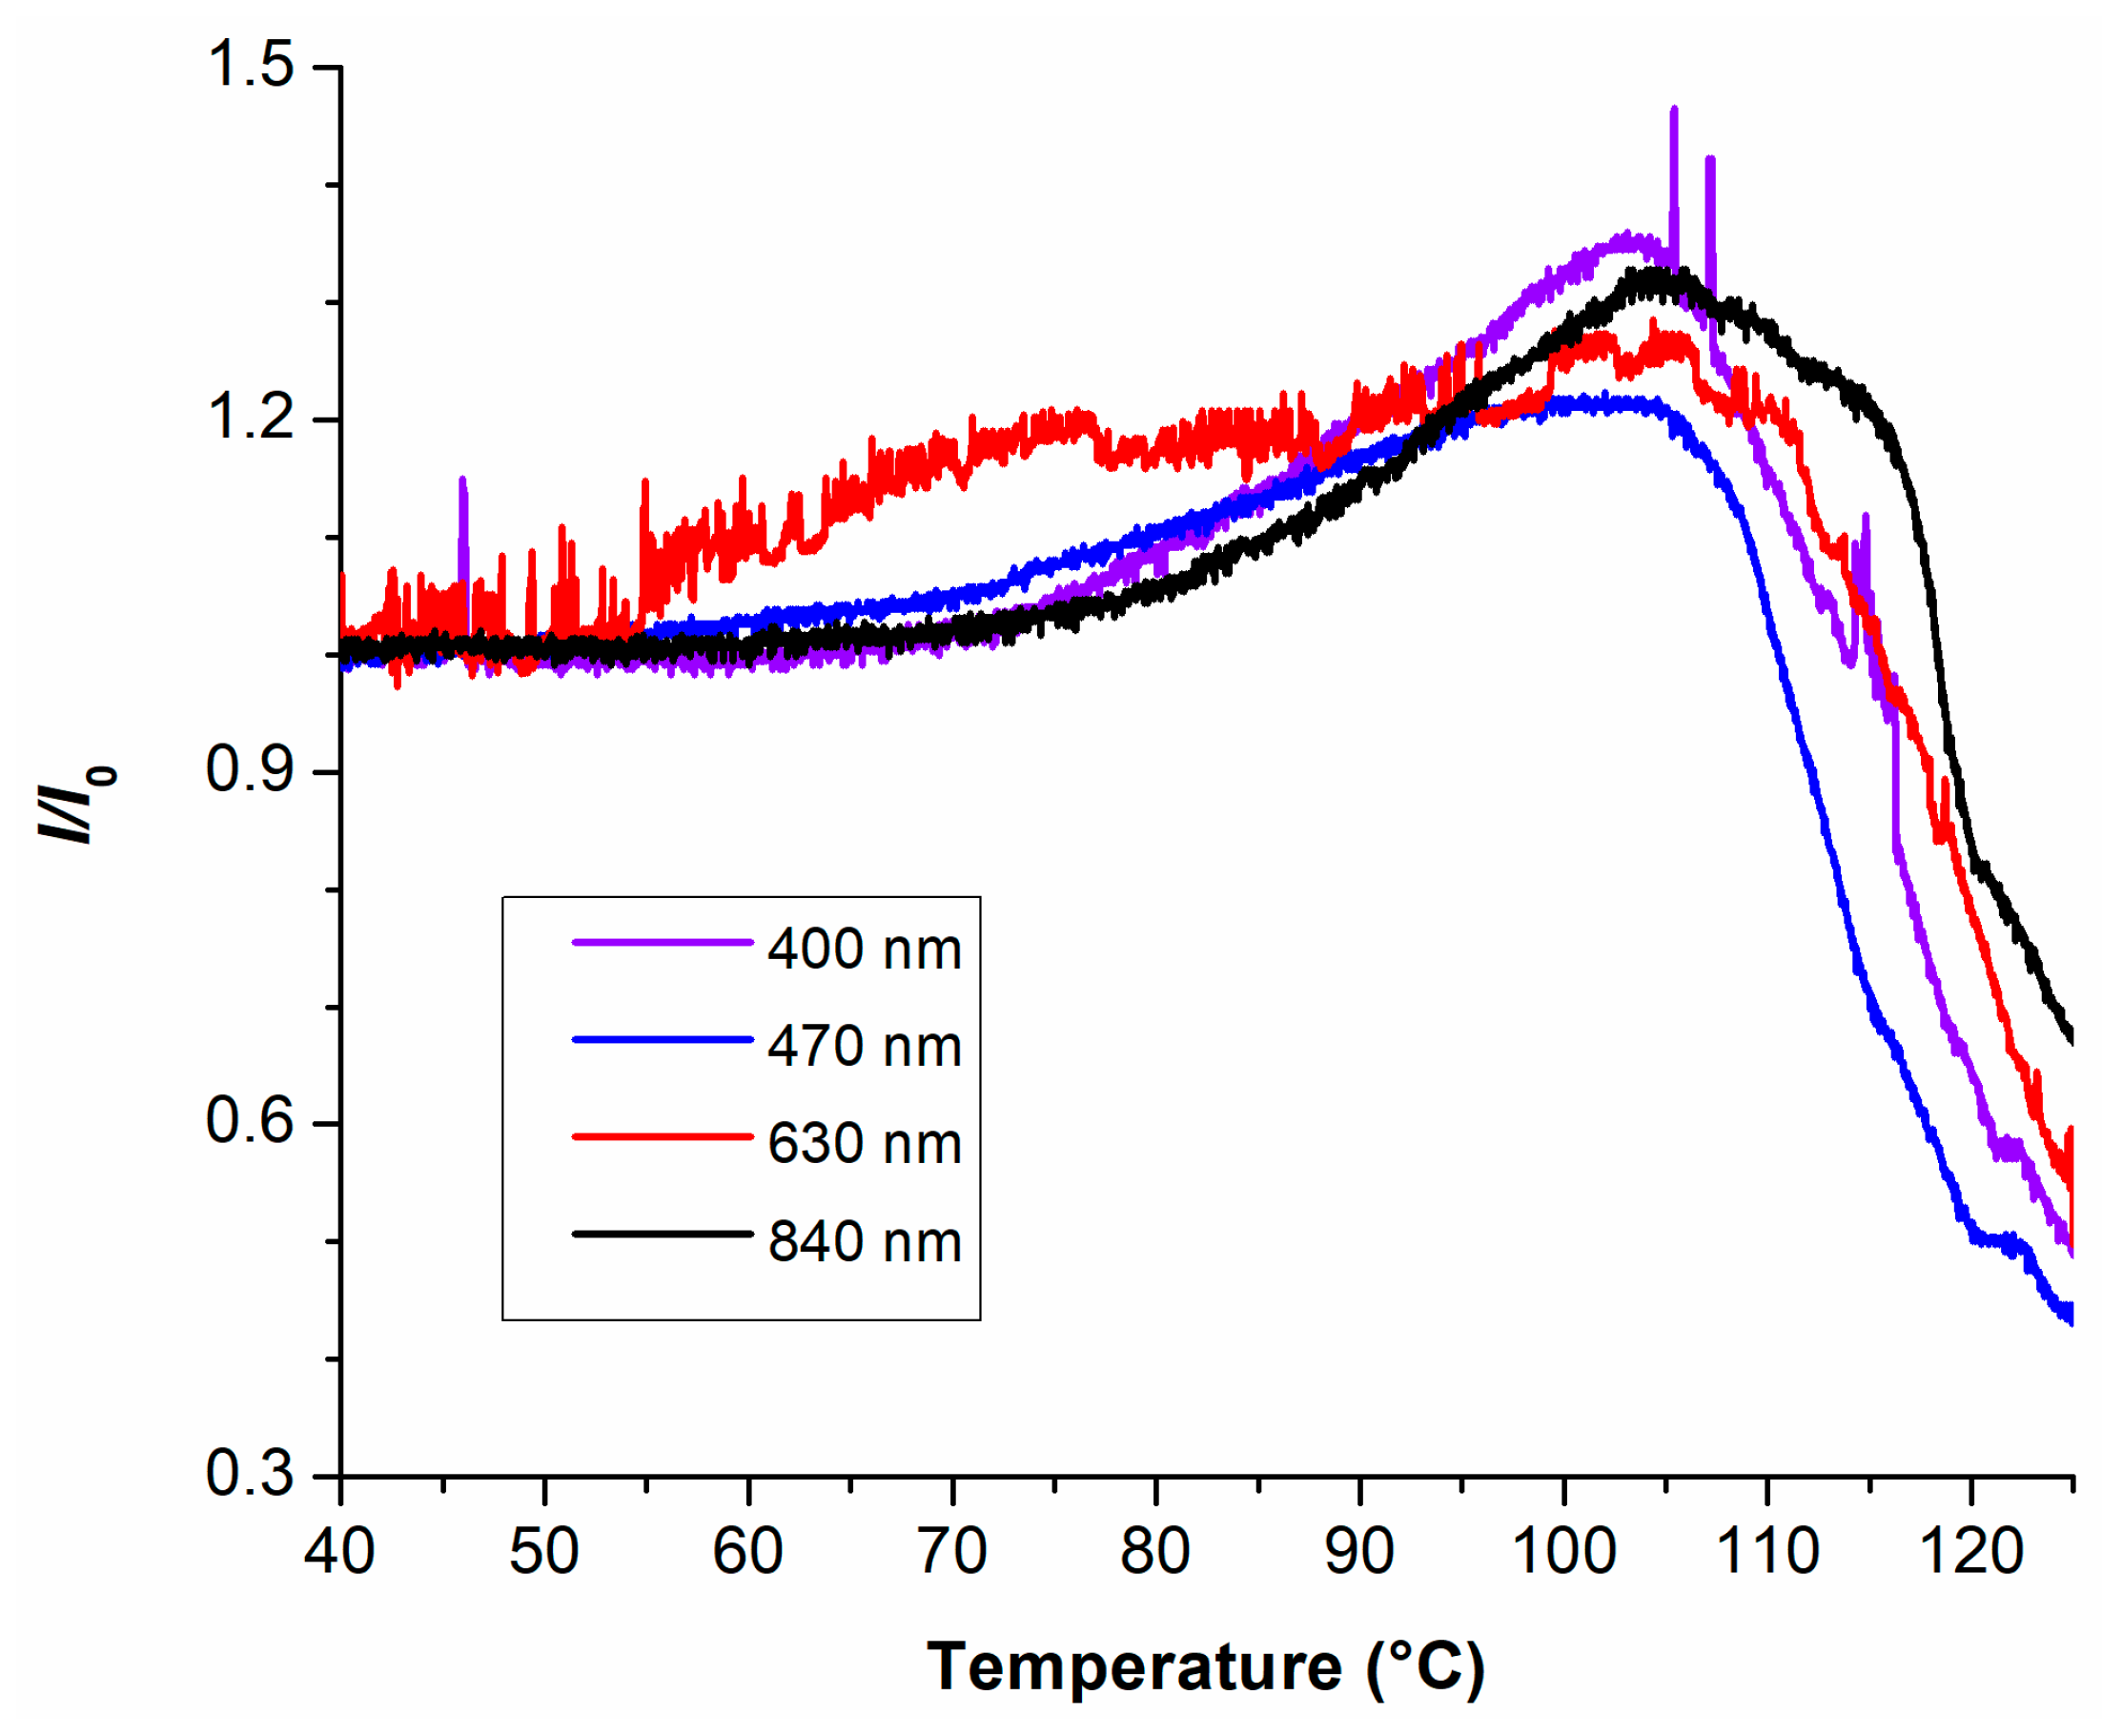
Figure 6 displays the normalized optical signal intensities obtained during the dual cantilever DMA tests for all four wavelengths. The normalized optical signal at each wavelength was calculated as the ratio I/I0, where I is the measured signal intensity at the PD during the test and I0 is the initial signal intensity recorded at the beginning of the corresponding DMA test.
The results show that the optical signals at all wavelengths exhibit similar behavior. The intensity remains nearly constant up to 55–65 °C, after which it increases with temperature. A maximum intensity (Imax) is reached at approximately 104 °C, followed by a decrease. The temperature at which the optical signal begins to increase (Tinc), the temperature corresponding to maximum optical signal intensity (Tmax), and the relative increase in signal intensity at the maximum compared to the initial value, (ImaxI0)/I0, are summarized in Table 2.
Although the single values for Tmax were determined, we have presented Tmax as temperature intervals since the optical signal have some noise level. The presented temperature intervals correspond to optical signal intensity between 99 and 100% around its maximum values, i.e., correspond to the Tmax evaluation with relative error of 1%. The relative increase in optical signal transmission varied with wavelength, whereas the temperatures corresponding to the maximum values were nearly identical. The responses at 400 nm and 840 nm were similar, but the transmission change was more pronounced than at the other two wavelengths.
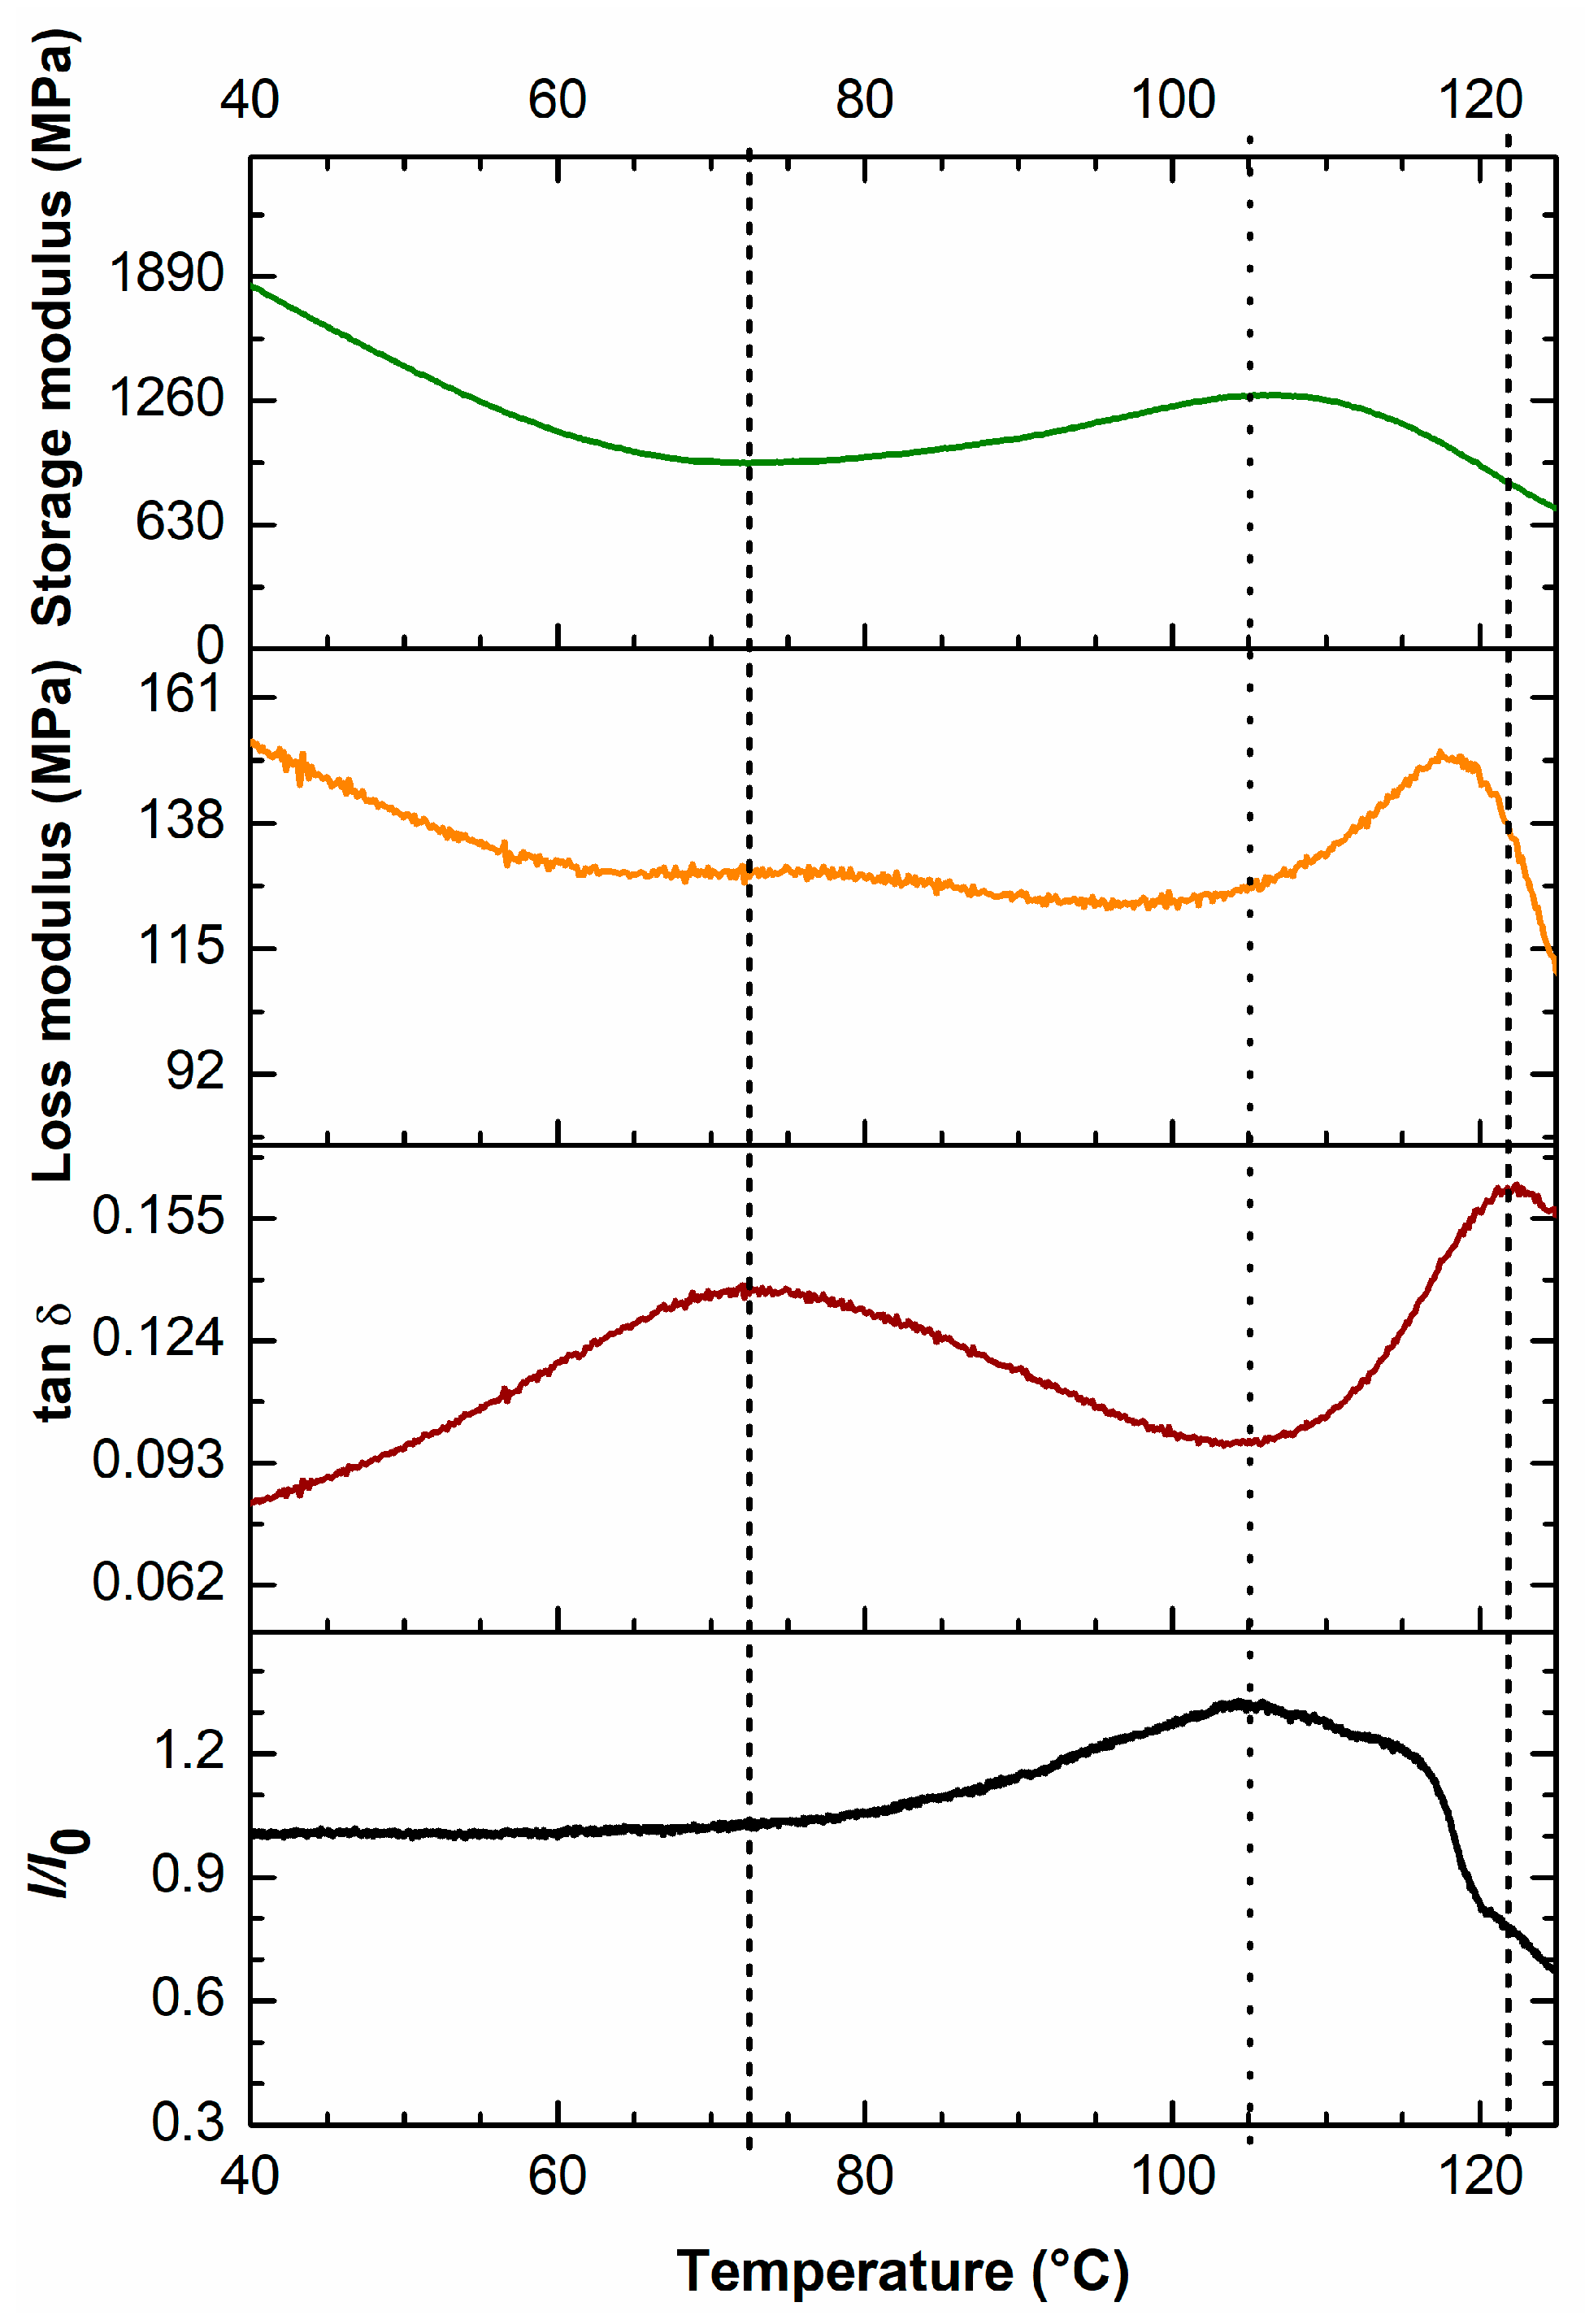
The graphs in Figure 7 are arranged vertically, sharing a common temperature axis for the test conducted at a wavelength of 840 nm. The top graph illustrates the variation of the storage modulus (E′) with temperature, while the subsequent graphs present the loss modulus (E″) and the loss factor (tan δ) as functions of temperature. The bottom graph depicts the normalized optical signal intensity.
Dual cantilever DMA is effective in detecting transition temperatures in POFs and can identify transitions at the core–cladding interface. Based on the DMA, we concluded that the two thermal phases of PMMA correspond to α-relaxation and β-relaxation, respectively. Unlike DSC analysis, DMA of PMMA reveals two key phase transitions. The primary α-relaxation represents the main glass transition associated with the large-scale motion of the polymer’s main chain. In contrast, the secondary β-relaxation is caused by the local, hindered rotational motion of the ester side groups. These Tg transitions appear as an onset point or a sharp decrease in the storage modulus (E′) curve, as peaks in the loss modulus (E″) or tan (δ). The α-transition occurs at a higher temperature, whereas the β-transition is observed at a lower temperature. DMA results clearly show that the tan δ–temperature curve exhibits two maxima, corresponding to transition temperatures of 73 °C and 122 °C. The E′–temperature curve displays a minimum at 73 °C and a maximum at 105 °C. The characteristic temperature Tinc for the optical signals is close to the first transition temperature, while Tmax nearly coincides with the temperature of the E′ maximum, which corresponds to the glass transition temperature of PMMA reported in the literature [32,33].
These transition temperatures are assumed to be associated with phase transitions of the core and cladding materials. At the first transition temperature, the cladding softens, leading to a reduction in intrinsic stresses at the core–cladding interface. The resulting stress release improves optical transmission until the onset of the core phase transition.

3.4. Measurements in the Temperature-Controlled Chamber (TCC)

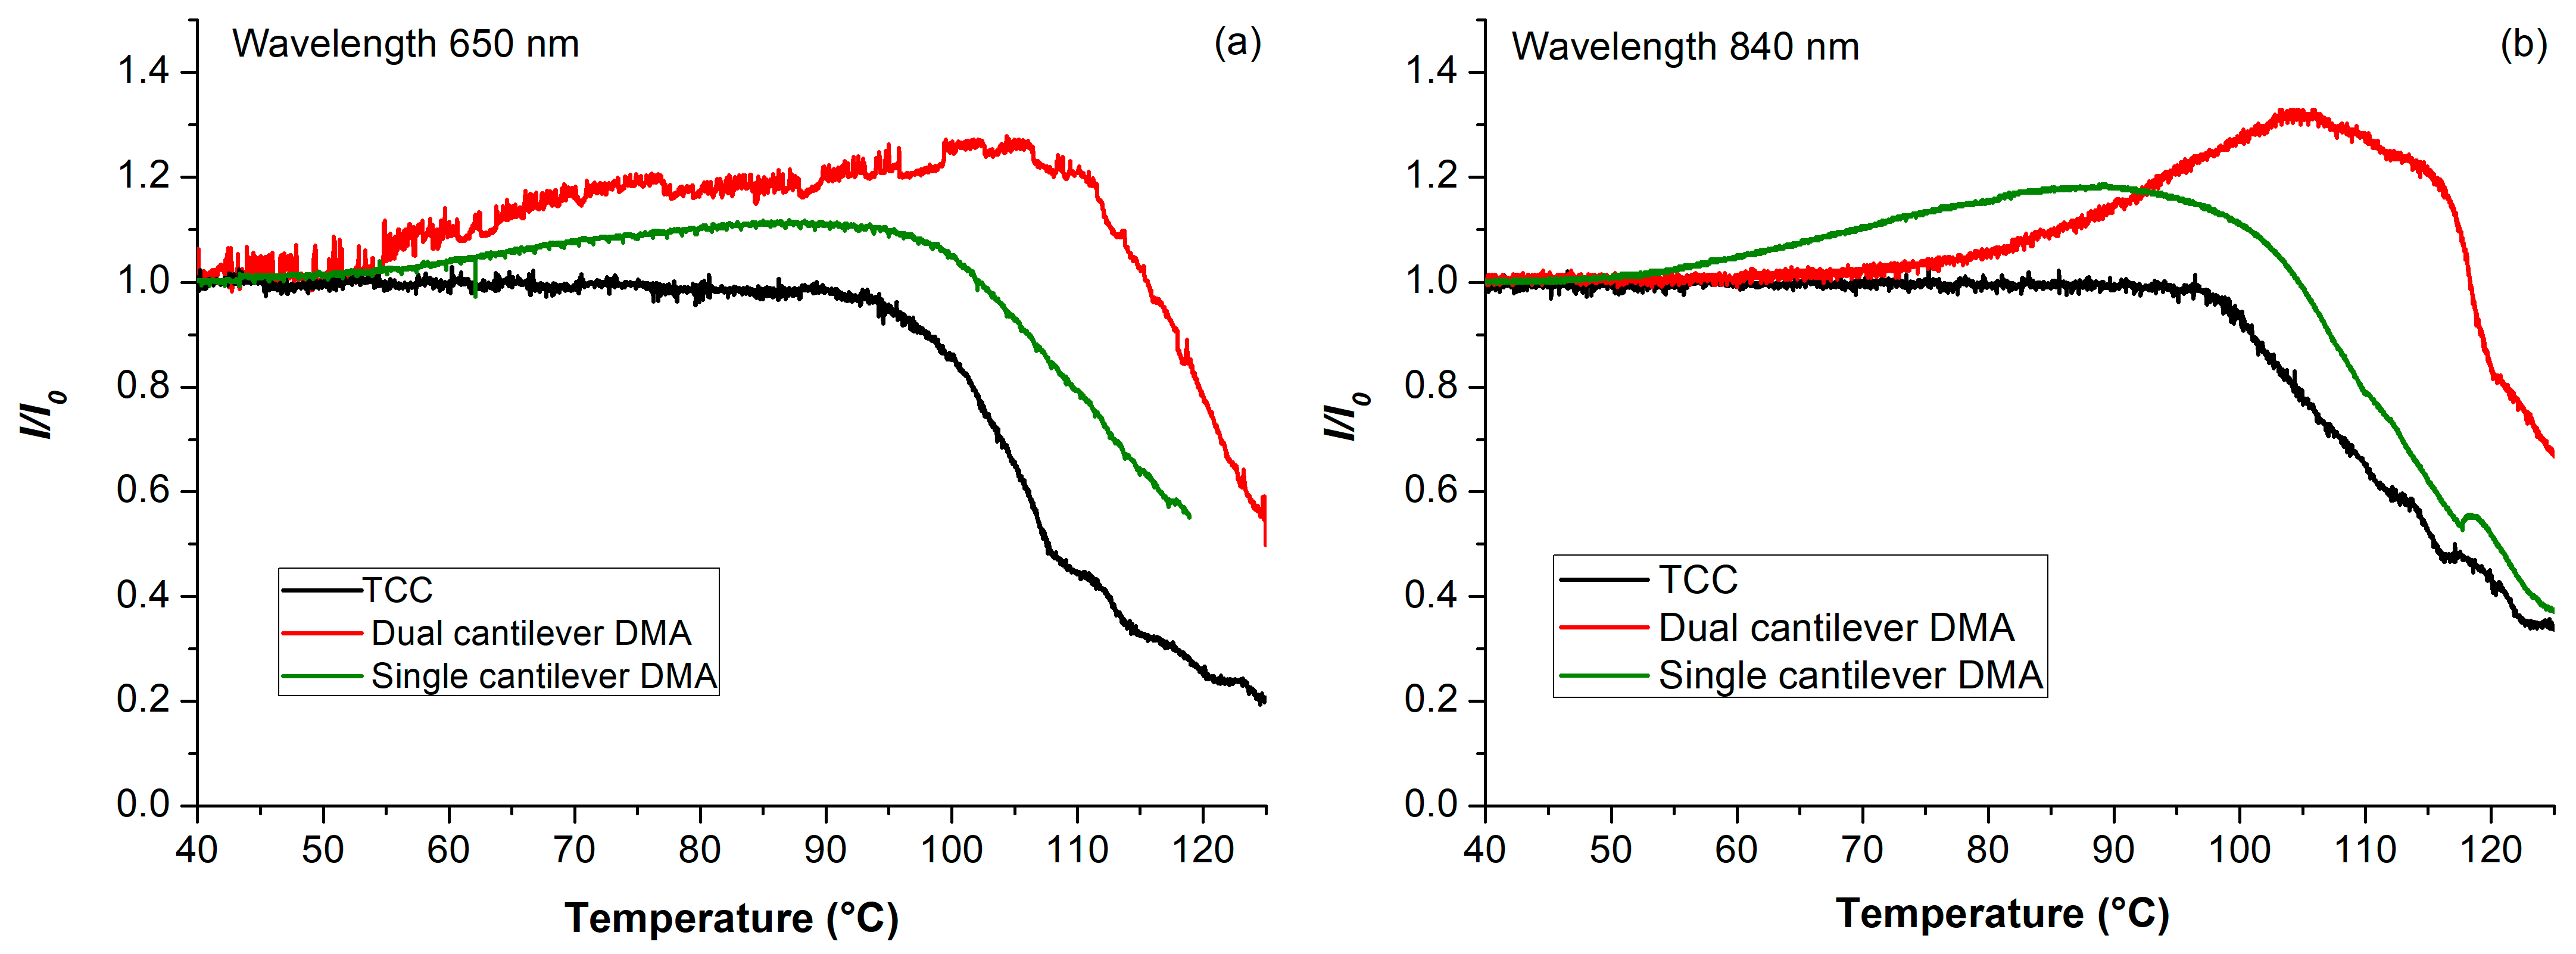
During the DMA temperature scan test, the POF is simultaneously exposed to increasing temperature and mechanical stress. In contrast, heating the POF in the TCC isolates the effect of temperature alone. The variation of the normalized optical signal with temperature under these conditions is presented in Figure 8a for the 650 nm wavelength. For comparison, the same figure also includes transmission changes recorded during a dual cantilever DMA test (corresponding to the data shown in Figure 7) and during a single cantilever DMA test reported in [14].
Figure 8b presents the same combination of graphs for the 840 nm wavelength. During heating in the TCC, the transmission of the investigated POF remained nearly constant between 30 and 95 °C, after which it decreased markedly. Thus, unlike in the DMA tests, no increase in optical transmission was observed. In the single cantilever DMA test described in [14], the optical transmission increased by 10% at 650 nm (50–88 °C) and by 18% at 840 nm (50–90 °C).
The higher dynamic stresses applied during DMA testing facilitated the release of internal stresses in the POF during heating, with the dual cantilever configuration proving most sensitive to phase transition processes in the material. The influence was more pronounced at 840 nm than at 650 nm for both DMA test types.
The results show that variations in the intensity of the optical signals correspond to changes in the storage and loss modulus of the POF during DMA testing. Moreover, the peak optical responses signify the onset of a phase transition from the glassy to the rubbery state in the PMMA core polymer used in POF fabrication. The capability to synchronously record optical and mechanical responses during DMA substantially enhances the analysis of polymer optical fibers, whether investigated independently or incorporated into composite structures.

4. Conclusions

Synchronous DMA and optical transmission measurements on POFs are valuable for simulating their behavior in real applications, where it is challenging to theoretically model all influencing factors. In practice, POFs are subjected to various bending-induced stresses. Although the dual cantilever DMA test is not primarily designed for POFs, it can be applied with appropriate precautions in fiber clamping. DMA is a powerful technique that excels in identifying transition temperatures of PMMA optical fibers. This method offers valuable insights by revealing the thermal transitions occurring at the critical core-cladding interface. Dual cantilever DMA revealed pronounced effects of both temperature and oscillating stress on intrinsic stress release in the POF near the glass transition temperature of the core, effects that could not be detected by other methods. The observed maxima in optical transmission, with increases of 20–35%, demonstrate that transmission changes can serve as a reliable marker for identifying the core glass transition temperature in POFs. These findings are particularly relevant for simulating applications in which POFs within fiber optical sensors are exposed to unexpected fluctuations in ambient temperature and stress. Overall, the results indicate that combining different DMA configurations with optical measurements can provide valuable insight into the behavior of both standard and specialized POFs.

Author Contributions

Conceptualization, L.B., D.S.; methodology, A.K.; validation, D.S.; formal analysis, I.S., Z.L., M.C., and M.G.; investigation L.B. and A.K.; writing—original draft preparation, L.B.; writing—review and editing, A.K., I.S. and D.S.; visualization, A.K.; supervision, D.S.; funding acquisition, M.G. All authors have read and agreed to the published version of the manuscript.

Funding

This work was financially supported by the Ministry of Science, Technological Development and Innovation of the Republic of Serbia (Grant Nos. 451-03-47/2025-01/200135, 451-03-136/2025-03/200017 and 200092).

Institutional Review Board Statement

Not applicable.

Informed Consent Statement

Not applicable.

Data Availability Statement

The data presented in this study are available on request from the corresponding author. The data are not publicly available due to privacy.

Conflicts of Interest

The authors declare no conflicts of interest.

References

  1. Menard, K.P. Dynamic Mechanical Analysis: A Practical Introduction, 2nd ed.; CRC Press: Boca Raton, FL, USA, 2008; ISBN 978-0-429-19016-2. [Google Scholar]
  2. Groenewoud, W.M. Dynamic mechanical analisys. In Characterisation of Polymers by Thermal Analysis; Elsevier: Amsterdam, The Netherlands, 2001; pp. 94–122. ISBN 978-0-444-50604-7. [Google Scholar]
  3. Swaminathan, G.; Shivakumar, K. A Re-Examination of DMA Testing of Polymer Matrix Composites. J. Reinf. Plast. Compos. 2009, 28, 979–994. [Google Scholar] [CrossRef]
  4. Bilro, L.; Alberto, N.; Pinto, J.L.; Nogueira, R. Optical Sensors Based on Plastic Fibers. Sensors 2012, 12, 12184–12207. [Google Scholar] [CrossRef]
  5. Golovastikov, N.V.; Kazanskiy, N.L.; Khonina, S.N. Optical Fiber-Based Structural Health Monitoring: Advancements, Applications, and Integration with Artificial Intelligence for Civil and Urban Infrastructure. Photonics 2025, 12, 615. [Google Scholar] [CrossRef]
  6. Wang, Y.; Zhou, Y.; Qi, L.; Zhang, Y. Soft Optical Fibers for Biomedical and Wearable Technologies: Current Trends and Future Prospects. Adv. Funct. Mater. 2025, 35, 2507712. [Google Scholar] [CrossRef]
  7. Appajaiah, A. Climatic Stability of Polymer Optical Fibers (POF). Ph.D. Thesis, Potsdam University, Berlin, Germany, 2004. [Google Scholar]
  8. Zubia, J.; Arrue, J. Plastic Optical Fibers: An Introduction to Their Technological Processes and Applications. Opt. Fiber Technol. 2001, 7, 101–140. [Google Scholar] [CrossRef]
  9. Savović, S.; Djordjevich, A. Mode Coupling in Strained and Unstrained Step-Index Plastic Optical Fibers. Appl. Opt. 2006, 45, 6775. [Google Scholar] [CrossRef]
  10. Ma, Y.; Fu, D.; Zhang, Z.-F. Solution Doping of PMMA-Based Step-Index Polymer Optical Fibers by Rhodamine B Near Glass Transition Temperature of PMMA. Photonics 2024, 11, 966. [Google Scholar] [CrossRef]
  11. Belkheir, M.; Rouissat, M.; Mokaddem, A.; Doumi, B.; Boutaous, A. Studying the Effect of Polymethyl Methacrylate Polymer Opticals Fibers (POFs) on the Performance of Composite Materials Based on the Polyether Ether Ketone (PEEK) Polymer Matrix. Emergent Mater. 2022, 5, 2075–2085. [Google Scholar] [CrossRef]
  12. Chen, Y.-C. Power Losses in Bent and Elongated Polymer Optical Fibers. Appl. Opt. 2007, 46, 4570. [Google Scholar] [CrossRef]
  13. Chen, L.-W.; Lu, W.-H.; Chen, Y.-C. An Investigation into Power Attenuations in Deformed Polymer Optical Fibers under High Temperature Conditions. Opt. Commun. 2009, 282, 1135–1140. [Google Scholar] [CrossRef]
  14. Musbah, S.; Brajovic, L. Simultaneous Measurement of Optical and Dynamic Mechanical Properties of Plastic Optical Fibers. Chem. Ind. Chem. Eng. Q. 2010, 16, 309–317. [Google Scholar] [CrossRef]
  15. Losada, M.Á.; Mazo, M.; López, A.; Muzás, C.; Mateo, J. Experimental Assessment of the Transmission Performance of Step Index Polymer Optical Fibers Using a Green Laser Diode. Polymers 2021, 13, 3397. [Google Scholar] [CrossRef]
  16. Mousavi, L.; Sabaeian, M.; Nadgaran, H. Thermally-Induced Birefringence in Solid-Core Photonic Crystal Fiber Lasers. Opt. Commun. 2013, 300, 69–76. [Google Scholar] [CrossRef]
  17. Leal-Junior, A.; Frizera, A.; Pontes, M.J.; Antunes, P.; Alberto, N.; Domingues, M.F.; Lee, H.; Ishikawa, R.; Mizuno, Y.; Nakamura, K.; et al. Dynamic Mechanical Analysis on Fused Polymer Optical Fibers: Towards Sensor Applications. Opt. Lett. 2018, 43, 1754. [Google Scholar] [CrossRef] [PubMed]
  18. Rodriguez, P.A.; Radford, D.W. A DMA-Based Approach to Quality Evaluation of Digitally Manufactured Continuous Fiber-Reinforced Composites from Thermoplastic Commingled Tow. J. Compos. Sci. 2022, 6, 61. [Google Scholar] [CrossRef]
  19. Senthilkumar, K.; Subramaniam, S.; Ungtrakul, T.; Kumar, T.S.M.; Chandrasekar, M.; Rajini, N.; Siengchin, S.; Parameswaranpillai, J. Dual Cantilever Creep and Recovery Behavior of Sisal/Hemp Fibre Reinforced Hybrid Biocomposites: Effects of Layering Sequence, Accelerated Weathering and Temperature. J. Ind. Text. 2022, 51, 2372S–2390S. [Google Scholar] [CrossRef]
  20. Henriques, I.R.; Borges, L.A.; Costa, M.F.; Soares, B.G.; Castello, D.A. Comparisons of Complex Modulus Provided by Different DMA. Polym. Test. 2018, 72, 394–406. [Google Scholar] [CrossRef]
  21. Stajcic, I.; Radojevic, V.; Lazarevic, Z.; Curcic, M.; Hadzic, B.; Kojovic, A.; Stajcic, A. Poly(Methyl Methacrylate)-Based Core-Shell Electrospun Fibers: Structural and Morphological Analysis. Coatings 2025, 15, 727. [Google Scholar] [CrossRef]
  22. Cruz, R.; Ataka, K.; Heberle, J.; Kozuch, J. Evaluating Aliphatic CF, CF2, and CF3 Groups as Vibrational Stark Effect Reporters. J. Chem. Phys. 2024, 160, 204308. [Google Scholar] [CrossRef]
  23. Mitsubishi Chemical Group. ESKA Polymer Optical Fiber. Available online: https://www.pofeska.com/pofeskae/download/02.html (accessed on 27 September 2025).
  24. Suzuki, Y.; Kano, T.; Tomii, T.; Tsuji, N.; Matsumoto, A. Relaxation and Amorphous Structure of Polymers Containing Rigid Fumarate Segments. Polymers 2022, 14, 4876. [Google Scholar] [CrossRef]
  25. Nikolaidis, A.K.; Achilias, D.S. Thermal Degradation Kinetics and Viscoelastic Behavior of Poly(Methyl Methacrylate)/Organomodified Montmorillonite Nanocomposites Prepared via In Situ Bulk Radical Polymerization. Polymers 2018, 10, 491. [Google Scholar] [CrossRef] [PubMed]
  26. Alzarrug, F.A.; Dimitrijević, M.M.; Jančić Heinemann, R.M.; Radojević, V.; Stojanović, D.B.; Uskoković, P.S.; Aleksić, R. The Use of Different Alumina Fillers for Improvement of the Mechanical Properties of Hybrid PMMA Composites. Mater. Des. 2015, 86, 575–581. [Google Scholar] [CrossRef]
  27. Stojanović, D.B.; Brajović, L.; Obradović, V.; Mijailović, D.; Dramlić, D.; Kojović, A.; Uskoković, P.S. Hybrid Acrylic Nanocomposites with Excellent Transparency and Hardness/Toughness Balance. Prog. Org. Coat. 2020, 139, 105437. [Google Scholar] [CrossRef]
  28. TA Instruments DMA Q800 Specifications. Available online: https://www.tainstruments.com/pdf/brochure/dma.pdf (accessed on 27 September 2025).
  29. Bashir, M.A. Use of Dynamic Mechanical Analysis (DMA) for Characterizing Interfacial Interactions in Filled Polymers. Solids 2021, 2, 108–120. [Google Scholar] [CrossRef]
  30. Stojanović, D.B.; Brajović, L.; Orlović, A.; Dramlić, D.; Radmilović, V.; Uskoković, P.S.; Aleksić, R. Transparent PMMA/Silica Nanocomposites Containing Silica Nanoparticles Coating under Supercritical Conditions. Prog. Org. Coat. 2013, 76, 626–631. [Google Scholar] [CrossRef]
  31. Geng, K.; Tsui, O.K.C. Effects of Polymer Tacticity and Molecular Weight on the Glass Transition Temperature of Poly(Methyl Methacrylate) Films on Silica. Macromolecules 2016, 49, 2671–2678. [Google Scholar] [CrossRef]
  32. Ionita, D.; Cristea, M.; Banabic, D. Viscoelastic Behavior of PMMA in Relation to Deformation Mode. J. Therm. Anal. Calorim. 2015, 120, 1775–1783. [Google Scholar] [CrossRef]
  33. Mohammadi, M.; Fazli, H.; Karevan, M.; Davoodi, J. The Glass Transition Temperature of PMMA: A Molecular Dynamics Study and Comparison of Various Determination Methods. Eur. Polym. J. 2017, 91, 121–133. [Google Scholar] [CrossRef]
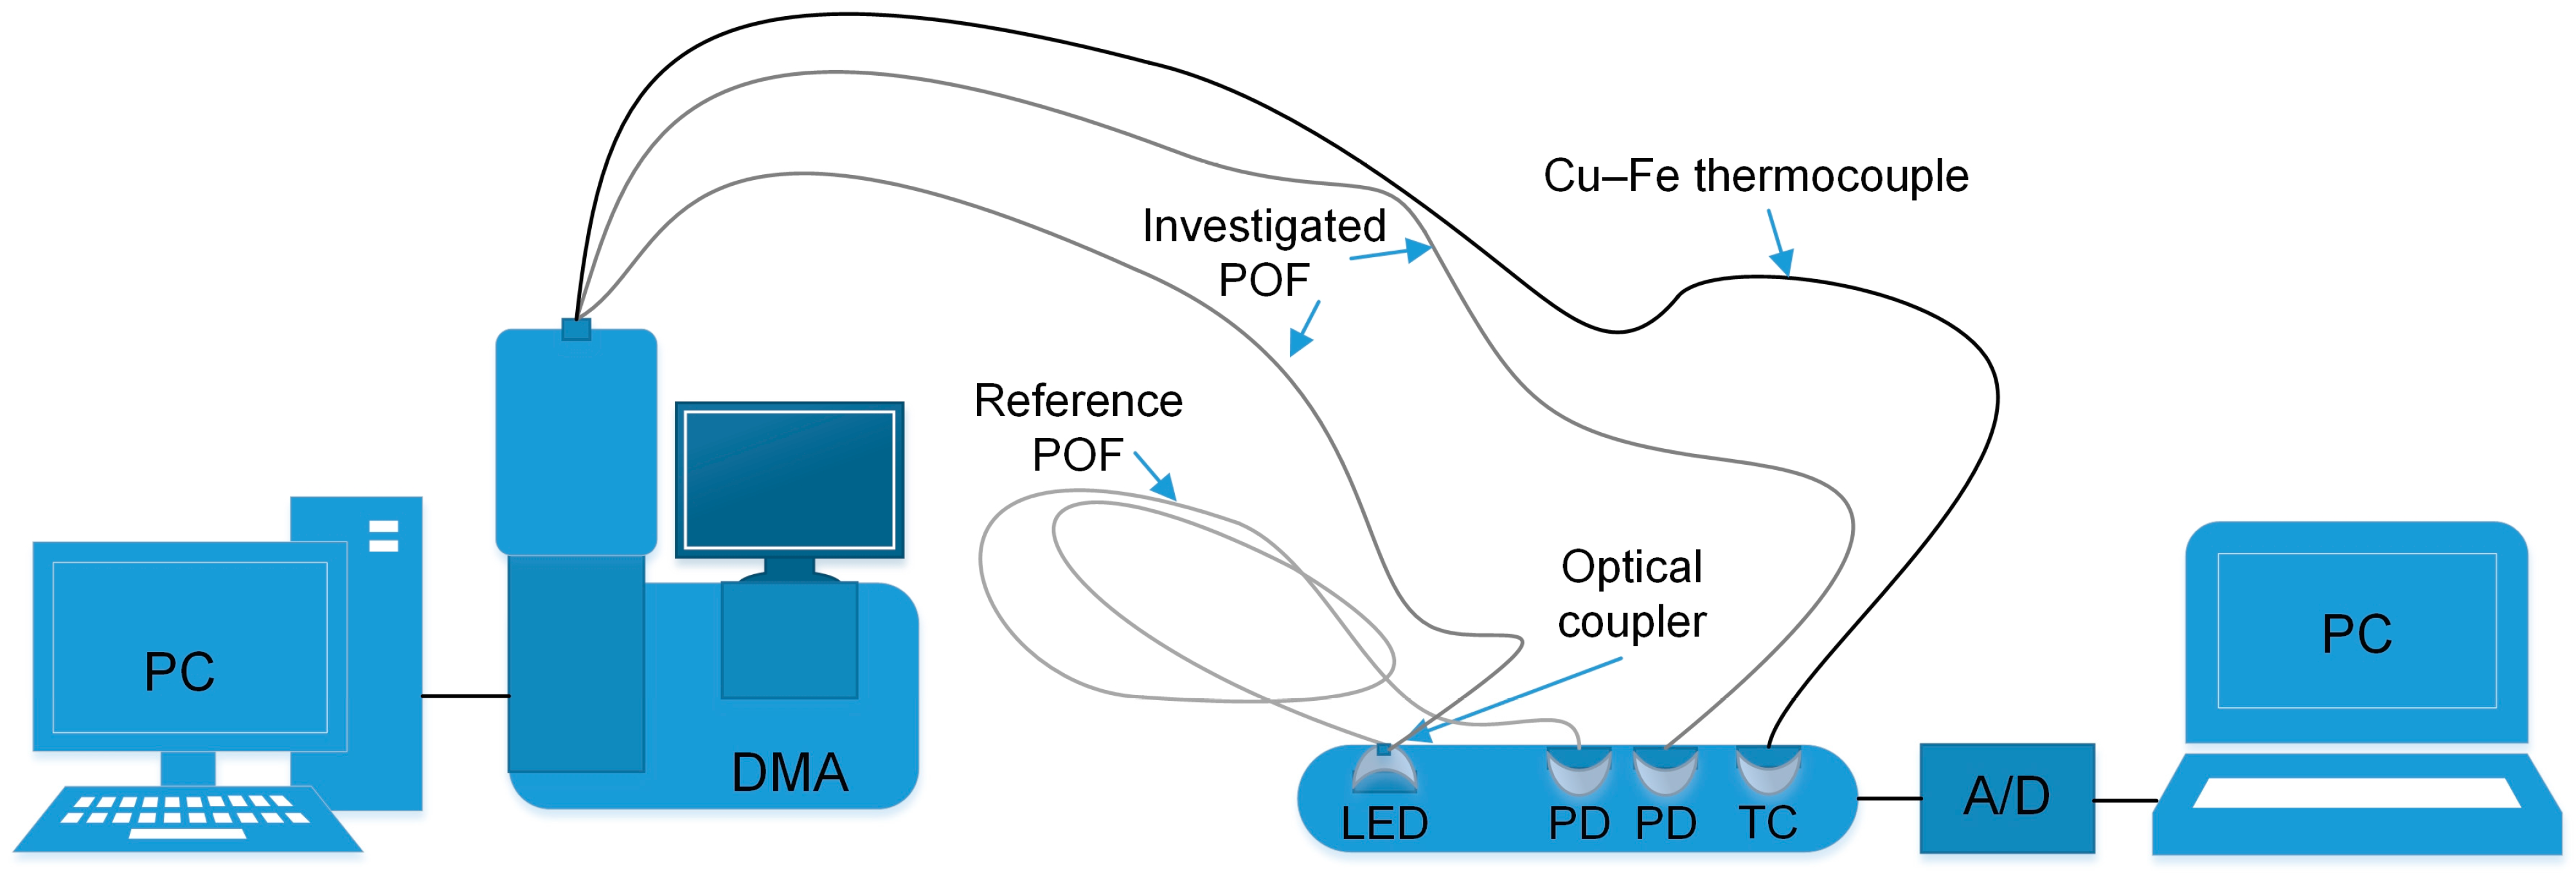
Figure 1. The experimental setup for synchronous DMA/optical measurements.
Coatings 15 01295 g001
Figure 2. Clamped fiber inside the chamber.
Coatings 15 01295 g002
Figure 3. The experimental setup for measurements in TCC.
Coatings 15 01295 g003
Figure 4. FTIR spectra of POF core and cladding.
Coatings 15 01295 g004
Figure 5. DSC curves of the POF and the separated core and cladding materials.
Coatings 15 01295 g005
Figure 6. Dependence of normalized optical signals (at four wavelengths) versus temperature during the dual cantilever DMA testing.
Coatings 15 01295 g006
Figure 7. Temperature dependence of the storage modulus, loss modulus, loss factor (tan δ), and normalized optical intensity for the test conducted at a wavelength of 840 nm.
Coatings 15 01295 g007
Figure 8. The normalized signal intensity versus temperature for the POF in TCC, POF during single DMA, and during dual cantilever DMA tests at (a) 650 nm and (b) 840 nm.
Coatings 15 01295 g008
Table 1. Characteristic temperatures Tg and Tm for POF, core and cladding.
POF Cladding Material Core Material
Tg119.17 °C/119.93 °C 
Tm127.09 °C127.04 °C/
Table 2. Characteristic temperatures Tinc and Tmax, and relative increase in optical signal intensity for different wavelengths.
Light Wavelength (nm)Tinc
(°C)
Tmax
(°C)
I max I 0 I 0
(%)
40065102–10635.0
4705599–10421.5
65055100–10625.4
84065103–10531.7
Disclaimer/Publisher’s Note: The statements, opinions and data contained in all publications are solely those of the individual author(s) and contributor(s) and not of MDPI and/or the editor(s). MDPI and/or the editor(s) disclaim responsibility for any injury to people or property resulting from any ideas, methods, instructions or products referred to in the content.