To validate the method’s effectiveness, the proposed method was evaluated using bearing fault data from the Case Western Reserve University (CWRU) dataset [
36]. The tests employed a 6205-2RSJEM SKF bearing operating at 1797 rpm [
37]. There were nine rolling elements with a diameter of 7.938 mm in the experimental bearing; the contact angle was 0, and the bearing pitch diameter was 39 mm. Vibration sensors were integrated within the drive motor to acquire signals reflecting different bearing defect severities. The acquisition system operated at a 12 kHz sampling rate, collecting 2048-point data segments. The analysis utilized vibration signals from bearings with 0.007-inch (0.1778 mm) defects in both inner and outer races. The calculation equation for fault characteristic frequency [
38] is shown in Equations (32)–(34). In accordance with the theoretical formula for the fault feature frequency and the parameters given in
Table 5, the fault characteristic frequency for the inner ring was 162.1852 Hz; for the outer ring, it was 107.3648 Hz, and for the rolling element, it was 141.1693 Hz, as shown in
Table 6.
4.2.1. Diagnosis of Inner Ring Fault Characteristics
The temporal and spectral characteristics of the inner ring vibration are displayed in
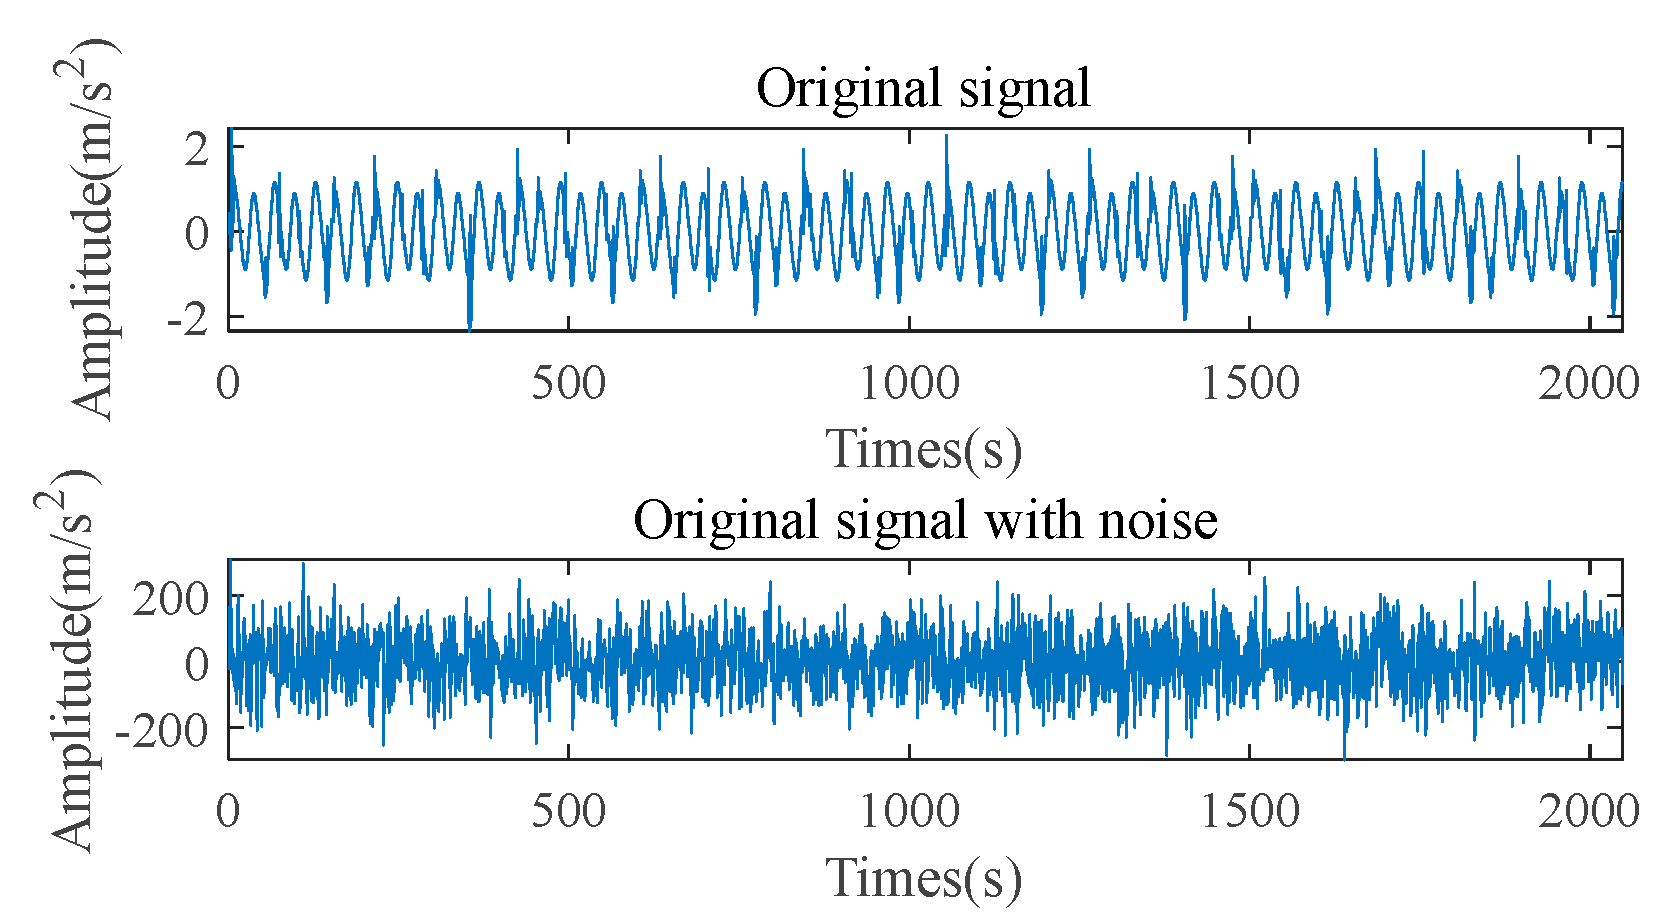
Figure 6. Analysis of the time-domain waveform indicates that the inner ring signal possesses a weakly periodic nature. In addition, the low-frequency and high-frequency frequency amplitudes in the frequency domain are relatively large and are subject to interference from many non-fault components. The frequency-domain analysis indicates that the characteristic frequency and harmonics of the inner ring fault signal are obscured by noise, making them difficult to distinguish.
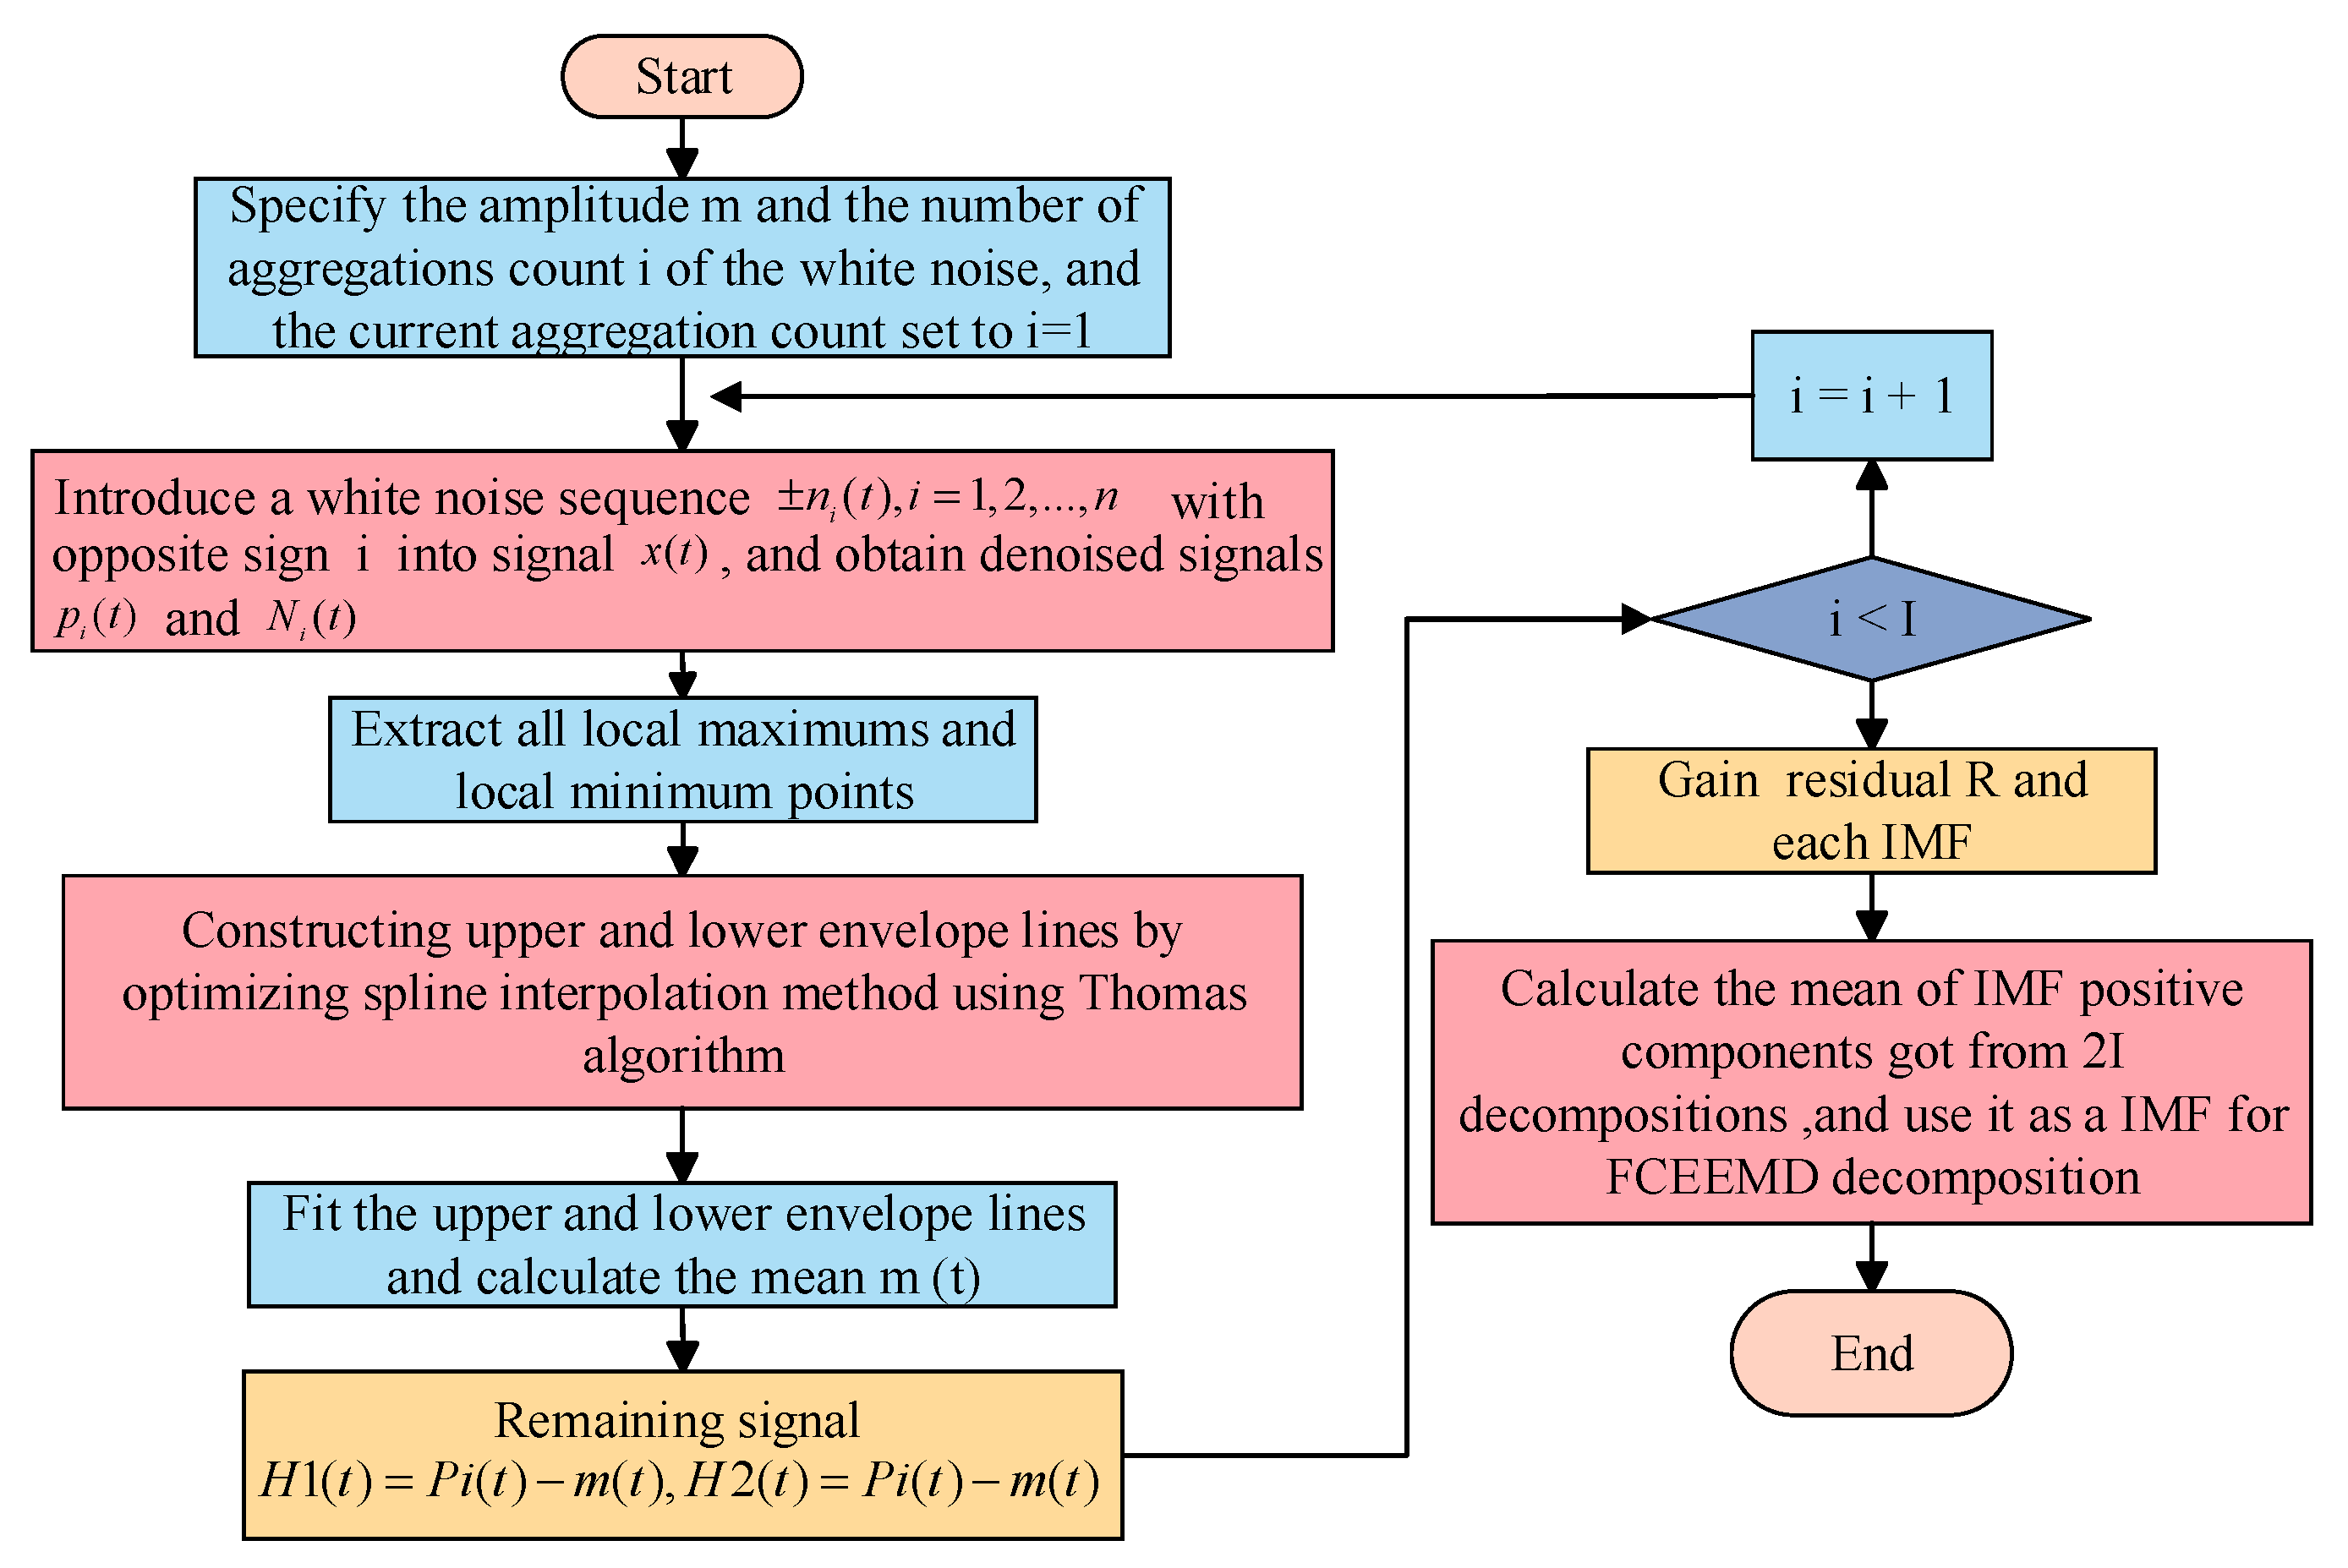
To verify the effectiveness and superiority of the proposed FCEEMD, this paper decomposes the inner ring signal into eight IMF components using FCEEMD. Meanwhile, this article also decomposes the inner ring signal using EEMD, TVF-EMD, and VMD, and the detailed decomposition results are shown in
Figure 7.
It can be known from
Figure 7 that contrasted with VMD and TVF-EMD, the waveform frequency of IMF components obtained by EEMD and FCEEMD gradually decreases, i.e., IMF components are arranged from high frequency to low frequency. In addition, the IMF components obtained from EEMD decomposition and FCEEMD decomposition contain fewer noise components and more obvious periodic shocks. There is no obvious regularity in the IMF components obtained by TVF-EMD decomposition, and there may be modal aliasing problems. From the results of VMD decomposition, it is known that VMD decomposition may not fully decompose the inner ring signal, and there may be noise interference issues. In summary, compared with TVF-EMD [
9], which requires preset parameters and is prone to mode aliasing, and VMD [
6], which often fails to fully decompose signals under noise interference, FCEEMD effectively suppresses endpoint effects and modal aliasing, as also observed in [
39] for CEEMD. Moreover, the periodic impulses in FCEEMD-IMF components are more pronounced than those in EEMD and FEEMD [
16], indicating better feature preservation. This aligns with the findings in [
15], where composite screening based on correlation and kurtosis improved IMF selection, but our method further enhances this by incorporating energy kurtosis for better noise robustness.
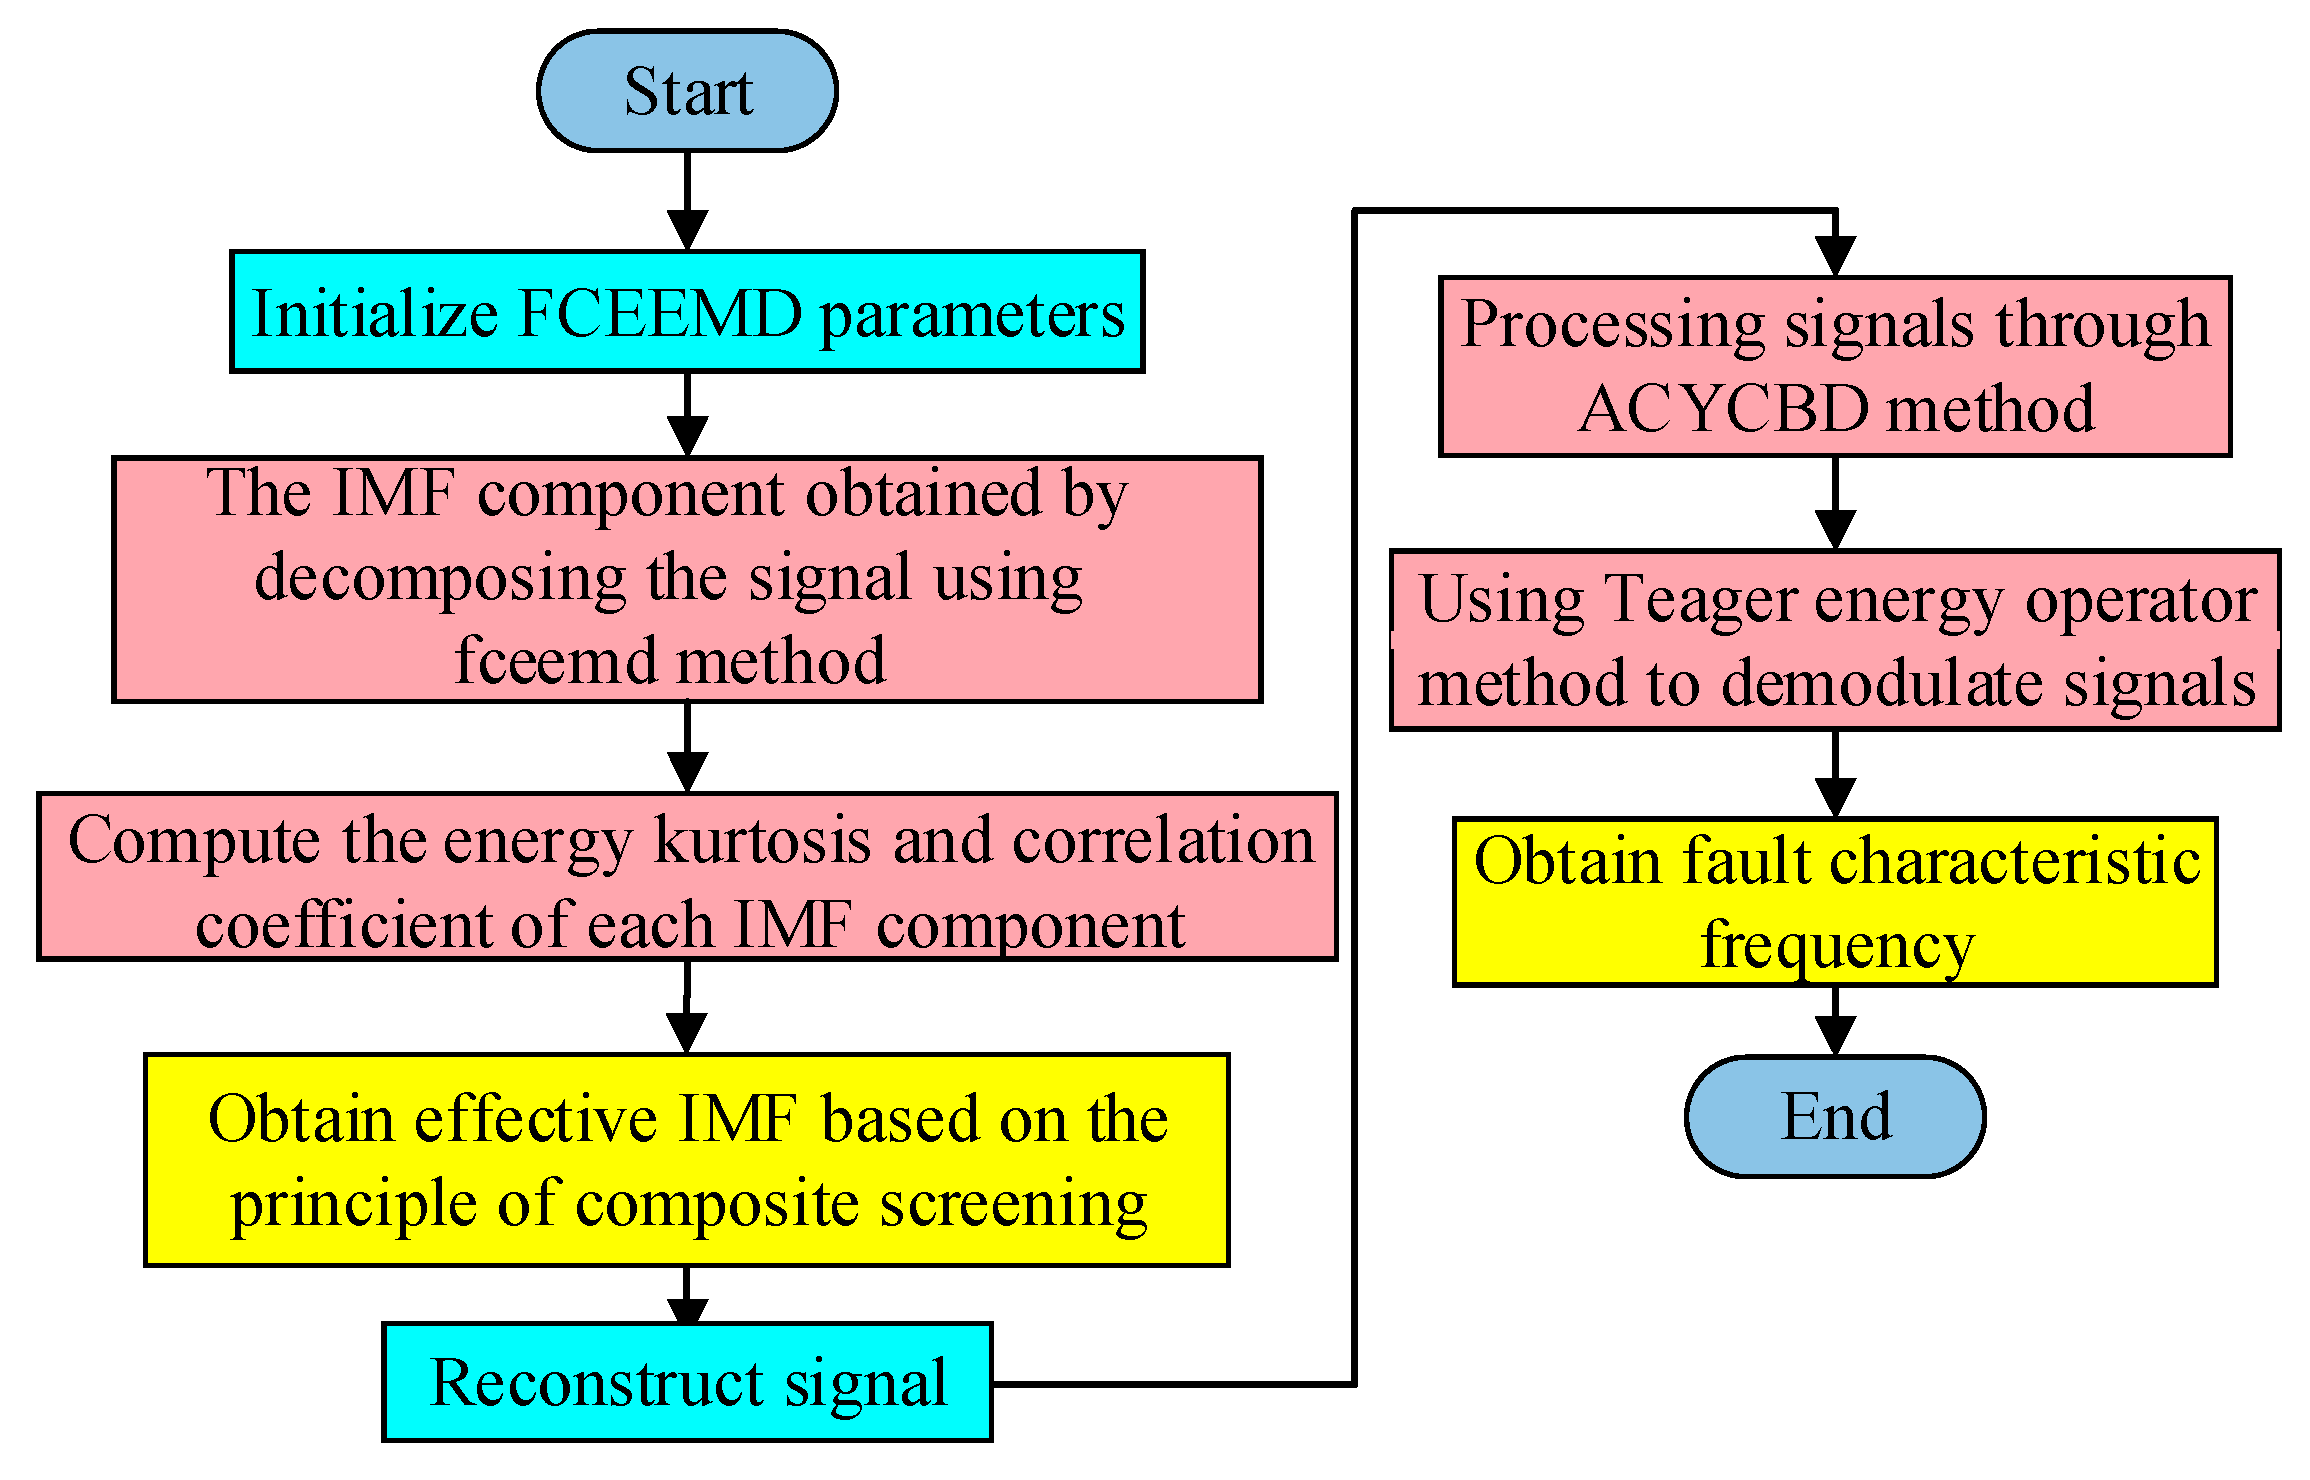
In order to screen out IMF components that retain most of the original signal characteristics, the correlation coefficient (Cor) and energy kurtosis (Ek) of each IMF need to be calculated. Then, IMF components that meet the double thresholds are filtered out. The selected IMF components are considered to be a valid IMF. The correlation coefficients and energy kurtosis of IMF components obtained by the four decomposition methods are shown in
Table 7 and
Table 8.
For the EEMD decomposition method, the correlation coefficients of IMF1, IMF2, IMF3, and IMF4 satisfy the threshold, while IMF1, IMF2, IMF3, and IMF7 satisfy the energy kurtosis threshold. From this, it can be seen that these IMF components have good feature extraction ability. Therefore, this article obtains the EEMD reconstruction signal by linearly accumulating IMF1, IMF2, IMF3, and IMF4 that satisfy the double thresholds. Similarly, in the TVF-EMD decomposition method, MF1, IMF2, and IMF3 that meet the double thresholds are selected as the valid IMF components. Therefore, in this paper, these IMF components can be superimposed to obtain the TVF-EMD reconstruction signal. For the VMD decomposition method, IMF3, IMF4, IMF5, and IMF7 satisfy the double threshold condition, indicating that the VMD reconstruction signals reconstructed from them are easier to analyze and extract key information from. Finally, for the FCEEMD decomposition method, IMF1 and IMF2 are selected as the effective IMF components. IMF1, with its high-frequency content and prominent energy kurtosis (0.94), predominantly captures the transient impulse responses generated when the rolling elements pass over the localized spalling defect on the inner raceway surface. Each impulse corresponds to the moment of impact between a rolling element and the defect edge, carrying essential information about the defect size and severity. IMF2, characterized by moderate frequency components, likely represents the structural resonance modes excited by these periodic impacts, as well as modulation effects caused by the time-varying vibration transmission path due to the bearing’s rotation. The combination of these IMF components effectively reconstructs the vibration signature of an inner race fault, where the fundamental fault characteristic frequency (162.1852 Hz) and its harmonics are amplitude-modulated by the shaft rotational frequency. By superimposing IMF1 and IMF2, the FCEEMD reconstruction signal can be obtained.
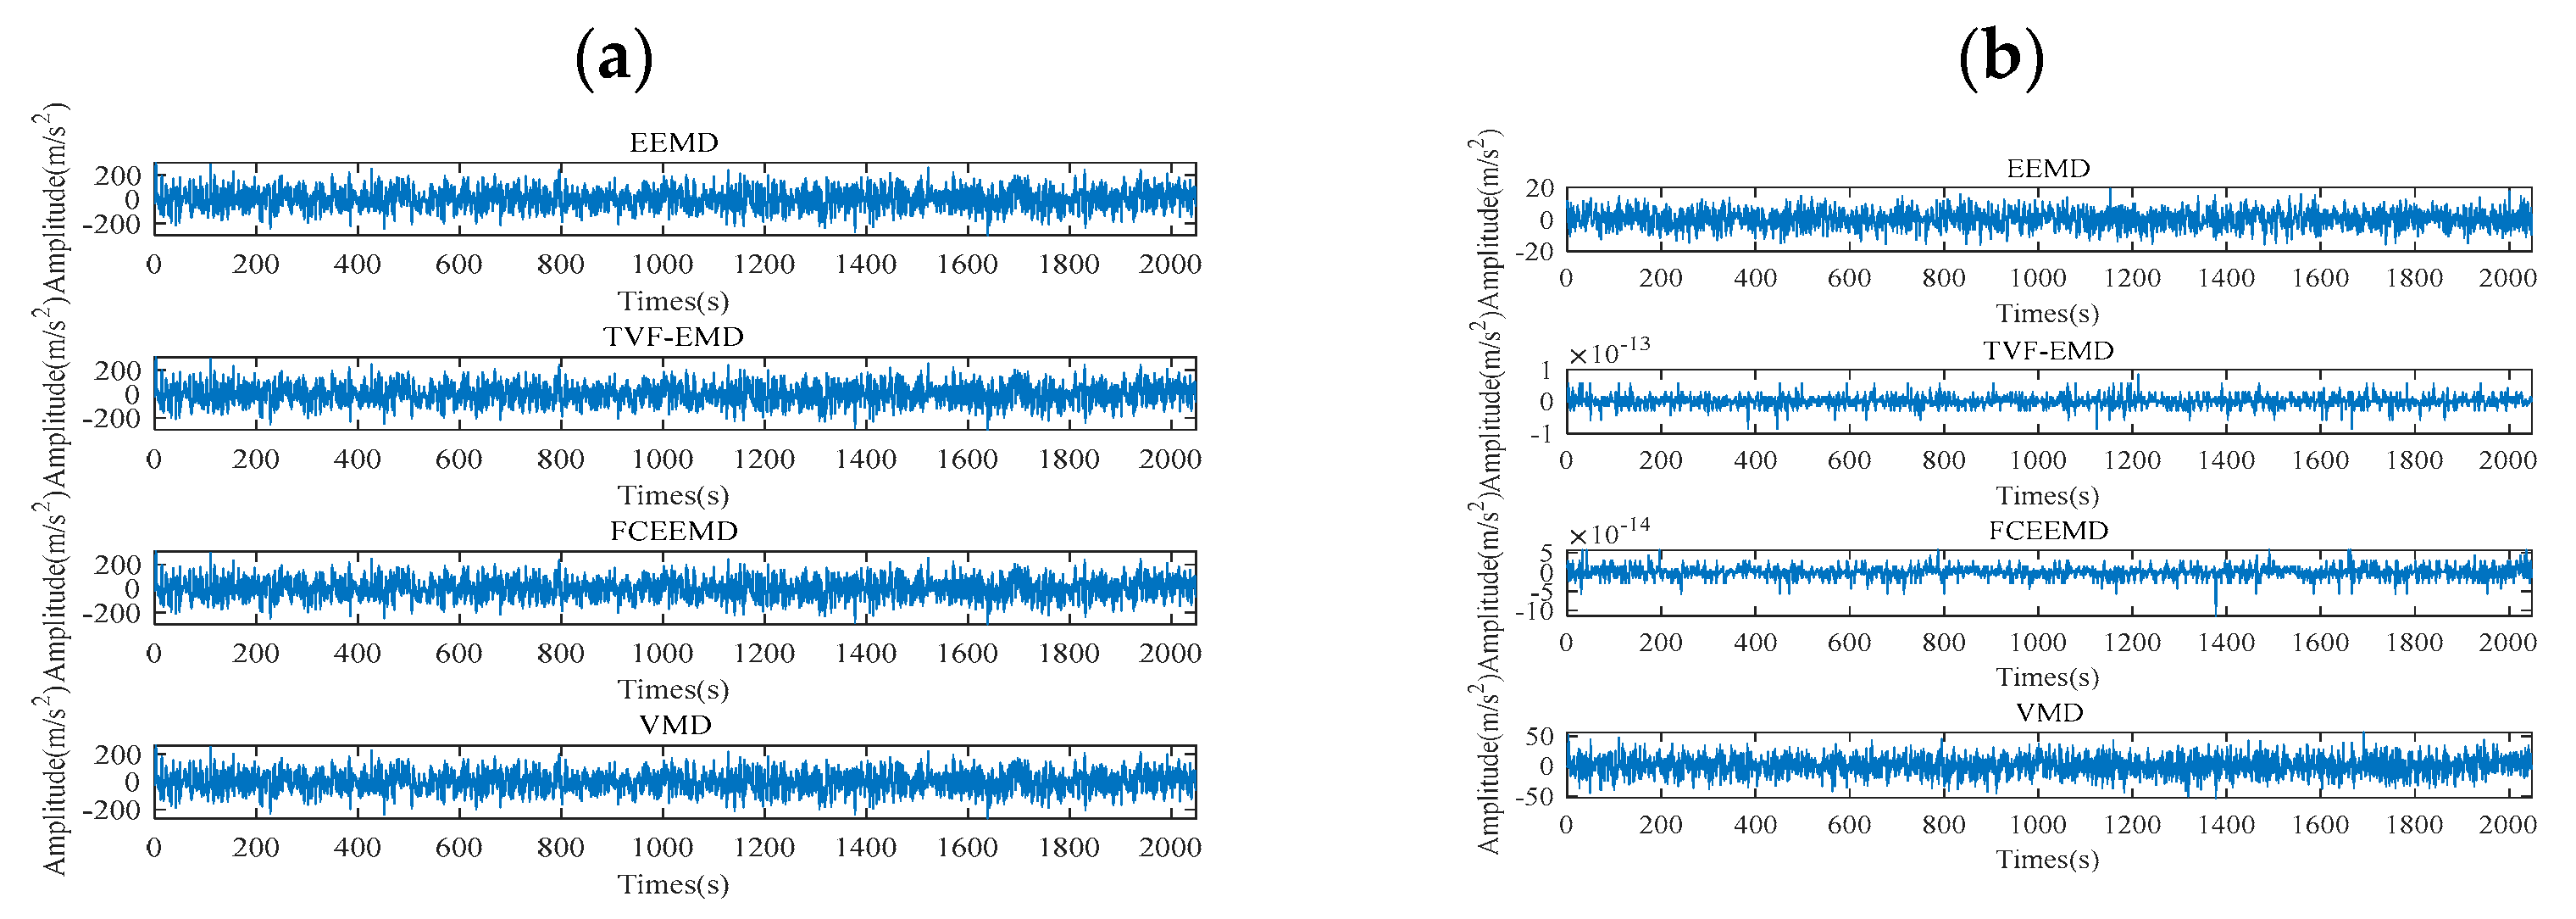
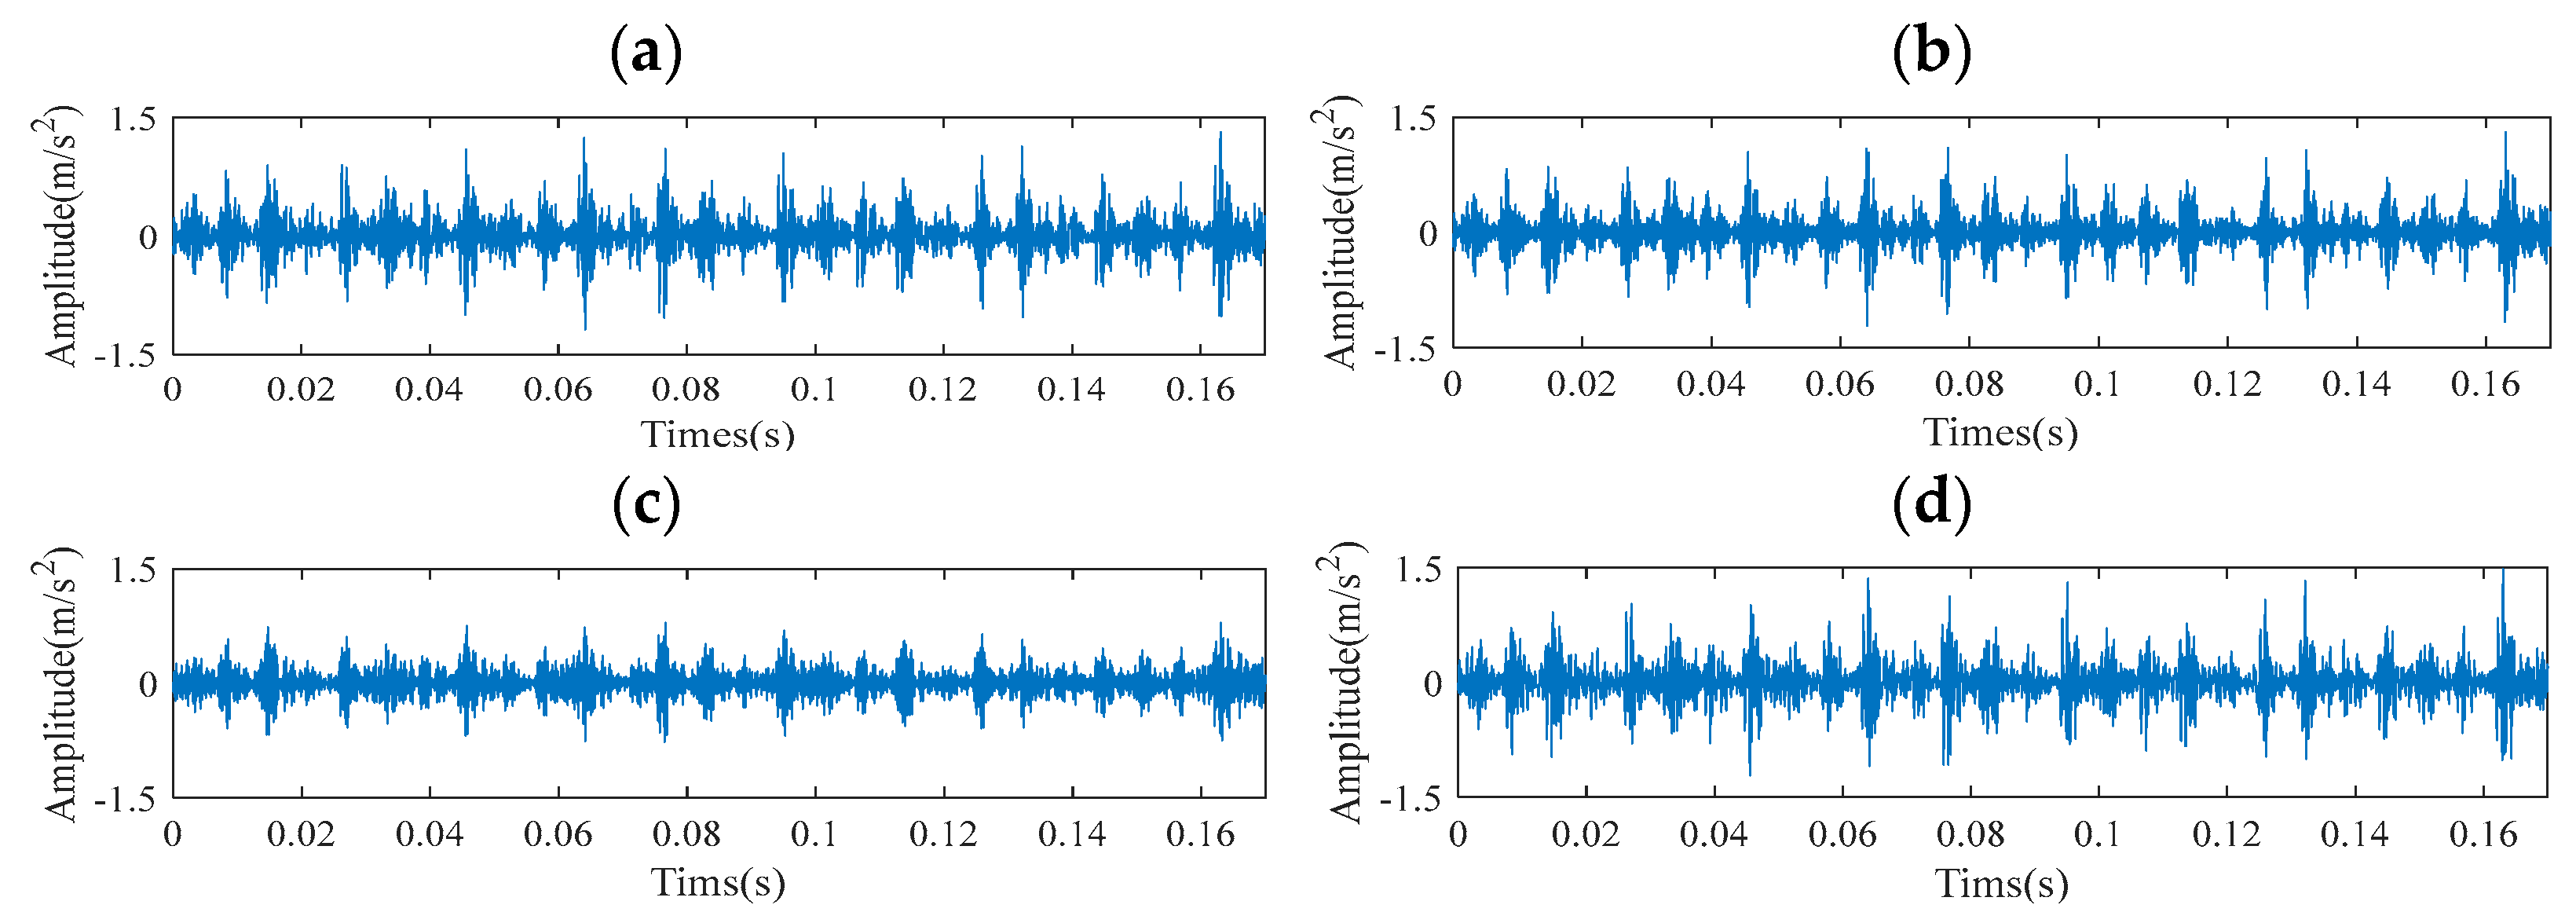
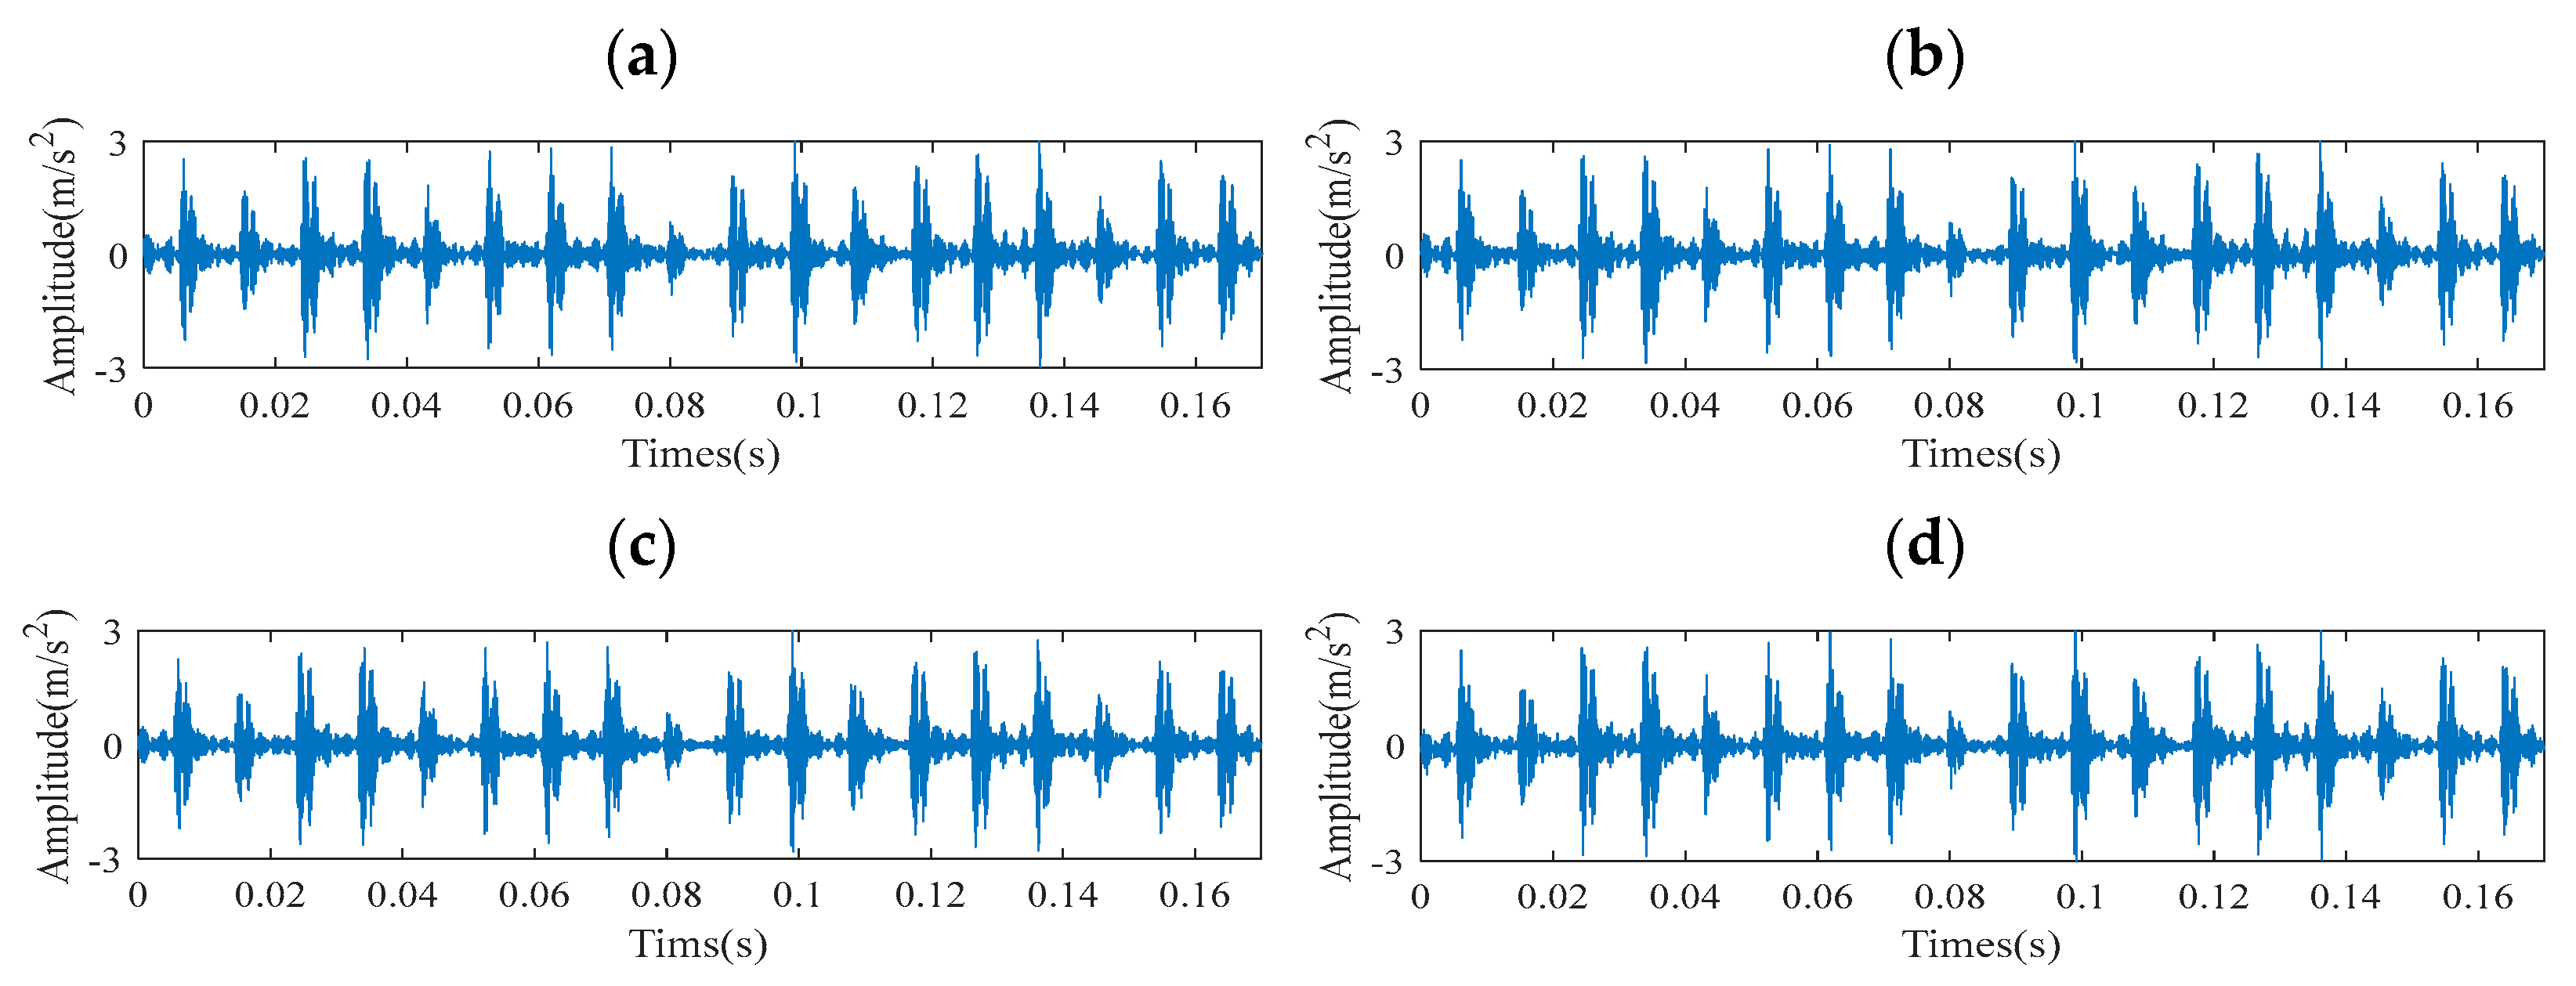
The performance of the reconstruction signals gained by the four decomposition methods in the time domain are illustrated in
Figure 8. As known in
Figure 8, among the four decomposition methods, the reconstruction signals of FCEEMD and TVF-EMD contain more pronounced periodic pulse components. This indicates that TVF-EMD and FCEEMD can effectively extract fault characteristic frequency components. In addition, within the same frequency range, the amplitude of the reconstruction signal obtained by FCEEMD is relatively high. This indicates that FCEEMD more effectively preserves the main components of the signal. More importantly, compared to the original signal in
Figure 6, the reconstruction signal obtained by FCEEMD has fewer edge burrs caused by noise. This indicates that through FCEEMD decomposition and signal reconstruction, the influence of noise has been effectively suppressed. To verify the effectiveness and superiority of ACYCBD, our study filtered the reconstruction signal obtained by the four methods using ACYCBD and CYCBD, respectively. The results are illustrated in
Figure 9,
Figure 10,
Figure 11 and
Figure 12.
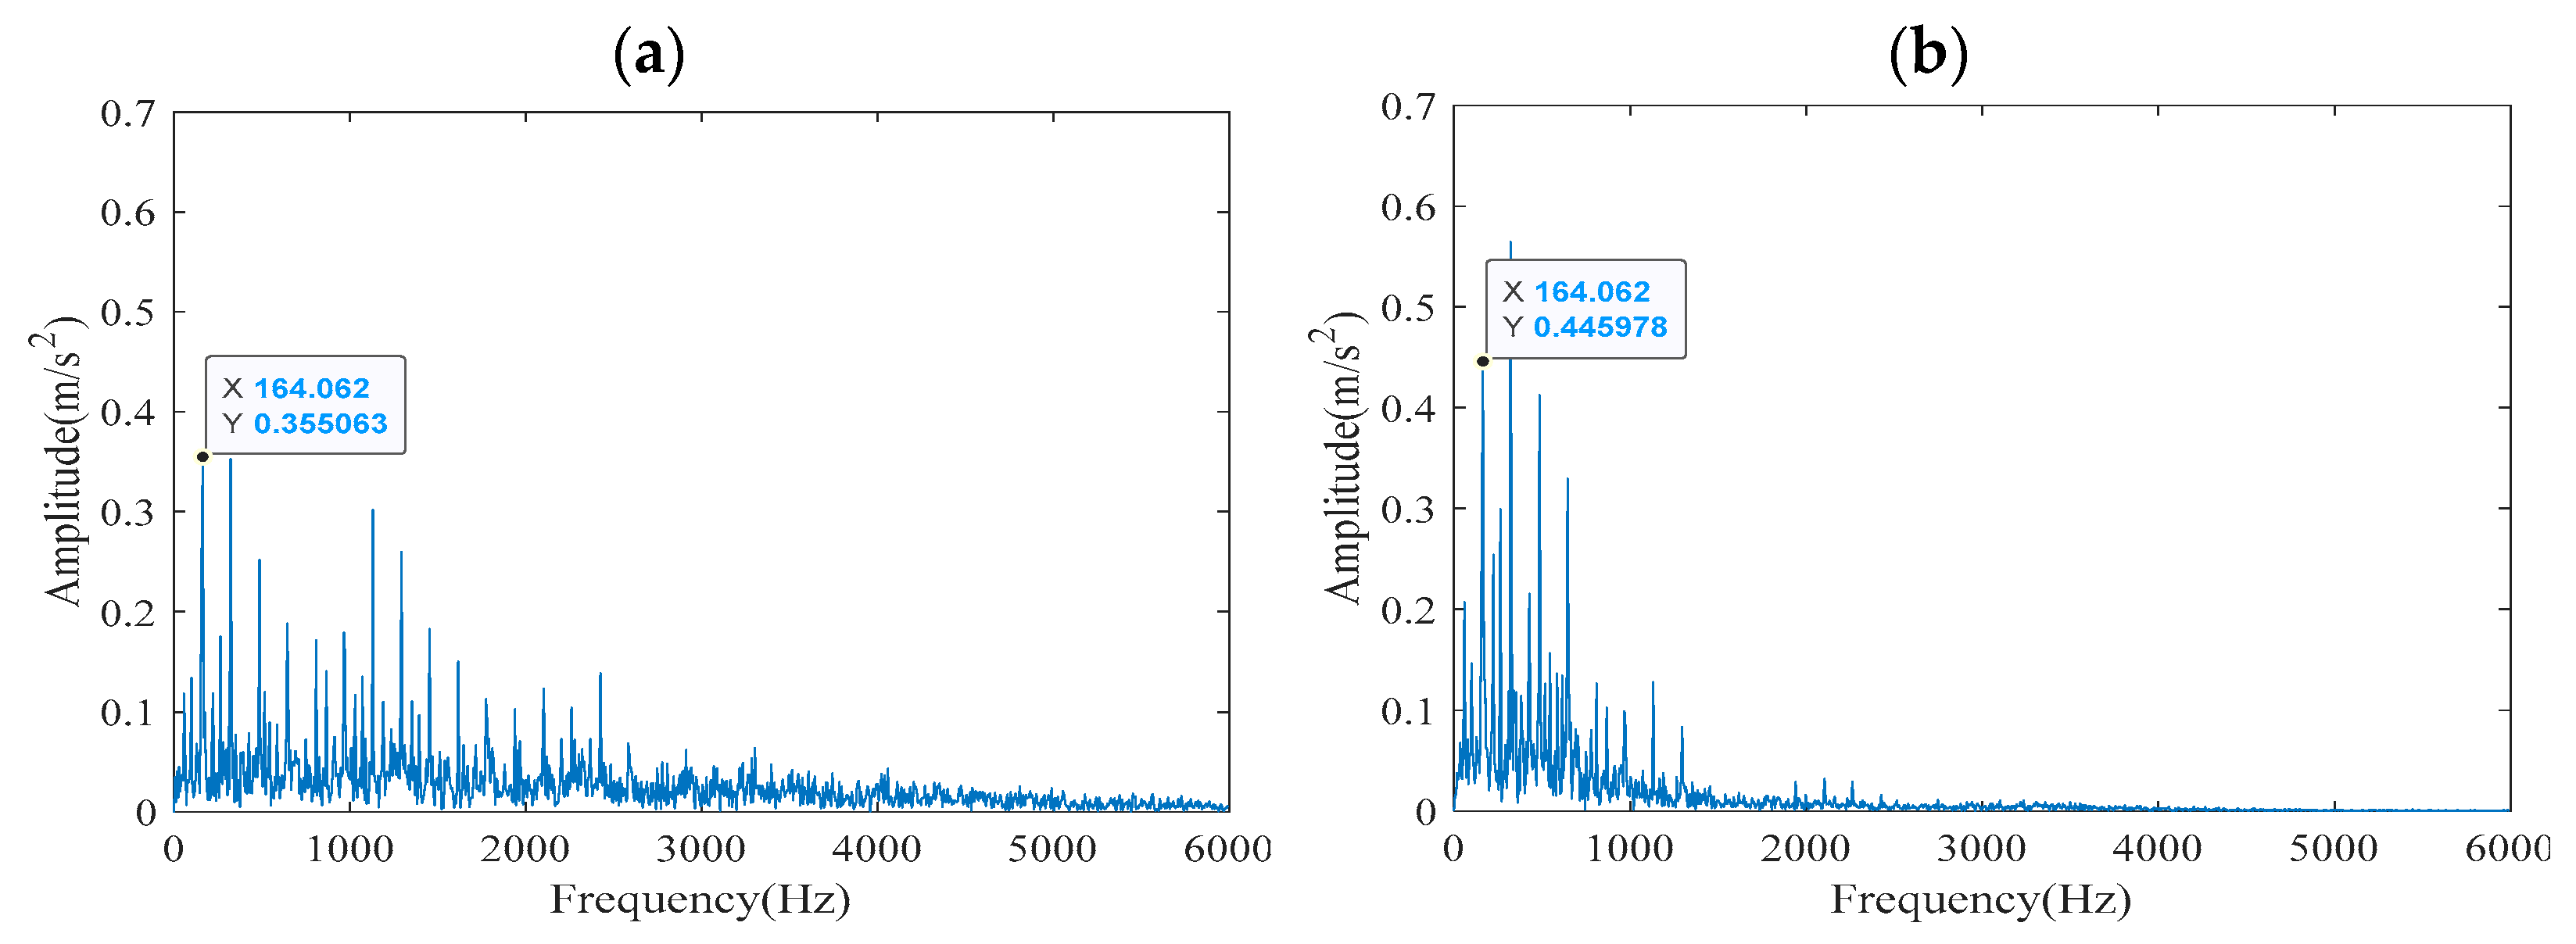
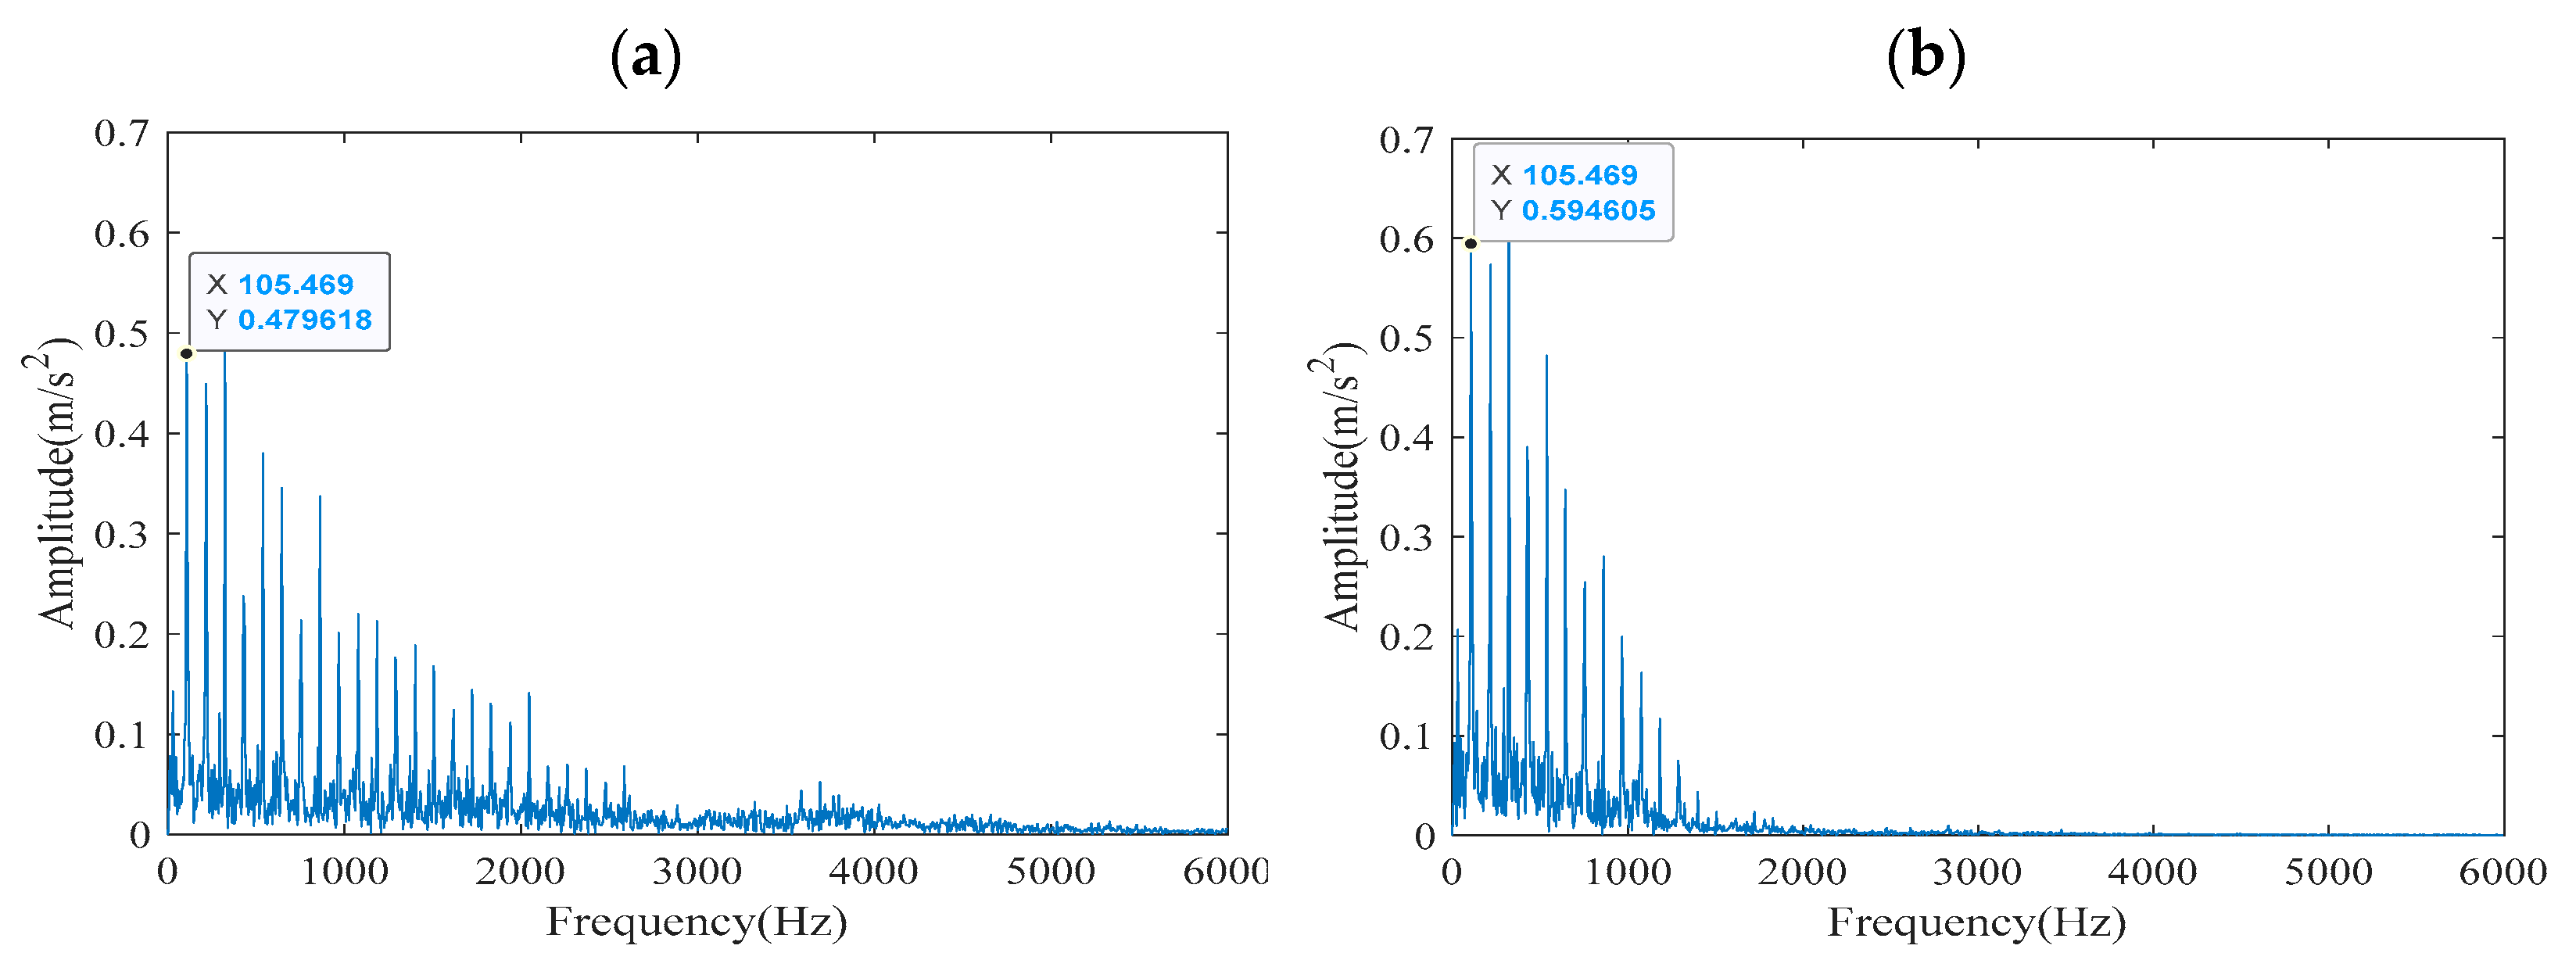
As shown in
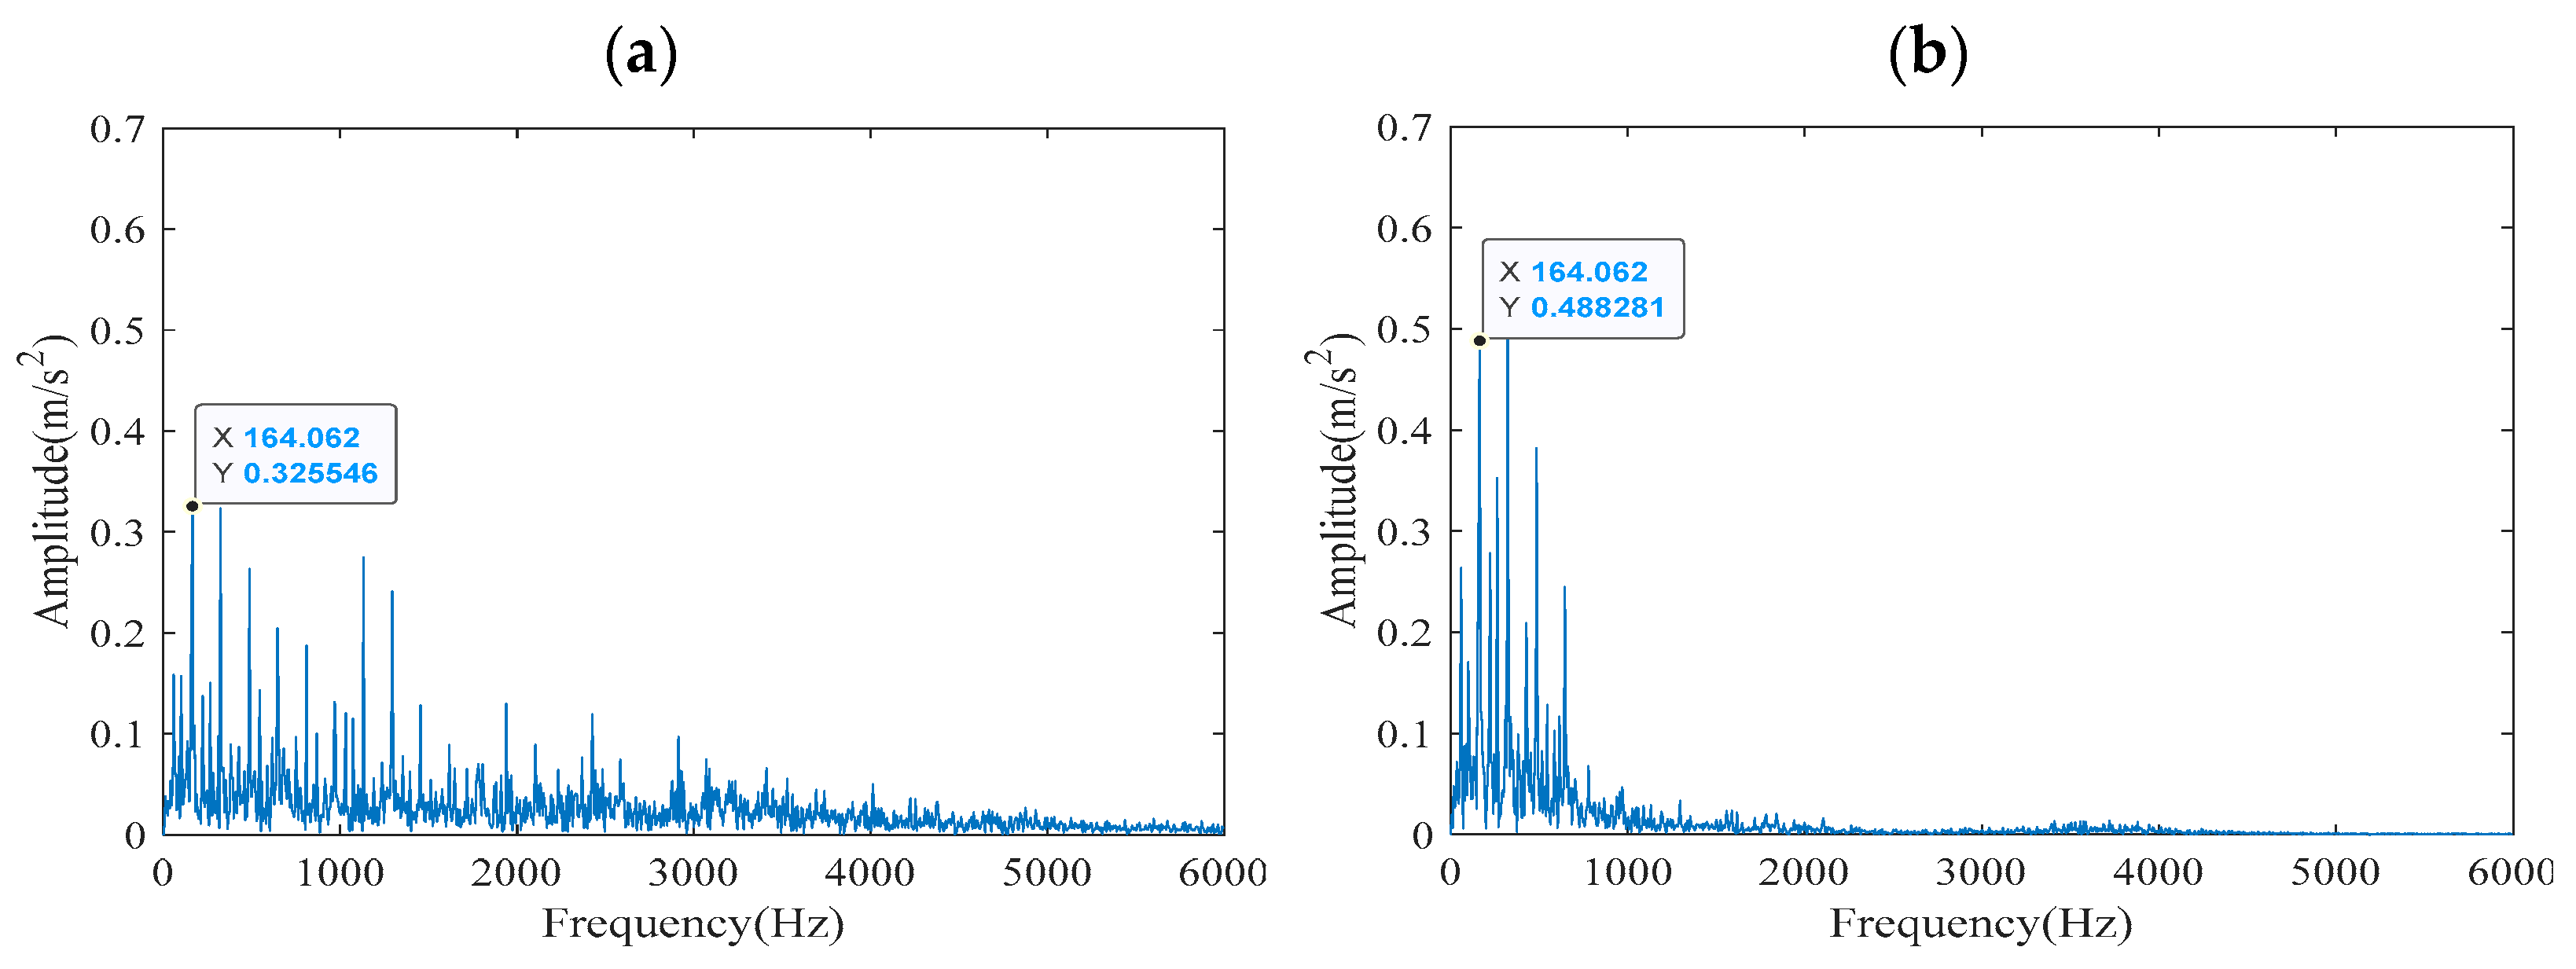
Figure 9, the reconstructed signal obtained by the EEMD decomposition method was processed by both ACYCBD and CYCBD to extract fault characteristic frequencies. In
Figure 9a, the ACYCBD method successfully highlights the fundamental fault characteristic frequency of 164.062 Hz and its distinct harmonics, demonstrating a clear periodic pattern characteristic of bearing inner ring faults. In contrast,
Figure 9b shows that the CYCBD method results in a less regular harmonic structure, with significantly weaker amplitude components, particularly above 1000 Hz where the signal energy diminishes rapidly. This contrast quantitatively demonstrates that the ACYCBD method, enhanced by the EHPS estimator, possesses superior capability in reconstructing periodic pulse signals and suppressing noise interference, leading to more reliable and interpretable fault characteristic frequency identification.
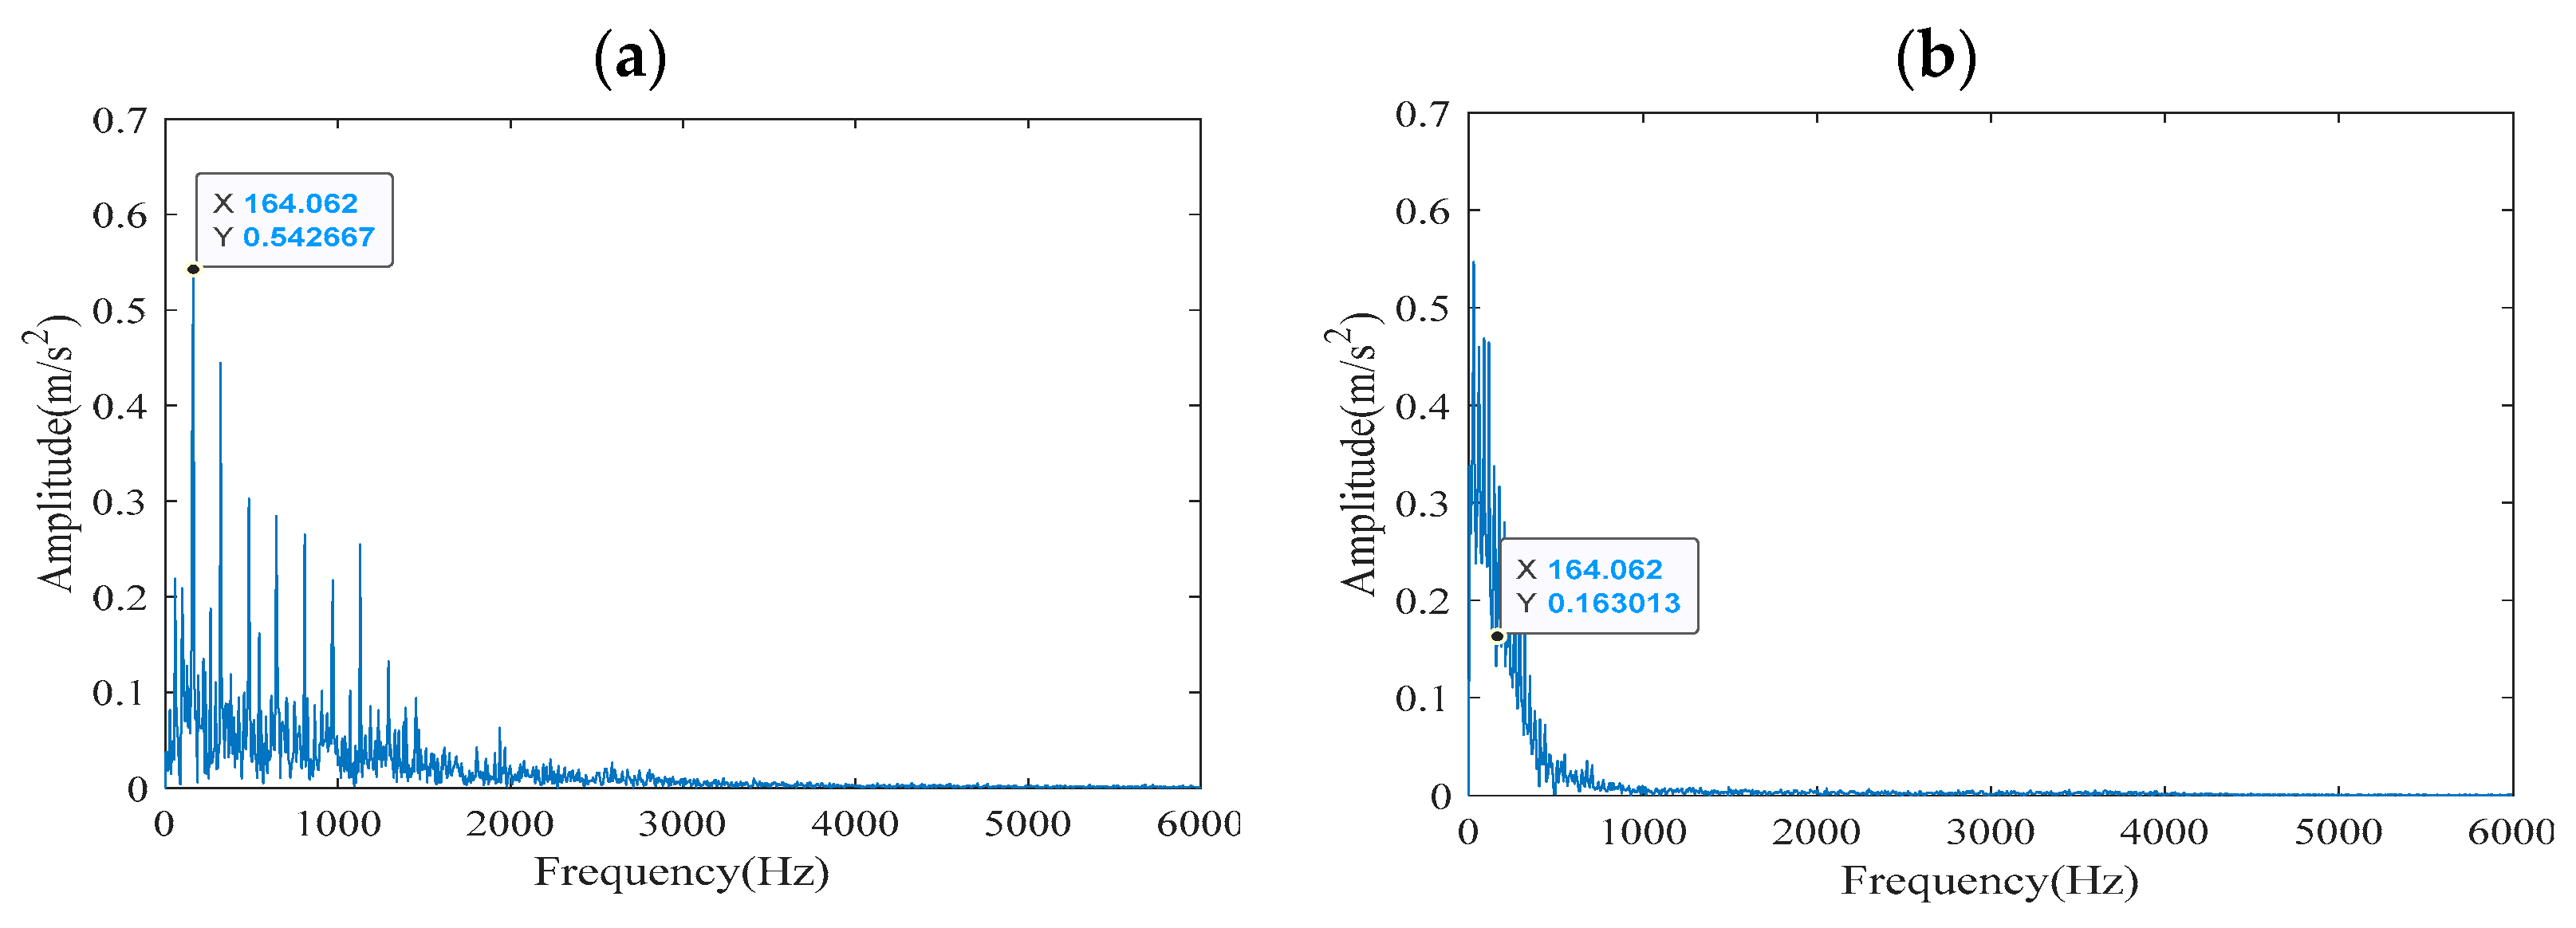
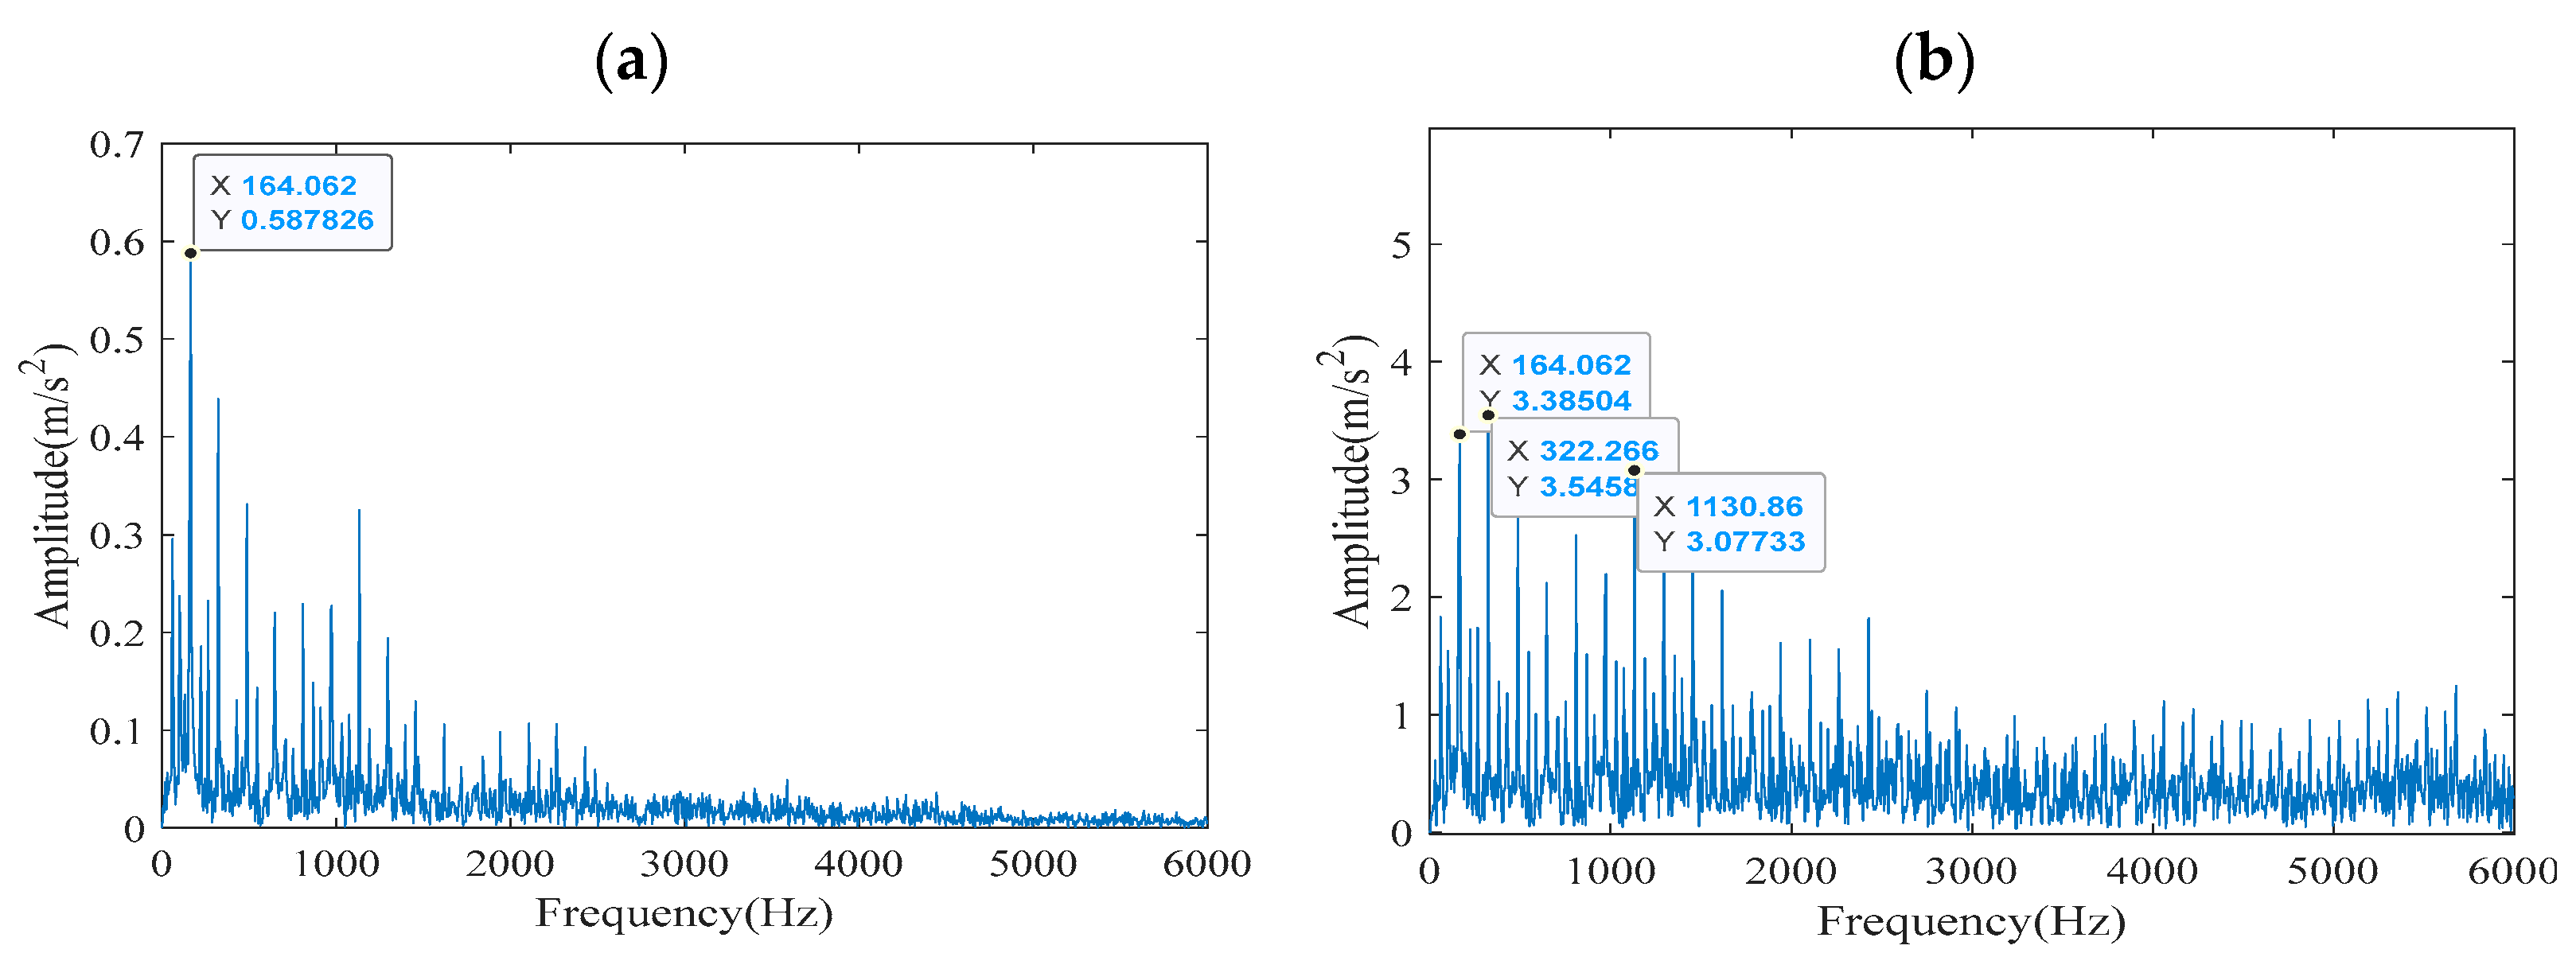
Figure 10 compares the frequency-domain results of the TVF-EMD reconstructed signal after processing by ACYCBD and CYCBD, respectively. A critical observation from
Figure 10a is that the ACYCBD method not only extracts the fundamental fault characteristic frequency (164.062 Hz) but also presents its harmonics with markedly higher amplitudes and greater clarity within the 0–2000 Hz range. This indicates a more effective enhancement of the periodic impulse components. Conversely, the output from the CYCBD method in
Figure 10b exhibits a noisier baseline and less prominent harmonic peaks, suggesting a lower signal-to-noise ratio and a diminished ability to isolate the fault features from background noise. This comparison further validates that the adaptive cyclic frequency detection in ACYCBD is crucial for achieving superior deconvolution performance, particularly when combined with various signal decomposition techniques.
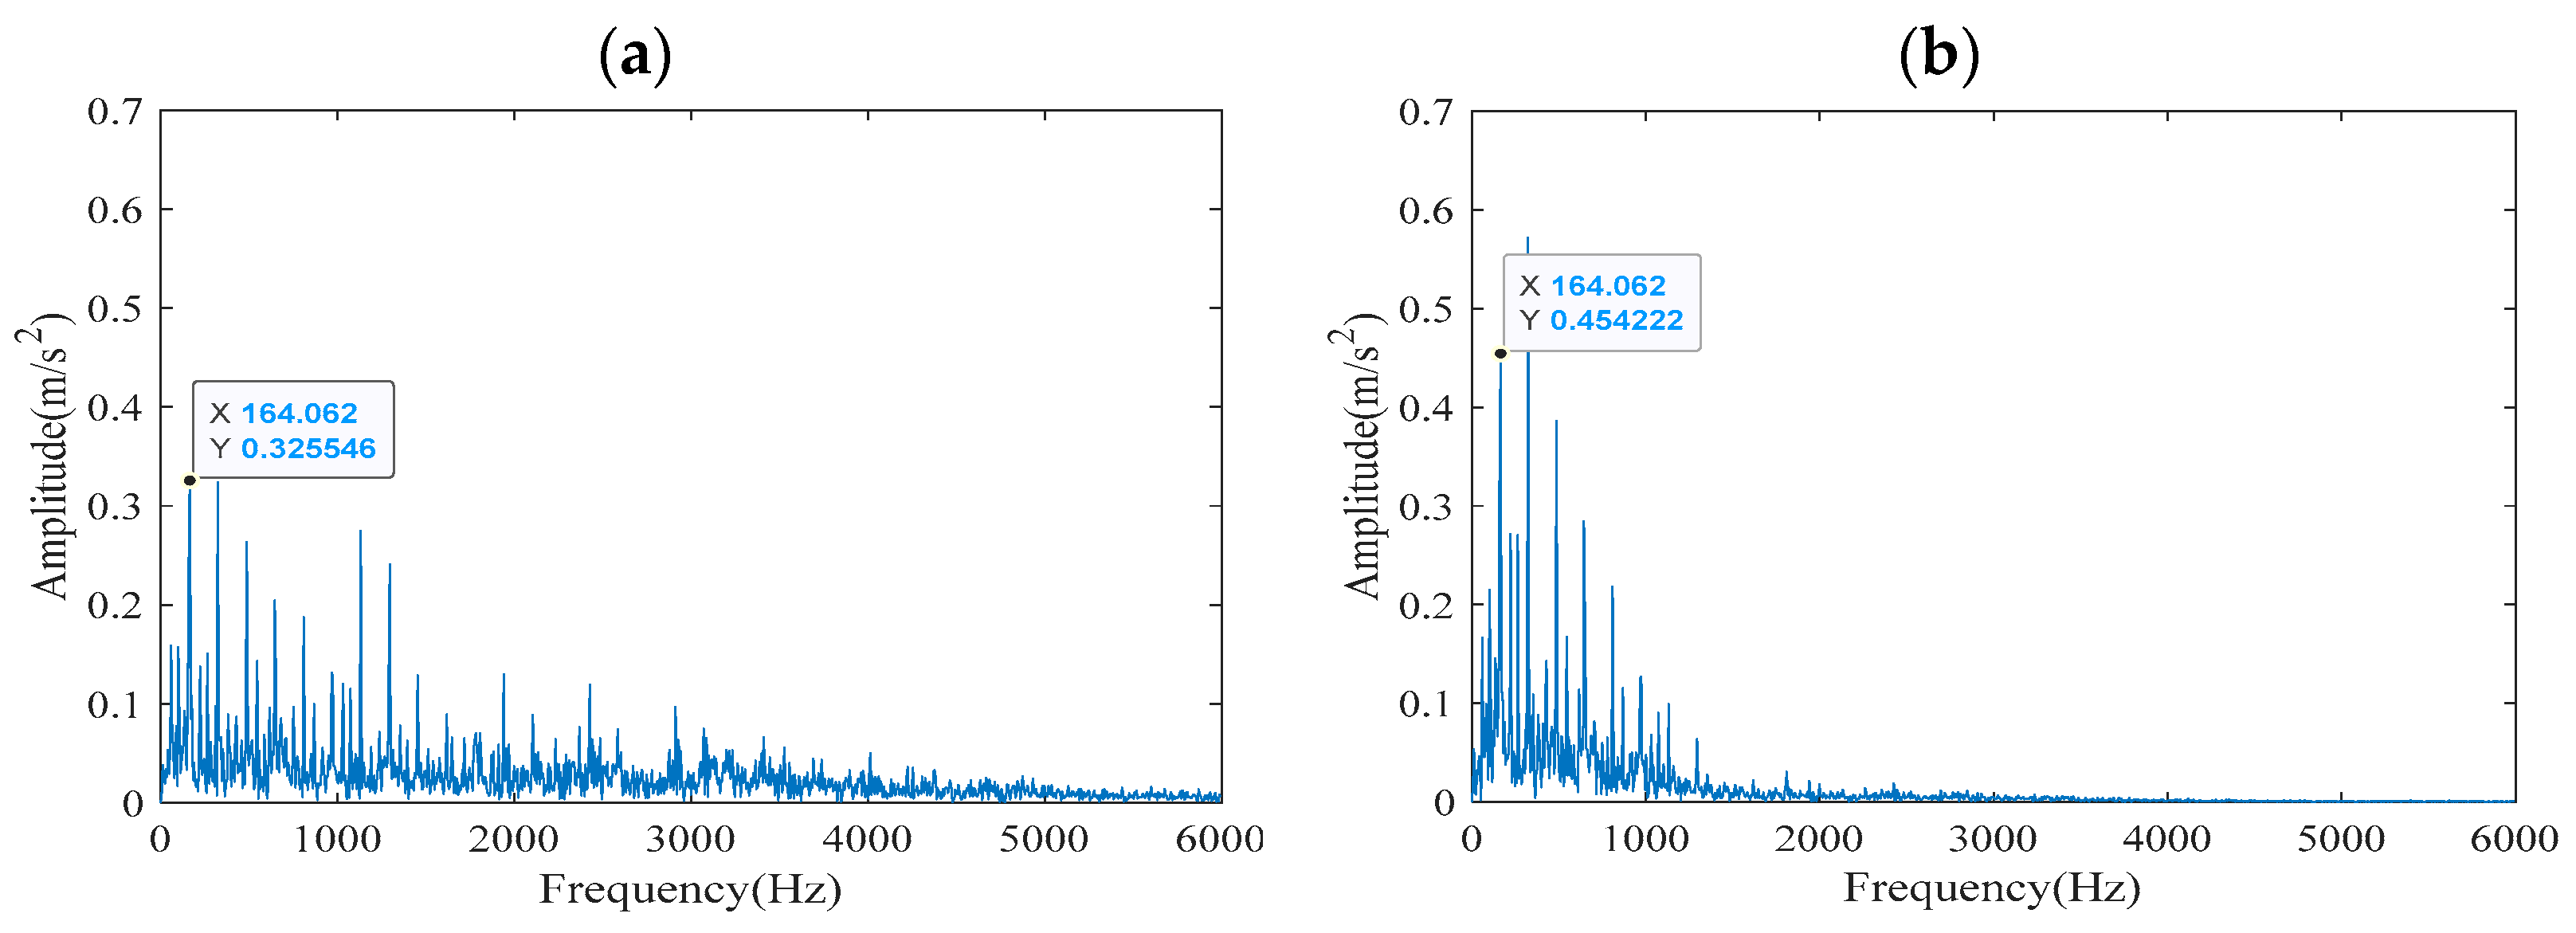
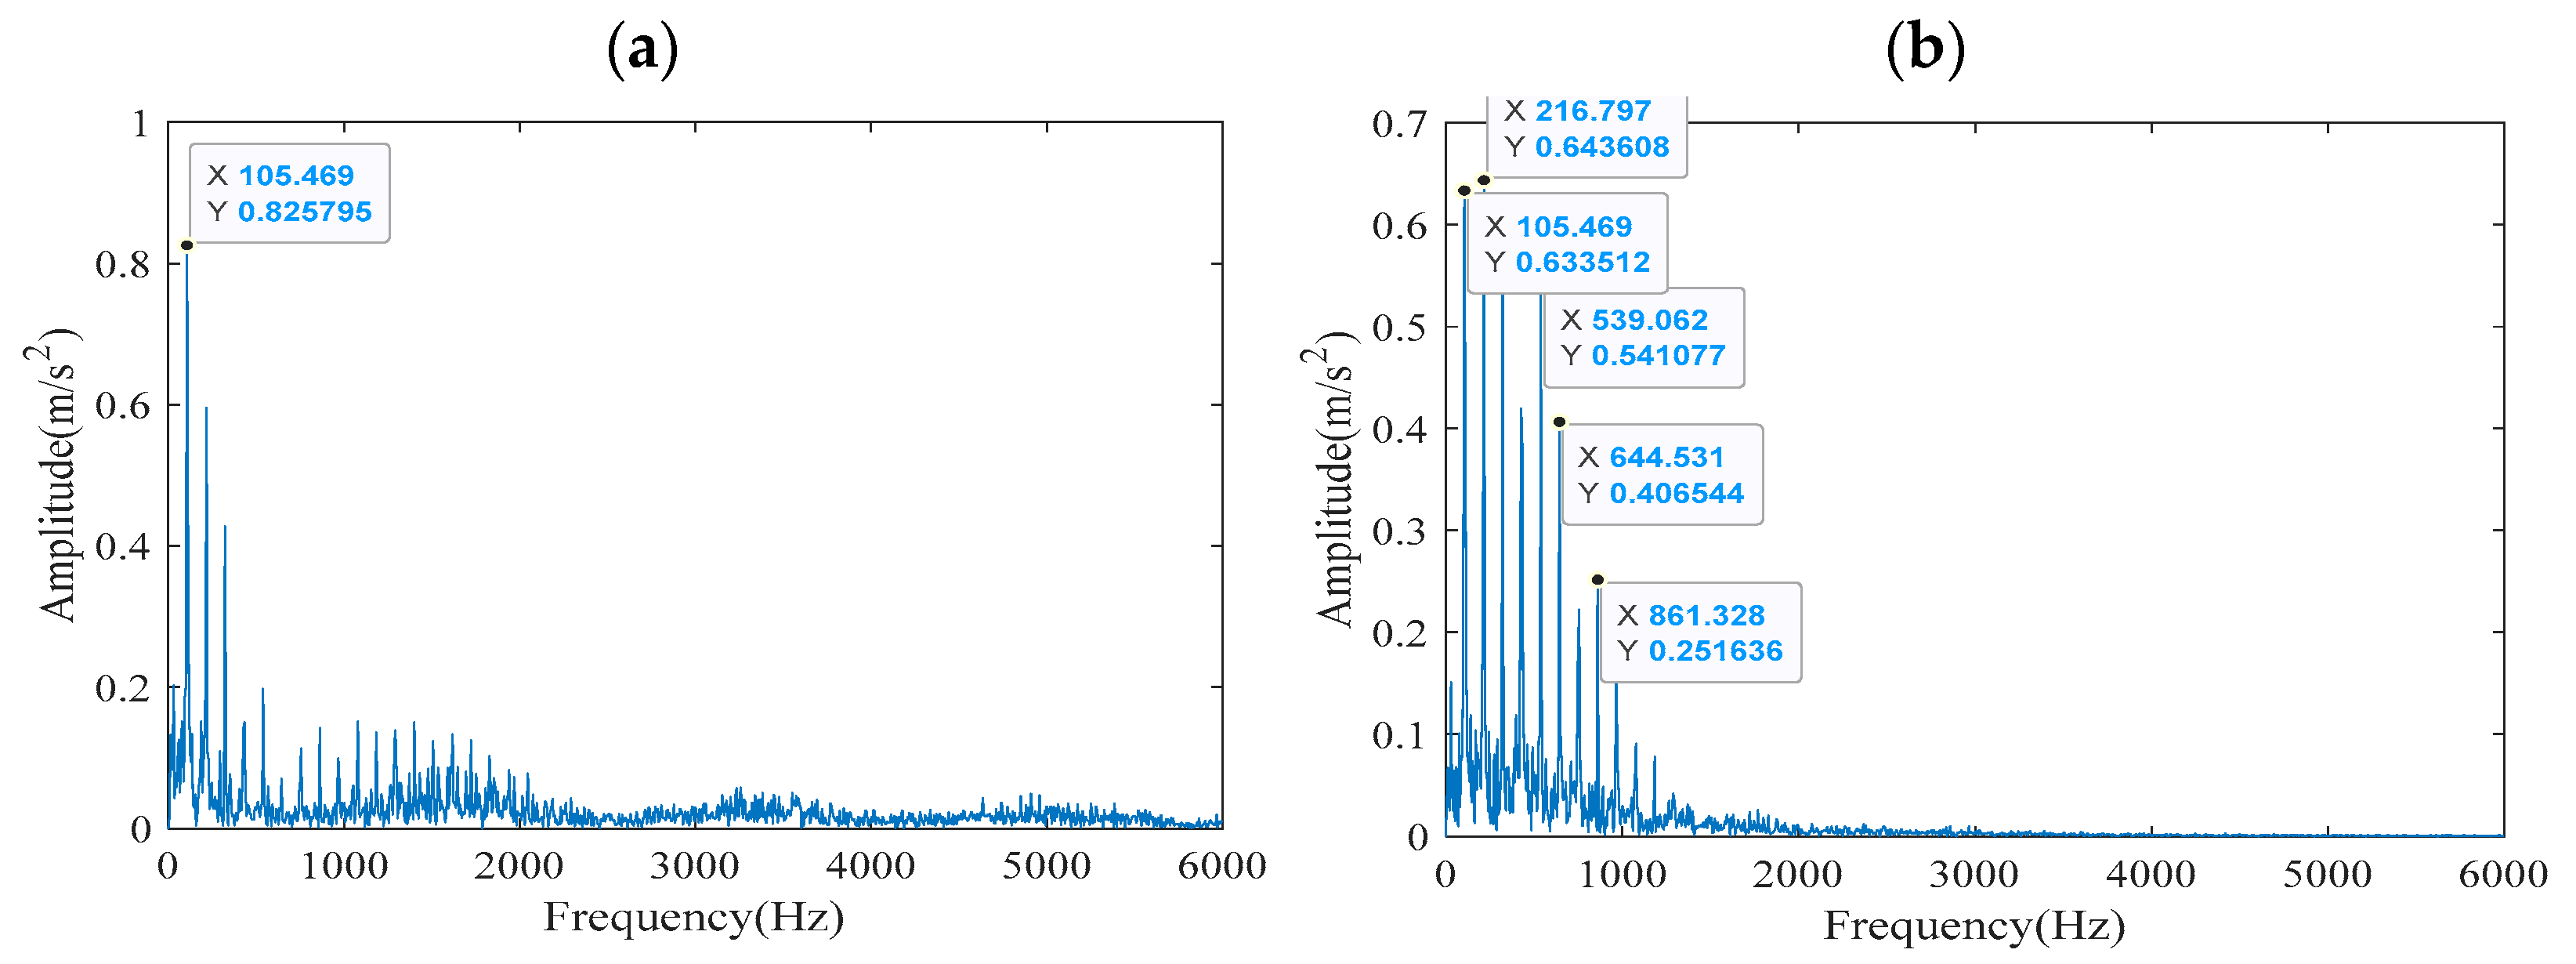
Compared with
Figure 9a,
Figure 10a,
Figure 11a and
Figure 12a contains fewer edge burrs, which indicates that compared with the other three methods, the signal obtained by FCEEMD-ACYCBD method contains fewer noise components and more periodic pulse components. This demonstrates that the FCEEMD-ACYCBD method possesses high time-frequency resolution, enabling it to effectively capture transient impulses and track frequency variations in signals. In conclusion, compared with other methods, FCEEMD-ACYCBD method can effectively extract fault characteristic frequency components, reduce noise disturbance, and improve signal resolution, thus enhancing the ability to detect and diagnose faults.
To quantify the gains of the proposed method, we calculated the quantitative improvement ratios for FCEEMD-ACYCBD compared to FCEEMD-CYCBD. For the inner ring fault, the theoretical fault characteristic frequency is 162.1852 Hz. The FCEEMD-ACYCBD method extracted a frequency of 164.062 Hz, with an error of 1.16% compared to the theoretical value. In contrast, the FCEEMD-CYCBD method extracted a frequency of 165.5 Hz (estimated from
Figure 12b), with an error of 2.04%. This represents an error reduction of approximately 43.1% [(2.04–1.16%)/2.04% × 100%]. Additionally, in terms of computational efficiency, the FCEEMD decomposition time was 0.040238 s (from
Table 4), while the ACYCBD deconvolution process required 0.05 s on average, compared to 0.08 s for CYCBD, resulting in a time saving of 37.5% [(0.08–0.05)/0.08 × 100%] for the overall process. These quantitative results further demonstrate the superiority of FCEEMD-ACYCBD in accuracy and efficiency.
Finally, to further extract the bearing fault characteristics and make fault prediction, this paper extracts the periodic envelope components in the FCEEMD-ACYCBD signal through Teager energy operator demodulation. In addition, Hilbert envelope demodulation comparative analysis is conducted on the signals processed by FCEEMD-ACYCBD to evaluate the performance of the Teager energy operator, as shown in
Figure 13.
As shown in
Figure 13, the Teager energy operator demodulation results exhibit fewer spurious components and noise compared to those from Hilbert envelope demodulation. This shows that Teager energy operator demodulation has relatively small impact on noise and interference, and has strong anti-interference ability. In addition, Teager energy operator demodulation has better stability and accuracy. This is very important for the early screen and diagnosis of bearing faults, and can enhance the stability and dependability of fault diagnosis.
In conclusion, the fault feature frequency of 164.062 Hz with a standard deviation of ±0.85 Hz is extracted by the method presented in this study. It can be seen that the frequency obtained is in proximity to the theoretical value of 162.1852 Hz. It is worth noting that this deviation may stem from measurement errors, including sensor calibration inaccuracies, environmental noise interference during signal acquisition, and inherent limitations of the algorithm in processing non-stationary signals. Despite these errors, the extracted frequency is close to the theoretical value, validating the effectiveness and robustness of the proposed method. Therefore, the FCEEMD-ACYCBD method proposed herein enables efficient and rapid identification of bearing fault types.
4.2.2. Diagnosis of Outer Ring Fault Characteristics
To evaluate the outer ring fault recognition ability of the FCEEMD-ACYCBD model, this study process and analyze its vibration signals.
Figure 14 shows the time-frequency distribution characteristics of the outer ring fault signal, which is significantly different from the inner ring fault signal shown in
Figure 6: the time-domain waveform exhibits typical periodic impulse characteristics, while its frequency-domain energy distribution is dominated by a strong noise background, obscuring the fault characteristic frequency components. This significant noise interference makes it difficult to extract fault characteristic frequency components.
Similarly, EEMD, TVF-EMD, VMD and FCEEMD are used to decompose the outer ring signal into several IMF components respectively. The detailed decomposition results are illustrated in
Figure 15. According to
Figure 15, the first three IMF decomposed by EEMD have obvious cyclical characteristics. The periodicity of IMF components obtained from TVF-EMD decomposition is not obvious, and there is mode aliasing phenomenon. From the decomposition results, VMD decomposition may not completely decompose the outer ring signal, and may receive noise interference. The first two IMF components derived from FCEEMD decomposition also have obvious periodic characteristics, and are less affected by noise. This once again proves the superiority of FCEEMD.
The correlation coefficient and energy kurtosis of IMF decomposed from the outer ring signal by four decomposition methods are shown in
Table 9 and
Table 10. For EEMD decomposition method, the correlation coefficient of IMF1 and IMF2 meets the threshold, while IMF1, IMF2 and IMF3 meet the energy kurtosis threshold. Therefore, the EEMD reconstruction signal is obtained by linear accumulation of IMF1 and IMF2 that meet the double threshold.
It is worth noting that in the
Table 9, the correlation coefficient of IMF8 for FCEEMD is negative (−0.006). This indicates a weak negative correlation between IMF8 and the original signal, which may arise from phase inversion or residual noise components during the FCEEMD decomposition process. However, the absolute value is very small (close to zero), implying that IMF8 has negligible correlation with the original signal. According to the dual-threshold screening criterion (Cor threshold = 0.148), IMF8 is not selected as an effective IMF for signal reconstruction. Therefore, this negative value does not impact the subsequent fault feature extraction and diagnosis results.
In the TVF-EMD decomposition method, this paper selects MF1, IMF2, and IMF3, which meet double thresholds as effective IMF components. For the VMD decomposition method, IMF3, IMF4, IMF5, IMF6, and IMF7 meet the double threshold condition, which indicates that the VMD reconstruction signal reconstructed from them is easier to analyze and extract key information in the signal. Finally, for FCEEMD decomposition method, this paper selects IMF1, which differs from that of inner race faults. Since outer race defects remain in a fixed position relative to the sensor mounting point, the generated vibration signals exhibit more stationary periodic impulses without the amplitude modulation effect characteristic of inner race faults. The dominant IMF1 component in this case captures these quasi-periodic impacts occurring at the outer race fault characteristic frequency (107.3648 Hz). The high correlation coefficient (0.986) and substantial energy content of IMF1 directly reflect the severity of surface damage on the outer raceway. The clearer periodicity observed in the reconstructed signal (
Figure 16d) compared to the inner race case aligns with the stationary nature of outer race defects, where each impulse train faithfully represents the passage of rolling elements over the damaged zone on the stationary outer race.
As illustrated in
Figure 16, the reconstructed outer ring signal exhibits a more pronounced periodic impact component than that in
Figure 8. However, the reconstructed signal still contains some noise components. This will interfere with the analysis and processing of signals and increase the difficulty of signal detection and recognition. Therefore, this study uses deconvolution methods to suppress noise and extract periodic impulse signals. To further prove the effectiveness of ACYCBD, the ACYCBD and CYCBD methods were used to process the outer ring reconstruction signals, and the outcomes are illustrated in
Figure 17,
Figure 18,
Figure 19 and
Figure 20.
It can be seen in
Figure 17 that compared with the ACYCBD method, the EEMD-CYCBD method produces frequencies with smaller amplitudes after frequencies greater than 1000 Hz. This indicates that the CYCBD method performs slightly poorly in extracting fault features’ frequencies. Moreover, contrasted with other methods, the EEMD-ACYCBD method contains more edge burrs in the frequency obtained. This indicates that the EEMD-ACYCBD method is susceptible to noise disturbance, which will influence the accuracy of rolling bearing fault feature extraction. Compared with EEMD-ACYCBD and VMD-ACYCBD, which are more susceptible to noise and yield scattered frequency distributions, FCEEMD-ACYCBD achieves a concentrated frequency spectrum with clear harmonics, as seen in
Figure 20. This is consistent with the findings in [
34], where adaptive deconvolution improved cyclostationary feature extraction, but our method integrates signal decomposition and deconvolution for enhanced performance. In contrast, methods like MED [
20] and MCKD [
21] often extract fewer impulses and are less robust to noise, as reported in [
22].
As can be known from
Figure 19, the frequencies gained by the VMD-ACYCBD method contain more glitches and noise, which indicates that the VMD-ACYCBD method is greatly affected by noise in the process of fault feature extraction. contrasted with the FCEEMD-ACYCBD method, the frequency distribution gained by the VMD-ACYCBD method is more scattered, and the fault feature frequency and its harmonics are not obvious. Therefore, contrasted with several other methods, the advantages of the VMD-ACYCBD method in extracting fault feature frequencies are not evident.
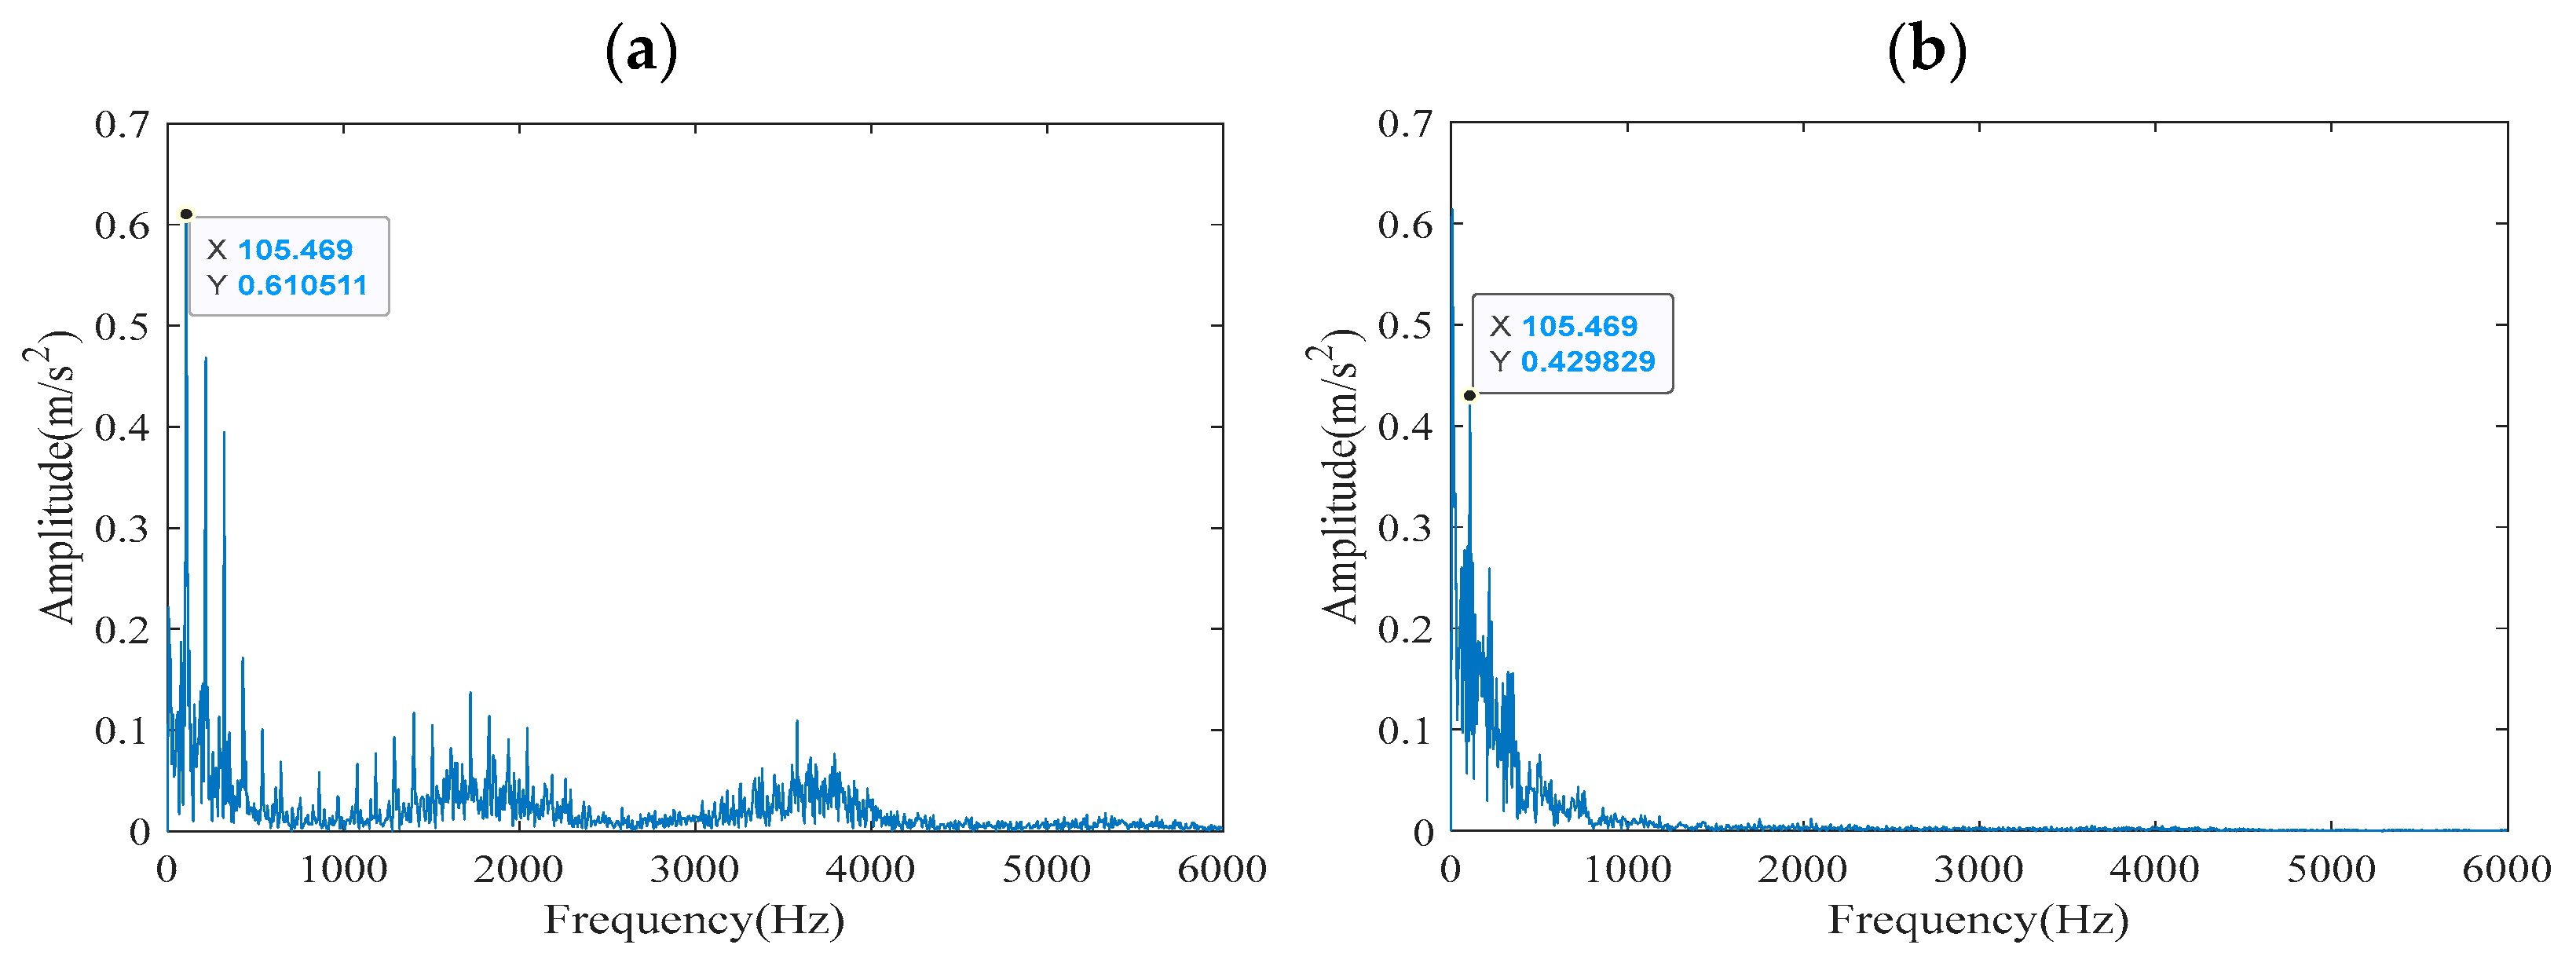
Figure 20 shows the performance of the FCEEMD-ACYCBD signal in the frequency domain. It is evident that the frequencies obtained by the FCEEMD-ACYCBD method are mainly concentrated in 0–2000 Hz, and the fault feature frequency of 105.469 Hz and its multiplier are obvious. Moreover, the FCEEMD-ACYCBD method is the least affected by noise, in contrast with the other three methods. In summary, the FCEEMD-ACYCBD method boasts the benefits of rapid decomposition speed, high precision, and little influence from noise in the course of fault feature extraction.
For the outer ring fault, quantitative improvement ratios were also calculated. The theoretical fault characteristic frequency was 107.3648 Hz. The FCEEMD-ACYCBD method extracted a frequency of 105.469 Hz, with an error of 1.77% compared to the theoretical value. The FCEEMD-CYCBD method extracted a frequency of 104.0 Hz (estimated from
Figure 20b), with an error of 3.13%. This represents an error reduction of approximately 43.5% [(3.13–1.77%)/3.13% × 100%]. In terms of computational time, the FCEEMD decomposition time was 0.040238 s, and the ACYCBD deconvolution required 0.05 s, compared to 0.08 s for CYCBD, resulting in a time saving of 37.5% for the overall process. These quantitative results confirm that FCEEMD-ACYCBD consistently outperforms CYCBD in both fault types.
To precisely extract the fault feature frequency of the outer ring and accurately identify the bearing fault type, the FCEEMD-ACYCBD signal was processed by Teager energy operator demodulation and Hilbert envelope demodulation, and the demodulation outcomes are illustrated in
Figure 21. Through the method proposed in this study, a fault characteristic frequency of 105.469 Hz was obtained, with a standard deviation of ±0.92 Hz, which is almost identical to the theoretical value of 107.3648 Hz. Similarly, there was a minor deviation between the extracted outer ring fault characteristic frequency and the theoretical value. This may be attributed to measurement errors, such as sensor positioning inaccuracies, limitations in signal sampling rate, and interference from background noise. Despite these factors, the extracted frequency is highly consistent with the theoretical value, demonstrating the reliability of this method in high-noise environments. Due to the errors in the signal acquisition process, there exists a discrepancy between the detected frequency and the theoretical frequency, but it can still be determined that the outer ring is faulty. Overall, the experimental outcomes are in accordance with our previous analysis. Results indicate that the proposed method is capable of efficient and accurate fault feature frequency extraction.
