Article

Enhanced Lateral Growth of Homoepitaxial (001) Diamond by Microwave Plasma Chemical Vapor Deposition with Nitrogen Addition

1
Department of Materials Science and Engineering, National Yang Ming Chiao Tung University, Hsinchu 300093, Taiwan
2
National Chung-Shan Institute of Science & Technology, Materials & Electronics-Optics Research Division, Taoyuan City 325004, Taiwan
3
National Institutes of Applied Research, Hsinchu 300092, Taiwan
*
Author to whom correspondence should be addressed.
Coatings 2025, 15(11), 1256; https://doi.org/10.3390/coatings15111256
Submission received: 2 October 2025 / Revised: 22 October 2025 / Accepted: 24 October 2025 / Published: 30 October 2025
(This article belongs to the Special Issue Thin-Film Synthesis, Characterization and Properties)

Abstract

Diamond, as an exceptional material with many superior properties, requires a single crystal in a reasonably large size for practical industrial applications. However, achieving large-area single-crystal diamond (SCD) growth without the formation of polycrystalline rims remains challenging. Microwave plasma chemical vapor deposition (MPCVD) using a gas mixture of 10% CH4-H2 was used for the homoepitaxial growth of (001) SCD. The effect of nitrogen gas addition in the range of 0–2000 ppm on lateral growth was investigated. Deposition with 180 ppm N2 over a growth duration of 20 h to reach a thickness of 0.95 mm resulted in significantly enhanced lateral growth without the appearance of a polycrystalline diamond (PCD) rim for the grown diamond, and the total top surface area of SCD increased by an area gain of 1.6 relative to the substrate. The corresponding vertical and lateral growth rates were 47.3 µm/h and 52.5 µm/h, respectively. Characterization by Raman spectroscopy and atomic force microscopy (AFM) revealed uniform structural integrity across the whole surface from the laterally grown regions to the center, including the entire expanded area, in terms of surface morphology and crystalline quality. Moreover, measurements of the etch pit densities (EPDs) showed a substantial reduction in the laterally grown regions, approximately an order of magnitude lower than those in the central region. The high quality of the homoepitaxial diamond layer was further verified with (004) X-ray rocking curve analysis, showing a narrow full width at half maximum (FWHM) of 11 arcsec.

1. Introduction

Diamond is well-known for its outstanding physical and electronic properties, including superior hardness, excellent thermal conductivity, ultra-wide bandgap, high light transmittance, high breakdown electric field, and high saturation velocity [1,2,3]. These attributes make it an attractive candidate for next-generation applications in quantum information processing, ultraviolet and radiation detection, fusion window, and high-power integrated electronic devices [4,5,6,7]. In addition to these cutting-edge applications, diamond has also been widely employed in conventional industries such as mechanical machining, thermal management, and optical or vacuum windows [8,9,10]. For practical electronic applications, synthesizing large-area single-crystal diamond (SCD) substrates is essential. Nevertheless, producing large-area SCD with a low defect density at low cost remains a great challenge [11,12,13]. Currently, approaches such as mosaic growth, high-power, or 915 MHZ microwave plasma chemical vapor deposition (MPCVD) have been explored to enlarge the diamond growth area. However, each method still faces limitations related to high dislocation density, system design, non-uniform distribution of the plasma electric field, and high cost [14,15,16].
MPCVD is currently regarded as the leading technique for synthesizing SCD [17,18], but achieving large-area growth faces challenges such as crystal quality degradation, polycrystalline diamond (PCD) formation at the edges, and limited lateral growth rates [5,6,7,8,10]. Once a PCD is formed, laser cutting is often applied to remove the PCD to obtain SCD. As a result, the available SCD size may be significantly reduced. Recent studies have shown that innovative holder designs can effectively suppress PCD rim formation and expand the usable SCD area [11,13,19]. However, these holder-based approaches often require specialized apparatuses and multi-step processes, presenting a challenge for scalable, cost-effective production. In addition, previous studies have suggested that lateral growth can lead to a reduction in threading dislocation density, as the laterally expanded regions are spatially separated from the vertical propagation paths of substrate-originated dislocations [20,21,22]. Li et al. [23] demonstrated that triangular trenches with appropriate widths promote a step-flow growth mode during epitaxial lateral overgrowth (ELO), leading to dislocation intersection and annihilation. Although significant progress has been made, the underlying mechanisms governing lateral growth, the upper limits of its growth rate, and its potential contribution to defect suppression have not yet been systematically clarified and remain insufficiently understood.
The high-rate growth of homoepitaxial SCD films ranging from 50 to 150 μm/h has been demonstrated by employing high-density microwave plasma and introducing nitrogen into the source gas mixture [24]. Also, it has been reported that the growth of SCD to a thickness of 18 mm using microwave plasma-assisted chemical vapor deposition can be achieved under elevated pressures of up to 350 Torr [25]. By applying high power densities with nitrogen at 300 Torr, the vertical growth rate can be as high as 165 μm/h, highlighting the effectiveness of nitrogen-assisted MPCVD under optimized process conditions. While the effect of nitrogen on enhancing the vertical growth rate of (001)-oriented SCD is well-established, its influence on lateral growth and quality has not been systematically clarified.
Here, we systematically examined the lateral growth of SCD under varying nitrogen concentrations in an MPCVD process. The results show that deposition with an appropriate nitrogen concentration enables a significant expansion of the SCD surface area with minimal PCD formation at the periphery. Moreover, the laterally grown regions may even exhibit an improved crystalline quality.

2. Materials and Methods

2.1. Substrate Preparation

SCDs were grown by MPCVD on polished (001)-oriented synthetic CVD diamond substrates (5.5 × 5.5 × 0.5 mm3) supplied by Element Six Co. Ltd. (Harwell, Oxfordshire, UK), with a miscut angle of ≤1°. Before deposition, substrates underwent ultrasonic cleaning in acetone and ethanol, each for 10 min, to remove organic and chemical residues, followed by drying with nitrogen gas. A two-step acid cleaning procedure was employed to eliminate residual sp2-bonded carbon and surface damage. First, the samples were immersed in a hydrogen peroxide and sulfuric acid mixture (H2O2:H2SO4 = 1:4 in volume ratio) at 200 °C for 0.5 h, followed by nitric acid and sulfuric acid solution (HNO3:H2SO4 = 1:4 in volume ratio) at 300 °C for another 0.5 h. After cleaning, the substrate was loaded on a flat Mo plate holder in the reactor.

2.2. MPCVD Growth Conditions

The homoepitaxial growth was conducted in a 6 kW/2.45 GHz ASTeX-type MPCVD system (WEC, New Taipei City, Taiwan) using a 10% CH4-H2 gas mixture, with a total flow rate of 500 sccm at a pressure of 1.87 × 10⁴ Pa (140 Torr). The hydrogen (99.9995% purity, 5N5) and methane (99.999% purity, 5N) source gases were purified using heated zirconium-based getter purifiers to eliminate residual impurities. Nitrogen gas was introduced in concentrations of 0, 60, 180, 540, and 2000 ppm (corresponding samples designated as N0, N60, N180, N540, and N2000, respectively). The base pressure before plasma ignition was 1.33 × 10⁻⁴ Pa. Prior to deposition, the substrate underwent hydrogen plasma pre-treatment at 5000 W and 1.67 × 10⁴ Pa (125 Torr) for 20 min to remove any surface residues. For all of the deposited samples, subsequent diamond growth was conducted at 5600 W for 20 h, except for the N540 sample for 15 h. A 2-color thermo-pyrometer (METIS M3, Milford, MA, USA) with a minimum spot size of 0.8 mm was employed to measure the substrate temperature from the view port. The measured substrate temperatures were approximately 1198 °C for N0, 1190 °C for N60, 1180 °C for N180, 1183 °C for N540, and 1186 °C for N2000, respectively. After growth, a hydrogen plasma post-treatment at 5000 W and 1.67 × 10⁴ Pa was applied for 20 min to stabilize the surface and remove weakly bound sp2 species.

2.3. Structural Characterization

Structural characterization was conducted using high-resolution X-ray diffraction (HRXRD, PANalytical X’Pert3 MRD XL, Almelo, The Netherlands) equipped with a Ge (400) hybrid monochromator and triple-axis detector. The incident beam was aligned along [110]. Symmetric 2θ-ω scans of the (004) reflection and rocking curve (ω-scan) measurements of (004) and asymmetric (113) reflections were performed to assess the crystalline quality. Raman spectroscopy (HORIBA LabRAM HR Evolution, Kyoto, Japan) with a 488 nm wavelength laser was utilized to assess the crystal quality. The measurements were conducted using a 488 nm DPSS laser with a spot size of approximately 1 μm in diameter, a dwell time of 5 s, and an effective laser power of less than 5 mW on the sample surface. Measurements were taken at multiple locations on the top surface and grown side faces to evaluate the structural uniformity in terms of Raman shift and FWHM of the diamond peak at ~1332 cm−1. Raman spectra were collected using a 1800 grooves/mm grating, with the focal point consistently maintained on the sample top surface and grown side faces throughout all measurements. Nitrogen-related point defects were also examined with photoluminescence spectroscopy (PL, HORIBA LabRAM HR Evolution, Kyoto, Japan) with a 488 nm laser excitation. PL spectra were measured in the range of 490–950 nm at room temperature. All PL spectra were normalized with respect to the intensity of the diamond Raman peak for comparison among all the samples. The surface morphology was examined with optical microscopy (OM, Zeiss Axio Lab 5, Jena, Germany and KEYENCE VHX-X1, Osaka, Japan), scanning electron microscopy (SEM, Thermo Fisher Helios 5 UX, Brno, Czech Republic), and atomic force microscopy (AFM, Bruker Dimension Icon Scanning Probe Microscope, Santa Barbara, CA, USA).

3. Results and Discussion

3.1. Surface Morphology Evolution with Nitrogen Addition

Figure 1a shows OM images of all of the grown samples with a CVD substrate. The typical pristine CVD substrate had four sides along <100> and the diagonal along the [1 1 ¯ 0], and its surface roughness (Rq) as measured by AFM was less than 0.5 nm. In Figure 1a, OM images of the diamonds grown under different nitrogen concentrations (N0, N60, N180, N540, and N2000) showed changes in the appearance of the overall surface morphologies with overgrowth and lateral growth, which may be associated with polycrystallinity around the rim. The white dashed outlines indicate the initial substrate area. The regions marked with red circles correspond to the magnified OM images in Figure 1b to show detailed characteristics.
Under the nitrogen-free condition (N0), macro-steps were seen on most of the top surface regions, while significant PCD formation (dark contrast) was observed along the periphery of the grown diamonds with some PCDs appearing near the central region. The overgrowth of PCDs may reduce the effective top surface area of the SCD. With increasing nitrogen concentration, the prominence of macro-steps gradually diminished, resulting in a smoother and more uniform surface morphology. Moreover, PCD formation around the rims and the central regions could be effectively suppressed with nitrogen concentration. Notably, at 180 ppm N2, the edges of the grown diamond parallel to the substrate <100> were retained, whereas smooth edges parallel to <110> appeared. However, at higher N2 concentrations of 540 and 2000 ppm, the edges developed a pronounced sawtooth-like morphology aligned with [1 1 ¯ 0] and [110], and polycrystalline diamond (PCD) reappeared on the sidewalls. This phenomenon suggests that such jagged morphologies may induce local charge accumulation in the plasma and alter the spatial distribution of reactive species, thereby promoting non-epitaxial growth on the sidewalls [11,19,26,27,28]. Alternatively, the observed sawtooth-like edges may also originate from mechanical imperfections introduced after substrate cutting, grinding, and polishing, leading to uneven edge geometry prior to growth.
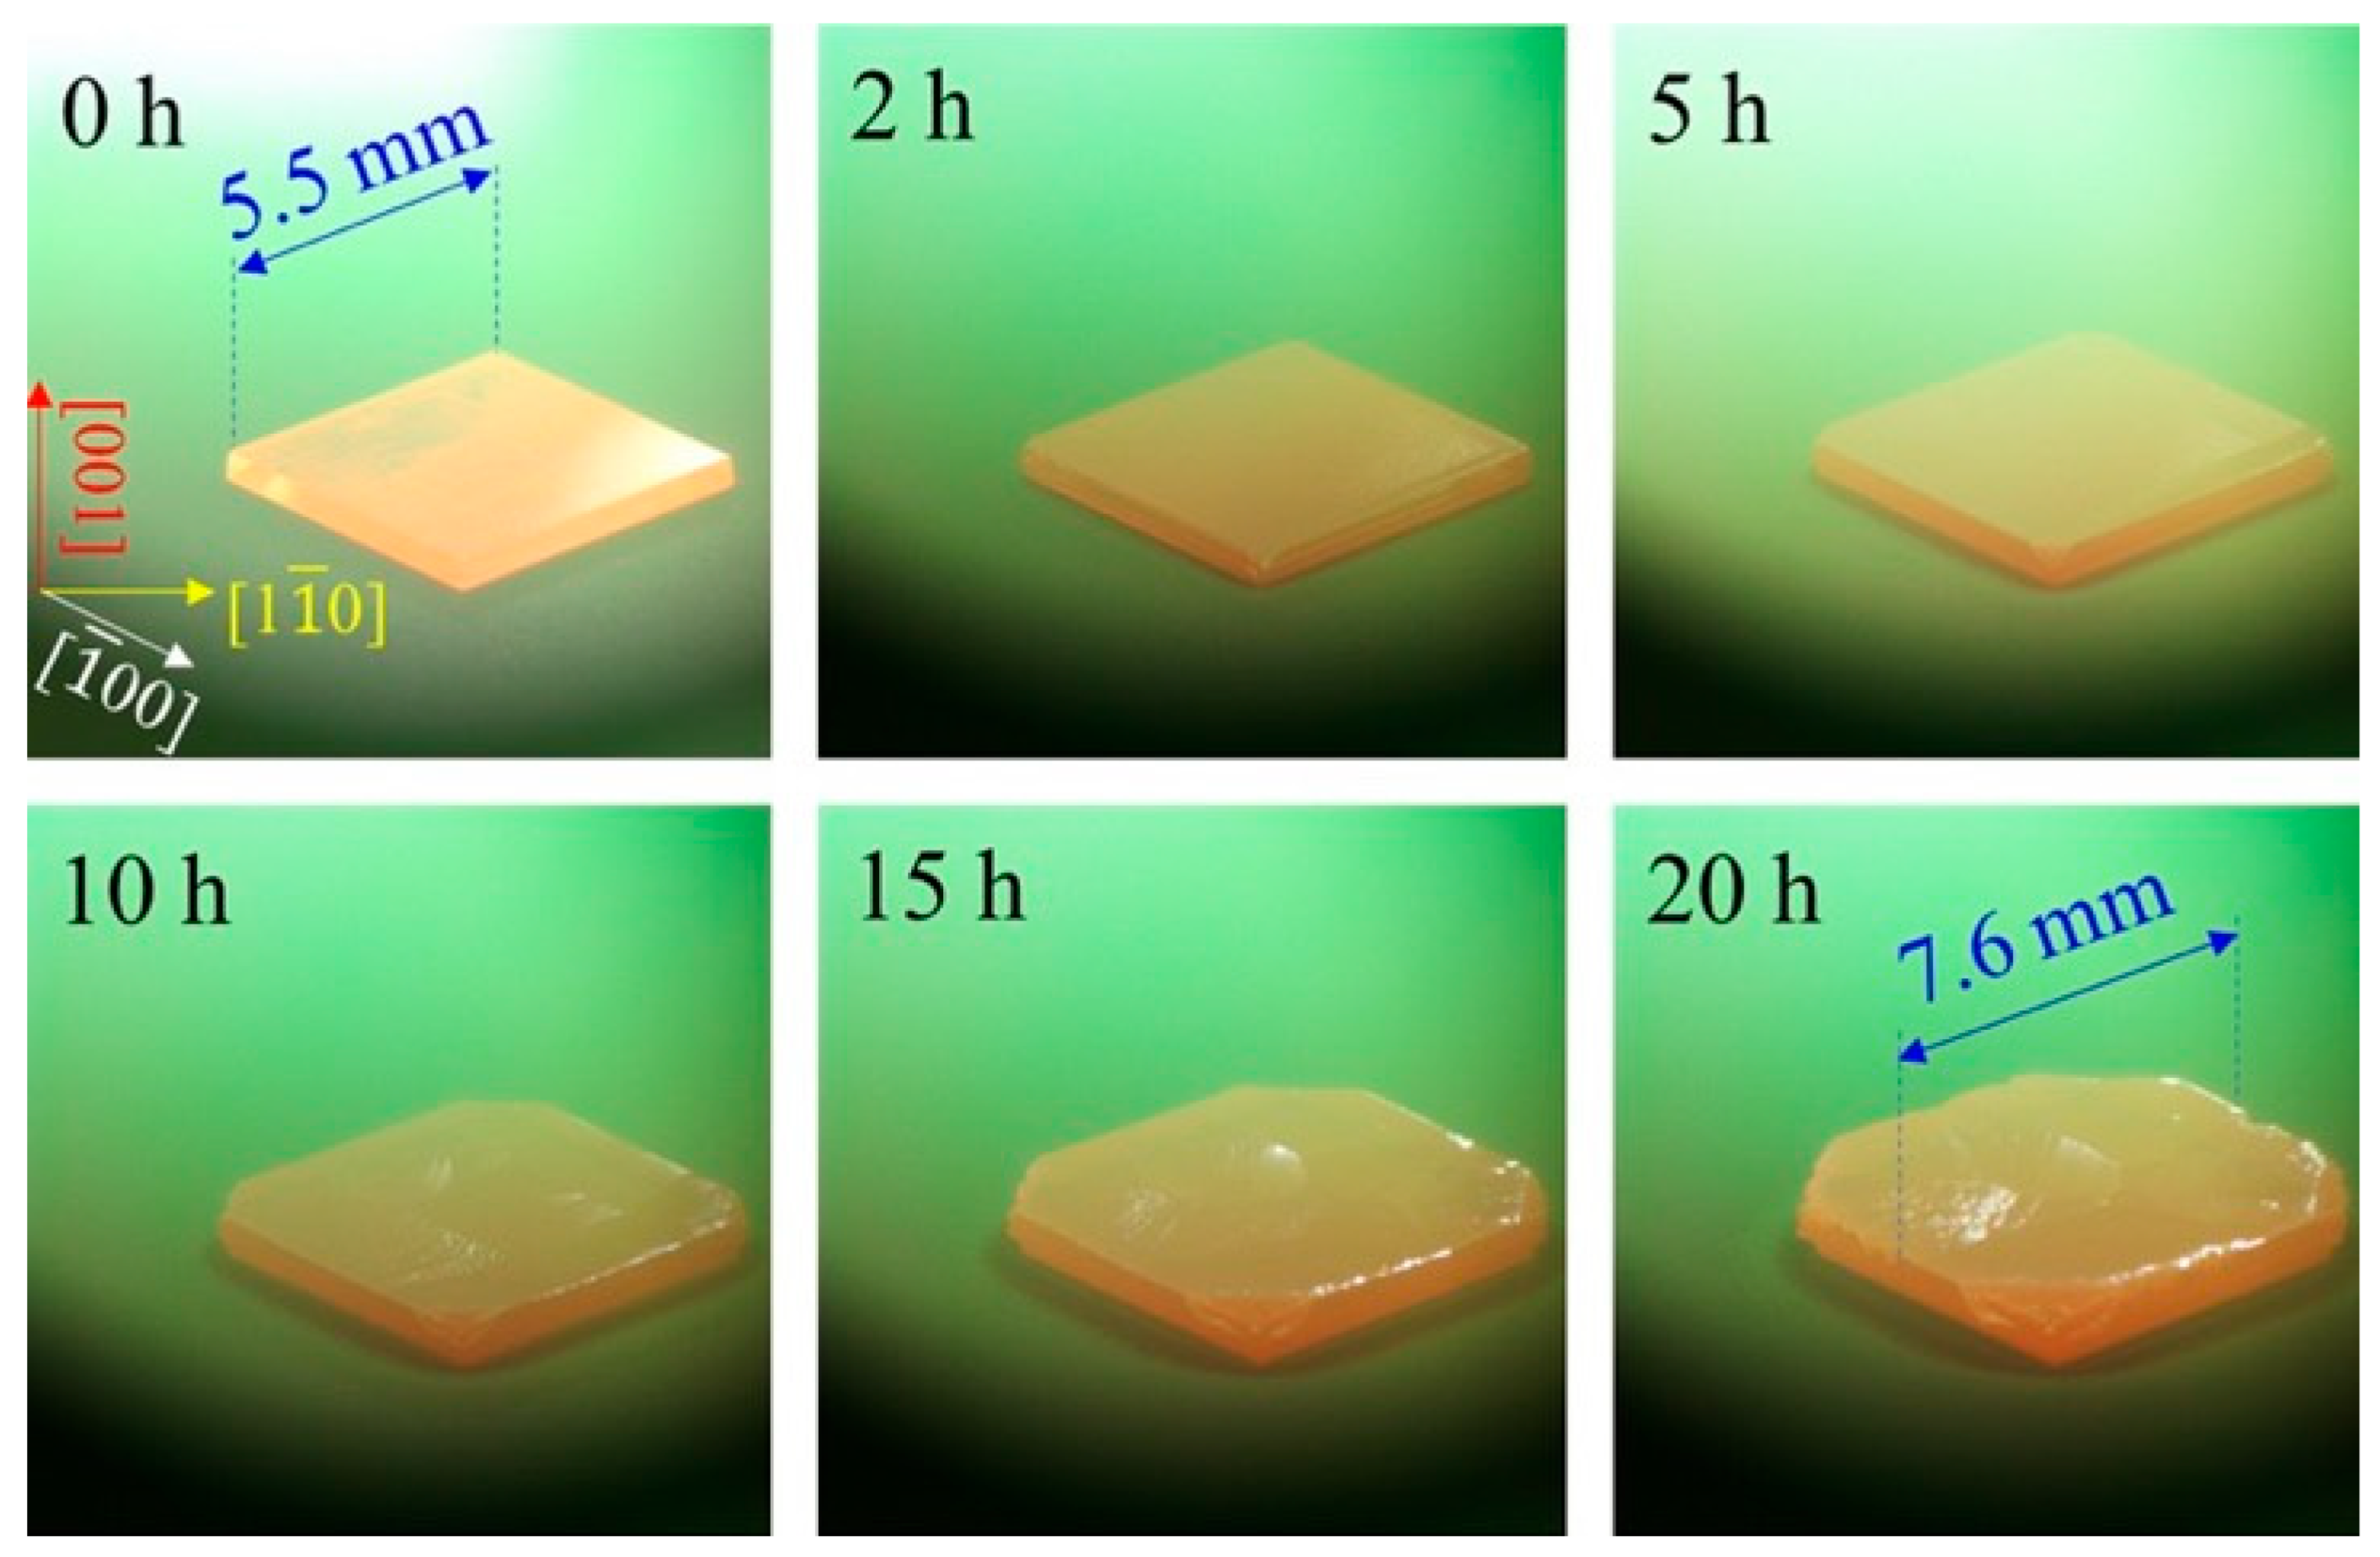
Figure 2 shows a series of pictures of the N180 sample captured with a camera during MPCVD growth through the viewing window of the MPCVD reactor, illustrating the morphological evolution from an initially square shape with edges along <100> to a polygonal geometry as growth proceeds. This morphological transition is consistent with anisotropic lateral growth rates, particularly the relatively higher growth rate along lateral directions along <100>, leading to the gradual disappearance of laterally grown {100} faces. Over the growth period of 20 h, the edge length increased from 5.5 to 7.6 mm along the [100]. The vertical growth rate (GR[001]) and the lateral growth rate (GR[100]) were 47.3 µm/h and 52.5 µm/h, respectively, indicating a growth rate ratio close to 1:1. This suggests that nitrogen incorporation under this gas concentration in the plasma effectively promotes both vertical and lateral growth rates. Compared with the substrate, the top surface exhibited a lateral area gain of 1.6, reaching a thickness of approximately 0.95 mm.

3.2. Growth Rates and Lateral Area Expansion

Figure 3 illustrates the dependence of the diamond growth rate and effective SCD top surface area expansion on nitrogen concentration. Both the GR[100] (excluding PCD) and GR[001] were measured, with the resulting increase in SCD surface area. In Figure 3a, the GR[001] (red circles) steadily increased with N2 concentration, from approximately 21 μm/h at 0 ppm to 56.5 μm/h at 2000 ppm. This trend shows that increasing nitrogen consistently enhanced the vertical growth rate of GR[001], similar to those reported in the literature [29,30]. In contrast, the lateral growth rate of GR[100] exhibited a sharp increase as the nitrogen concentration increased from 0 to 180 ppm, reaching a maximum of approximately 52.5 μm/h. To further verify the trend near 180 ppm, additional samples with intermediate nitrogen concentrations (N120 and N240) were examined. The results confirmed a gradual enhancement in lateral growth approaching 180 ppm, indicating that N180 represents the optimal condition for maximizing GR[100]. Nevertheless, when the nitrogen concentration exceeded 540 ppm, GR[100] was significantly reduced, and it declined to below 5 μm/h at 2000 ppm. In Figure 3b, the corresponding evolution of the SCD area (excluding PCD) followed a similar trend to that of the GR[100], reaching a maximum value near 180 ppm and then decreasing at higher nitrogen levels. The results demonstrate that while nitrogen addition enhances both vertical and lateral growth to varied extents, an optimal N2 concentration may exist for maximizing lateral expansion, beyond which the lateral growth advantage is reduced.
The above results indicate that the lateral area expansion of the grown diamond decreased when the growth-rate ratio of GR[100]/GR[001], λ, deviated significantly from unity. The maximum surface-area increase occurred when λ was close to 1, suggesting that balanced vertical and lateral growth rates are favorable for maximizing lateral expansion, as shown in Figure 3b. It was determined that λN0 = 0.06, λN60 = 0.143, λN540 = 0.137, and λN2000 = 0.084, in comparison with λN180 = 1.1. Cao et al. [13,31] reported that without nitrogen addition, by growth with modification of the holder geometry and adjustment of the deposition pressure, the lateral growth rate was significantly enhanced when λ approached unity. Moreover, Zhao et al. [21] reported that the threading dislocation density was significantly lower in samples with a λ value of 1.1 compared with those with values deviating from unity. Feng et al. [19] achieved a lateral area gain of 1.31 for the SCD surface area under a one-step growth condition of 5.0 kW microwave power, 6% CH4, and 170 Torr for 246 h using a substrate holder with slanting sidewalls. Nad et al. [11,12] reported an area increase by 2.15 times through one-step growth at 1.8–2.0 kW for 64.3 h, and an increase by 2.5 times through two-step growth with a pocket-type holder, under the deposition condition of 5% CH4 and 240 Torr for 120.3 h. Cao et al. [13] demonstrated a 2.67 times area increase in the substrate seed through multi-step growth at 150 Torr with 3% CH4 and 1.25 kW using a semi-open holder designed to induce self-assembling off-angles. In comparison, the present work demonstrated a substantial area gain of 1.6 after a significantly shorter growth duration of 20 h.

3.3. Surface Morphologies of the N180 Sample

AFM and OM images in Figure 4a illustrate the top surface morphologies of the N180 at different locations. The top surface exhibited clear characteristics of terraces and steps, resulting from step-bunching growth along both [110] and [1 1 ¯ 0]. Additionally, in Figure 4b, the laterally grown region on the side face, as viewed along the direction indicated by the orange arrow in Figure 4a, exhibited a pronounced terrace-step morphology, particularly near the top surface. The step-terraces were generally aligned parallel to [011], similar to those observed on the top surface at locations 1 and 2. This phenomenon suggests that the optimal nitrogen gas addition allows for the lateral growth of SCD to proceed with overgrowth on the top surface in a similar growth mode so that no PCD formation occurs.

3.4. Raman Spectroscopy Analysis

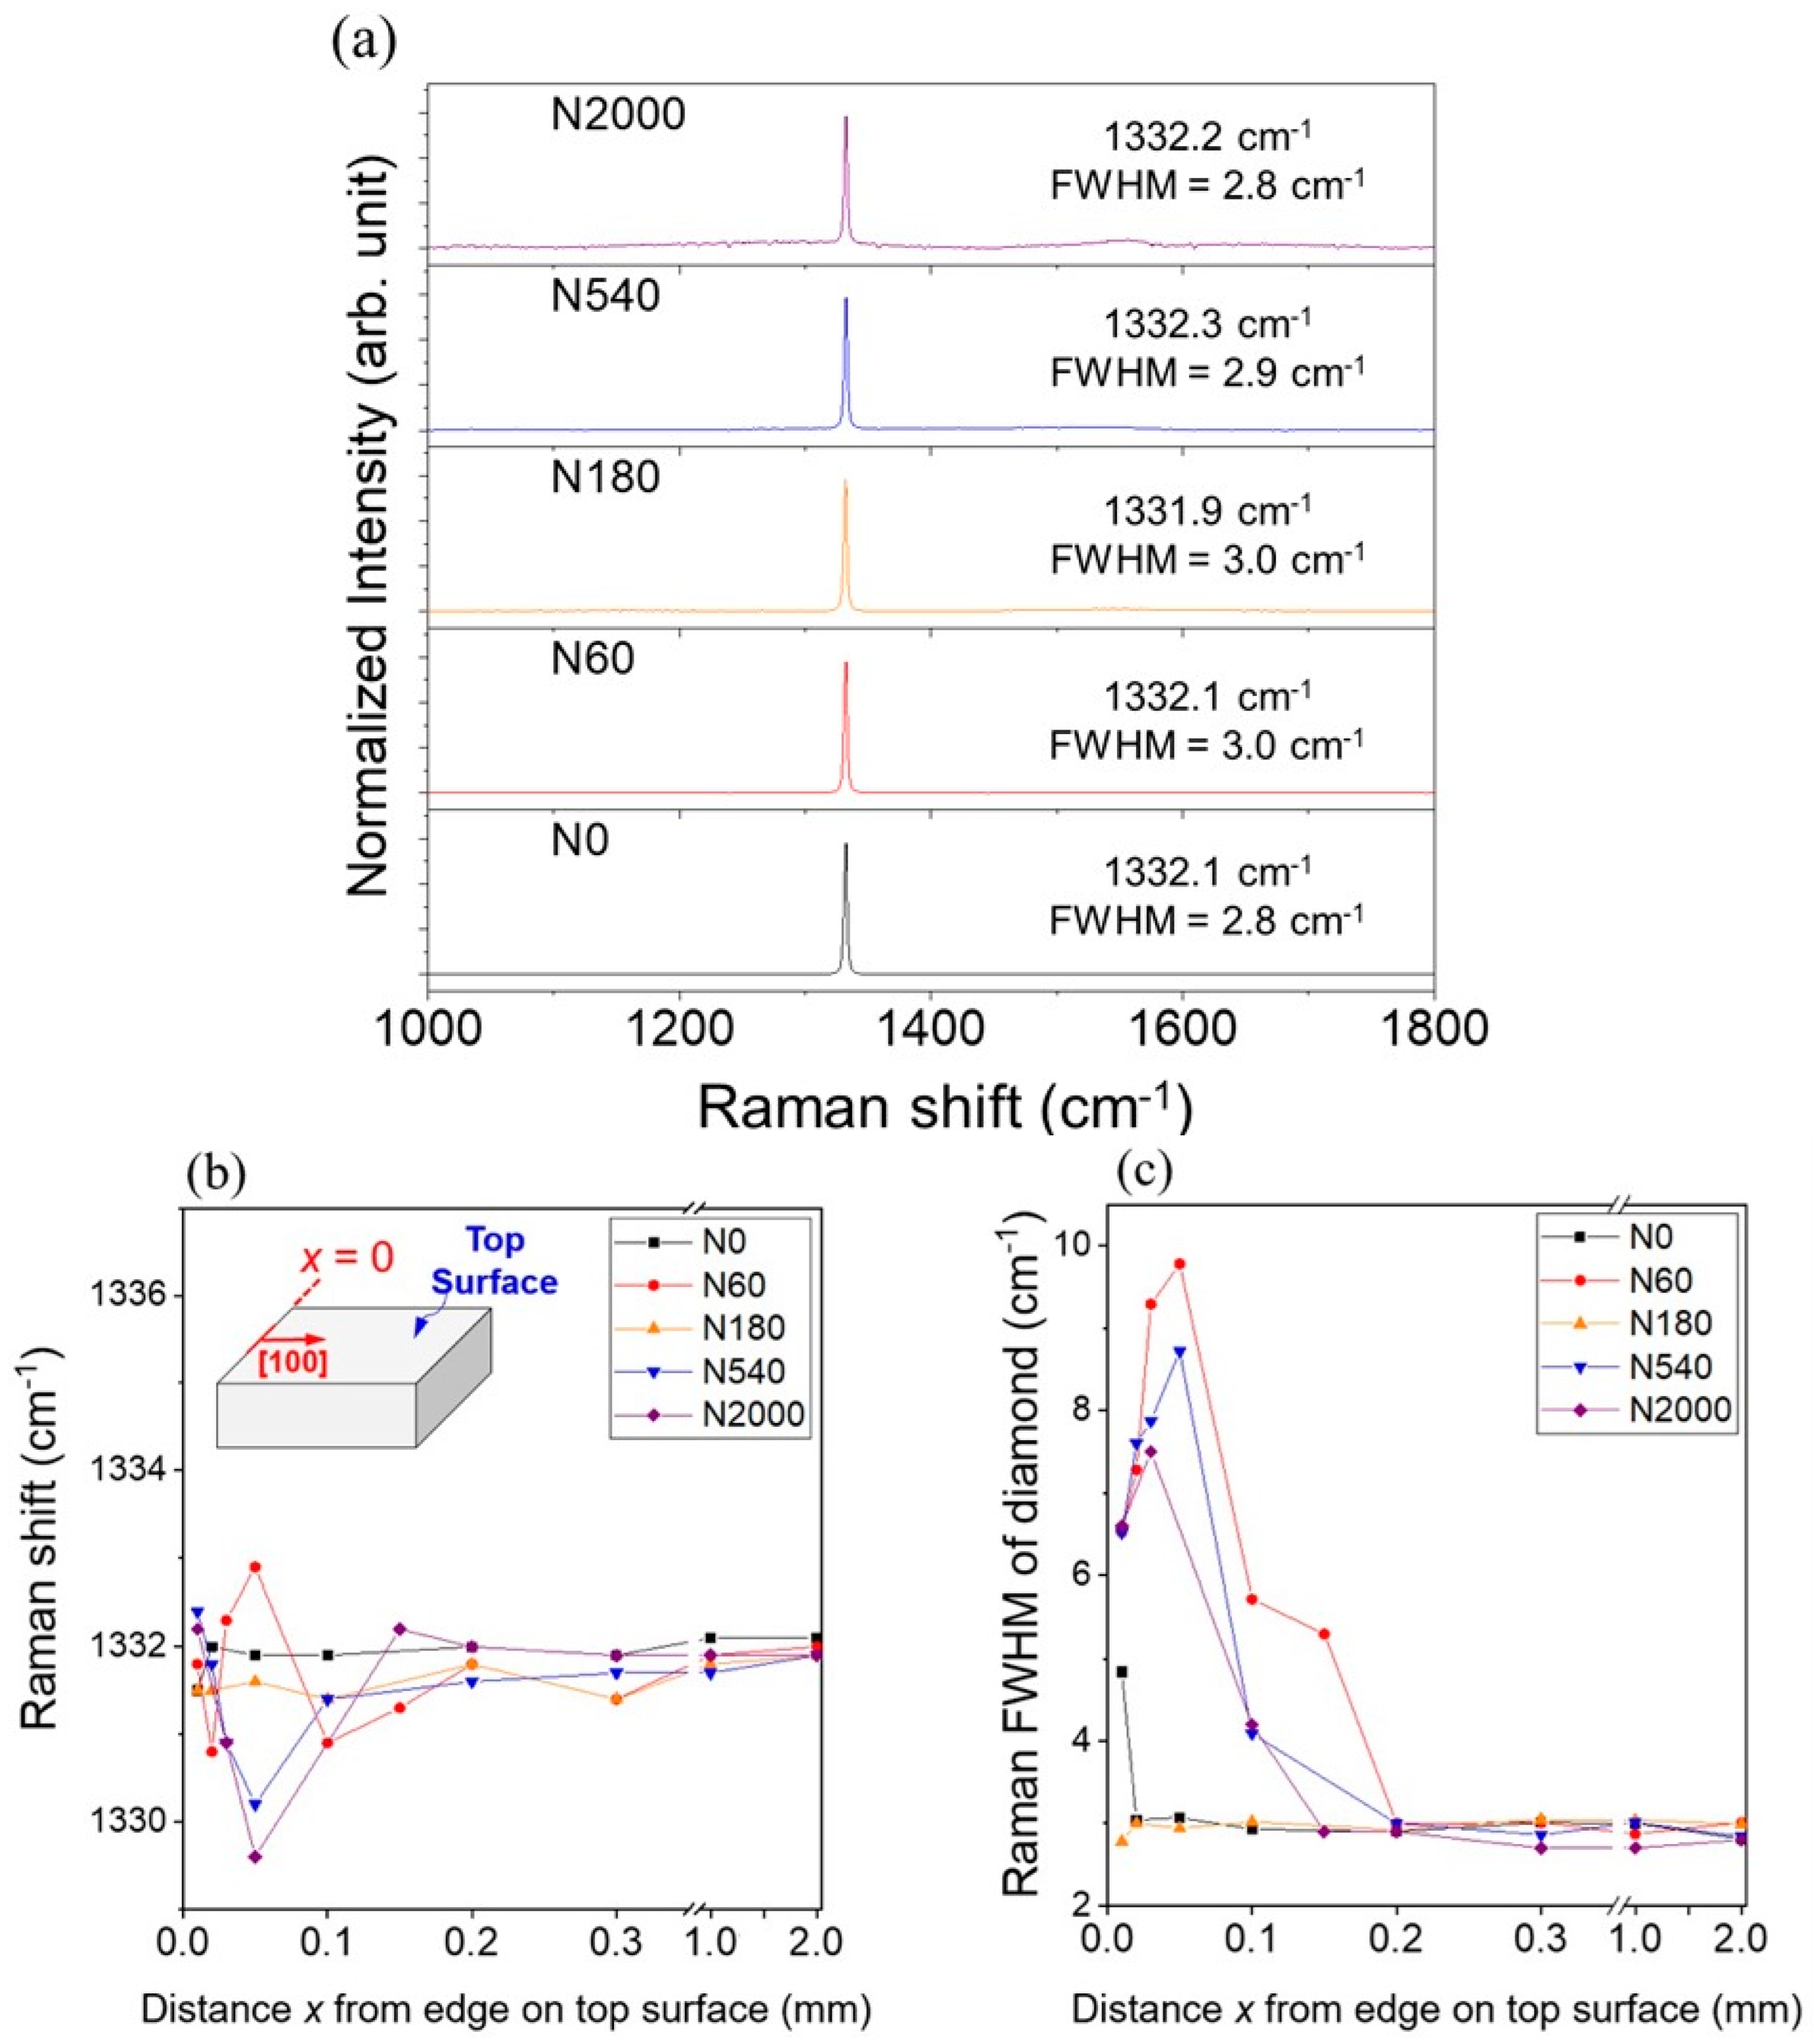
Figure 5a reveals the Raman spectra of the diamond samples, acquired from the central regions of the top surface. All Raman spectra showed the characteristic diamond peak near 1332 cm−1 with no signals from non-diamond phases, confirming the phase purity of the grown diamonds. The full width at half maximum (FWHM) of the Raman peaks remained narrow for all nitrogen conditions, comparable to that of the CVD substrate, which was approximately 2.9–3.0 cm−1. This suggests that the crystalline quality of the grown diamond was well-maintained and not significantly changed with nitrogen incorporation, even at higher nitrogen concentrations.
Multi-point Raman measurements were also conducted on the top surface, from the outer edge of each sample progressing toward the center. Figure 5b presents the Raman shift, and Figure 5c shows the corresponding FWHM value. Notably, N180 exhibited the most consistent Raman shift distribution across the top surface, showing negligible deviation even at the sample edges. Also, the FWHM values were narrow across the surface, showing that the grown SCD retained high crystalline quality and experienced low residual stress with good uniformity. In contrast, samples with other nitrogen concentrations showed degraded spectral features near the sample edges. Importantly, within the regions of approximately 150–200 μm from the edge, the FWHM value increased significantly, but gradually decreased toward the center, eventually approaching the value of the underlying substrate. This range coincides with the PCD region observed in the OM images shown in Figure 1b, highlighting the importance of maintaining edge alignment parallel to <100> to preserve the crystalline quality.
Figure 6 presents the Raman shift of the diamond peak with the corresponding FWHM value of the N180 diamond measured along the height (h) downward along [00 1 ¯ ] on the grown side face. Here, the top surface was defined as the reference point (h = 0 mm), and the measurements were taken at different locations along [00 1 ¯ ]. The variations in Raman shift with the height were insignificant in comparison with 1331.9 cm−1 of the substrate. Also, the FWHM values of the diamond were generally around 3.0 ± 0.1 cm−1, which were comparable to those of the substrate (2.9 cm−1), implying that the crystal quality of the laterally grown diamond was uniform and nearly as good as the substrate. The results clearly show that both the quality of the laterally grown face and the top surface were similar and maintained a high crystalline quality for vertical and lateral growth.

3.5. X-Ray Diffraction Characterization

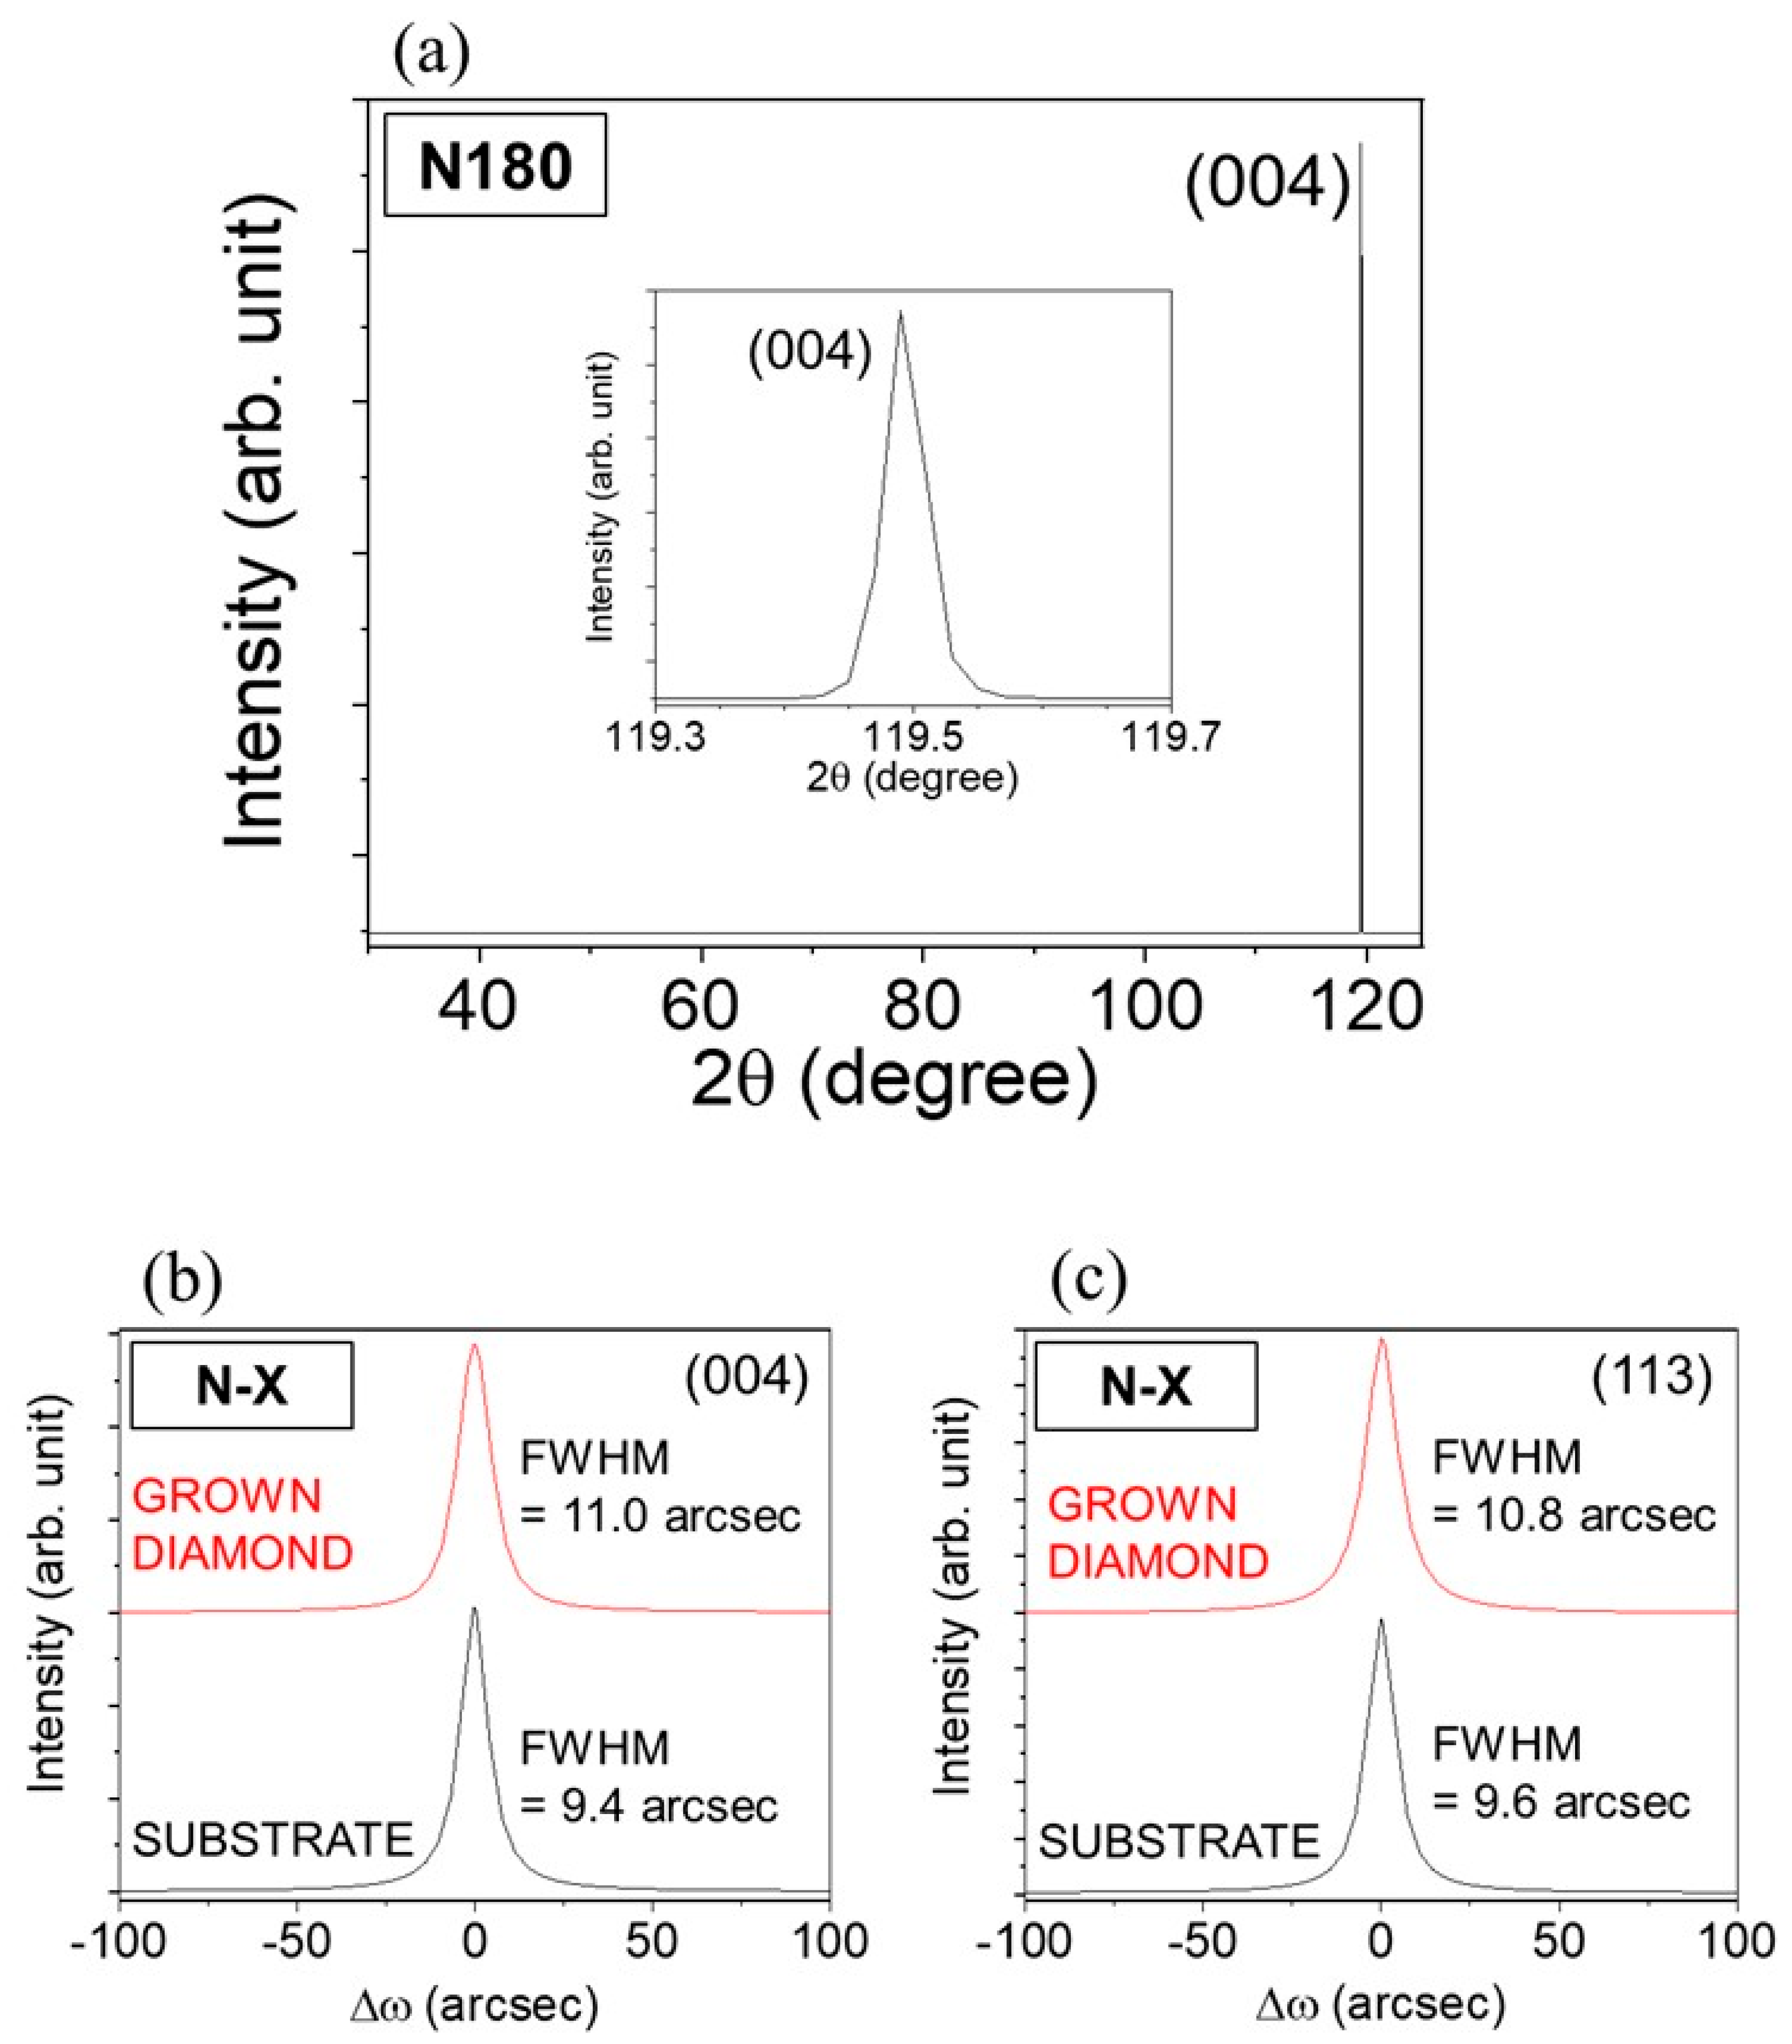
XRD analyses were performed to evaluate the crystal quality. Figure 7a presents the 2θ-ω pattern of N180 in the 2θ range of 30–125°, showing a single prominent diffraction peak at approximately 119.49°, corresponding exclusively to the diamond (004) reflection. This clearly shows that adding N2 neither disrupts the (001) diamond homoepitaxial growth nor introduces other oriented diamonds and non-diamond phases. Additionally, we grew a sample (N-X) on a 5.5 × 5.5 × 0.5 mm3 CVD substrate under the same plasma condition and growth duration as N180. A 0.5 mm-thick slice was then laser-cut from the N-X sample to remove the underlying substrate, and the cut surface was then polished for X-ray rocking curve (XRC) measurements while the grown surface was intact. Figure 7b,c shows the XRCs of the (004) and (113) reflections, respectively, from the grown 0.5 mm thick CVD diamond slice. The corresponding FWHMs of (004) and (113) XRCs were approximately 11 and 10.8 arcsec, respectively, closely comparable to the substrate values of 9.4 and 9.6 arcsec, indicating the high crystallinity of the grown diamond layer.

3.6. Photoluminescence and Nitrogen-Vacancy Centers

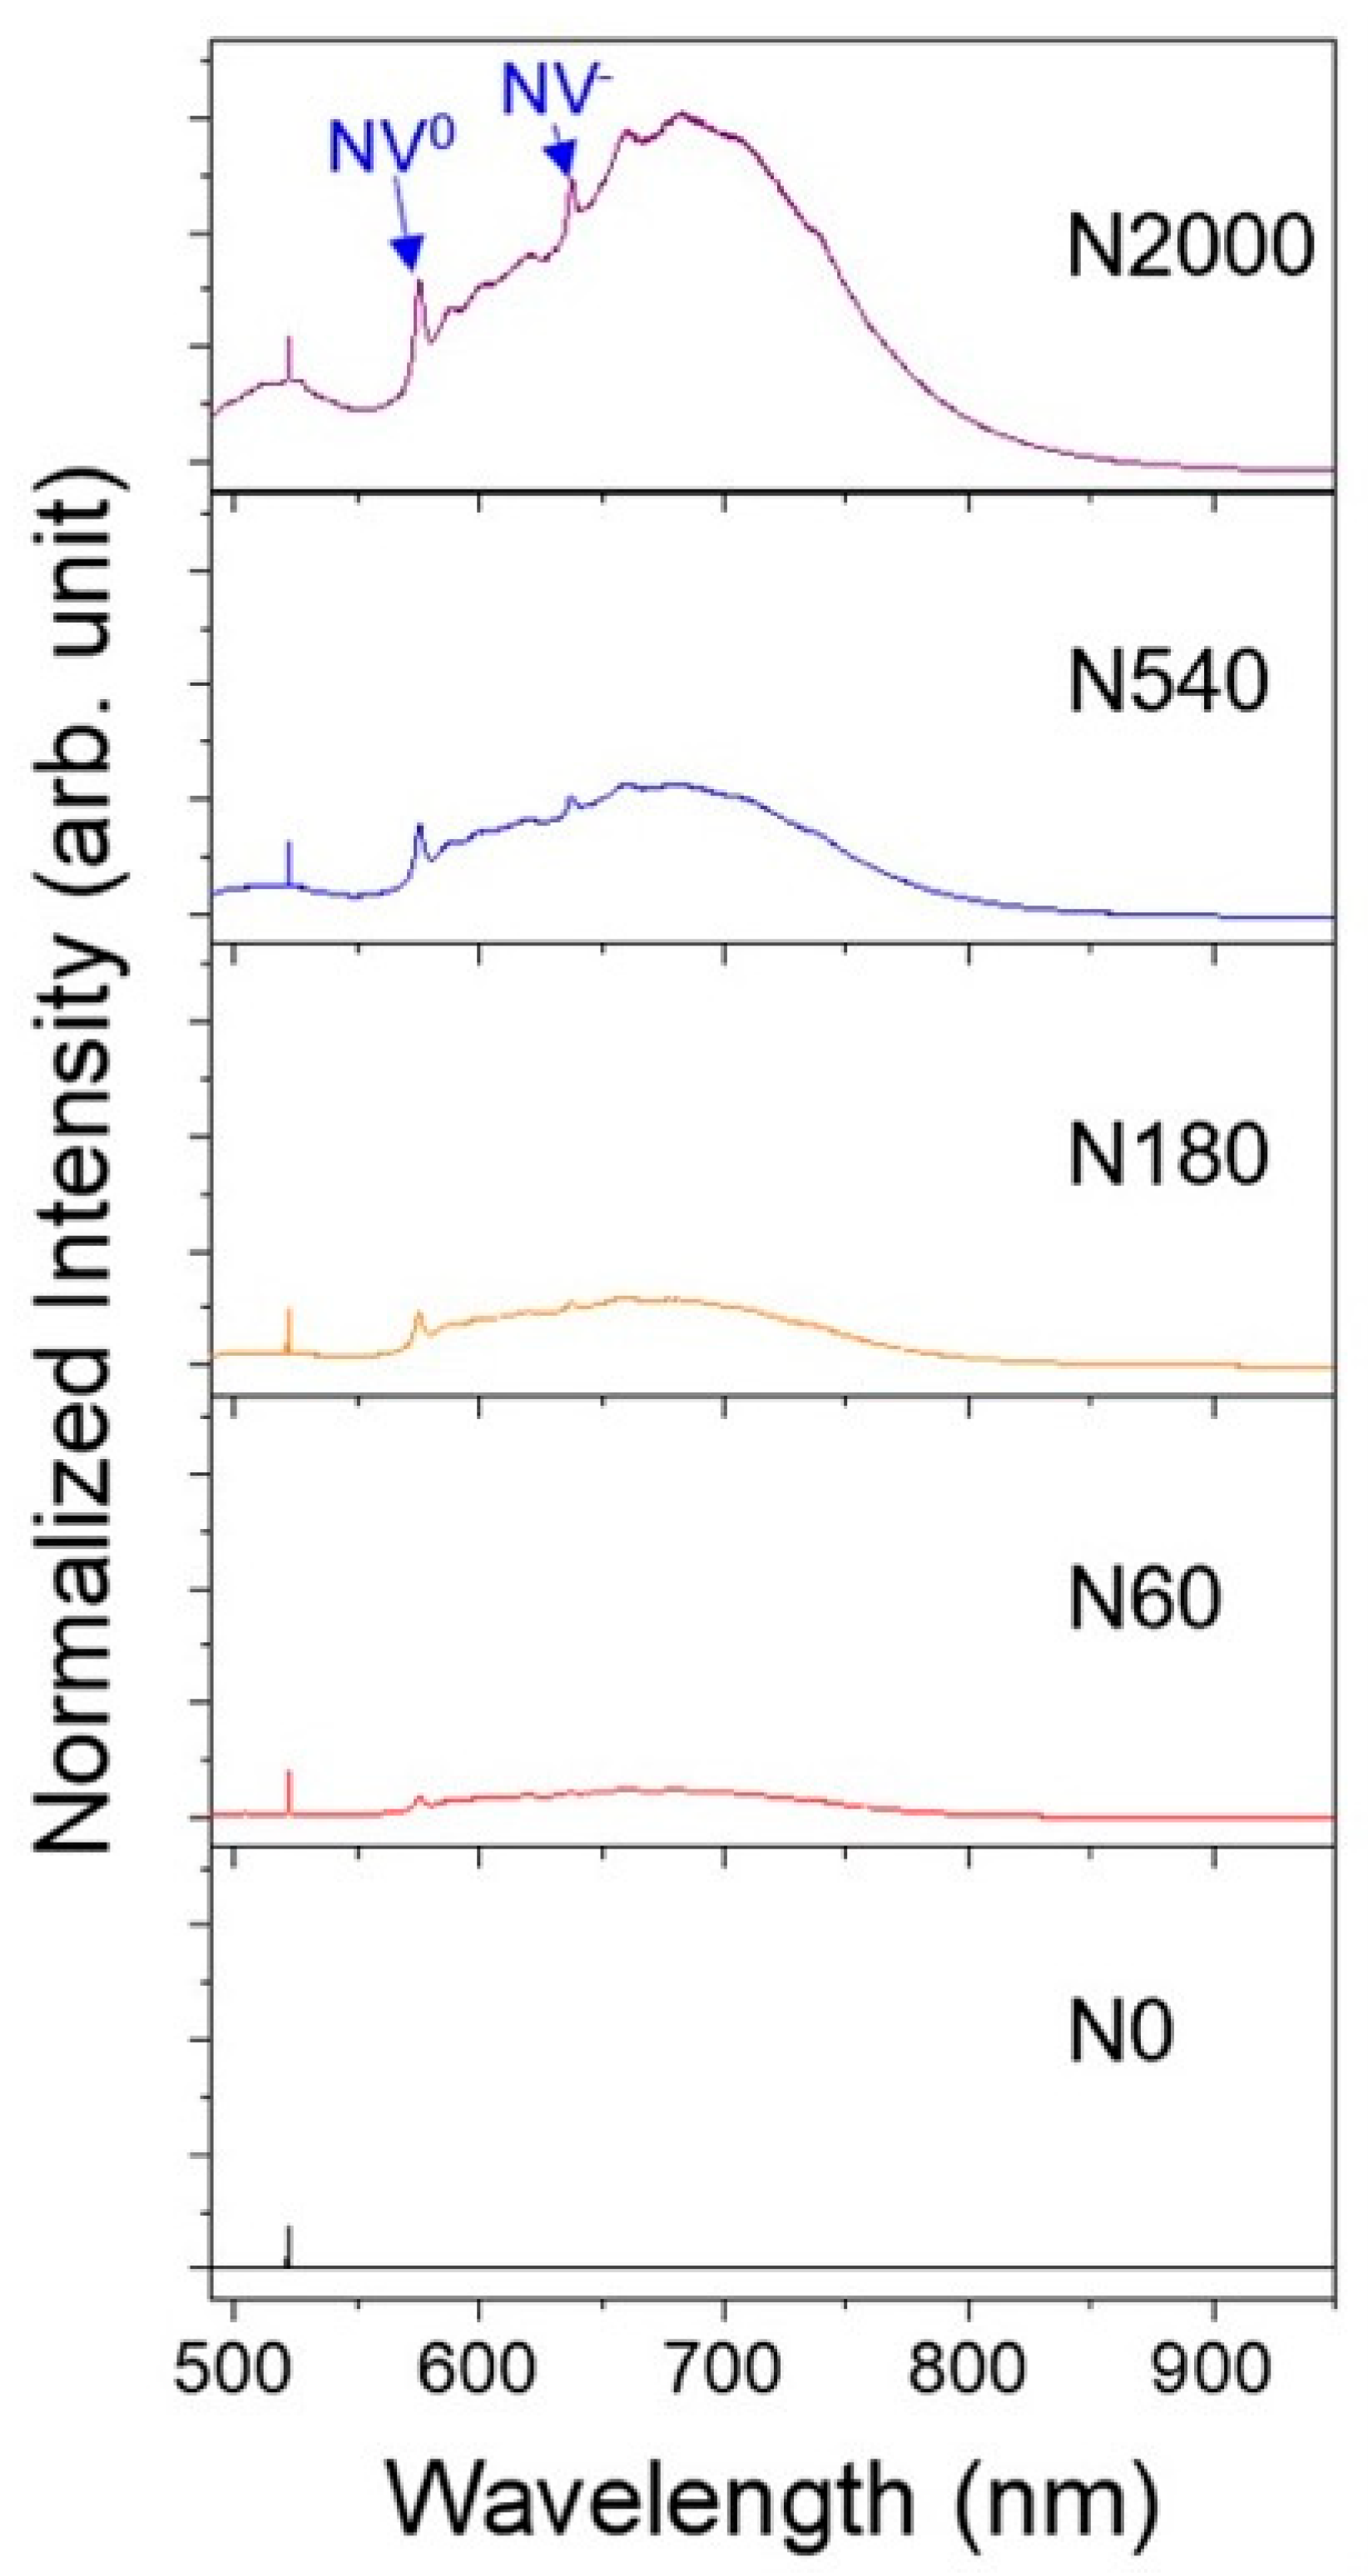
Figure 8 presents the PL spectra of the as-grown diamonds measured at the center of the top surface, in addition to the first-order Raman peak of the diamond at 521.9 nm, and prominent luminescence peaks at 575 and 637 nm, corresponding to the neutral (NV0) and negatively charged (NV) nitrogen-vacancy centers, respectively [32,33]. The increase in both the NV0 and NV intensities relative to the diamond Raman peak with nitrogen addition suggests enhanced incorporation of nitrogen atoms into the lattice. These results confirm that nitrogen incorporation during MPCVD growth contributes to the formation of luminescent centers in the diamond lattice. However, the broadening and increase in these signals in the higher nitrogen conditions may also suggest a rise in defect-related non-radiative recombination paths, possibly degrading the optical quality of the crystal [33]. In addition, it was also found that the expanded regions contained a lower nitrogen concentration than the central region for N180 based on the observations of the NV peak intensity relative to the Raman one (INV/ID), which showed a ratio of roughly about 1:1.5. Specifically, the measured intensity ratios were 4.1 at 0.1 mm, 4.3 at 0.3 mm, 4.0 at 0.5 mm, 5.7 at 2.0 mm, and 6.4 at 3.5 mm from the edge, showing lower NV-related emission in the expanded regions. As the plasma condition around the edges is known to be complicated and may differ from that at the center, the reason for the lower nitrogen concentration observed near the edge regions remains unclear and requires further investigation.

3.7. Etch Pit Density Analysis and Quality Enhancement

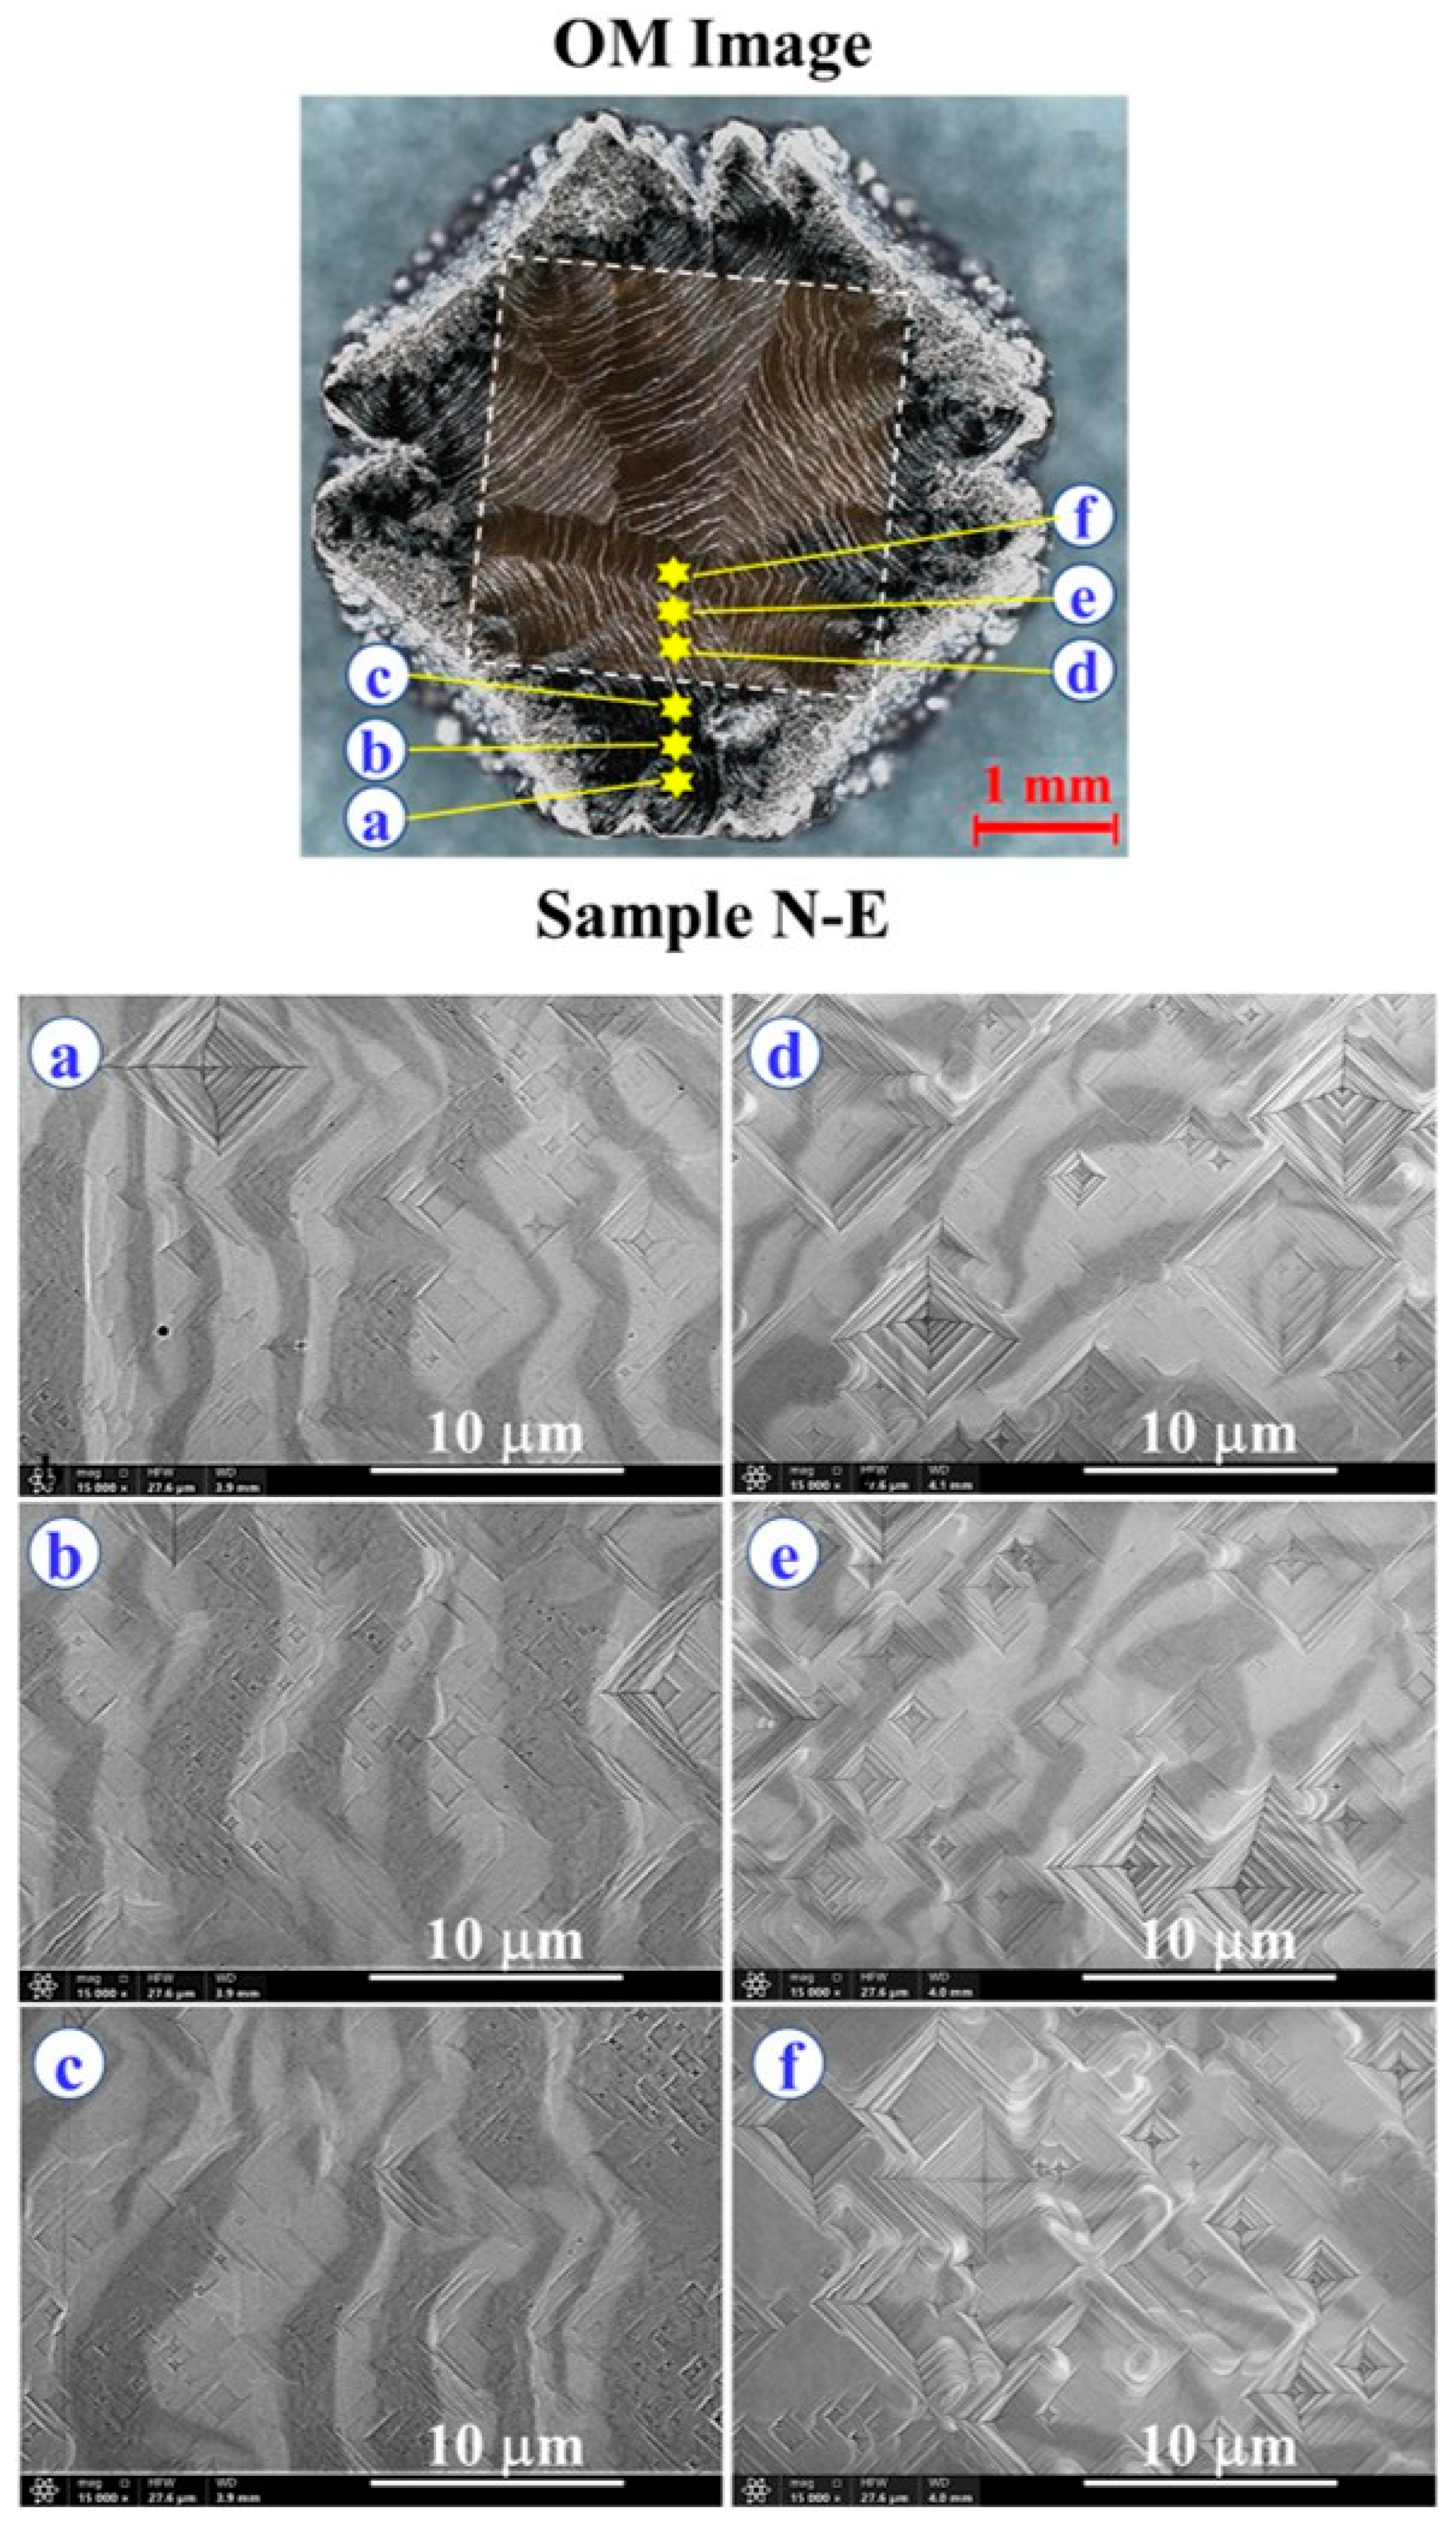
To understand the structural defects in the laterally grown diamond, we grew another sample (N-E) on a 3 × 3 × 0.5 mm3 CVD substrate for 25 h under the same plasma condition as N180. The OM examinations showed that both the vertical and lateral growth rates were almost the same as those of N180, and the surface area expanded to 16.9 mm2 after growth. The sample N-E was then further treated with H2/O2 plasma (4.0 kW, 100 Torr, 3% O2, and 0.25 h), especially for the evaluation of the etching pit density (EPD). As shown in Figure 9, SEM measurements were conducted from the expanded regions near the edge toward the center of the sample. EPD was measured at three different positions near the edge beyond the original substrate (sites a, b, and c), covering a total area exceeding 6000 µm2, and at three different positions around the center on top of the original substrate area (sites d, e, and f), covering a comparable total area. The averaged EPD for the edge region, corresponding to the laterally grown area, was ~6.7 × 104 cm−2, whereas the central region exhibited a higher average of ~6.0 × 105 cm−2 on top of the original substrate area. Notably, these density values were measured solely from etch pits showing the inverted pyramid (point-bottomed) shape, which can be indicative of dislocation-related defects [34,35,36]. The results indicate that the EPD in the central area was approximately 10 times higher than in the region around the edge, suggesting that dislocations originating from the substrate may propagate toward the growth surface as threading dislocations (TDs) and become exposed by H2/O2 plasma etching. However, no TDs are allowed to extend straight up to the laterally expanded regions unless they are bent toward the outside areas. Under high-rate lateral growth conditions with moderate nitrogen addition, the crystalline quality can be preserved or even improved, particularly in the edge regions. Moreover, flat-bottomed EPs with side lengths between 0.2 and 3 μm were also clearly observed. These features are likely attributable to polishing-induced damage on the substrate surface. The depth and spatial distribution of such flat-bottomed pits can be varied, depending on the specific polishing method and its degree of precision [34,35,36].
The present findings demonstrate that high-quality lateral growth can be achieved under rapid growth conditions with nitrogen assistance to enlarge the surface area, providing an effective single-step strategy for enlarging single-crystal diamond substrates. Moreover, the results highlight the effectiveness of appropriate nitrogen addition in enabling large-area, high-quality SCD fabrication, thereby advancing the development of diamond-based electronic and optical applications.

4. Conclusions

This study demonstrates that under nitrogen-incorporation high-rate growth conditions of 5600 W, 10% CH4, and 1.87 × 10⁴ Pa, a homoepitaxial (001) single-crystal diamond can achieve substantial lateral expansion, up to an area increase of about 1.6 times after 20 h of growth to a thickness of 0.95 mm, without compromising the crystalline quality. With the N2 concentration of 180 ppm, a lateral growth rate of 52.5 μm/h was attained, accompanied by uniform structural quality across the top surface as well as the grown side surface, as confirmed via Raman and AFM analyses, and the FWHM of 11 arcsec for (004) XRC. Etch-pit density measurements further revealed that the dislocation density in the laterally expanded regions was approximately one order of magnitude lower than that at the central region.

Author Contributions

Conceptualization, T.-I.Y.; Methodology, T.-I.Y.; Formal analysis, T.-I.Y. and C.-Y.C.; Investigation, T.-I.Y., C.-Y.C., W.-L.W., J.-B.H., and C.-J.K.; Resources, L.C.; Data curation, T.-I.Y. and C.-Y.C.; Writing—original draft preparation, T.-I.Y.; Writing—review and editing, L.C.; Supervision, L.C.; Funding acquisition, L.C. All authors have read and agreed to the published version of the manuscript.

Funding

This work was supported by NSTC, Taiwan (NSTC 113-2221-E-A49-013 and 114-2221-E-A49-098).

Institutional Review Board Statement

Not applicable.

Informed Consent Statement

Not applicable.

Data Availability Statement

The data that support the findings of this study are available on reasonable requests from the corresponding author, Tzu-I Yang.

Conflicts of Interest

The authors declare no conflicts of interest.

References

  1. Donato, N.; Rouger, N.; Pernot, J.; Longobardi, G.; Udrea, F. Diamond power devices: State of the art, modelling, figures of merit and future perspective. J. Phys. D Appl. Phys. 2019, 53, 093001. [Google Scholar] [CrossRef]
  2. Zulkharnay, R.; May, P.W. Applications of diamond films: A review. Funct. Diam. 2024, 4, 2410160. [Google Scholar] [CrossRef]
  3. Chang, X.; Gao, W.; An, J.; Chen, H.; Liu, Z.; Qi, Z.; Li, C.; Ding, J.; Li, W.; Wang, K. Optical-grade diamond: Characteristics, synthesis, and recent research progress. Funct. Diam. 2025, 5, 2476690. [Google Scholar] [CrossRef]
  4. Altukhov, A.; Afanas’ Ev, M.; Kvaskov, V.; Lyubchenko, V.; Mityagin, A.Y.; Murav’Ev, E.; Pomortsev, L.; Potapov, V.; Spitsyn, B. Application of diamond in high technology. Inorg. Mater. 2004, 40 (Suppl. S1), S50–S70. [Google Scholar] [CrossRef]
  5. Aharonovich, I.; Lee, J.C.; Magyar, A.; Buckley, B.B.; Yale, C.G.; Awschalom, D.D.; Hu, E. Homoepitaxial growth of single crystal diamond membranes for quantum information processing. Adv. Mater. 2012, 24, OP54–OP59. [Google Scholar] [CrossRef]
  6. Wan, N.H.; Lu, T.-J.; Chen, K.C.; Walsh, M.P.; Trusheim, M.E.; De Santis, L.; Bersin, E.A.; Harris, I.B.; Mouradian, S.L.; Christen, I.R. Large-scale integration of artificial atoms in hybrid photonic circuits. Nature 2020, 583, 226–231. [Google Scholar] [CrossRef]
  7. Kotomin, E.A.; Kuzovkov, V.N.; Lushchik, A.; Popov, A.I.; Shablonin, E.; Scherer, T.; Vasil’chenko, E. The Annealing Kinetics of Defects in CVD Diamond Irradiated by Xe Ions. Crystals 2024, 14, 546. [Google Scholar] [CrossRef]
  8. Luo, H.; Ajmal, K.M.; Liu, W.; Yamamura, K.; Deng, H. Polishing and planarization of single crystal diamonds: State-of-the-art and perspectives. Int. J. Extrem. Manuf. 2021, 3, 022003. [Google Scholar] [CrossRef]
  9. Schuelke, T.; Grotjohn, T.A. Diamond polishing. Diam. Relat. Mater. 2013, 32, 17–26. [Google Scholar] [CrossRef]
  10. Nebel, C.E. CVD diamond: A review on options and reality. Funct. Diam. 2023, 3, 2201592. [Google Scholar] [CrossRef]
  11. Nad, S.; Gu, Y.; Asmussen, J. Growth strategies for large and high quality single crystal diamond substrates. Diam. Relat. Mater. 2015, 60, 26–34. [Google Scholar] [CrossRef]
  12. Nad, S.; Charris, A.; Asmussen, J. MPACVD growth of single crystalline diamond substrates with PCD rimless and expanding surfaces. Appl. Phys. Lett. 2016, 109, 162103. [Google Scholar] [CrossRef]
  13. Cao, W.; Ma, Z.; Gao, D.; Wu, J.; Zhang, T.; Zhang, H.; Zhao, H.; Fu, Q. The effects of self-assembling off-angles on the homoepitaxial lateral outward growth of single-crystal diamond. Vacuum 2023, 212, 111989. [Google Scholar] [CrossRef]
  14. Li, K.; Zhang, J.; Mo, P.; Chen, J.; Pan, X.; Chen, C. Optimizing single crystal diamond mosaic growth: A study on seed thickness variation and pre-growth treatment. J. Cryst. Growth 2025, 649, 127953. [Google Scholar] [CrossRef]
  15. Weng, J.; Liu, F.; Wang, Z.; Guo, N.; Fan, F.; Yang, Z.; Wang, J.; Wang, H.; Xiong, L.; Zhao, H. Investigation on the preparation of large area diamond films with 150–200 mm in diameter using 915 MHz MPCVD system. Vacuum 2023, 217, 112543. [Google Scholar] [CrossRef]
  16. Shao, J.; Cao, B.; Wu, X.; Sun, G.; Zhao, J.; Xu, S. The 4-inch free-standing diamond film prepared by MPCVD at 10 kW. Funct. Diam. 2024, 4, 2356570. [Google Scholar] [CrossRef]
  17. Schreck, M.; Asmussen, J.; Shikata, S.; Arnault, J.-C.; Fujimori, N. Large-area high-quality single crystal diamond. MRS Bull. 2014, 39, 504–510. [Google Scholar] [CrossRef]
  18. Teraji, T. Chemical vapor deposition of homoepitaxial diamond films. Phys. Status Solidi (A) 2006, 203, 3324–3357. [Google Scholar] [CrossRef]
  19. Feng, M.; Jin, P.; Meng, X.; Xu, P.; Wu, J.; Wang, Z. One-step growth of a nearly 2 mm thick CVD single crystal diamond with an enlarged surface by optimizing the substrate holder structure. J. Cryst. Growth 2023, 603, 127011. [Google Scholar] [CrossRef]
  20. Tallaire, A.; Brinza, O.; Mille, V.; William, L.; Achard, J. Reduction of dislocations in single crystal diamond by lateral growth over a macroscopic hole. Adv. Mater. 2017, 29. [Google Scholar] [CrossRef]
  21. Zhao, J.; Yang, Y.; Weng, C.; Zhu, W.; Lou, L.; Wang, G. The quality of epitaxial lateral overgrown diamond on substrate with laser-cut holes of varying shapes and side orientations. Diam. Relat. Mater. 2024, 148, 111488. [Google Scholar] [CrossRef]
  22. Mehmel, L.; Issaoui, R.; Brinza, O.; Tallaire, A.; Mille, V.; Delchevalrie, J.; Saada, S.; Arnault, J.-C.; Bénédic, F.; Achard, J. Dislocation density reduction using overgrowth on hole arrays made in heteroepitaxial diamond substrates. Appl. Phys. Lett. 2021, 118, 061901. [Google Scholar] [CrossRef]
  23. Li, D.; Lv, X.; Wang, Q.; Wu, X.; Sun, G.; Xu, S.; Han, S.; Li, L.; Zou, G. Epitaxial lateral overgrowth of single crystalline diamond with different periodic trench geometries fabricated by laser cutting. Appl. Surf. Sci. 2025, 702, 163361. [Google Scholar] [CrossRef]
  24. Yan, C.-s.; Vohra, Y.K.; Mao, H.-k.; Hemley, R.J. Very high growth rate chemical vapor deposition of single-crystal diamond. Proc. Natl. Acad. Sci. USA 2002, 99, 12523–12525. [Google Scholar] [CrossRef]
  25. Liang, Q.; Chin, C.Y.; Lai, J.; Yan, C.-s.; Meng, Y.; Mao, H.-k.; Hemley, R.J. Enhanced growth of high quality single crystal diamond by microwave plasma assisted chemical vapor deposition at high gas pressures. Appl. Phys. Lett. 2009, 94, 24103. [Google Scholar] [CrossRef]
  26. Cao, W.; Ma, Z.; Zhao, H.; Gao, D.; Fu, Q. The lateral outward growth of single-crystal diamonds by two different structures of microwave plasma reactor. CrystEngComm 2022, 24, 1010–1016. [Google Scholar] [CrossRef]
  27. Achard, J.; Silva, F.; Tallaire, A.; Bonnin, X.; Lombardi, G.; Hassouni, K.; Gicquel, A. High quality MPACVD diamond single crystal growth: High microwave power density regime. J. Phys. D Appl. Phys. 2007, 40, 6175. [Google Scholar] [CrossRef]
  28. Wang, X.; Duan, P.; Cao, Z.; Liu, C.; Wang, D.; Peng, Y.; Hu, X. Homoepitaxy growth of single crystal diamond under 300 torr pressure in the MPCVD system. Materials 2019, 12, 3953. [Google Scholar] [CrossRef] [PubMed]
  29. Chayahara, A.; Mokuno, Y.; Horino, Y.; Takasu, Y.; Kato, H.; Yoshikawa, H.; Fujimori, N. The effect of nitrogen addition during high-rate homoepitaxial growth of diamond by microwave plasma CVD. Diam. Relat. Mater. 2004, 13, 1954–1958. [Google Scholar] [CrossRef]
  30. Achard, J.; Silva, F.; Brinza, O.; Tallaire, A.; Gicquel, A. Coupled effect of nitrogen addition and surface temperature on the morphology and the kinetics of thick CVD diamond single crystals. Diam. Relat. Mater. 2007, 16, 685–689. [Google Scholar] [CrossRef]
  31. Cao, W.; Gao, D.; Zhao, H.; Ma, Z. Epitaxial lateral growth of single-crystal diamond under high pressure by a plate-to-plate MPCVD. Funct. Diamond 2022, 1, 143–149. [Google Scholar] [CrossRef]
  32. Zaitsev, A.; Moe, K.; Wang, W. Optical centers and their depth distribution in electron irradiated CVD diamond. Diam. Relat. Mater. 2017, 71, 38–52. [Google Scholar] [CrossRef]
  33. Ashfold, M.N.; Goss, J.P.; Green, B.L.; May, P.W.; Newton, M.E.; Peaker, C.V. Nitrogen in diamond. Chem. Rev. 2020, 120, 5745–5794. [Google Scholar] [CrossRef]
  34. Tsubouchi, N.; Mokuno, Y.; Shikata, S. Characterizations of etch pits formed on single crystal diamond surface using oxygen/hydrogen plasma surface treatment. Diam. Relat. Mater. 2016, 63, 43–46. [Google Scholar] [CrossRef]
  35. Shimaoka, T.; Ichikawa, K.; Koizumi, S.; Watanabe, K.; Teraji, T. Detection of defects in diamond by etch-pit formation. Phys. Status Solidi (A) 2019, 216, 1900247. [Google Scholar] [CrossRef]
  36. Achard, J.; Silva, F.; Brinza, O.; Bonnin, X.; Mille, V.; Issaoui, R.; Kasu, M.; Gicquel, A. Identification of etch-pit crystallographic faces induced on diamond surface by H2/O2 etching plasma treatment. Phys. Status Solidi (A) 2009, 206, 1949–1954. [Google Scholar] [CrossRef]
Figure 1. (a) OM images of samples N0, N60, N180, N540, and N2000 and (b) magnified images of the outer edge regions as shown with red circles in (a). The white box in N180 indicates the position of the initial substrate area, and the yellow circles in (b) mark the starting points of the Raman measurements.
Coatings 15 01256 g001
Figure 2. Pictures of the N180 sample captured at different times during continuous growth.
Coatings 15 01256 g002
Figure 3. Variations of (a) GR[100] and GR[001] and (b) the top surface area of the SCD as functions of nitrogen concentration after MPCVD growth. The green arrow marks the original CVD substrate area (~30.25 mm2) as the reference for calculating the relative increase in surface area. Note that the growth duration for the N540 sample was 15 h, while all others were grown for 20 h.
Coatings 15 01256 g003
Figure 4. OM and AFM images showing (a) the top surface and (b) the laterally grown side face morphologies of the N180. The scan area was 10.0 × 10.0 μm2.
Coatings 15 01256 g004
Figure 5. (a) Raman spectra measured at the center of N0, N60, N180, N540, and N2000, respectively. Spatial variation of (b) Raman shift and (c) FWHM for N0, N60, N180, N540, and N2000 measured along the distance x from the edge toward the center on the top surface.
Coatings 15 01256 g005
Figure 6. Variation in the Raman shift and FWHM taken from different height positions (h) on the laterally grown side face of N180, measured downward along [00 1 ¯ ].
Coatings 15 01256 g006
Figure 7. (a) 2θ-ω XRD patterns of N180, with the inset showing the enlarged (004) reflection in the 2θ range of 119.3–119.7°. (b,c) XRC measurements of the 0.5 mm-thick CVD diamond laser cut from the N-X sample and substrate for the (004) and (113) reflections, respectively.
Coatings 15 01256 g007
Figure 8. PL spectra acquired from the central regions of the N0, N60, N180, N540, and N2000 samples.
Coatings 15 01256 g008
Figure 9. SEM image of the sample (N-E) after 0.25 h of H2/O2 plasma treatment, with EPD analysis at positions (af) from the edge to center. OM image of the as-grown diamond surface for sample N-E. The white box indicates the initial substrate area.
Coatings 15 01256 g009
Disclaimer/Publisher’s Note: The statements, opinions and data contained in all publications are solely those of the individual author(s) and contributor(s) and not of MDPI and/or the editor(s). MDPI and/or the editor(s) disclaim responsibility for any injury to people or property resulting from any ideas, methods, instructions or products referred to in the content.