Article

A Vision-Based Approach for Precise Wear Evaluation of Abrasive Belts with Irregular Morphology in Flexible Grinding

School of Mechanical and Precision Instrumental Engineering, Xi’an University of Technology, Xi’an 710048, China
*
Author to whom correspondence should be addressed.
Coatings 2025, 15(11), 1257; https://doi.org/10.3390/coatings15111257
Submission received: 26 August 2025 / Revised: 3 October 2025 / Accepted: 9 October 2025 / Published: 31 October 2025

Abstract

Abrasive belt wear has an important impact on the dimensional accuracy and surface quality of parts. Accurate quantitative measurement of abrasive belt wear is an important basis for optimizing grinding process parameters, but also a very challenging task for abrasive belts with randomly distributed abrasive particles. In this paper, a quantitative method of determining wear state based on the life cycle surface images of the abrasive belt is proposed to evaluate its material removal ability in the grinding process. For blunted abrasive particles with extremely irregular shapes, TransUNet with a hybrid encoding of a CNN and transformer is adopted to obtain strong representation of complex features and high-precision segmentation boundaries. Three other U-net-based semantic segmentation networks are compared to prove the effectiveness of the trained TransUNet model. The number and area of blunted abrasive particles were calculated by connected domain and statistical methods. The proportion of worn abrasive particles and the wear area ratio when the service life of the abrasive belt is exhausted are about 74.29% and 3.06%, respectively.

1. Introduction

As the core basic component directly involved in energy conversion in aviation engines, gas turbines, and nuclear power units, the size accuracy and surface quality of blades have a direct impact on work efficiency and service performance [1]. Blades have certain difficult-to-machine characteristics in both material and structure [2,3]. Abrasive belt grinding, due to its flexible and cold grinding characteristics, has good cutting performance for difficult-to-machine materials such as high-temperature alloys [4]. It is widely used in precision grinding of precision components such as aircraft engine blades, gas turbines, and nuclear power units [5]. Abrasive belt grinding, as the final machining process, plays a decisive role in the dimensional accuracy of parts [6].
As coated grinding tools, the cutting edges of the belt are several small abrasive particles randomly distributed on the surface [7]. The abrasive particles are subjected to cutting reaction force at the interface with the workpiece, which inevitably leads to wear such as cracking, blunting, and falling off. Wear reduces the material removal ability of the sand belt [8], making it difficult to achieve the expected material removal depth and consistency in surface roughness and residual stress distribution [9]. When the degree of wear exceeds the limit of use, it will cause irreparable damage such as burns to the surface of the workpiece. Therefore, wear of the abrasive belt is one of the significant factors affecting machining accuracy and surface quality.
Mastering the wear status of abrasive belts is the key to achieving high dimensional accuracy and surface quality in abrasive belt grinding. In recent years, the online perception and measurement method of determining abrasive belt wear status by monitoring grinding signals has received widespread attention [10,11,12]. Its essence is to establish a mapping relationship between signal characteristics and the wear status of abrasive belts. By obtaining sound, force, and vibration signals during the grinding process, the abrasive belt wear status can be identified online, and can be fed back to the control system in real time to optimize the grinding parameters in order to achieve the expected grinding depth [13]. The relationship between wear state and grinding depth is the theoretical basis for process parameter optimization.
The characterization and quantitative interpretation of the wear degree of abrasive belts are the core basis for optimizing and adjusting the wear state and parameters. This is of great significance for a deeper understanding of the evolution law of sand belt wear and improving the quality of sand belt grinding.
However, there is no unified way to characterize the degree of abrasive belt wear currently. According to the measurement target, the methods can be divided into two categories: the direct way and the indirect way. In the indirect way, service time [14] and the material removal capacity coefficient [12] are two frequently used physical quantities that are affected by grinding parameters. In the direct way, the changes in belt weight [10] and height were detected using a precision electronic balance and stereomicroscope (Nikon SMZ18), respectively. Khellouki et al. [15] simplified the abrasive particles into cones, and the wear amount of the abrasive particles during time Δt is the decrease in cone height Δh. The weight and height changes in the abrasive belt, as well as their percentages, can directly reflect the wear degree, but they are not intuitive and cannot reflect the various wear forms and geometric shapes of abrasive particles. Hence, high-performance optical equipment was used to measure the geometrical parameters of the abrasive particles. Wang et al. [16] used surface roughness parameters to describe the reduction in abrasive grain height and the increases in abrasive grain tip radius and tip cone angle during abrasive belt wear. Mezghani et al. [17] define a set of parameters that describe the characteristics of alumina abrasive belts, including the density of effective abrasive particles, top blunted degree, chip space, and average effective indentation.
The material removal capacity of the abrasive belt depends on the geometric morphology of the abrasive particles, especially the wear area [18]. However, the abrasive particles have complex geometric morphology, and multiple wear forms coexist during the grinding process, including fracture, blunting, and falling off. The cross-sectional morphology of the fractured abrasive particles is extremely irregular. The number and proportion of wear particles in different wear stages dynamically change with service time [19]. Measurement of the micro-geometric morphology of abrasive particles using scanning electron microscopy is time-consuming, resulting in a smaller sampling range that hardly reflects the distribution characteristics of wear particles.
Another effective way to obtain the geometric morphology and distribution features of worn abrasive particles is using enlarged surface images of the abrasive belt using a microscope [20,21,22]. Wan et al. [23] used a deep learning algorithm to adaptively segment ROI regions of pyramid abrasive belts with uniform distribution and clear geometric features. The average area ratio and perimeter ratio of the wear area are used to intuitively characterize the temporal evolution of abrasive belt wear and quantitatively calculate various forms of wear such as continuity, non-uniformity, and adhesion through shape parameters. However, for alumina abrasive belts with randomly distributed abrasive particles, the automatic recognition and segmentation of irregular wear patterns, fractures, and detachment with unclear features remains a huge challenge.
To precisely quantify the worn morphology of the alumina abrasive belt, an image-based method is proposed to obtain the number and wear area of the blunted abrasive particles. Full life cycle wear experiments were conducted to collect surface images of the abrasive belt. The wear areas of abrasive grains were recognized and segmented at the pixel level. The number, the blunt area of worn abrasive particles, and their proportion in percentages were precisely calculated using a connected domain algorithm and statistics. Furthermore, the wear degree of the abrasive belt was analyzed based on the calculated morphological parameters of the abrasive particles to provide a better understanding of the wear mechanism of abrasive belts.

2. Experimental Procedure and Method

In order to collect surface images of abrasive belts throughout their entire life cycle, wear experiments were conducted using a self-developed gantry type three-axis linkage CNC machine tool, as shown in Figure 1. The same grinding parameters were used throughout the entire experiment. The abrasive belt was disassembled for surface image acquisition every 5 grinding passes until it was exhausted. The collected images were cropped and manually annotated, forming a dataset for the model training of the semantic segmentation algorithm. Based on the segmentation results, image processing methods were used to statistically analyze the area and quantity of wear particles, achieving quantitative characterization of the wear degree of the abrasive belt, which can be used as labels in online monitoring.
The grinding parameters are listed in Table 1. A 60 # abrasive belt is used with a width of 20 mm and length of 1440 mm. The abrasive particles are brown corundum fixed by electrostatic sand planting technology. The outer ring of the contact wheel is a rubber layer with a diameter of 60 mm, a thickness of 10 mm, and a hardness of 85 Shore A.
The workpiece material is GCr15 with a width of 41 mm. The surface hardness of the workpiece after quenching treatment is 58 HRC. The surface roughness of the workpiece before grinding is Ra 1.6 μm. Five traces can be ground on one surface of the workpiece, and the abrasive belt is disassembled every five traces for image acquisition. The usage time for each trace is 10.25 s with a feed rate of 4 mm/s. It is considered that the abrasive belt is exhausted when apparent burns appear on the surface of the workpiece.
An industrial microscope (AOSVI, ShenZhen, China) is used for surface image acquisition of abrasive belts, as shown in Figure 1, consisting of a CMOS camera, magnifier, light source, and monitor. A CMOS camera with 21 million pixels and a circular light source (AOSVI, ShenZhen, China), with a power of 4.5 W, is adopted. The image size is 4608 pixels × 3456 pixels. Five measurement points were marked on the abrasive belt, and 15 images were collected at three magnifications for each measurement point.

3. Wear Mechanism and Evaluation Method

3.1. Wear Mechanism and Typical Forms of Abrasive Grains

During the grinding process, the reaction of grinding force and heat exerted on the abrasive grains causes its fracture, blunting, or falling off from the binder, as shown in Figure 2, which are the three typical wear forms of the abrasive particles.
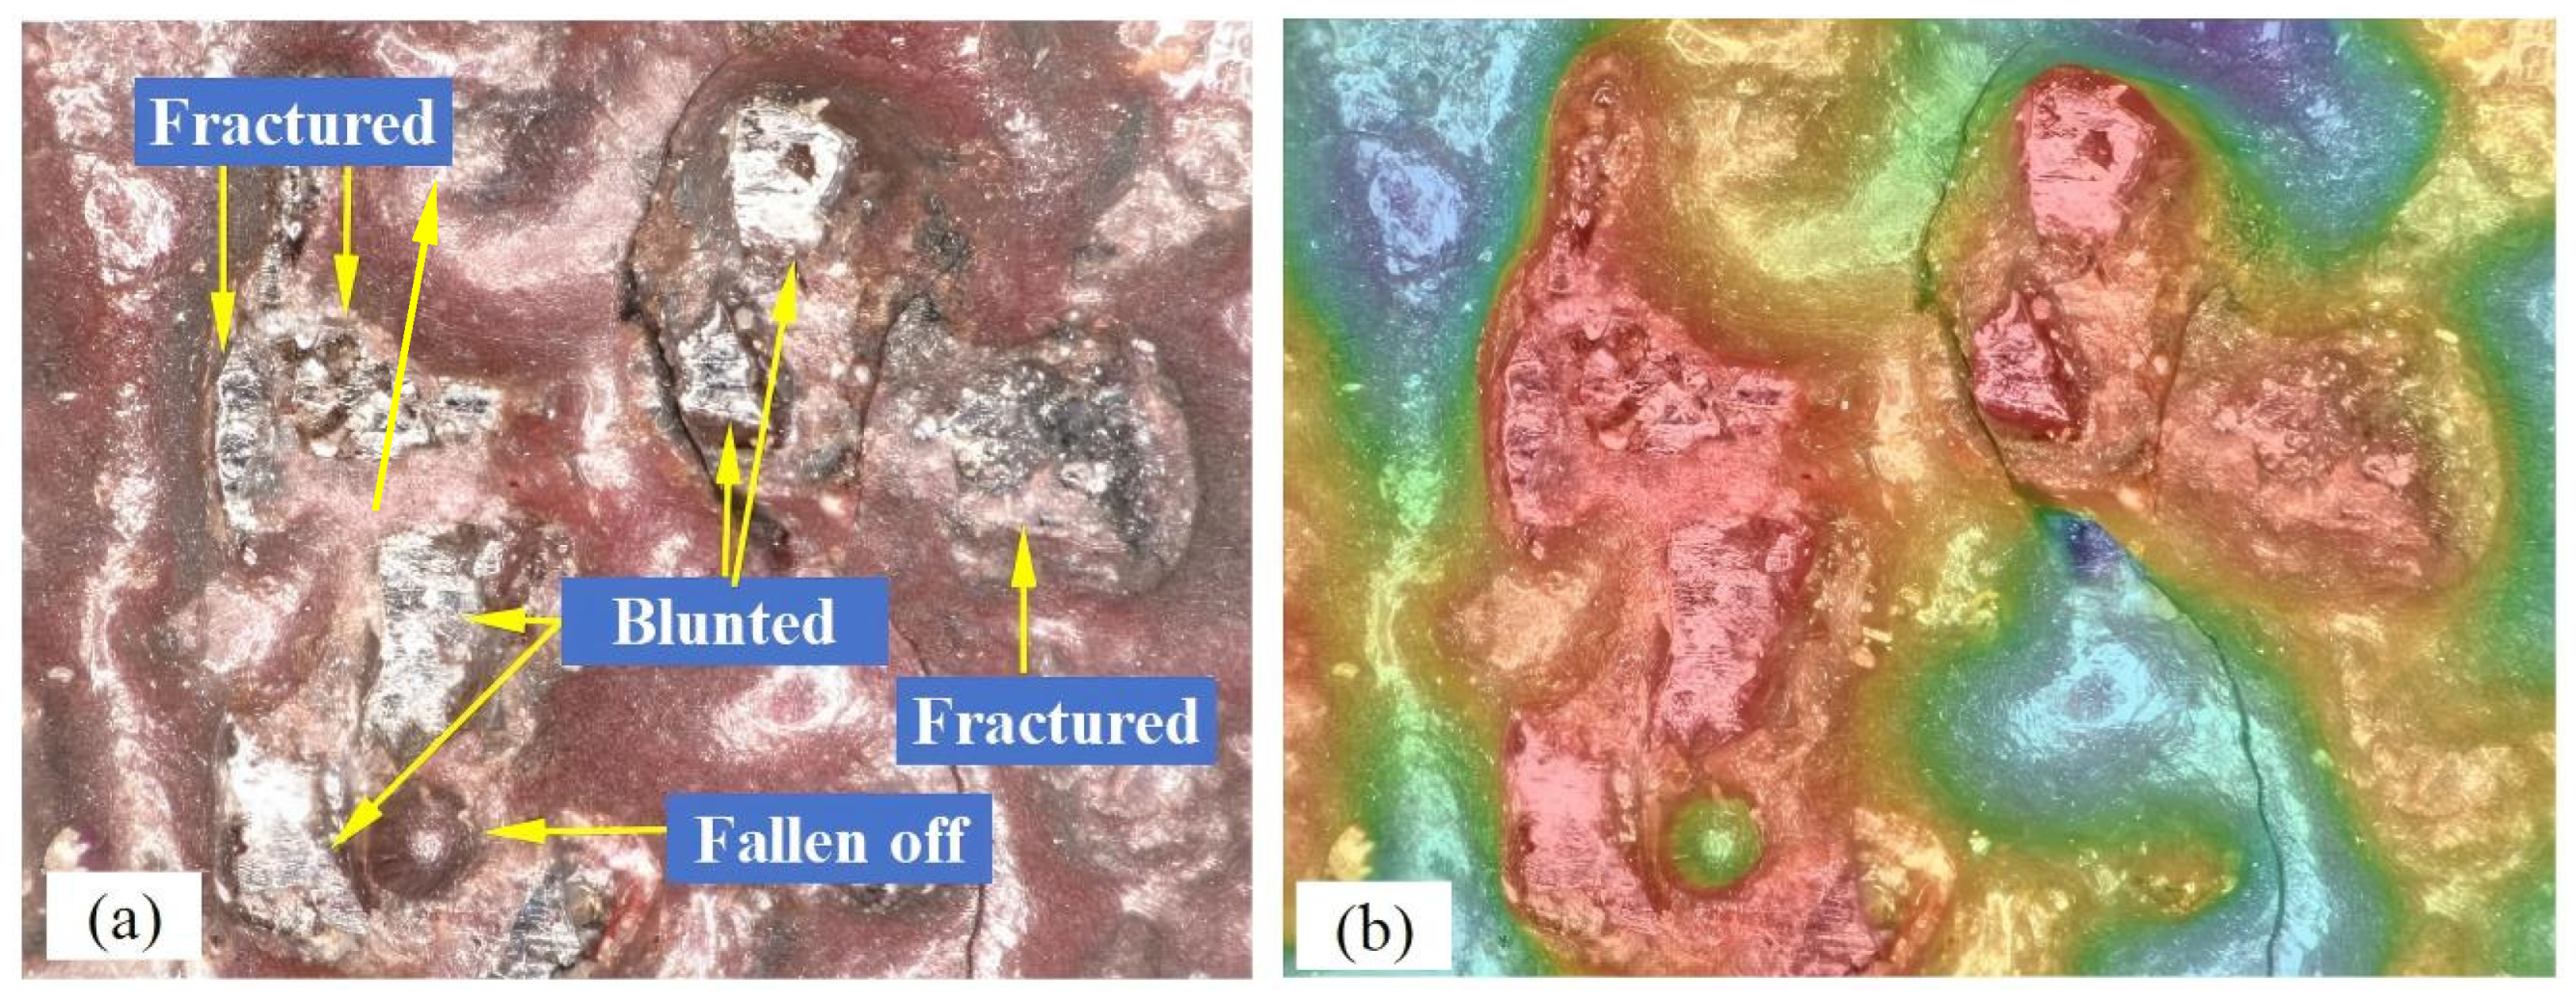
Figure 3 shows a local close-up of the worn abrasive belt, with the original image and the corresponding height distribution graph. The typical three wear forms are marked on the original image. It can be observed that the interface of the fractured abrasive particles is complex, with irregular reduced heights, colors, and shapes. Some of them show internal oxidized colors; others have turned black due to chip accumulation. The blunted abrasive grains have relatively flat surfaces, uniform height, a glossy appearance, and distinct colors. Fallen-out abrasives leave obvious pits on the base material.
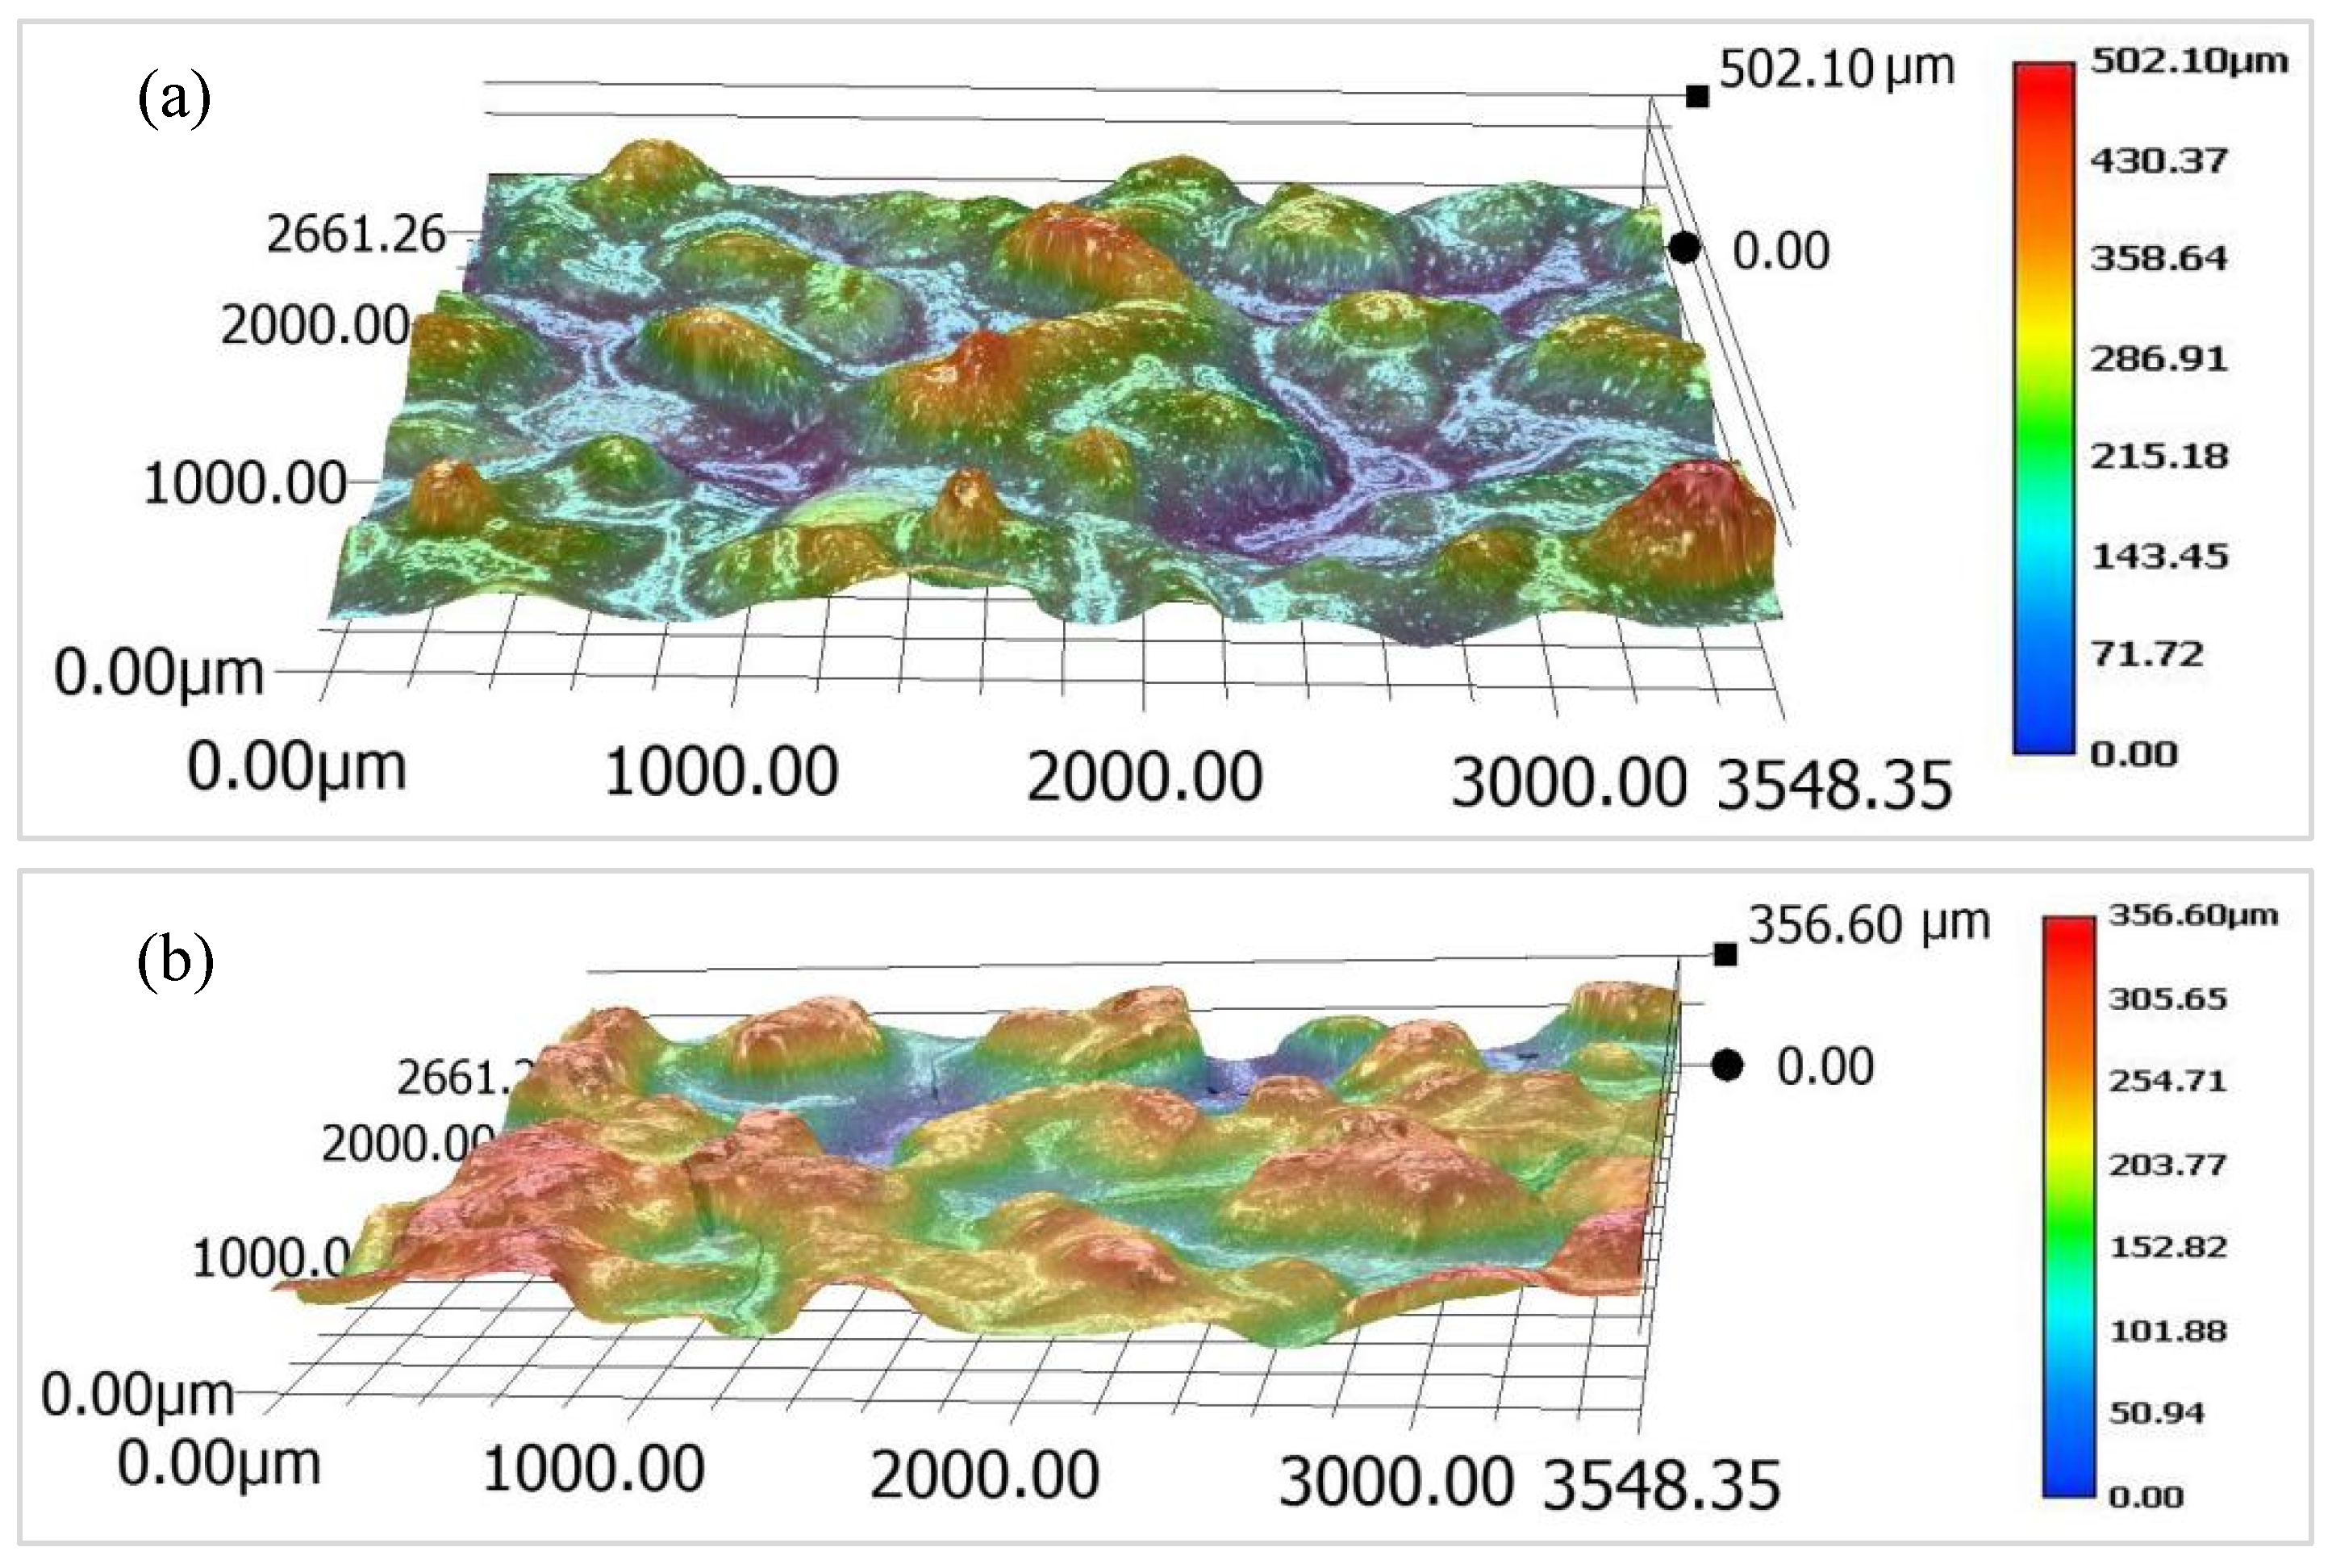
The abrasive particles are approximately conical in shape, but they are irregular with random heights and spatial distributions, as shown in Figure 4a. There is a significant height difference between the particles. After the abrasive particles are worn out, the height between the particles tends to be uniform, with an overall height reduction of about 150 μm. That is the fundamental reason for the greatly reduced cutting performance of the abrasive belt.

3.2. Evaluation Index of the Wear Degree of the Abrasive Belt

The actual number involved in cutting, the protrusion height, and the geometric morphology of the top surface of the abrasive particles determine the material removal ability of the abrasive belt. The fractured abrasive particles lose their cutting ability before participating in grinding again. The blunted abrasive particles are the ones that actually participate in the whole cutting life cycle. Therefore, the top area, the protrusion height, and the number of blunted abrasive particles are selected as the indices to evaluate the wear degree of the abrasive belt, which has a significant impact on the material removal rate and roughness of the ground surfaces.
In order to eliminate the influence of the sampling area, the percentage of the number of worn abrasive particles is calculated as follows:
γ f t = N f t N G × 100 %
where Nft is the number of the blunt abrasive particles in one image, and NG is the total number of the abrasive grains in the corresponding image that can be obtained by counting the peak of the 2D contour, as shown in Figure 5. The unit of the color scale is millimeters.
The service life of an abrasive belt depends on the performance of the abrasive cutting edge, which is mainly affected by the wear area of abrasive particles. The total area of the abrasive wear particles Sft_pixel is defined as the number of pixels in the segmented binary images. It is calculated as follows:
S f t _ p i x e l = i = 1 , j = 1 H , W P i , j = = 1
where H and W are the row and column in the image, respectively. Pi,j is the value of the pixels (i,j). Then the wear area in pixels is converted to actual area Sft_actual with a unit of mm. The conversion equation is expressed as
S s p _ a c t u a l = H m m × W m m H × W × M a g 2   / mm 2 / pixel
Therefore, the actual wear area can be calculated as
S f t _ a c t u a l = S f t S s p _ a c t u a l   / mm 2
Wear area ratio ηk is usually used to characterize the service life of the abrasive belt, which refers to the ratio of the abrasive wear area to the corresponding sampling area. When the wear area ratio reaches the critical value, the dominant activity between the abrasive particles and the workpiece interface is sliding and ploughing. It is considered that the abrasive belt has lost the ability of material removal, and needs to be replaced. Wear area ratio ηk is expressed as
η k = S f t _ a c t u a l S s a × 100
where Ssa is the sampling area with a unit of mm2.
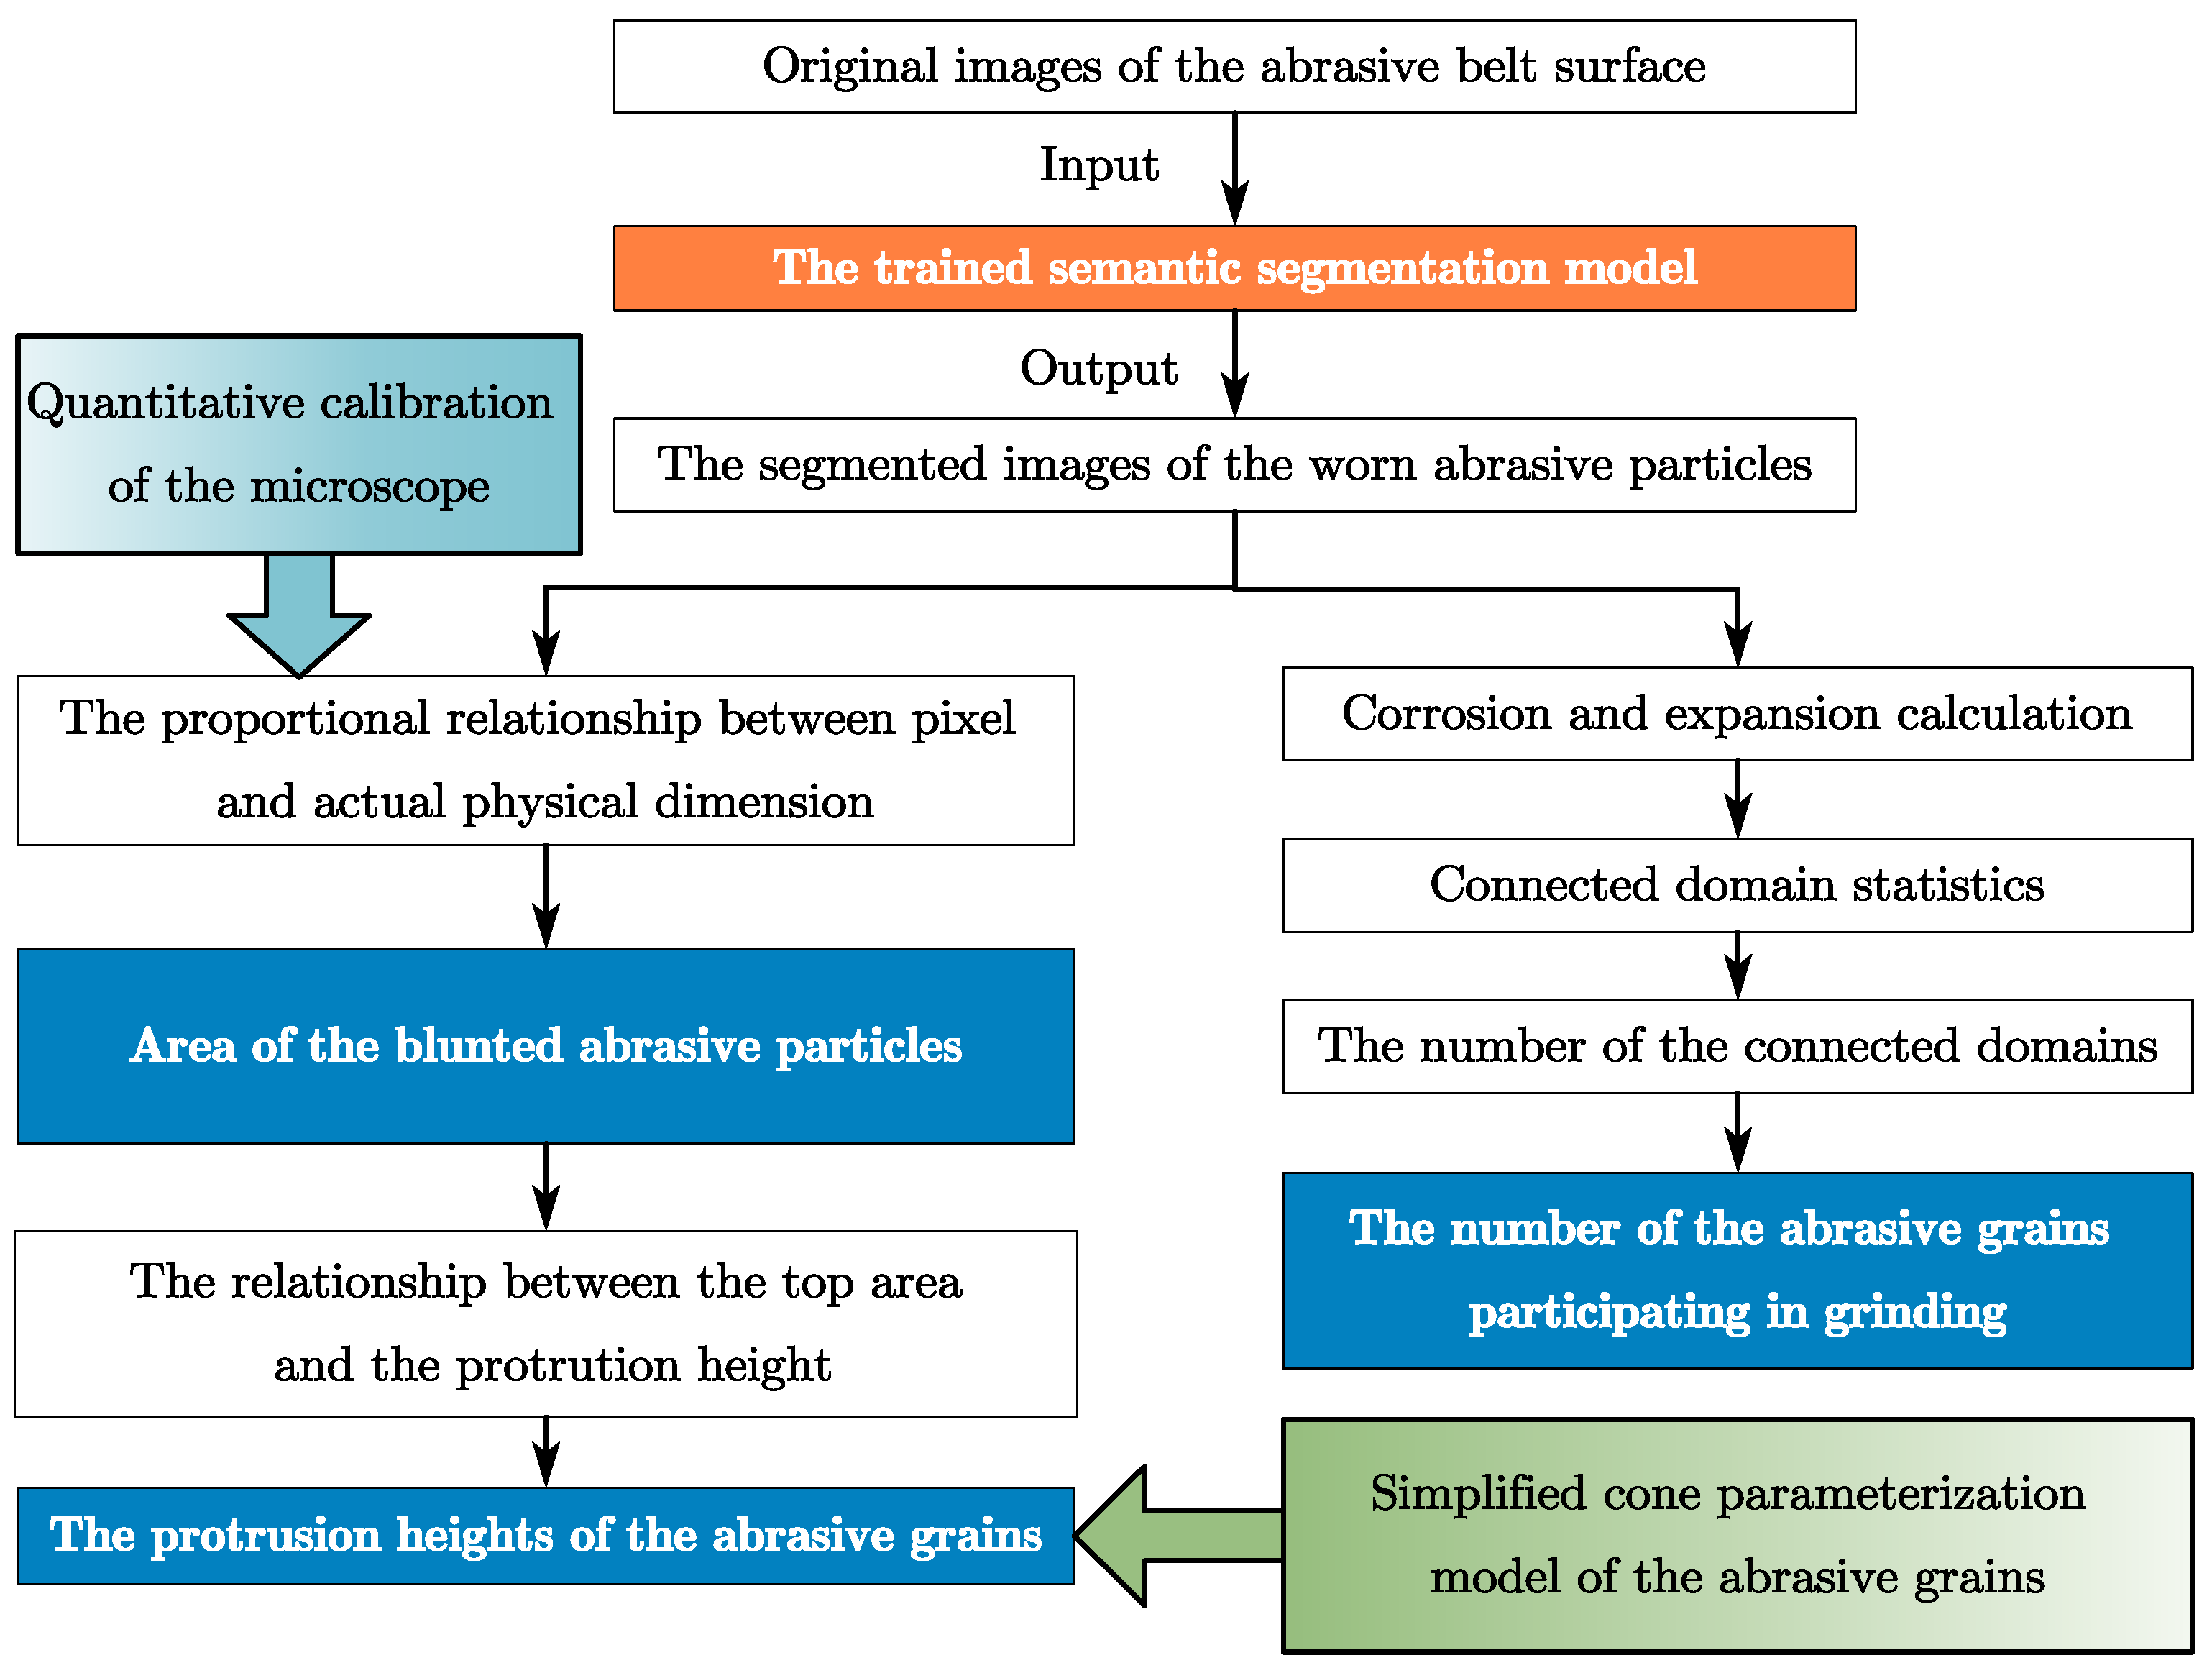
The evaluation indices of the wear degree of the abrasive belt can be calculated based on the segmented images of the abrasive wear particles according to the procedure shown in Figure 6. During the statistical analysis of the abrasive grain count, it is necessary to prevent small noise from being mistakenly counted as abrasive grains, enable the connection of multiple separated regions that belong to the same abrasive grain, and avoid the erroneous merging of adjacent independent abrasive grains. Corrosion and expansion are carried out on the segmented areas to merge multiple adjacent regions that originally belonged to one abrasive grain. Connected domain technology is adopted to statistically analyze the number of abrasive particles that participate in grinding and their top areas in pixels.
The actual dimensions are obtained by calibrating the microscope using a calibration ruler with a resolution of 0.01 mm and professional image measurement software (Image-Pro Plus 6.0 Trial Version), as shown in Figure 7. The calibration results are listed in Table 2. The top area and number of blunted abrasive particles are obtained based on the segmented images.

4. Semantic Segmentation Algorithms and Training Procedures

4.1. Image Preprocessing

Images are obtained under three magnifications to observe wear particles at different scales. A total of 750 images, with a size of 4608 × 3456 pixels, of the entire life cycle of the abrasive belt were collected in the experiment. The original pictures were manually cropped into 1024 × 1024 pixel images containing the region of interest, yielding 2937 in total. Notably, every cropped patch was labeled with the unique identifier of its original source image—an identifier linked to the grinding time. These 2937 samples were partitioned into the training set, validation set, and test set following a 6:2:2 ratio. Crucially, it was ensured that each dataset covered image data across different grinding times.
Then, the irregular wear areas were manually labeled using Labelme software (v5.0.1). The images were first labeled by two researchers. An automatic comparison tool was adopted to screen out samples with IoU < 0.75 to form an adjudicated set that needed to be relabeled again. Finally, we randomly selected 20% of the annotated data and calculated the mean Intersection over Union (mean IoU) between the annotators. The result was 0.89, indicating a high degree of overlap between the annotation regions of the two annotators and good consistency.

4.2. TransUNet Structure

U-Net and its variants are widely used in semantic segmentation via deep learning [24], which was proposed by Ronneberger et al. [25]. Their success lies in the combination of the depth feature extraction ability of convolutional neural networks (CNNs), the pixel-level segmentation ability of fully convolutional networks, and jump connection technology to enhance detail preservation [26]. The U-Net architecture consists of a contracting path to capture context and a symmetric expanding path that enables precise localization.
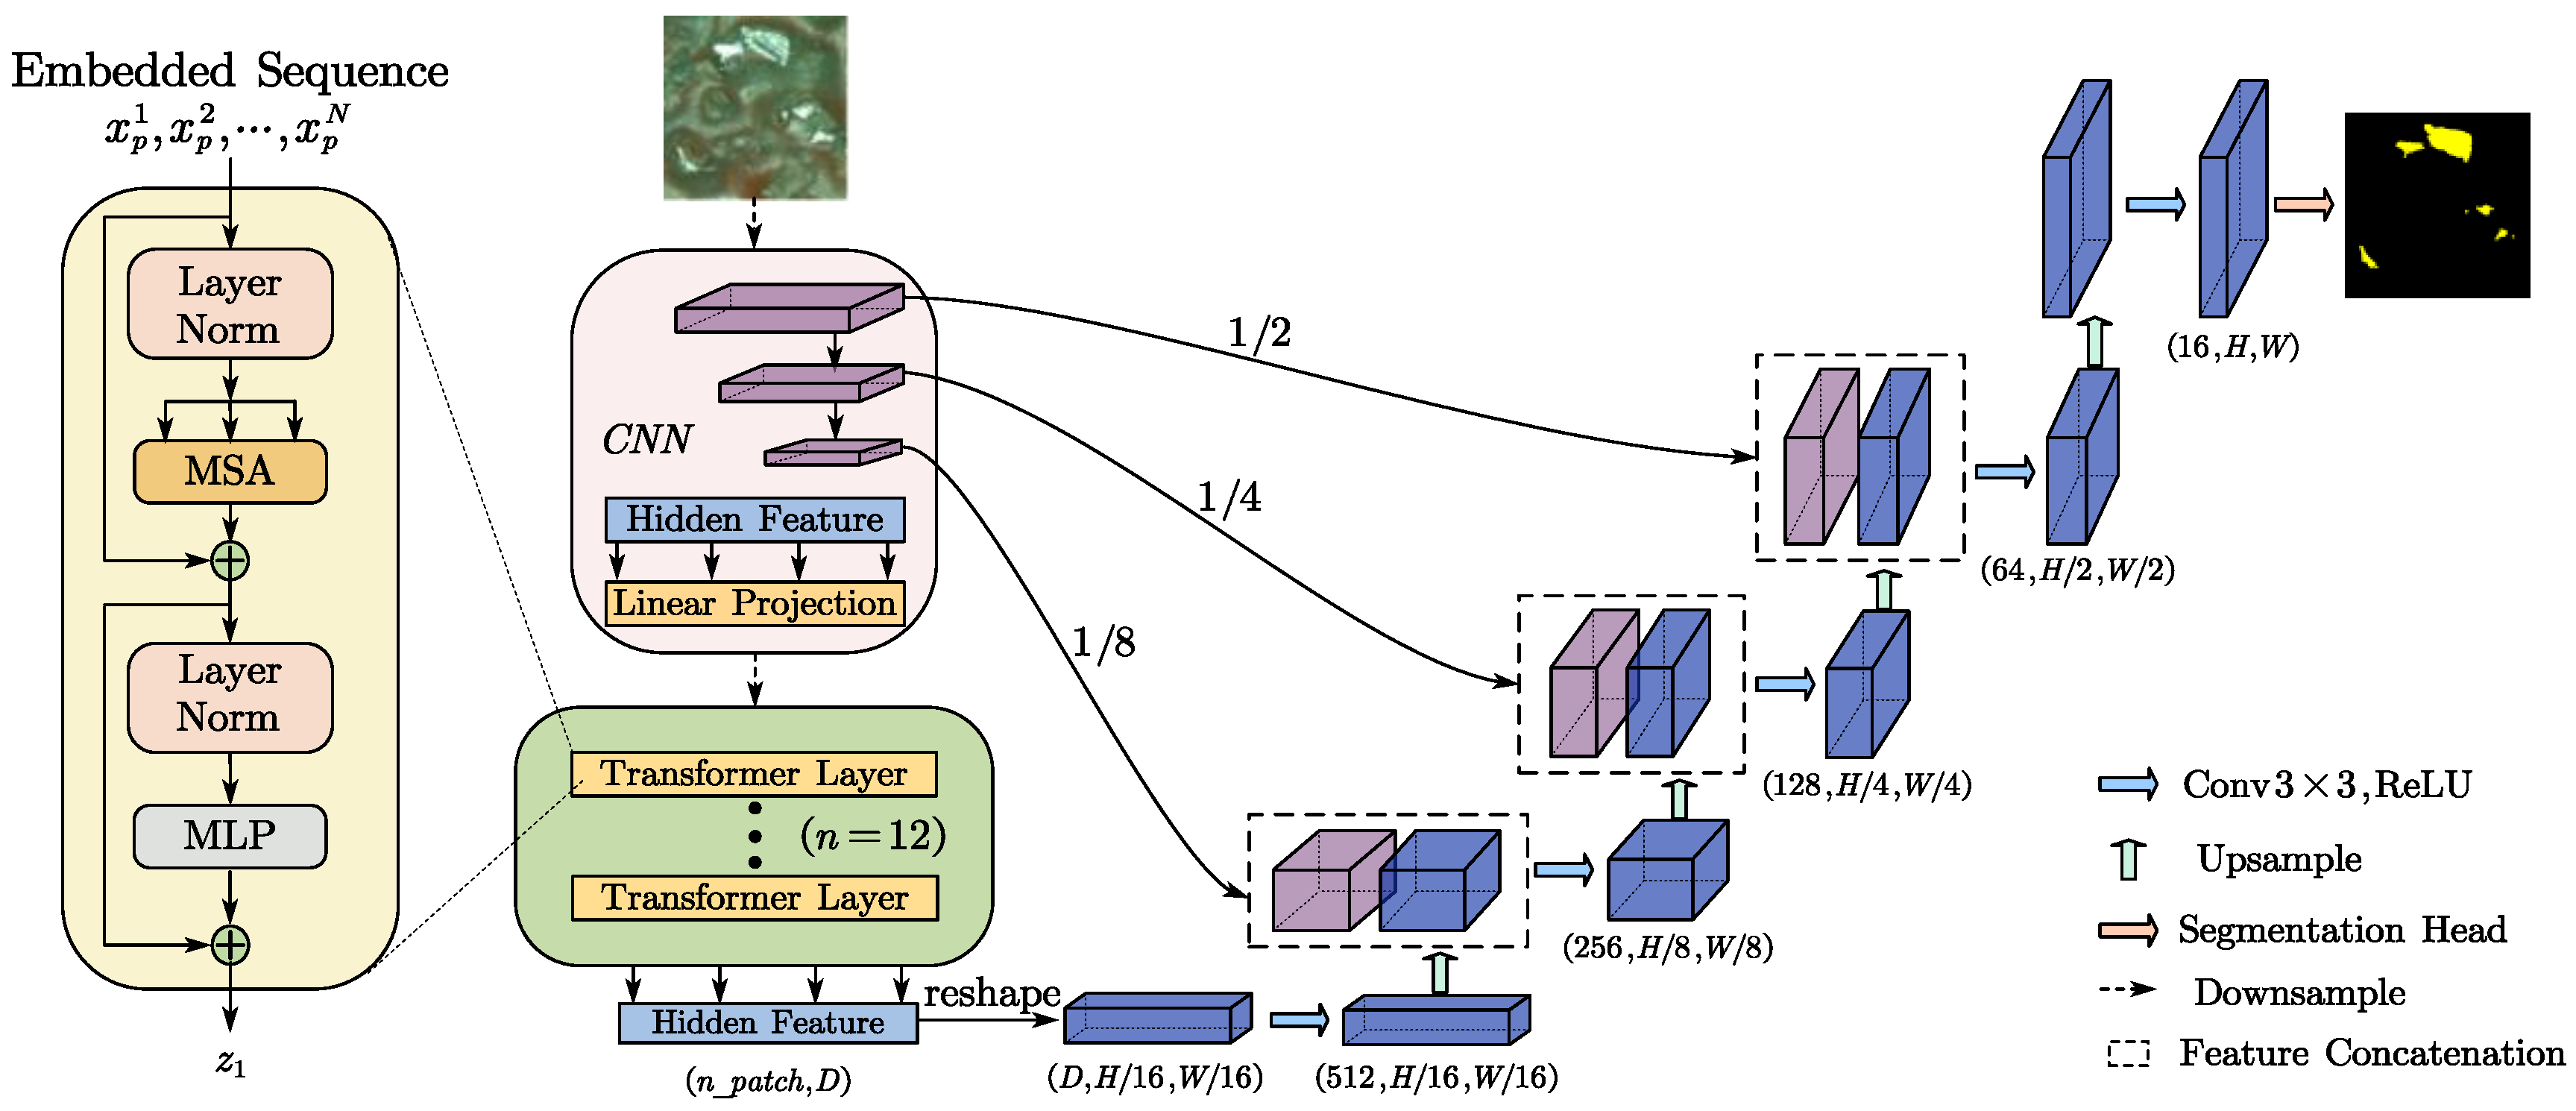
TransUNet is a semantic segmentation model with the transformer module embedded in the U-shaped architecture to extract global information from the image and enhance the semantic representation ability of the model to improve the modeling ability of the model for long-distance dependence [27]. The transformer module uses a self-attention mechanism to effectively capture the relevance between different positions in the input sequence, and promote the interaction and integration of global information. The structure of TransUNet is shown in Figure 8. The transformer encodes the labeled image blocks from the convolutional neural network (CNN) feature map into input sequences to extract the global context. On the other hand, the decoder upsamples the encoded features, and then combines them with the high-resolution CNN feature map to achieve accurate positioning.

4.3. Training Procedure

The networks are trained on a server with an NVIDIA RTX A4000 GPU. The other hardware parameters are listed in Table 3.
To compare the segmentation performance of the trained TransUNet model in this study, we also trained U-Net, SAM2-UNet, and Swin-UNet on the same dataset. The hyper-parameters of the four networks are listed in Table 3. In the training process of each network, the input image will be automatically reshaped to the default size shown in Table 4. The Epochs and Batch-sizes of different networks are set according to the training effect and the hardware requirements of the network.

4.4. Evaluation Index

In these experiments, we use recall, precision, and mean Intersection over Union (mIoU) as evaluation metrics to assess the performance of models in blunted abrasive particle segmentation tasks. These metrics can be expressed as follows:
P r e c i s i o n = T P T P + F P
R e c a l l = T P T P + F N
I o U = T P F N + F P + T P
m I o U = 1 N i = 1 N I o U i
where TP refers to correctly predicted positives, FP represents incorrectly predicted positives, FN indicates incorrectly predicted negatives, and TN indicates correctly predicted negatives.

5. Results and Discussion

5.1. Segmentation of Blunted Abrasive Particles

Figure 9 shows the original images, labels on the gray-scale images, and the segmented results obtained using different networks, including SAM2-UNet, TransUNet, Swin-UNet, and UNet. The original images are in RGB form with a size of 1024 × 1024 pixels. The segmented images are in RGB form too, and were obtained by taking pixel values from the original images using the predicted binary image as a mask.
Four samples are selected, representing three different kinds of blunted features of the abrasive particles, as shown in Figure 9. Sample 1 represents the common features of the image at the initial stage of wear; that is, the reflective area between abrasive particles has extremely similar characteristics to the abrasive wear area. The other three samples are images of the stable period, and the wear morphology of abrasive particles mainly displays two types of characteristics: those shown in yellow boxes and those of others. Their differences are shown in the labels. The blunted abrasive grains usually have several separated high-intensity characteristic wear areas. If these areas have clear boundaries, they are marked as separated areas. Otherwise, they are taken as a whole, like the ones in yellow boxes.
mIoU, precision, and recall are used to evaluate the generalization ability of the models. Table 5 and Figure 10 show the evaluation indices of different network models on four samples and test datasets, respectively. It can be seen from Table 5 and Figure 10 that the mIoU and precision of TransUNet are higher than those of other networks, indicating that TransUNet has high recognition ability for positive sample pixels. Recall indicates the percentage of all pixels with positive labels predicted.
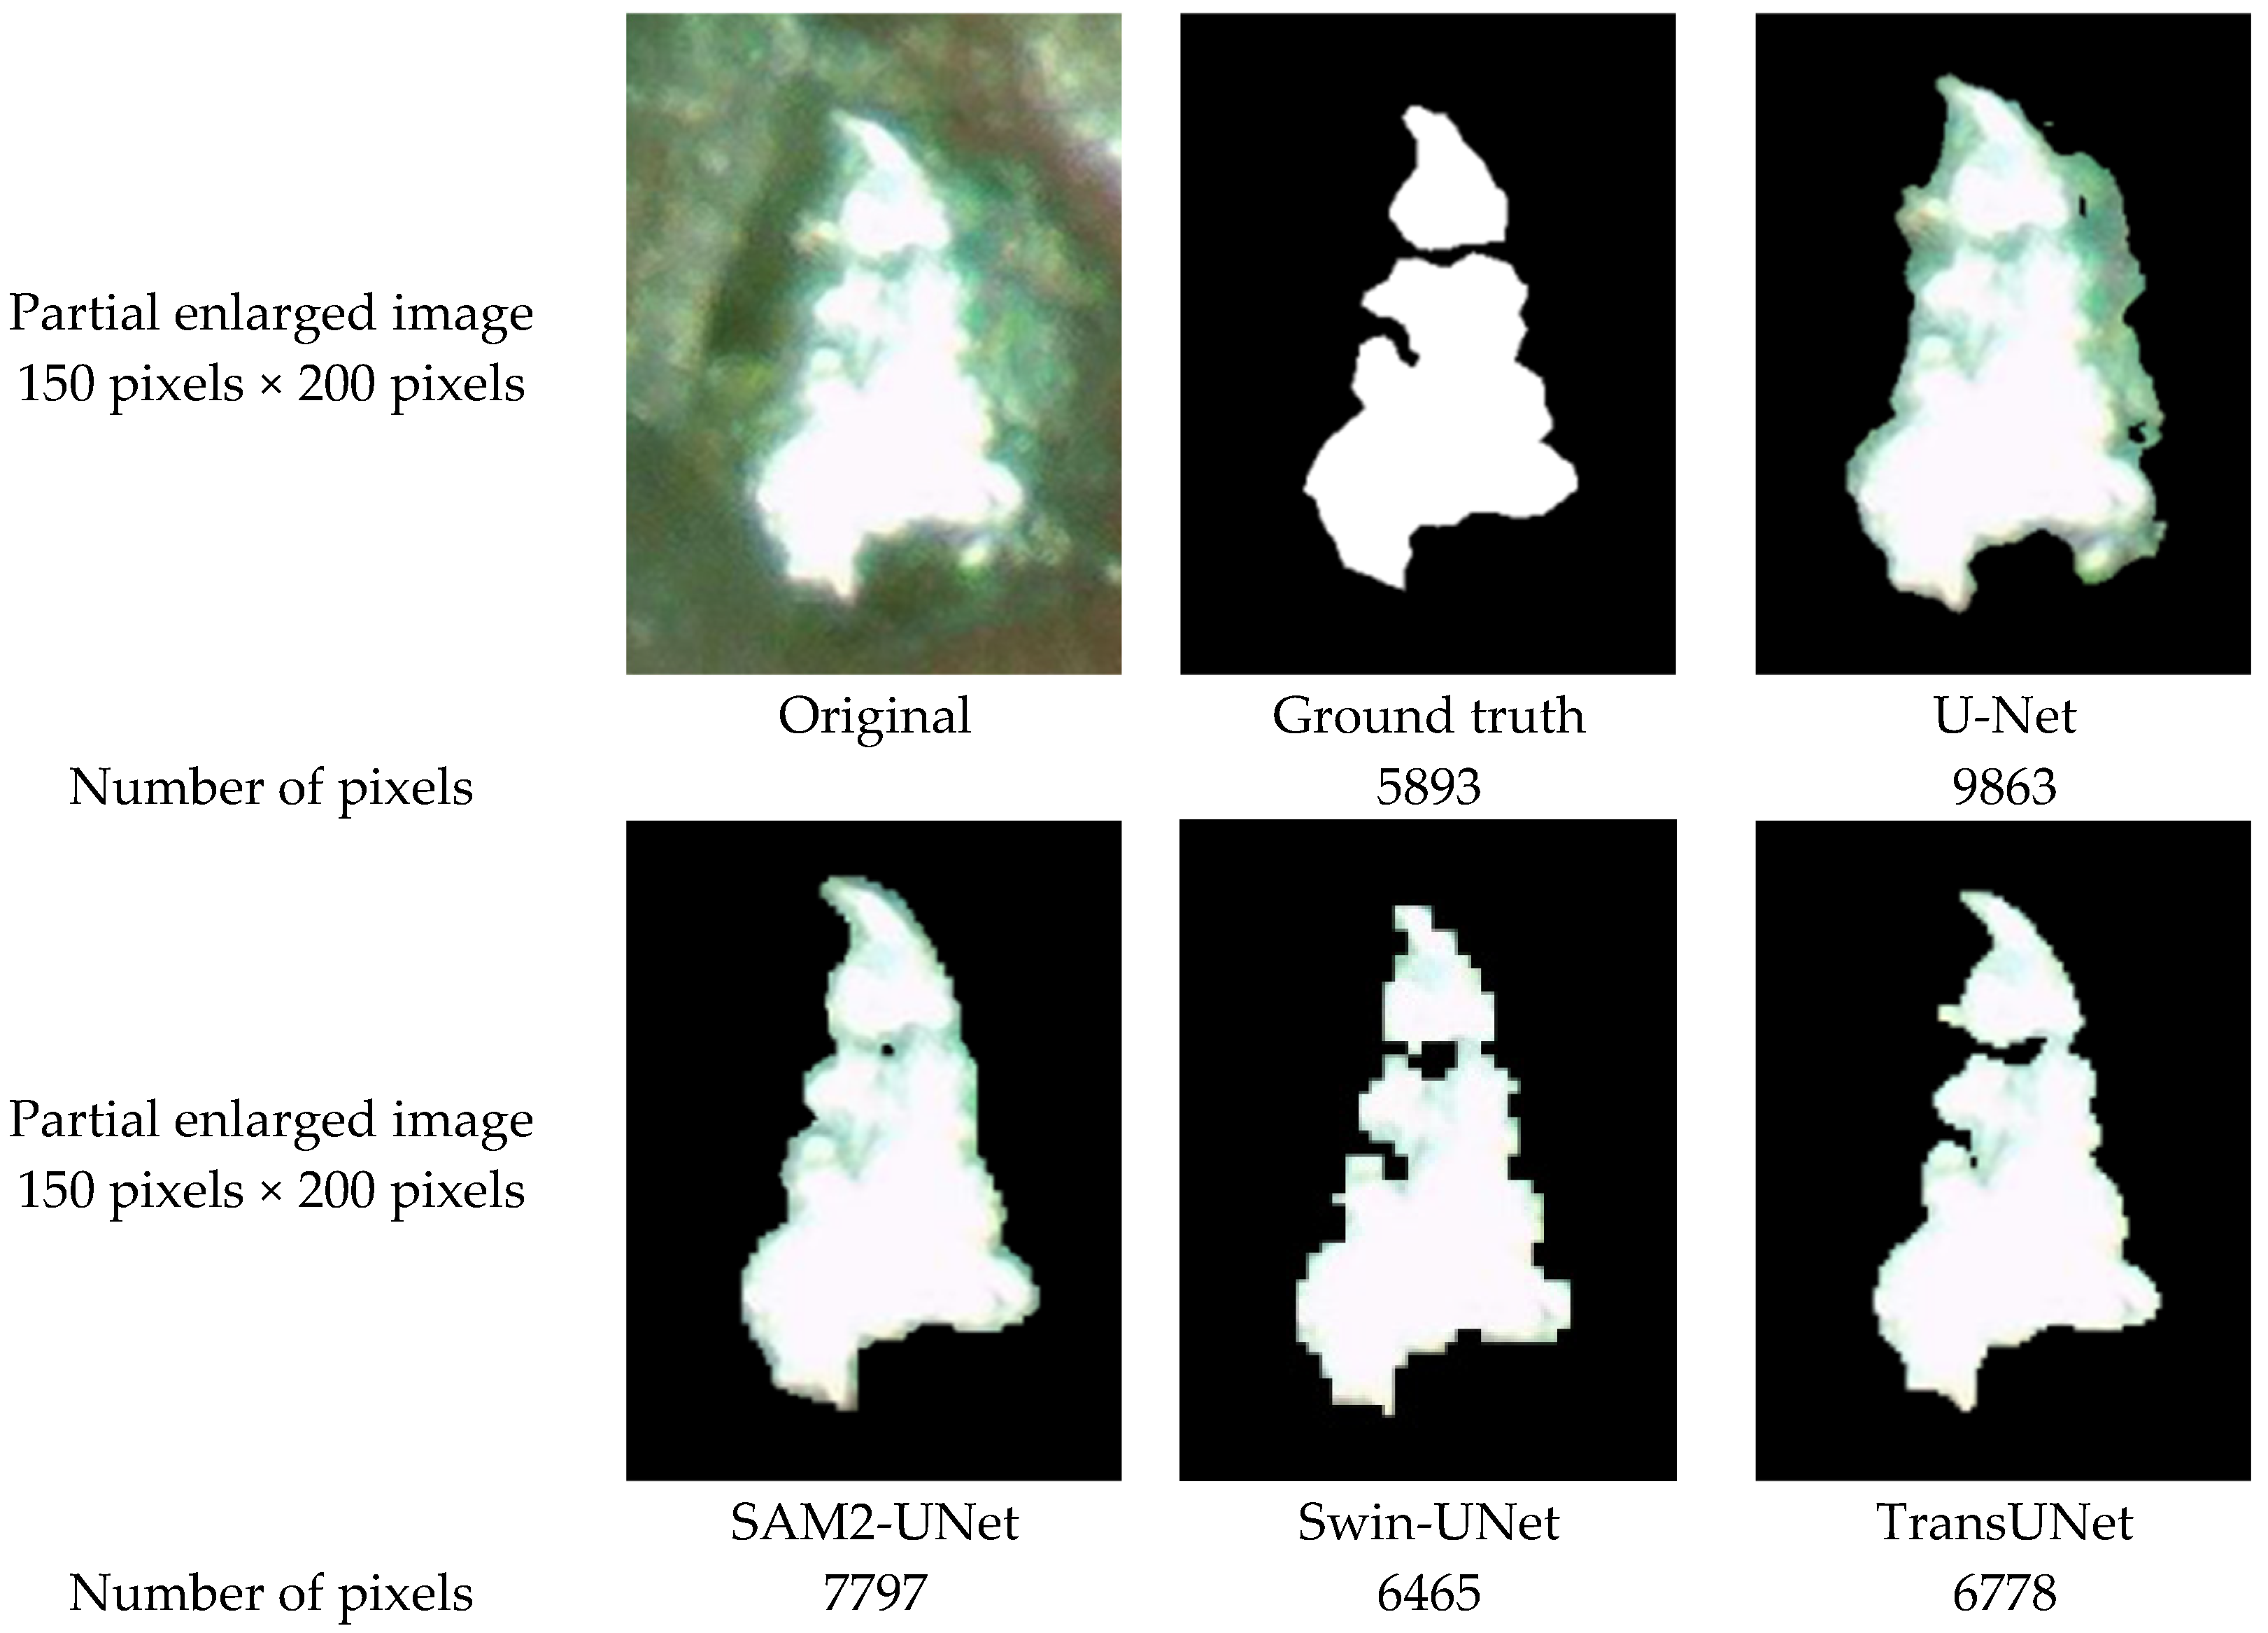
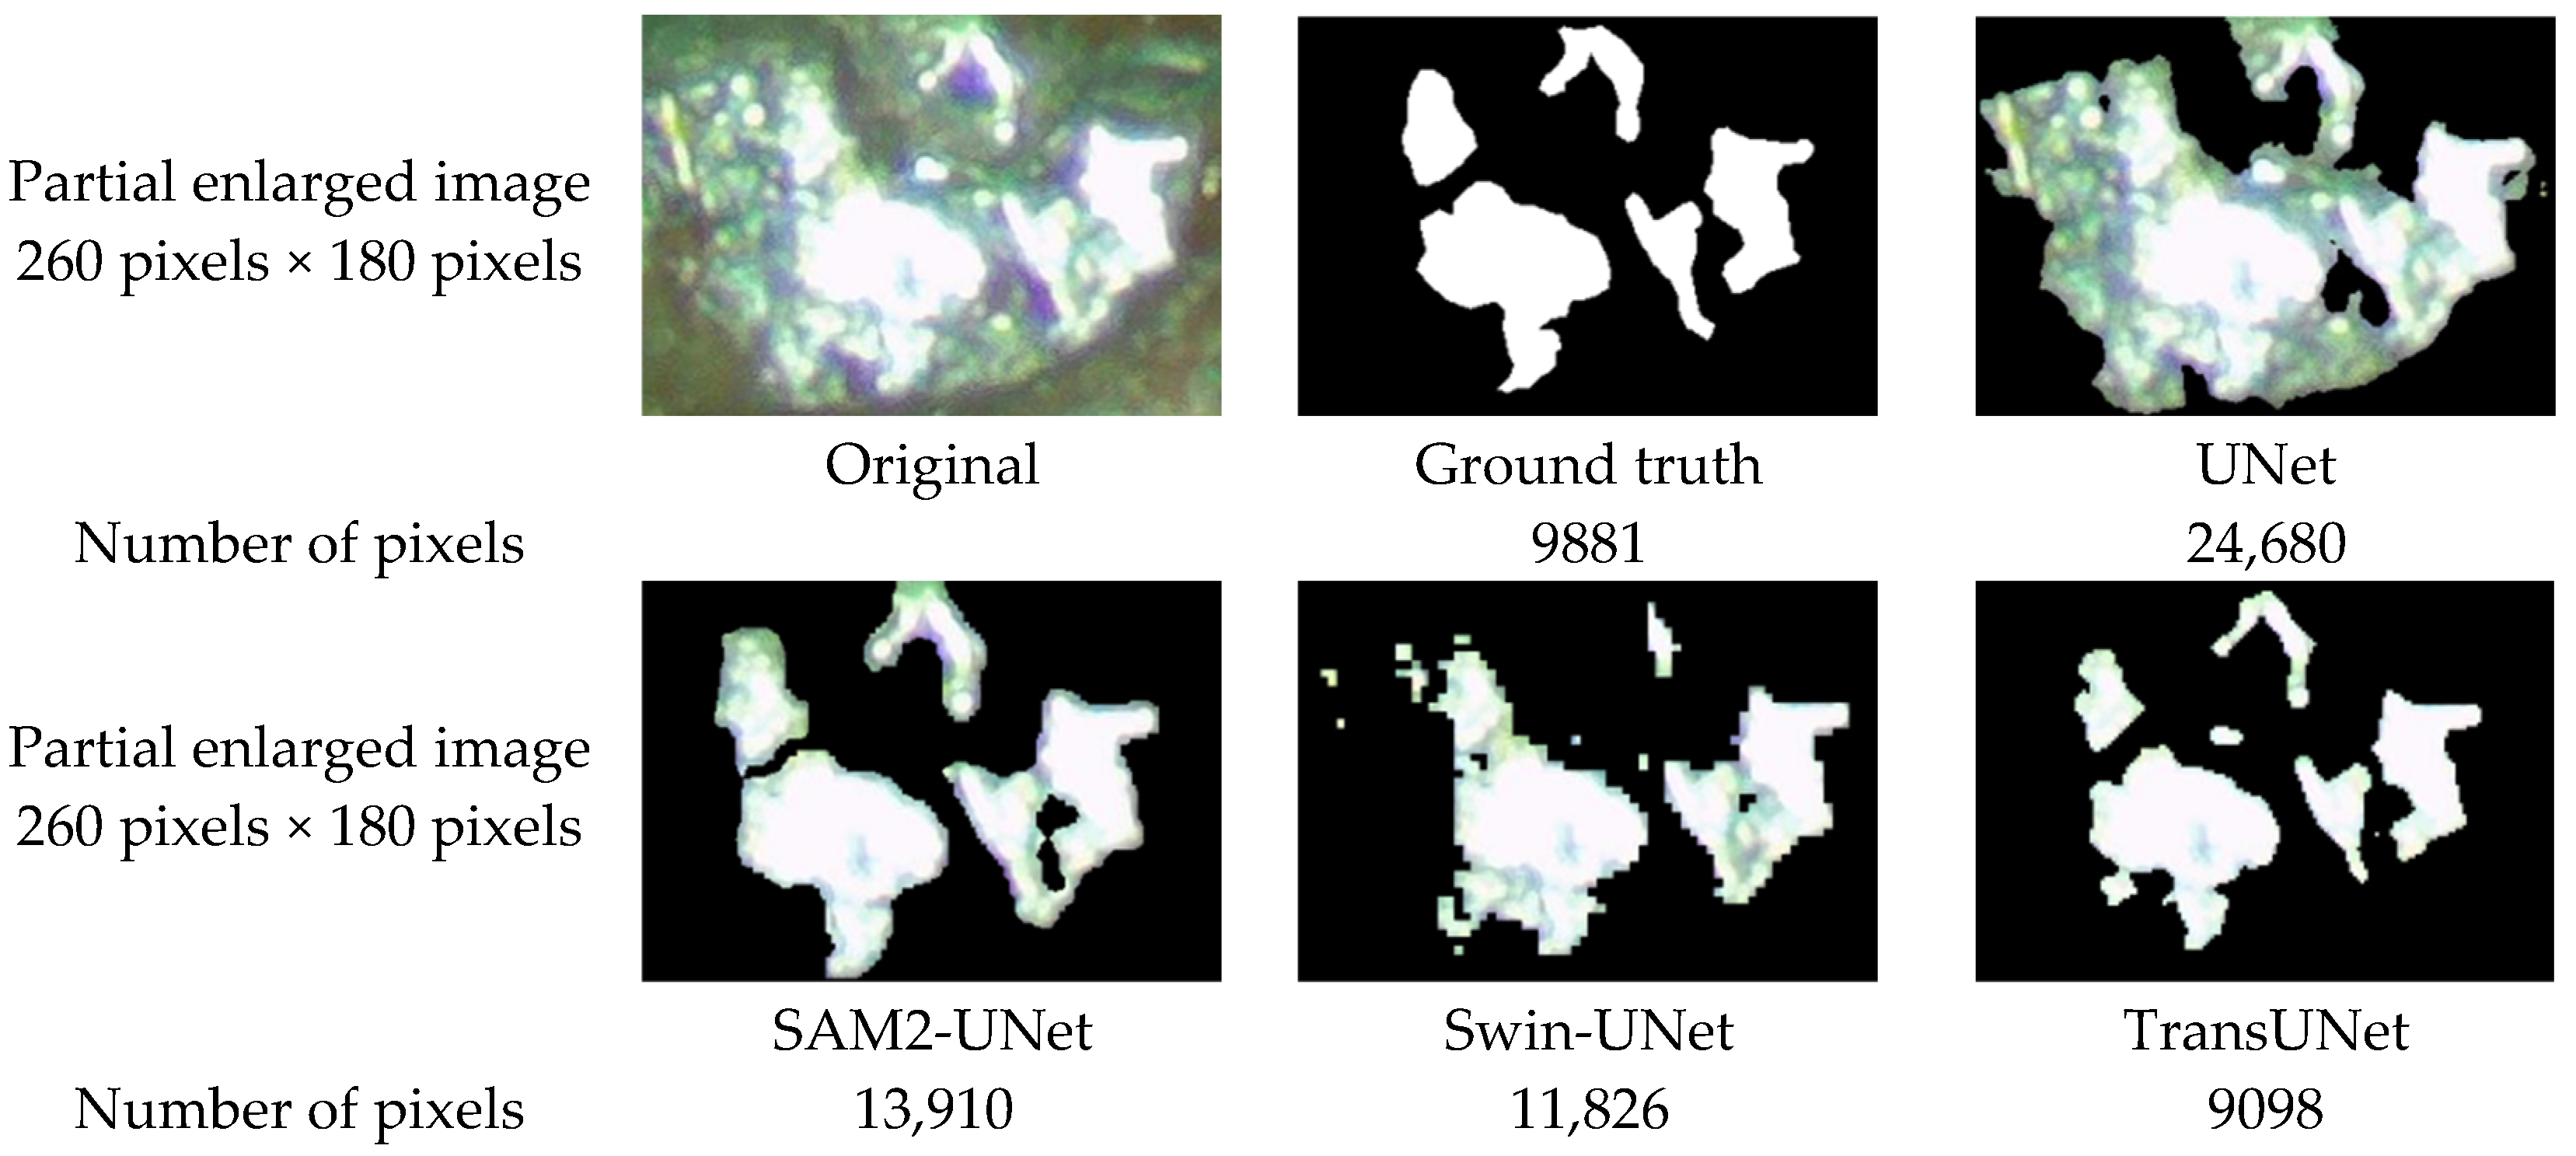
Figure 11 and Figure 12 display the local enlarged view of two abrasive particles and the number of pixels of the RoI area obtained by the four trained network models. From the enlarged image, we can see that the prediction results of SAM2-UNet and U-Net have more regions than those of the label. Their recall values are much larger than those of TransUNet and Swin-UNet. The segmentation results of Swin-UNet cannot identify clear edges, and some regions are often not recognized. The results of TransUNet can identify clear edges, which are even closer to the ground truth than manual labels. Some small areas omitted in the label can also be accurately identified by the TransUNet model.
The images used in this study cover the entire life cycle of abrasive belts. The image features include the high similarity between the reflective background and the target area in the early stage, image brightness differences caused by changes in light source distance under different magnification levels, and scale changes in wear area during different periods. Therefore, the model’s generalizability to lighting variations, reflections, and adhesive wear has been verified.

5.2. Wear Quantification and Performance Evaluation

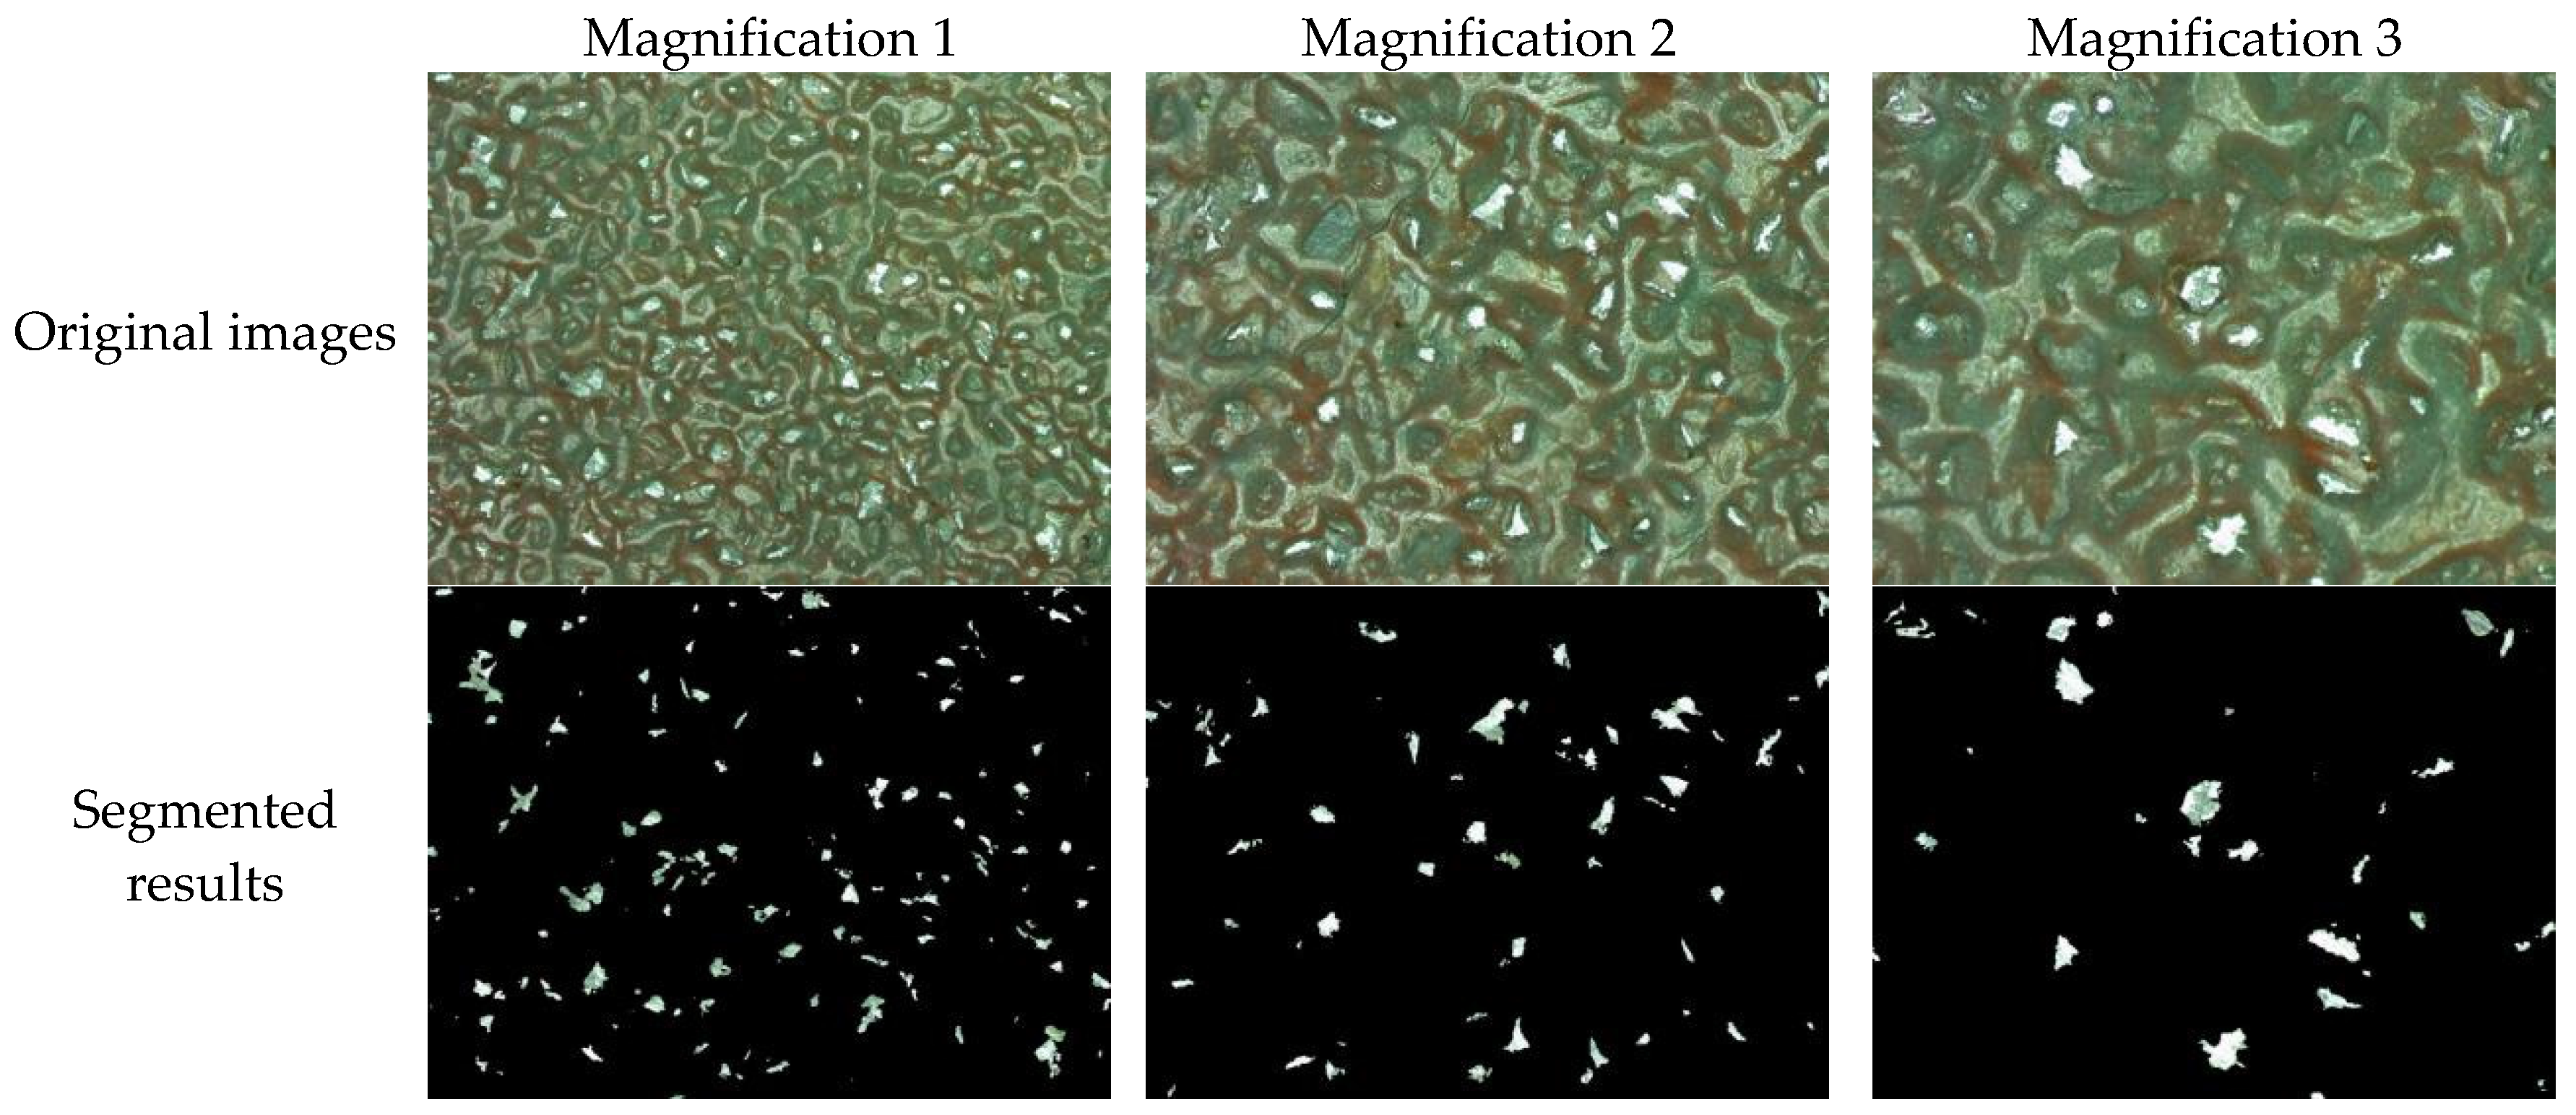
Figure 13 shows the segmented results of abrasive belt images collected at three magnifications. It can be seen that the trained U-net model has excellent prediction performance with different field sizes. This indicates that the model has very good generalization ability.
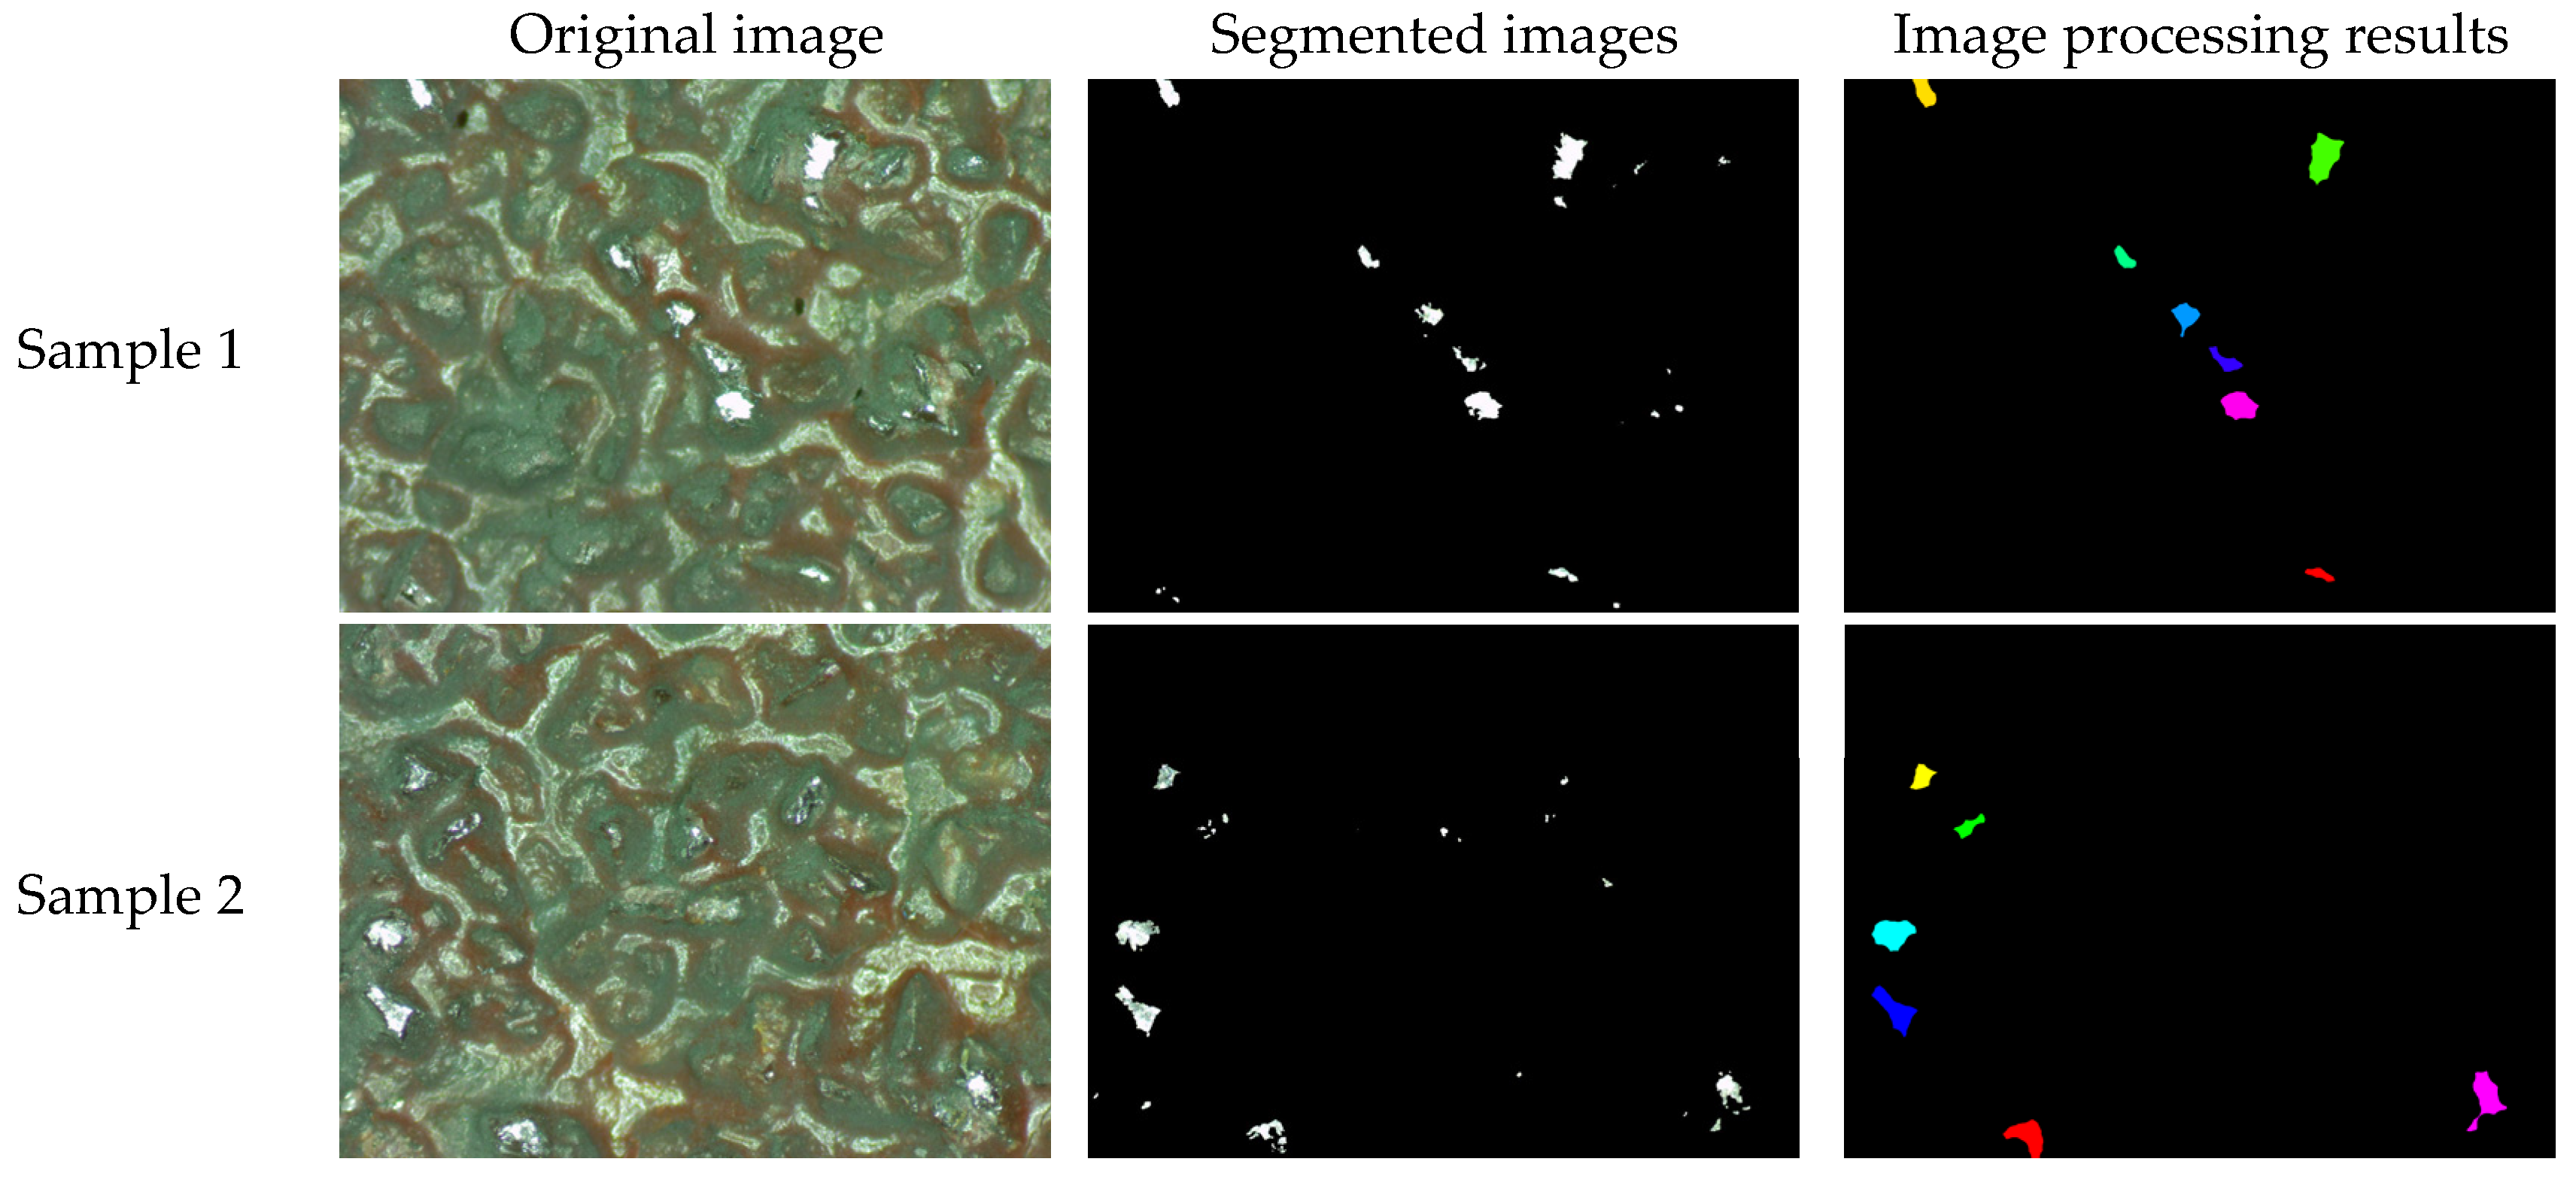
Figure 14 presents a comparison diagram of the results before and after morphological and connected-component processing of the segmented outcomes. As can be seen from the figure, this processing can effectively suppress small noise and merge multiple regions belonging to the same abrasive grain, thereby improving the accuracy of the statistical analysis of abrasive grain count.
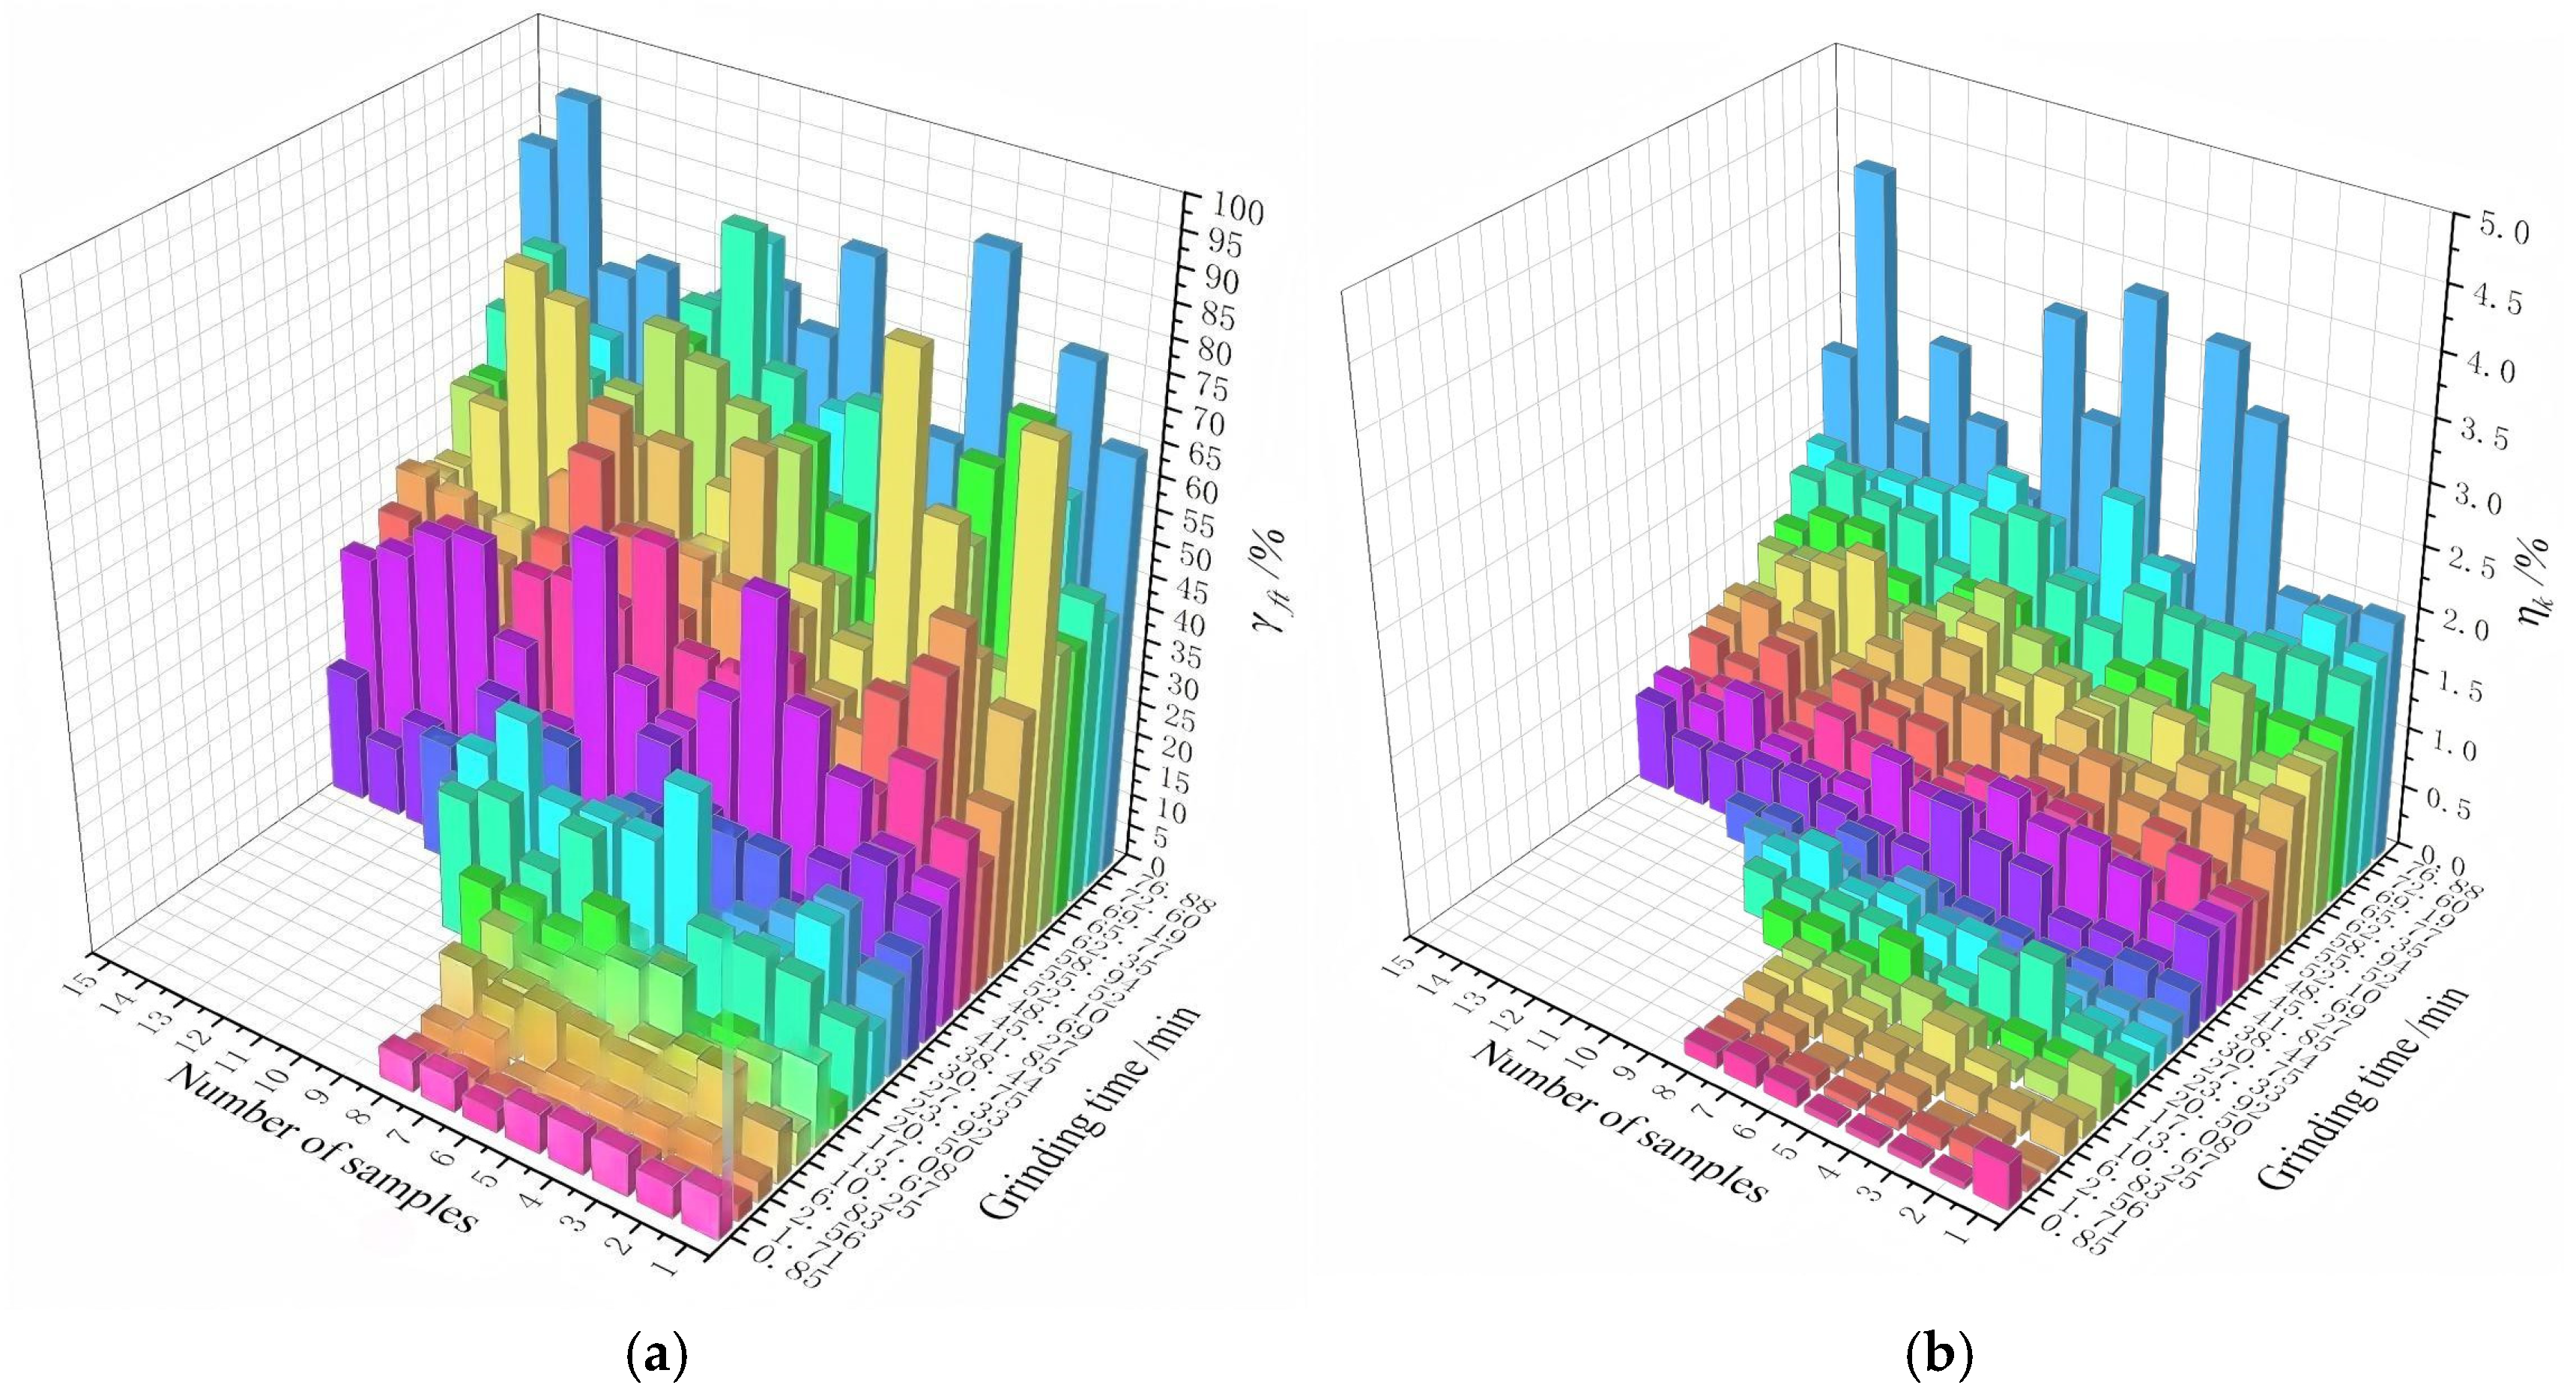
Figure 15 shows the proportions of blunted abrasive particle number γft and wear area ratio ηk. It is apparent that the proportions of both of them show an obvious increasing trend with the grinding time. Compared with that of γft, the value of the wear area ratio has better consistency. This is because the statistical error of the area only depends on the result of segmentation, while the number of blunted abrasive particles is also affected by the statistics of the connected domain.
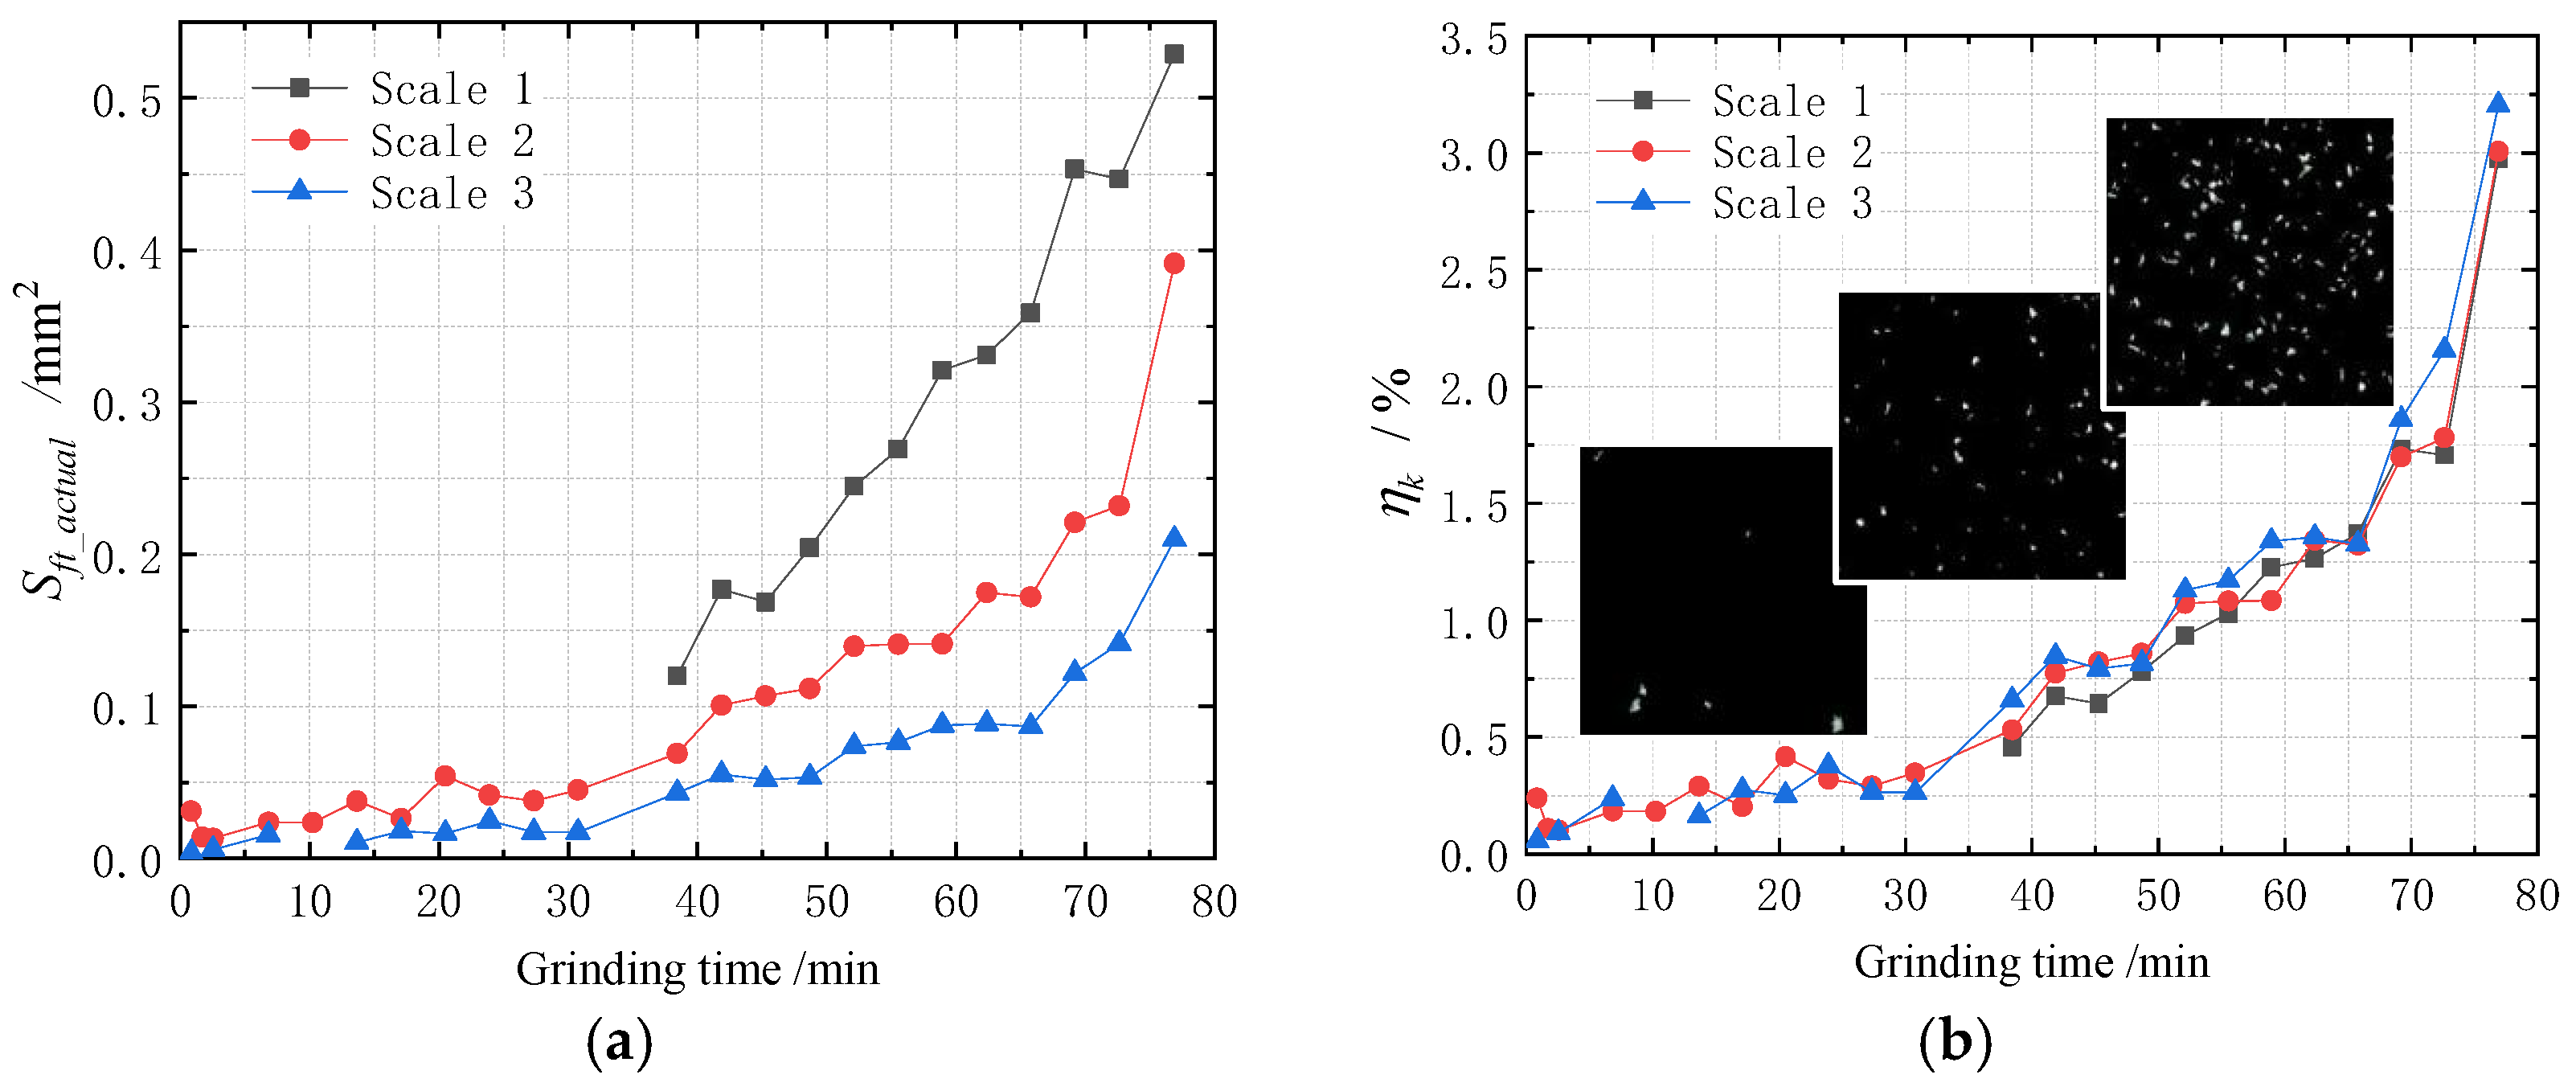
Figure 16 shows the variation trend of the actual wear area of blunted abrasive particles with grinding time in the sampled images at three different scales. It is apparent that the wear area increases with the grinding time. The values of the wear area of the samples at different scales show gradually increasing differences along with the same grinding time. However, the values of wear area ratio ηk are indistinguishable with the normalization effect. Under the constant grinding parameters adopted in this study, there are obvious demarcation points that divide the entire service life cycle into initial wear, steady wear, and severe wear stages, which is consistent with results reported in most of the literature. However, the specific positions of these demarcation points (grinding time) will change with variations in grinding parameters. To characterize the three wear stages independently without being affected by process parameters, we use the mean wear area ratio instead of grinding time as the core indicator. During the initial wear stage, the wear area ratio is less than 0.5%. When it comes to the steady wear stage, the wear area ratio roughly ranges from 0.5% to 2%. The severe wear stage of the abrasive belt starts when the wear area ratio reaches 2% and ends when it reaches approximately 3.2%.

6. Conclusions

A novel image-based quantitative evaluation method for abrasive belt wear using a deep semantic segmentation algorithm and image processing technology is proposed. The main conclusions are as follows:
  • The trained TransUNet model is capable of pixel-level segmentation of the top surface of blunt abrasive grits with irregular and multiscale shapes. Its mIoU of prediction reaches 0.8408, which is much higher than those of the other three U-net-based networks. The number and top area of the abrasive particles participating in grinding can be accurately quantified by relying on the accurate segmentation results.
  • The number of blunted abrasive grains is to some extent equal to the number of abrasive grains actually involved in grinding. As the grinding time increases, the number of blunted abrasive grits gradually increases. By the time the abrasive belt is exhausted, the percentage of the number of blunted abrasive grains is approximately 74.29%.
  • Blunted wear occurs throughout the life cycle of the abrasive belt. And with the increase in grinding time, the wear rate of the blunted wear area is gradually increased in three stages. By the end of the belt’s life, the abrasive belt wear area rate is about 3.06%.

Author Contributions

L.R. and N.W. performed the processing and analysis of the experimental data. They are the major contributors to the writing of the manuscript. W.P. and W.Y. mainly contributed to the conduction of the grinding experiments. G.Z. mainly responsible for funding acquisition and project administration. All authors have read and agreed to the published version of the manuscript.

Funding

This work was supported by the National Natural Science Foundation of China (52275511), the Natural Science Foundation of Shaanxi Province (2024-JC-YBQN-0416), and the Open Project of Key Laboratory of Metrological Optics and Application for State Market Regulation (SXJL2023008KF).

Institutional Review Board Statement

Not applicable.

Informed Consent Statement

Not applicable.

Data Availability Statement

The datasets used or analyzed during the current study are available from the corresponding author on reasonable request.

Conflicts of Interest

The authors declare no conflicts of interest.

References

  1. Xiao, G.; Liu, X.; Song, K.; Zhang, T.; Huang, Y. Research on robotic belt grinding method of blisk for obtaining high surface integrity features with variable inclination angle force control. Robot. Comput. Manuf. 2024, 86, 102680. [Google Scholar] [CrossRef]
  2. Zhang, B.; Wu, S.; Wang, D.; Yang, S.; Jiang, F.; Li, C. A review of surface quality control technology for robotic abrasive belt grinding of aero-engine blades. Measurement 2023, 220, 113381. [Google Scholar] [CrossRef]
  3. Li, H.; Zou, L.; Gui, L.; Li, Y.; Zhang, X.; Wang, W. Effects of feed direction on material removal behavior in belt grinding of titanium alloys. J. Manuf. Process. 2023, 102, 756–764. [Google Scholar] [CrossRef]
  4. Chen, H.; Yang, J.; Ding, H. Robotic compliant grinding of curved parts based on a designed active force-controlled end-effector with optimized series elastic component. Robot. Comput. Manuf. 2024, 86, 102646. [Google Scholar] [CrossRef]
  5. Chu, Y.; Yan, S.; Yang, Z.; Xu, X.; Wang, H.; Ding, H. Grain shape-protrusion-based modeling and analysis of material removal in robotic belt grinding. J. Manuf. Process. 2024, 110, 211–223. [Google Scholar] [CrossRef]
  6. Ren, L.; Wang, N.; Wang, X.; Li, X.; Li, Y.; Zhang, G.; Lei, X. Modeling and analysis of material removal depth contour for curved-surfaces abrasive belt grinding. J. Mech. Work. Technol. 2023, 316, 117945. [Google Scholar] [CrossRef]
  7. Wang, N.; Zhang, G.; Ren, L.; Yang, Z. Analysis of abrasive grain size effect of abrasive belt on material removal performance of GCr15 bearing steel. Tribol. Int. 2022, 171, 107536. [Google Scholar] [CrossRef]
  8. Zhou, K.; Xiao, G.; Xu, J.; Huang, Y. Wear evolution of electroplated diamond abrasive belt and corresponding surface integrity of Inconel 718 during grinding. Tribol. Int. 2023, 177, 107972. [Google Scholar] [CrossRef]
  9. Xiao, G.; Zhang, Y.; Zhu, B.; Gao, H.; Huang, Y.; Zhou, K. Wear behavior of alumina abrasive belt and its effect on surface integrity of titanium alloy during conventional and creep-feed grinding. Wear 2023, 514–515, 204581. [Google Scholar] [CrossRef]
  10. Cheng, C.; Li, J.; Liu, Y.; Nie, M.; Wang, W. An online belt wear monitoring method for abrasive belt grinding under varying grinding parameters. J. Manuf. Process. 2020, 50, 80–89. [Google Scholar] [CrossRef]
  11. Li, Z.; Tang, Q.; Wang, S.; Zhang, P. A deep transfer learning method for monitoring the wear of abrasive belts with a small sample dataset. J. Manuf. Process. 2022, 74, 374–382. [Google Scholar] [CrossRef]
  12. Zhang, X.; Chen, H.; Xu, J.; Song, X.; Wang, J.; Chen, X. A novel sound-based belt condition monitoring method for robotic grinding using optimally pruned extreme learning machine. J. Mech. Work. Technol. 2018, 260, 9–19. [Google Scholar] [CrossRef]
  13. Chen, J.; Chen, H.; Xu, J.; Wang, J.; Zhang, X.; Chen, X. Acoustic signal-based tool condition monitoring in belt grinding of nickel-based superalloys using RF classifier and MLR algorithm. Int. J. Adv. Manuf. Technol. 2018, 98, 859–872. [Google Scholar] [CrossRef]
  14. Pandiyan, V.; Caesarendra, W.; Tjahjowidodo, T.; Tan, H.H. In-process tool condition monitoring in compliant abrasive belt grinding process using support vector machine and genetic algorithm. J. Manuf. Process. 2018, 31, 199–213. [Google Scholar] [CrossRef]
  15. Khellouki, A.; Rech, J.; Zahouani, H. The effect of abrasive grain’s wear and contact conditions on surface texture in belt finishing. Wear 2007, 263, 81–87. [Google Scholar] [CrossRef]
  16. Wang, W.; Salvatore, F.; Rech, J.; Li, J. Comprehensive investigation on mechanisms of dry belt grinding on AISI52100 hardened steel. Tribol. Int. 2018, 121, 310–320. [Google Scholar] [CrossRef]
  17. Mezghani, S.; El Mansori, M. Abrasiveness properties assessment of coated abrasives for precision belt grinding. Surf. Coat. Technol. 2008, 203, 786–789. [Google Scholar] [CrossRef]
  18. He, Z.; Li, J.; Liu, Y.; Wang, W. Investigation of conditions leading to critical transitions between abrasive belt wear modes for rail grinding. Wear 2021, 484–485, 204048. [Google Scholar] [CrossRef]
  19. Wan, Q.; Zou, L.; Liu, S.; Wang, T.; Chen, S.; Huang, Y. Investigation on abrasive wear mechanism of single diamond grain in flexible scribing titanium alloy. Diam. Relat. Mater. 2021, 120, 108631. [Google Scholar] [CrossRef]
  20. Yu, J.B.; Xun, C.; Liang, L.; Wu, B. A machine vision method for measurement of machining tool wear. Measurement 2021, 182, 109683. [Google Scholar] [CrossRef]
  21. Wang, N.; Zhang, G.; Pang, W.; Ren, L.; Wang, Y. Novel monitoring method for material removal rate considering quantitative wear of abrasive belts based on LightGBM learning algorithm. Int. J. Adv. Manuf. Technol. 2021, 114, 3241–3253. [Google Scholar] [CrossRef]
  22. Korkmaz, M.E.; Gupta, M.K.; Çelik, E.; Ross, N.S.; Günay, M. Tool wear and its mechanism in turning aluminum alloys with image processing and machine learning methods. Tribol. Int. 2024, 191, 109207. [Google Scholar] [CrossRef]
  23. Wan, Q.; Zou, L.; Han, C.; Wang, W.; Qian, K.; Ou, J. A U-Net-based intelligent approach for belt morphology quantification and wear monitoring. J. Mech. Work. Technol. 2022, 306, 117652. [Google Scholar]
  24. Zhou, X.; Zhang, Y.; Ren, Z.; Mi, T.; Jiang, Z.; Yu, T.; Zhou, S. A Unet-inspired spatial-attention transformer model for segmenting gear tooth surface defects. Adv. Eng. Inform. 2024, 62, 102933. [Google Scholar]
  25. Ronneberger, O.; Fischer, P.; Brox, T. U-Net: Convolutional Networks for Biomedical Image Segmentation. Med. Image Comput. Comput. Assist. Interv. 2015, 9351, 234–241. [Google Scholar]
  26. Zhang, Q.; Zhu, H.; Lv, Y.; Jiang, D.; Li, Z.; Chauhan, S.; Vashishtha, G. An improved u-net for image segmentation of iron roughnecks on offshore oil drilling platforms. Measurement 2025, 253, 117689. [Google Scholar] [CrossRef]
  27. Chen, J.N.; Lu, Y.Y.; Yu, Q.H.; Luo, X.D.; Adeli, E.; Wang, Y.; Lu, L.; Yuille, A.L.; Zhou, Y.Y. TransUNet: Transformers Make Strong Encoders for Medical Image Segmentation. arXiv 2021, arXiv:2102.04306. [Google Scholar] [CrossRef]
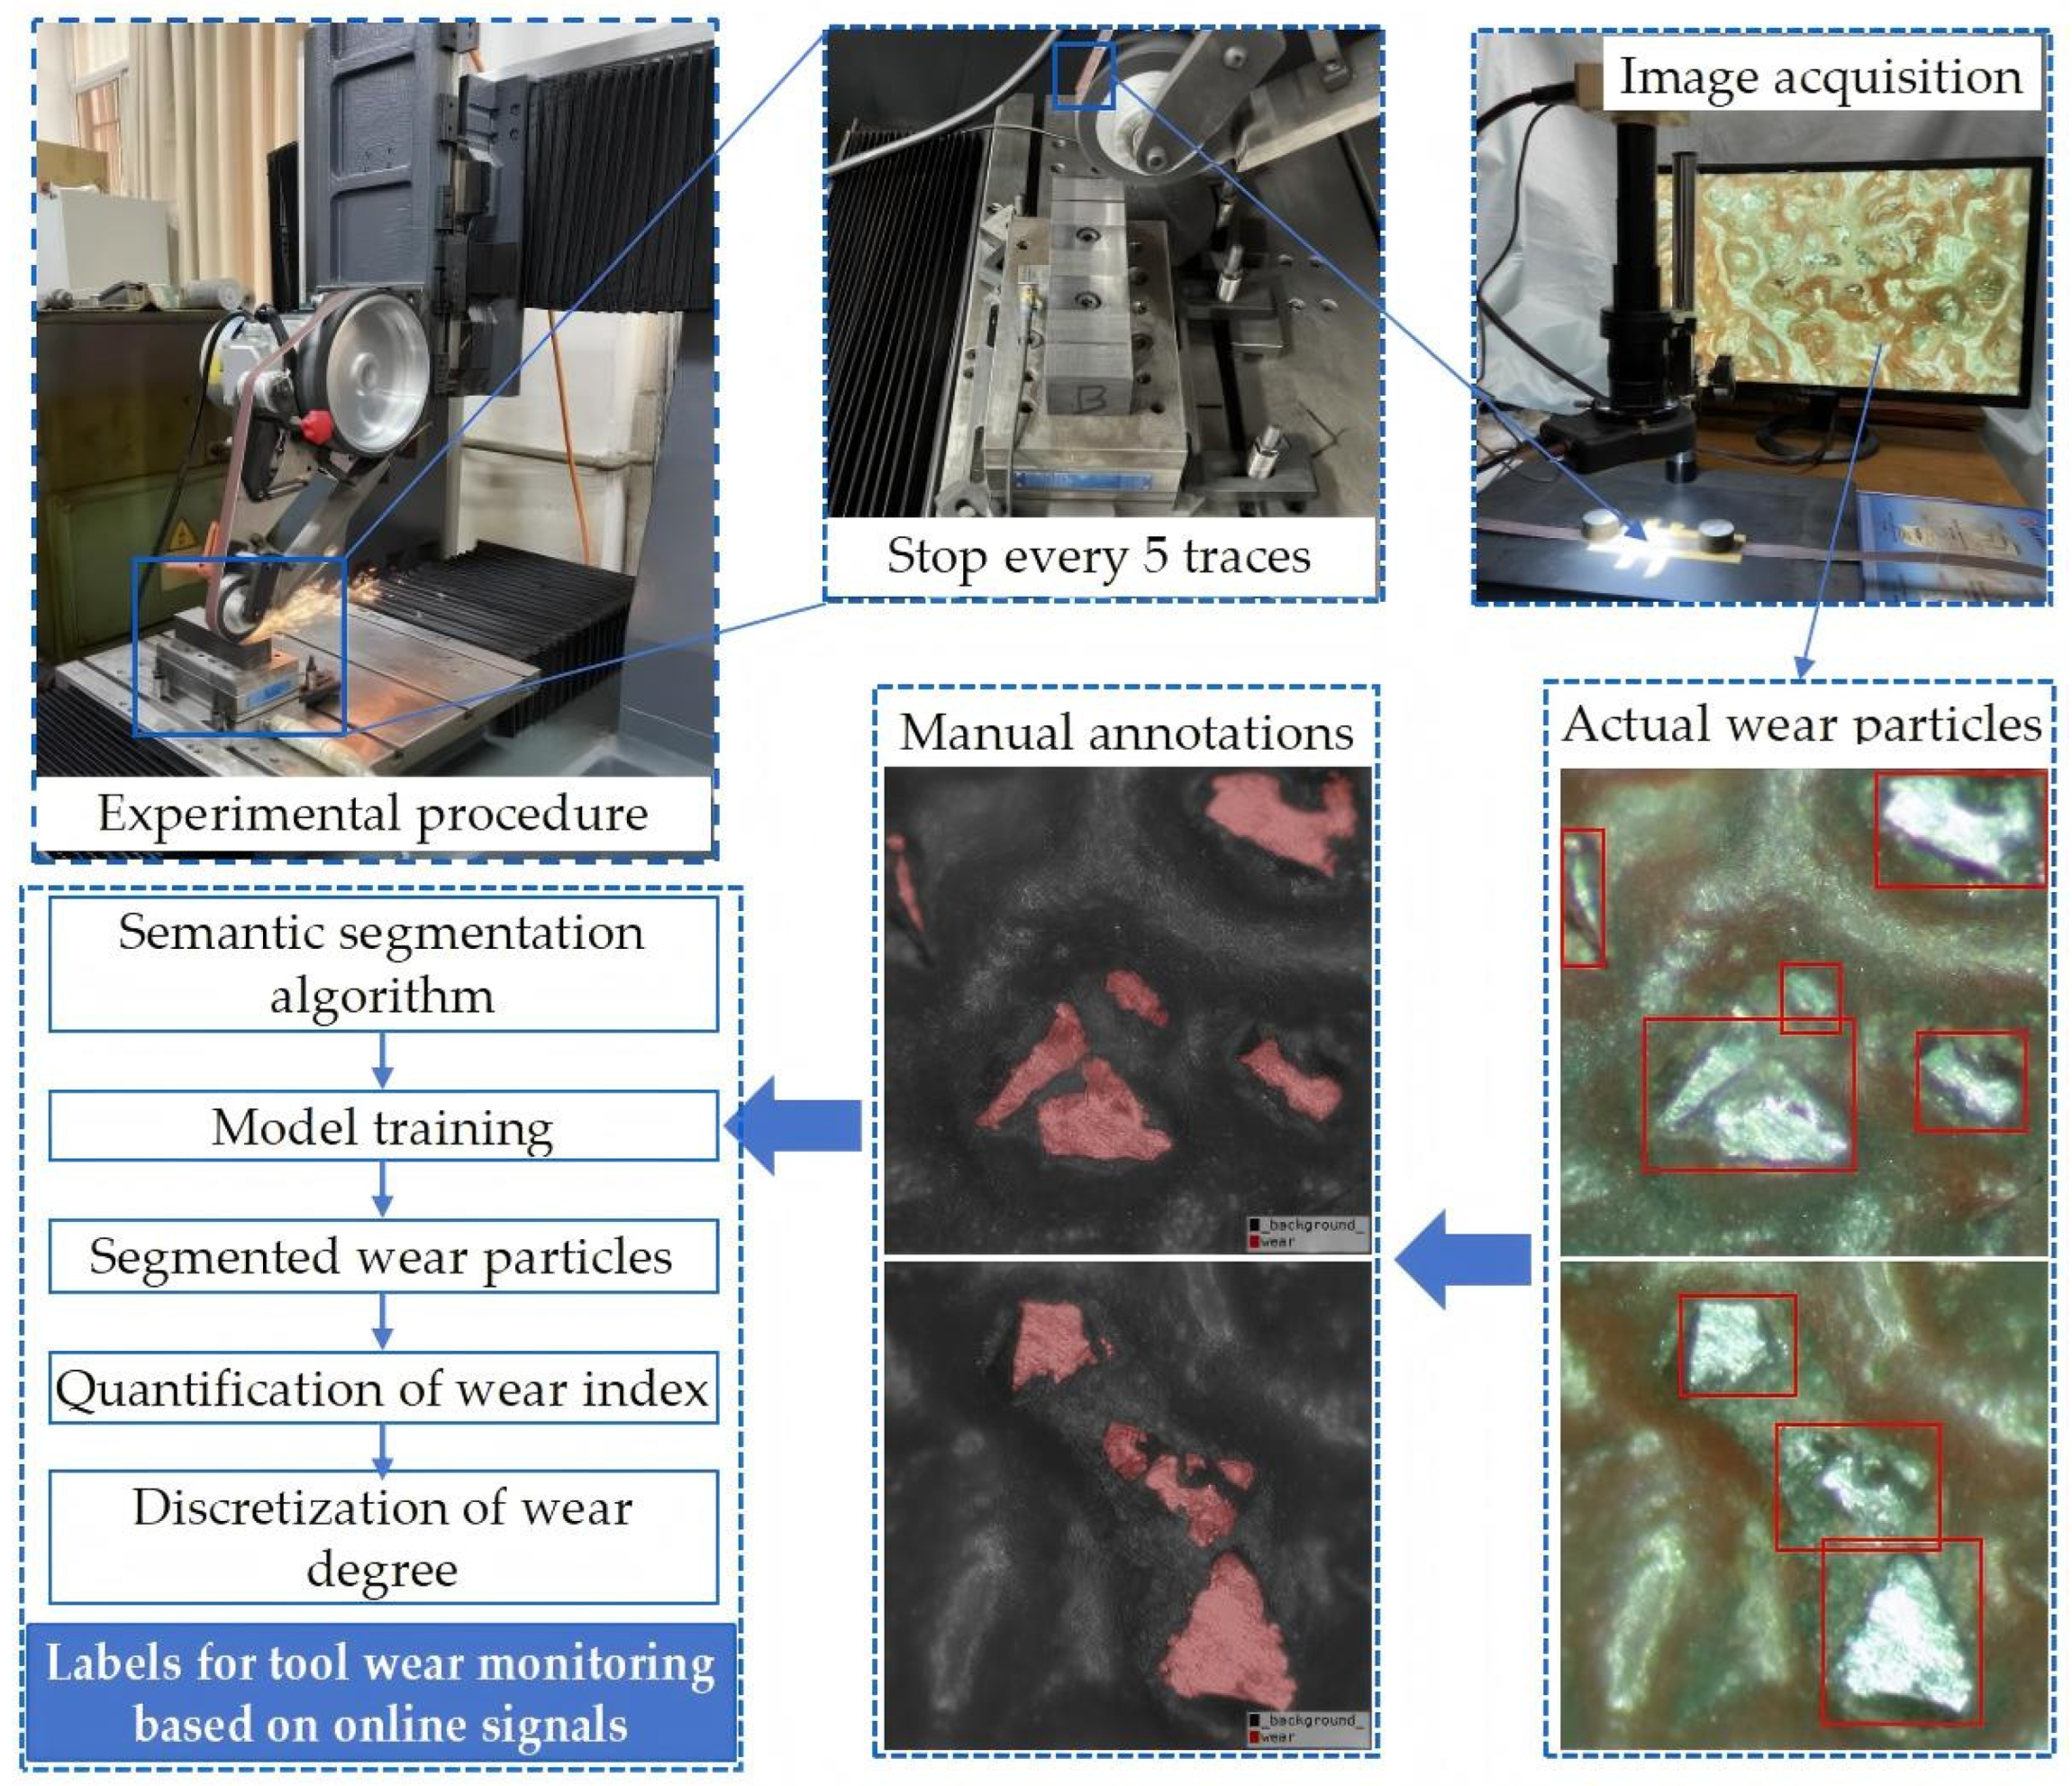
Figure 1. Experimental setup and research content logic.
Coatings 15 01257 g001
Figure 2. Schematic diagram of the typical wear form of an alumina abrasive belt.
Coatings 15 01257 g002
Figure 3. Surface morphology: (a) original image; (b) corresponding height distribution map.
Coatings 15 01257 g003
Figure 4. Surface morphology of abrasive belt: (a) new abrasive belt; (b) worn abrasive belt.
Coatings 15 01257 g004
Figure 5. Surface morphology of abrasive belt collected using Sick Ruler X40 (Waldkirch, Baden-Württemberg, Germany). (a) Three-dimensional topography of the belt surface. (b) Two-dimensional contour along the red line.
Coatings 15 01257 g005
Figure 6. Calculation procedure of the evaluation indices of the abrasive belt wear degree.
Coatings 15 01257 g006
Figure 7. Quantification calibration procedure of the microscope.
Coatings 15 01257 g007
Figure 8. TransUNet structure.
Coatings 15 01257 g008
Figure 9. Prediction results of the four network models. The morphology of blunted abrasive particles mainly displays two types of characteristics: those shown in yellow boxes and those of others.
Coatings 15 01257 g009
Figure 10. Evaluation indices of the four networks on the test dataset.
Coatings 15 01257 g010
Figure 11. Partial enlarged image of sample 4.
Coatings 15 01257 g011
Figure 12. Partial enlarged image of sample 2.
Coatings 15 01257 g012
Figure 13. Segmented results of abrasive belt images collected at three different magnifications.
Coatings 15 01257 g013
Figure 14. The results after morphological and connected-component processing. The segmented abrasive particles are distinguished by different colors.
Coatings 15 01257 g014
Figure 15. Distribution of sample data at different grinding times distinguished by different colors. (a) Percentage of blunted abrasive particle number γft. (b) Wear area ratio ηk.
Coatings 15 01257 g015
Figure 16. Variation trends of total actual wear area and wear area ratio with grinding time at different scales. (a) Mean actual wear area Sft_actual/mm2. (b) Mean wear area ratio ηk/%.
Coatings 15 01257 g016
Table 1. Parameters of the experimental elements.
ItemsRelated Parameters
WorkpieceMaterial: GCr15;
Hardness: 58 HRC;
Size: 41 mm × 100 mm;
Roughness: 1.6 Ra
Abrasive beltMaterial: brown corundum;
Type: 60 #;
Length: 1.44 m;
Width: 20 mm;
Manufacturing process: electrostatic sand planting;
Contact wheelMaterial: rubber;
Diameter: 60 mm;
Hardness: 85 Shore A;
Grinding parametersFeed rate: 4 mm/s;
Velocity: 32 m/s;
Theoretical grinding depth: 0.3 mm;
CameraCamera sensor: CMOS;
Resolution: 21 million pixels;
Optical dimensions: 1/2.33 inch;
Image size: 4608 pixels × 3456 pixels
Table 2. Calibration results of the microscope.
Magnifications ×0.5 ×1 ×1.5 ×2 ×2.5 ×3 ×3.5 ×4 ×4.5
γ (mm/pixel)1/4581/7851/11001/15401/18351/21601/25301/29301/3215
Table 3. Hardware parameters.
ItemsCPUGPUMemoryCUDA
ParametersInter(R) Xeon(R) Gold 6130 CPU @ 2.10 GHzNVIDIA RTX A400030.9 G11.8
Table 4. Hyper-parameters in the semantic segmentation networks.
Input ImageActivation FunctionBatch-SizeEpochsInitial Learning RateOptimizer
UNet512 × 512ReLU103000.01Adam
SAM2-UNet352 × 352GeLU123000.01SGD
Swin-UNet224 × 224GeLU101000.01SGD
TransUNet512 × 512ReLU21000.01SGD
Table 5. Evaluation index of samples segmented using different networks.
Evaluation IndexSample No.U-NetSAM2-UNetSwin-UNetTransUNet
mIoU10.49950.81720.75290.8187
20.41800.76070.73980.8528
30.74060.84750.76380.8874
40.53840.84100.82310.8875
Precision10.52610.81870.94070.9720
20.41840.76220.78280.9325
30.76590.84850.78660.9624
40.54170.84430.93010.9591
Recall10.90810.99790.79040.8375
20.99820.99740.93090.9089
30.95740.99860.96350.9193
40.98850.99530.87740.9224
Disclaimer/Publisher’s Note: The statements, opinions and data contained in all publications are solely those of the individual author(s) and contributor(s) and not of MDPI and/or the editor(s). MDPI and/or the editor(s) disclaim responsibility for any injury to people or property resulting from any ideas, methods, instructions or products referred to in the content.