Abstract
The miscible process of virgin and aged asphalt in rejuvenated asphalt was studied by molecular dynamics (MD) simulation. In this paper, we used MD software to establish a molecular model of asphalt, and the model of aged asphalt was established by adding ketone and sulfoxide functional groups to the original asphalt. Wood tar rejuvenator (WTR) was selected for rejuvenation of aged asphalt, and parameters such as density, surface free energy, cohesion energy density, and Young’s modulus were used to verify the molecular model. The density, relative concentration, interaction energy, mean square displacement of molecules, diffusion coefficient, mixing free energy, and radial distribution function were used to analyze the action mechanism of the rejuvenator in the rejuvenation process and the suitable service temperature and optimal amount of WTR. The results demonstrated that the WTR with 373 K and 15% mass ratio has the best rejuvenation effect on aged asphalt. The addition of WTR can increase the interaction energy between original and aged asphalt by 12.9%, reduce the Van der Waals potential energy of aged asphalt by 13.85%, and thus ensure the uniform distribution of internal molecules in rejuvenated asphalt. A 15 wt% WTR can reduce the intermolecular distance of asphaltenes from 9.4 Å to 5.2 Å, thereby alleviating the displacement effect during the asphalt aging process. The diffusion coefficients of WT-rejuvenated asphalt at 298 K and 373 K are 28.6% and 44.6% higher than those of extracted oil-rejuvenated asphalt, respectively; thus, WT-rejuvenated asphalt has better crack resistance.
1. Introduction
Asphalt pavement is the primary material used for road construction in China. It is characterized by a safer road surface, smooth pavement, low noise, and a short construction period. However, asphalt materials are easily affected by the atmosphere, sunlight, water, and other external environmental factors during the process of service and cause aging [1]. Aged asphalt pavement is prone to cracks, looseness, potholes, and other diseases, which greatly decreases the functionality and durability of the pavement. Currently, a large amount of asphalt pavement in China is facing major repairs and even reconstruction, contributing to a large amount of waste asphalt every year.
The reuse of waste asphalt is imminent in the situation of building a resource-saving and environment-friendly society in China. At present, commercial rejuvenators are expensive and easy to cause environmental pollution during use. The widely used extracted oil-based rejuvenator in current engineering has a low flash point and poses certain risks during construction. The quality of mineral oil-based rejuvenator is relatively poor, and the waste residue and flocculants in it are prone to cause deterioration of the infiltration effect. Meanwhile, the cost of “re-purification” is high, so its application scale and scenarios are extremely limited. Aged asphalt rejuvenator prepared from cracked oil of biomass materials commonly found in nature is characterized as having a wide source, providing environmental protection, and being renewable. China has abundant bamboo resources, and the wood tar (WT) produced by bamboo pyrolysis contains a large amount of aromatic lightweight components. A previous study [2] has shown that it can be used as a raw material in the preparation of aged asphalt rejuvenator. In this article, rejuvenation refers to the process of reversing the performance deterioration caused by chemical reactions such as oxidation and polymerization by adding a rejuvenator to aged asphalt.
There are few studies on wood-tar-rejuvenated asphalt (WTRA) both domestically and internationally, and the complexity of the chemical composition of asphalt makes it difficult to characterize the rejuvenation process through experimental research. As a result, the detailed mechanism of the performance recovery of the aged asphalt rejuvenated by wood tar rejuvenator (WTR) remains uncertain. A widely accepted rejuvenation mechanism is that the rejuvenator contains the lightweight components that are absent in the aged asphalt, and the incorporation of the rejuvenator restores the proportion of aged asphalt components to original [3]. Meanwhile, for the most common oxidative aging, the ketone and sulfoxide functional groups produced during the oxidation of asphalt change their chemical properties, leading to increased hardness and brittleness [4]. The addition of some aromatic rejuvenators is capable of reacting with the aged asphalt in order to reduce the oxidation products [5,6], and the asphalt forms new microstructures to restore the functional characteristics of aged asphalt, but this viewpoint has not evolved into something clearly verified in the microscopic field. Therefore, to promote the rejuvenation and recycling of aged asphalt, it has great significance to interpret the contact and blending process of WTRA and the way in which the WTR enables the performance recovery of aged asphalt.
Most of the studies on the asphalt rejuvenation process concentrated on macroscopic experiments, and certain microscopic experimental techniques, including atomic force microscopy and scanning electron microscopy, etc., are merely able to observe the microscopic state at a specific moment in the asphalt rejuvenation process and cannot observe the whole rejuvenation process in real time. Molecular simulation technology uses the principle of classical Newtonian mechanics to demonstrate the macroscopic characteristics and motion law of the system by solving the movement trajectory of tiny molecules within the equation of motion. Consequently, molecular dynamics (MD) simulation has the ability to monitor the blending process of virgin and aged asphalt in real time and delve into the motion pattern distribution of rejuvenator molecules during the miscible process. Additionally, by means of MD simulation, the changes in force and energy existing between the rejuvenator and the blend of virgin and aged asphalt can be calculated continuously so as to investigate the action mechanism of the rejuvenator during the rejuvenation process of aged asphalt. MD simulations have been extensively employed in academic research to elucidate the rejuvenation mechanisms inherent in the asphalt binder systems. Xu et al. [6] used the molecular simulation method to study the effect of aromatic rejuvenators on aged asphalt and found that rejuvenators cannot restore the skeletal properties of asphalt but can form new asphalt structures. Gao et al. [7] employed MD simulation to display the compatibility mechanism between various plasticizers and matrix asphalt, and the simulation results were checked by macroscopic tests. It is found that the composite stability of trioctyl trimellitate plasticizer and asphalt is the best. Gao et al. [8] used MD simulations to study the effect of graphene on the rheological properties of waste rubber powder-modified asphalt and found that graphene can increase the shear viscosity of the asphalt and inhibit the diffusion of asphalt components. Fallah et al. [9] found through MD simulations that the main action mechanism of the rejuvenator is the disturbance of asphalt components. Zadshir et al. [10] found through MD simulations that rejuvenator can effectively restore the thermodynamic properties of oxidized asphalt, decrease the viscosity and rigidity of asphalt, and improve the stress relaxation capacity and fracture energy of asphalt. Ren et al. [11] found through MD simulations that separation index parameters based on rheological and chemical indicators are applicable for appraising the phase stability of the asphalt after rejuvenation.
The aim of this study is to conduct an in-depth investigation of the entire rejuvenation process of aged asphalt through the action of WTR. Based on MD simulation, the suitable temperature and amount of WTR are determined, and the mechanism of WTR on the recovery of aged asphalt performance is explored. The research results can play an important theoretical support role in expanding the application field of biomass materials and widening the range of materials for aged asphalt rejuvenator.
2. Materials and Methods
2.1. Materials
70# petroleum asphalt (OA) was used as the original asphalt binder, and its physical properties are shown in Table 1. Place OA in a rotating film oven at 163 °C for 85 min to prepare RTFOT (short-term) aged asphalt; then, place RTFOT aged asphalt in an oven at 110 °C for 20 h to prepare PAV (long-term) aged asphalt.

Table 1.
Physical properties of original asphalt binder.
This study used two types of rejuvenators for comparative analysis. One is WT produced by thermal cracking of waste wood, and its basic properties are shown in Table 2. Another type is furfural extracted oil (EO), which is produced from coking wax oil through the furfural extraction process; its basic properties are shown in Table 2.

Table 2.
Basic properties of WT and EO.
2.2. Test Methods
- (1)
- Component analysis (SARA)
The component analysis of the OA and PA was carried out according to the method specified in T0618-1993 in the Chinese specification Test Procedure for Bitumen and Bitumen Mixture for Highway Engineering (JTG E20-2011) [12]. The asphaltenes were precipitated with n-heptane and eluted step by step with a benzene-ethanol mixed solvent and carbon tetrachloride solution in sequence. Combined with the activated alumina column chromatography technology, the asphalts were separated into four components: asphaltene (As), saturate (S), aromatic (Ar), and resin (R), and the results are presented in Table 3.

Table 3.
Component analysis results of each asphalt.
- (2)
- Cohesive energy density (CED) test
According to the Chinese standard Determination of Viscosity Number and Limiting Viscosity Number of Polymers in Dilute Solution (GB/T 1632-93) [13], the CED value of each material was determined by the maximum intrinsic viscosity method. Dissolve the test sample thoroughly in the corresponding solvent to prepare a 4 mg/mL mixture, set the water bath temperature to 25 ± 1 °C, then measure the flow time difference between different mixtures and pure solvents at two scales by using an Ubbelohde viscometer, and take three sets of parallel data with a result not exceeding 0.5 s to calculate the average value. Finally, the specific viscosity concentration of the mixed solution with different concentrations is obtained, and the characteristic viscosity is obtained by the extrapolation method.
- (3)
- Solubility parameter test
The solubility of each material was determined by a drop weight test. The specific method is to weigh 10–20 drops of the tested sample and calculate the average mass of each drop. Using two non-volatile liquids with known solubility parameters as references, then calculate the solubility parameters of the tested liquid.
2.3. MD Modeling and Validation
2.3.1. Basic Conditions of Simulation
Due to the wide variety of molecules and the millions of atoms within asphalt, the COMPASSII force field can effectively adapt to the calculation of amorphous unit cell models of macromolecules. Therefore, this paper will use the COMPASSII force field to study the performance of asphalt. In order to avoid repeated calculations and reduce the calculation time of long-range electrostatics between molecules, half of the unit cell edge length is used as the cut-off. The long-range electrostatic effect is treated by the Ewald method, and the electrostatic energy is corrected by a uniform background charge density.
Assuming that the total number of molecules in each system does not exceed 104, the size of the simulation box is approximately 1200 Å, and five independent initializations are performed for each simulation. The time scale used for mean square displacement (MSD) fitting is limited to within 100 ns, and the slope of the regression equation adopts a two-sided interval with a confidence level of 90%.
2.3.2. Construction of Asphalt Molecular Model
In this paper, the Amorphous Cell module in the three-dimensional material science simulation software Materials Studio (MS) is used to establish an asphalt molecular model, and asphalt refers to a complex binder composed of hydrocarbons and their non-metallic derivatives with different molecular weights. Based on the component classification system that most closely approximates the actual composition of asphalt, the asphalt molecular model was developed through the integration of four key fractions: As (asphaltene), Ar (aromatic), S (saturate), and R (resin).
Artok et al. [14] performed nuclear magnetic resonance (NMR) tests on asphaltene, and the results showed that asphaltene contains a tiny quantity of short-branched chains along with a moderately-sized aromatic ring group, so the molecule presented in Figure 1a was opted for as a typical molecule of asphaltene. Greenfield et al. [15] used quantum chemical methods to optimize the calculation of resin and found that the basic structure of resin molecules is a layered structure molecule, which consists of substantial cyclic aromatic hydrocarbons and alicyclic hydrocarbons, so for representing resin, the molecule in Figure 1c was selected. Storm et al. [16] analyzed the asphalt components by small-angle X-ray scattering techniques, and the results demonstrated that the lengths of alkane molecule chains were distributed in the interval ranging from C16 to C36, and C22 was located exactly in the core of this interval. Kowalewski et al. [17] used a structural analysis program and a molecular simulation program to point out that the alkanes contained in asphalt have the highest content of C22H46, and the softening point and boiling point of C22H46 are the best match for the oil components in most asphalt, so the molecule shown in Figure 1e was opted for as a typical molecule of saturate. In addition, the number of aromatic rings and the linear hydrocarbon chains in 1,7-dimethylnaphthalene’s molecular structure exhibit a comparable quantity to the aromatic fractions of asphalt [18], so the molecule in Figure 1f was designated as the aromatic. Through systematic investigation of the oxidative aging mechanism in asphalt, ketone and sulfoxide groups are recognized as characteristic functional groups generated during asphalt oxidation, and the PAV aging process is typified by the introduction of reactive species to the regions in asphaltene and resin structural models that are prone to oxidation. For example, a ketone will be created when the hydrogen atom that was initially bonded in the direction of the benzyl carbon (the primary carbon atom bonded to the aromatic ring) is substituted by an oxygen atom, and a sulfoxide will be formed when adding oxides to sulfur atoms that are prone to oxidation. The models of PAV-aged asphaltene and resin are illustrated in Figure 1b and Figure 1d, respectively. In conclusion, the four-component-based molecular model of asphalt was successfully developed by MS 2023 software, as presented in Figure 1.
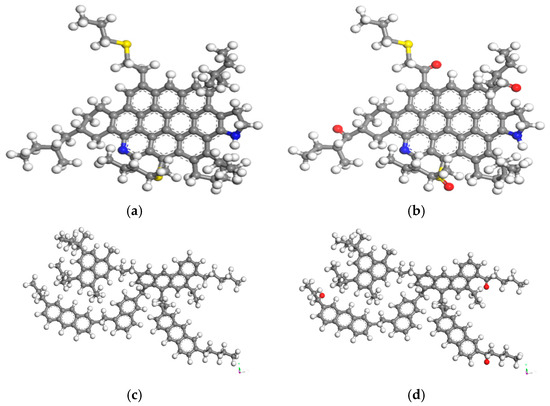
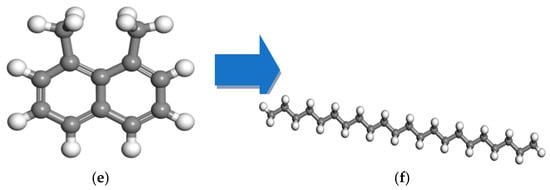
Figure 1.
Molecular simulation of asphalt components [6]: (a) asphaltene; (b) PAV-aged asphaltene; (c) resin; (d) PAV-aged resin; (e) saturate; (f) aromatic. (note: gray represents carbon atom, white represents hydrogen atom, blue represents nitrogen atom, yellow represents sulfur atom, red represents oxygen atom).
In accordance with the mass proportion between the components shown in Table 1, the ratio of quantity can be derived from the molecular formula of each component. The calculation result of the OA is As:R:S:Ar = 4:7:17:113 and As:R:S:Ar = 7:9:19:103 for the PA. The Amorphous Cell module was employed to create the relevant molecular model, and the initial density was specified as 0.1 g/cm3 in order to guarantee the random dispersion of molecules. Then, an NVT system with a duration of 300 ps (with the quantity of particles (N), the volume (V), and the temperature (T) within the system remaining constant) was applied to fully combine the molecules in the original asphalt model, and a 500 ps NPT system (with the number of particles (N), pressure (P), and temperature (T) in the system unchanged) was applied to shrink the system’s volume until the crystal cell attains a stable size, with the least amount of change observed at every time step. In this study, periodic boundary conditions are adopted for calculation to eliminate the boundary influence between asphalt molecules and effectively simulate the mutual miscibility process of asphalt molecules. The gap does not collapse under the barostatting, and the Z-periodicity is active.
To reduce the total energy of the asphalt’s molecular structure to the lowest attainable level, the Forcite module was used in order to execute 20,000 stages in the geometric optimization procedure iteration procedure, and the default level of accuracy was configured as Fine.
During the simulation of asphalt aging, four and three sites were modified on asphaltene and resin molecules, respectively. Based on the previous research results of the research team [6], through statistical analysis of the number of molecules in the reaction system, oxygen content, and the number of target chemical bonds, it was determined that when each index reaches a certain threshold, it can be judged that the asphalt reached the target oxidation level.
The iterative process was extended to validate the structural correctness, which finally developed the OA and PA models, as shown in Figure 2a,b.
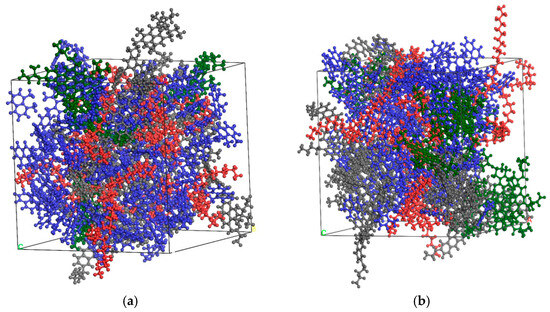
Figure 2.
Molecular model of asphalt [6]: (a) OA; (b) PA (note: red represents saturate, blue represents aromatic, green represents asphaltene, gray represents resin).
2.3.3. Construction of Rejuvenator Molecular Models
In this paper, the aged asphalt rejuvenator was prepared using WT as the base material. WT is generated through pyrolysis of woody biomass at increasing temperatures, with waste wood and bamboo serving as common raw materials. It has the characteristics of a wide source and provides economic and environmental protection. WT can be classified as an organic compound that is rich in alcohols, acids, and phenols [19]. Due to the complex composition, the typical molecules with relatively large contents were selected as its main molecular structure when constructing the molecular model of WT. Studies have shown [20] that bamboo-based WT is mainly composed of tetracosanoic acid, guaiacol, syringol, and phenolic aldehyde; its quality ratio is 47:19:23:11 and it possesses a density value of 1.15 g/cm3. To conduct comparative analysis, the EO, which has been refined using a petroleum distillate solvent and subsequently processed through a desolvent treatment, was employed as the control group, which was mainly composed of saturated alkanes and cycloalkanes along with aromatic hydrocarbons [21], with components in a mass ratio of 53:31:16 and presenting a density value of 0.92 g/cm3. The molecular models corresponding to the two rejuvenators can be seen in Figure 3.
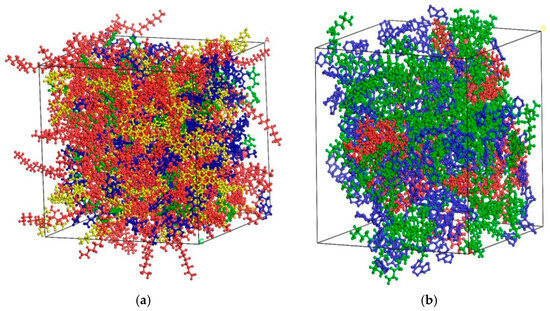
Figure 3.
Molecular models of rejuvenators [6]: (a) WT molecule; (b) EO molecule (note: in (a), red represents tetracosanoic acid, blue represents guaiacol, yellow represents syringol, green represents phenolic; in (b), red represents cycloalkane, blue represents aromatic hydrocarbon, green represents saturated hydrocarbon).
After the above modeling work was completed, a short run of 5 ns was adopted to test the feasibility of the simulation scheme to verify the effectiveness of parameters such as force-field selection, charging scheme, temperature, and dosage. The results show that the simulation scheme set up in this study is feasible.
2.3.4. Model Verification
To ensure that the aforementioned simulation methods and test parameters can provide accurate results for subsequent studies, it is necessary to verify the constructed molecular models first. Thermodynamic NPT simulations with a temperature of 298 K and a pressure of 1 atm at 500 ps were implemented for the molecular structure models of OA, PA, and rejuvenator described above, and the results obtained were compared with the measured data to verify the rationality and universality of the models constructed in this paper.
- (1)
- Density
Density is an important index of material, and the simulation results of density for each material are shown in Figure 4. With the change in intermolecular interaction, the density of each material increased greatly in the range of 5 to 70 ps and gradually stabilized afterwards. The density of the OA was stable at 0.98 g/cm3, the density of PA was stable at 1.08 g/cm3, the density of WT was stable at 1.15 g/cm3, and the density of EO was stable at 0.93 g/cm3. Comparing the density values obtained from the simulation with the measured densities shown in Table 4, it was found that the densities of the models constructed in this paper were all within a reasonable range.
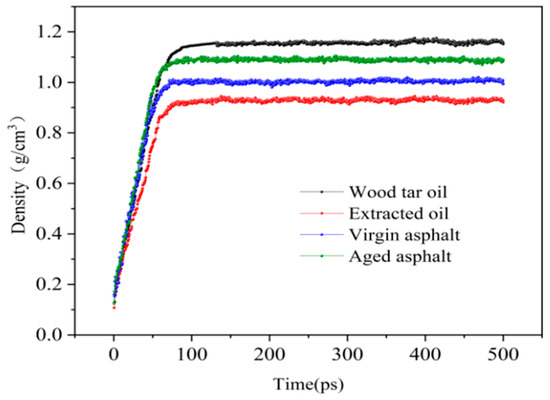
Figure 4.
Density curve of each material at 298 K.

Table 4.
Density of each material.
- (2)
- Cohesive energy density
The cohesive energy density characterizes the molecular interaction ability within the molecular model of asphalt by measuring the mutual attraction of molecules. The stronger the intermolecular forces per unit volume of the polymer, the tighter the bonding of the molecular chain segments, and the greater the ability to prevent deformation, resulting in the higher the elastic modulus of the molecule.
The solubility parameter is applicable for assessing the intermolecular interaction properties and determining the compatibility of two mixtures, thereby evaluating the fusion stability of asphalt and rejuvenator and judging the adsorption characteristics of the molecules within the asphalt system. The association of solubility parameters with cohesive energy density is shown in Equations (1) and (2):
where δ is the solubility parameter ((J/cm3)1/2), CED is internal cohesive energy density (108 J/m3), Ecoh is the total cohesive energy of the simulation model (J), V is the model volume (m3).
The data in Table 5 show that the simulated results of CED and solubility parameters of the molecular model of each material differed little from the measured data. When contrasted with the OA, the aged asphalt possesses a larger CED value; it implies that the forces of interaction and cohesion between the molecules in the aged asphalt are enhanced. This is due to the aging process of asphalt; lightweight components aggregate to form macromolecular substances, giving aged asphalt stronger polarity and increasing intermolecular interaction.

Table 5.
Cohesive energy density and solubility parameters for each material.
- (3)
- Mechanical property
From the knowledge of material mechanics, it is known that any system subjected to external forces will generate strain, which will result in an alteration of the relative locations of the particles within the system. The Mechanical Properties operation of Forcite module in MS software was used to apply stresses to the molecular models established in this paper in six directions: xx, yy, zz, yz, zx, and xy. The elastic stiffness matrix and stiffness coefficient of the models were analyzed, and the Young’s modulus, bulk modulus, and shear modulus of each material model were obtained. The simulation results are shown in Table 6.

Table 6.
Calculated values of mechanical parameters of each material.
As can be seen from Table 6, all mechanical parameters of the aged asphalt are slightly improved compared with the OA. For asphalt, Young’s modulus and bulk modulus are the characterizations of the deformation resistance of the established cell system under stress, while shear modulus is the capacity of the material system to withstand shear deformation under shear stress. Obviously, the deformation ability of the OA is weakened, the ductility is reduced, and the flexibility is weakened after long-term aging, but the shear resistance of the two is similar.
- (4)
- Surface free energy (SFE) and cohesive work (CW)
SFE refers to the work required to extract molecules from the surface of an object and create a new unit region. From an atomic point of view, the work required to extract a surrounding molecule from a material and create a new molecular surface is the SFE. Therefore, SFE can be used to measure the molecular interaction forces destroyed when a new surface is created. The SFE γ can be calculated from the surface area dA generated by the reversible work dW, and its calculation method is shown in Equation (3):
Based on the characteristics of the material model, this article calculates the SFE of the asphalt molecular model by dividing the difference in potential energy between the constructed amorphous cell and the thin film of asphalt with the same area by the equivalent surface area. The calculation method mainly reflects the SFE generated by the internal potential energy of the molecule, and its calculation method is shown in Equation (4):
where is the SFE (mJ/m2); and are the potential energy of the thin film asphalt molecular model and the amorphous bulk asphalt molecular model (mJ), respectively; A is the area of the generated new surface (m2).
Cohesion is the force of interaction between adjacent components within a material, and CW refers to the amount of work required to resist cohesion to divide a unit of material into two units. CW can be calculated by SFE. For asphalt materials, CW is an important indicator to characterize the cohesion of asphalt when internal damage occurs, and the calculation method is shown in Equation (5):
where is the CW (mJ/m2), is the SFE (mJ/m2).
For the purpose of calculating , the same amorphous cells with the same area and thickness of 1/10 were constructed, and the potential energy of molecules was simulated under the same conditions to figure out the SFE and CW of each asphalt in accordance with Equations (4) and (5), respectively, and the calculation results are shown in Table 7.

Table 7.
SFE and CW of each material.
As can be seen from Table 5, the simulated values of SFE and CW of each material are closer to the measured values, demonstrating that the material model established in this paper is more consistent with the actual situation. The SFE of aged asphalt is lower than that of OA, indicating that the aged asphalt requires less energy to form a new surface. Therefore, compared with the OA, the aged asphalt is more likely to crack, which is consistent with the actual situation.
3. Results and Discussion
3.1. Analysis of Contact Process Between Original and Aged Asphalt
The preparation process of rejuvenated asphalt is completed by adding a certain amount of rejuvenator to the aged asphalt and mixing at high speed. There are two processes of mechanical mixing and microscopic diffusion during this process, and the macroscopic experiments are not yet able to analyze the microscopic miscible process currently. MD can accurately and effectively simulate the contact process and microscopic miscible process in the production of rejuvenated asphalt.
3.1.1. Construction of Double-Layer Model of Rejuvenated Asphalt
By using the Build layer function in MS, the OA and the aged asphalt with rejuvenator were placed in the single cell with a 1 nm vacuum layer in the middle to ensure no contact between the aged and OA during the initial stage. Meanwhile, the OA and aged asphalt without rejuvenator were used as the control group. Three sets of double-layer models are shown in Figure 5.

Figure 5.
Double-layer model of original and aged asphalt in initial state [6]: (a) no rejuvenator; (b) EO; (c) WT (note: blue represents OA, red represents aged asphalt without rejuvenator, green represents aged asphalt with extracted oil rejuvenator (EOR), purple represents aged asphalt with WTR).
In the initial state, the OA and aged asphalt with rejuvenator are located on both sides of the vacuum layer, respectively, and relaxation is applied to each model so that the molecules of the whole model are in a relative equilibrium state. The relaxation process is as follows: Firstly, the NPT method is used for relaxation, with a pressure of 1 atm and a time step of 1 fs. After running 50,000 steps, the volume and density of the double-layer model will change continuously with the simulation. Then, the NVT method is used for relaxation, with a time step of 1 fs. After running 50,000 steps, the system’s pressure and energy will change continuously during the simulation. The simulation of molecular diffusion and full mixing is achieved by two relaxations, and the analytical model after relaxation is shown in Figure 6.

Figure 6.
Double-layer model of original and aged asphalt after relaxation [6]: (a) no rejuvenator; (b) EO; (c) WT. (note: blue represents OA, red represents aged asphalt without rejuvenator, green represents aged asphalt with EO, purple represents aged asphalt with WT).
3.1.2. Analysis of Contact Process of Rejuvenated Asphalt
When the distance between original and aged asphalt is large, the intermolecular forces are weak and only rely on mechanical stirring close to each other. As the components get closer together, the distance between the original and aged asphalt components in the double-layer model established above is only 1 nm, and the intermolecular forces have an impact on the proximity of the original and aged asphalt. Molecular simulation techniques allow a more precise study on the role played by the rejuvenator and intermolecular forces during the contact process between original and aged asphalt.
- (1)
- Density analysis of contact process
Studying the density change within the molecular system can effectively reflect the distribution of molecules within crystal cells. The volume of the molecular model does not change during the NVT stage, so the important stage for the density change is the NPT stage. In order to prevent the simulation temperature from being too low (below room temperature), which may cause the asphalt to become solid and affect the simulation of the contact process between asphalt and rejuvenator, the simulation temperatures proposed in this section are 298 K, 373 K, and 473 K, respectively. The NPT simulations under various temperatures were performed on the constructed molecular model of each material at 1 atm atmospheric pressure, and the results of density variation with temperature for each model were shown in Figure 7.
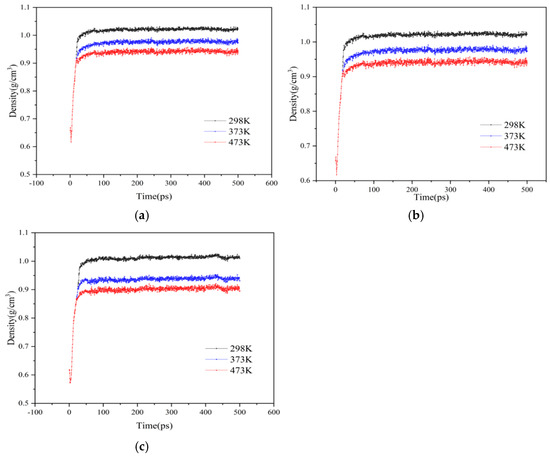
Figure 7.
Results of density analysis for each double-layer model of original and aged asphalt at different temperatures: (a) no rejuvenator; (b) EO; (c) WT.
As can be seen from Figure 7, the density change in each model experienced two stages. The first stage is the stage of rapid increase in density, in which the original and aged asphalt in the double-layer model are constantly close to each other, accompanied by the gradual compaction of components of the two asphalt, and the space on both sides continuously shrinks, resulting in a rapid increase in density. The second stage is the stage of mutual contact between the original and aged asphalt surfaces, some of the lighter components begin to miscible, and the density gradually stabilizes at this time. It can be seen that under the same pressure, with the increase in temperature, the lower the final stable density value of the system, the more fully the original and aged asphalt miscibility.
Furthermore, as shown in Figure 7a, when the temperature rises from 298 K to 373 K and from 373 K to 473 K, the decrease in the density of asphalt with no rejuvenator is approximately the same. But as shown in Figure 7b,c, when the temperature increases from 298 K to 373 K, the densities of EO and WT decrease by 8.74% and 6.8%, respectively; when the temperature increases from 373 K to 473 K, the decrease in both is 4.26% and 4.17%, respectively, indicating that the higher the temperature, the lower the density and the more complete the miscibility of asphalt containing rejuvenators.
Next, the density of each model at the same temperature is compared, and the results are shown in Figure 8.
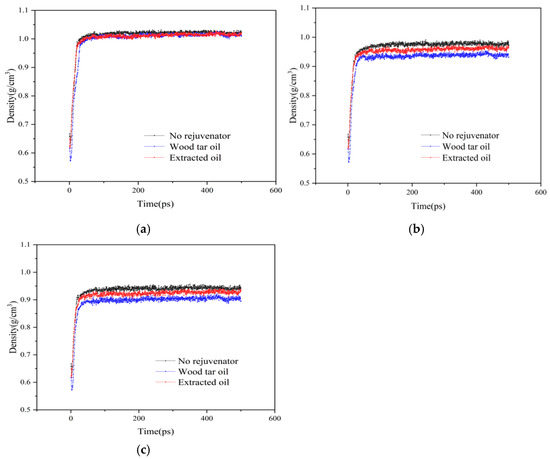
Figure 8.
Results of density analysis for each model at the same temperature: (a) 298 K; (b) 373 K; (c) 473 K.
As can be seen from Figure 8a, whether or not the rejuvenator is added at room temperature (298 K) has little effect on the miscible density of the model. It is obvious in Figure 8b that at 373 K, the density of the model with the addition of rejuvenator is obviously lower than that of the model without the addition of rejuvenator, and the density of the model with the addition of WTR is lower than that with the addition of EOR, indicating that the rejuvenator can promote the miscibility of the original and aged asphalt double-layer models under heating conditions, and the miscibility effect of the WTR surpasses that of the EOR. When the temperature rises to 473 K, the pattern shown in Figure 8c is consistent with 373 K.
The combination of Figure 7 and Figure 8 shows that the increase in temperature can effectively improve the miscibility of original and aged asphalt. Meanwhile, the rejuvenator can promote the miscibility effect only at a certain high temperature, and the ability of WTR to promote the miscibility effect is slightly stronger than that of the EOR.
- (2)
- Relative concentration analysis of contact process
The relative concentration is defined as the ratio of the number of atoms per unit volume in the direction perpendicular to the axis to the average number of atoms per unit volume with respect to the total volume. Its calculation is illustrated in Equations (6) and (7).
where and are the concentrations of the cultivate slab i and the entire crystal cell (mol/L), refers to the number of molecules present in the cultivate slab (mol), indicates the volume of the cultivating slab (cm3), represents the relative concentration.
In this study, the model is divided into infinite unit volumes of space along the X-axis direction (along the long side of the miscible model), and the relative concentration of the model is calculated separately along the Z-axis direction. After simulation by NPT and NVT systems, the trajectory files during the miscible process are obtained, which are brought into the calculation by Equations (4) and (5), and the concentration distribution curves of the original and aged asphalt miscible system along the Z-axis direction are obtained by the analysis function in the software, as shown in Figure 9.
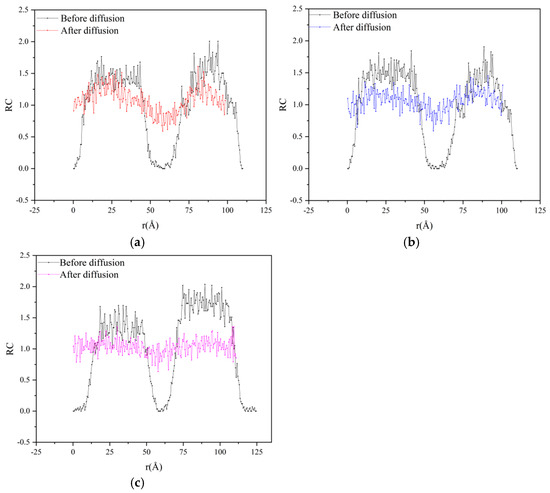
Figure 9.
Results of relative concentration analysis for each double-layer model of original and aged asphalt: (a) no rejuvenator; (b) EO; (c) WT.
As can be seen from Figure 9, before relaxation simulation, there are two obvious peaks in the concentration distribution curve of each model in the intervals of 10~40 Å and 70~110 Å, indicating that before relaxation simulation, the OA and the aged asphalt were distributed on both sides of the model without contact, so the relative concentration value at the depression between the two peaks was close to 0. After relaxation simulation, the relative concentration of the original depression rose to about 1.0, and the original peak area gradually flattened, and the corresponding concentration decreased to 1.0~1.4, indicating that the OA and the aged asphalt between the original two sides began to contact each other and miscible, filling the voids while causing the molecular concentration of the concentration area on both sides to decrease. The relative concentration along the Z-axis decreases after miscibility, resulting in a smaller model volume. By comparing Figure 9b,c, it can be known that taking the relative concentration value of 1.0 as the baseline, the relative concentration range of EOR is 0.85 and the variance is 0.0484; the relative concentration range of WTR is 0.74 and the variance is 0.0176, indicating that WTR has a better effect on the diffusion and fusion of original and aged asphalt, with the superiority degree increasing by 12.95%.
To compare the effects of different rejuvenators on the relative concentration of the models, the relative concentrations of different models at 373 K were compared, and the fitted concentration comparison plots were obtained by smoothing the values, as shown in Figure 10.
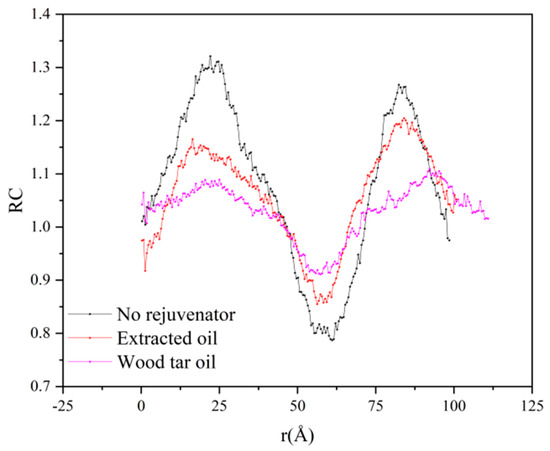
Figure 10.
Results of relative concentration analysis for each model.
As can be seen from Figure 10, the relative concentrations of the three different models showed obvious differences at the same temperature and time. The peak shape of the double-layer model without rejuvenator was more obvious than that of the model with rejuvenator, and the difference between the maximum and minimum relative concentration was about 0.55. The peak shape of the double-layer model with the addition of EOR was significantly flatter than that of the model without rejuvenator, and the difference between the maximum and minimum relative concentration was about 0.35. The peak shape of the double-layer model with the addition of WTR is the flattest, and the difference between the maximum and minimum relative concentration was about 0.15. It shows that, under the same temperature and time conditions, the addition of rejuvenator can effectively promote the diffusion between original and aged asphalt, and the diffusion effect of the WTR surpasses that of the EOR, and the improvement effect exceeds 15%.
- (3)
- Energy analysis of contact processes
In the process of molecular simulation, the configurational energy of the molecular system consists of two parts: bonding energy and non-bonding energy. Since the OA and the aged asphalt do not come into contact with one another at the start, the primary factor influencing the interaction between the two components is the non-bonding energy. The non-bonding energy consists of the van der Waals potential energy and the electrostatic potential energy described by the Lennard-Jones function [22], which are determined using the calculations illustrated in Equations (8) and (9).
where is the energy parameter (kJ/mol); is the distance between atoms i and j (nm); is the stable distance between atoms i and j, that corresponds to the minimum potential energy (nm), and are the charges number of atoms i and j (C); and ε is the dielectric constant (F/m). Through software calculations, the energy changes in each double-layer model during relaxation process are obtained as shown in Table 8 and Table 9.

Table 8.
Van der Waals potential energy of each model under different temperatures.

Table 9.
Electrostatic potential energy of each model under different temperature.
As can be seen from Table 8 and Table 9, the absolute values of and of each model decrease with the increasing temperature, indicating that the potential energy in each system decreases during the process of material contact and diffusion. From the perspective of energy exchange, the potential energy of the system is converted into kinetic energy between molecules with the increase in temperature, and the increase in kinetic energy facilitates the molecules getting rid of the intermolecular attraction. Therefore, the diffusive motion of molecules within the double-layer model is determined by the combination of Van der Waals force, electrostatic force, and molecular thermal motion. Existing research results have shown [23] that the intramolecular energy remains stable in the process of contact and diffusion, which means that the process of rejuvenating the aged asphalt by rejuvenator has no influence on the molecular thermal motion. It can also be seen from Table 4 and Table 5 that the van der Waals potential energy plays a more critical role in molecular diffusion compared to the electrostatic potential energy. In addition, the addition of rejuvenator can effectively reduce the van der Waals potential energy of aged asphalt, which is due to the rejuvenator being a polar molecule, and the effect of reducing the van der Waals potential energy is more obvious.
In order to investigate the mechanism of the effect of rejuvenator on the miscible process of original and aged asphalt, the interaction energy between original and aged asphalt in different double-layer models was calculated. represents the energy required for several individual systems to overcome intermolecular forces and merge into one system. The higher the value, the stronger the interaction between different molecular groups. The calculation of the value is shown in Equation (10).
where E is the energy of original and aged asphalt mixing system (kJ/mol), and are the system energy of original and aged asphalt in the original and aged asphalt mixing system, respectively (kJ/mol).
According to the data in Table 8 and Table 9, the interaction energy of each model at different temperatures was calculated according to Equation (8), and the results are illustrated in Figure 11.
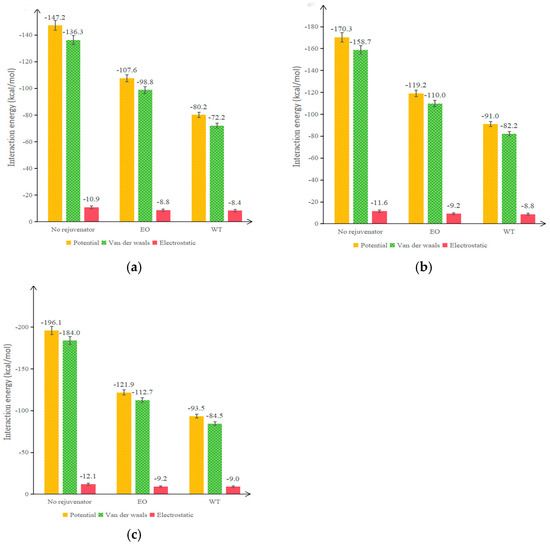
Figure 11.
Calculation results of interaction energy for each model at different temperatures: (a) 298 K; (b) 373 K; (c) 473 K.
When the interaction energy is negative, the two components attract each other; the larger the absolute value of interaction energy, the greater the attraction between components. As can be seen from Figure 11, whether at room temperature or high temperature, the addition of rejuvenator can significantly decrease the interaction energy between original and aged asphalt so that the attraction between the two is weakened. Although this may slow down the contact between original and aged asphalt, it also prevents the large molecules in the aged asphalt from attracting the light components in the OA and making the internal molecular distribution of the system uneven. The interaction energy between original and aged asphalt can be reduced so that the OA can be effectively miscible with the aged asphalt and uniformly distributed throughout the crystal cell.
By comparing different temperatures, it can be found that the interaction energy of each model increases with increasing temperature. However, the difference in interaction energy of the asphalt double-layer model without rejuvenator in the temperature ranges of 298 K~373 K and 373 K~473 K is 23.1 kJ/mol and 25.8 KJ/mol, respectively, while the corresponding difference in interaction energy of the asphalt double-layer model with EOR is 11.6 kJ/mol and 2.7 kJ/mol, respectively, and the corresponding difference in interaction energy of the asphalt double-layer model with WTR is 10.4 KJ/mol and 2.5 kJ/mol, respectively, which shows that the effect of rejuvenator on the diffusion effect is no longer obvious above 373 K. Taking Figure 11a,b as examples, when the temperature rises from 298 K to 373 K, the non-bonded energy, Van der Waals potential energy, and electrostatic potential energy of the asphalt with no rejuvenator increase by 15.69%, 16.43%, and 6.42%, respectively, and the corresponding values of EO are 10.78%, 11.34%, and 4.55%, respectively, and the corresponding values of WT are 12.90%, 13.85%, and 4.76%, respectively. Therefore, the effect of WTR on reducing the potential energy and interaction energy between original and aged asphalt is more significant.
At the same temperature, the effect of WTR on reducing the interaction energy of the double-layer model is better than that of EOR due to the higher polarity of WT [19,20]. Combining the data in Table 6 and Table 7, it can be seen that the van der Waals potential energy of aged asphalt is higher than that of OA, and the addition of rejuvenator can effectively reduce the van der Waals potential energy. Therefore, the main function of a rejuvenator in the rejuvenation process of aged asphalt is to reduce the van der Waals potential energy, thereby reducing the potential energy difference between original and aged asphalt and thus reducing their interaction energy.
3.2. Analysis of Miscible Process of Rejuvenated Asphalt
3.2.1. Construction of Rejuvenated Asphalt Model
The asphalt rejuvenation process is defined as the ability of the OA and the aged asphalt to mix homogeneously due to the effect of the rejuvenator, ultimately creating a new rejuvenated asphalt that possesses stable characteristics. Based on the contact model of original and aged asphalt established in the previous section, this section establishes the miscible model of rejuvenated asphalt. The Amorphous Cell functions were employed to create a model for rejuvenated asphalt that did not contain rejuvenator, and the molar ratio between the original matrix asphalt and the aged asphalt was 1:1. The initial density is configured as 0.1 g/cm3 to ensure that the component molecules of asphalt can be randomly distributed inside the unit cell, and the stability of the system energy is maintained by means of geometric optimization carried out over 20,000 steps. Then, by means of relaxing the NVT system, the rejuvenated asphalt is stirred more thoroughly to achieve uniform distribution. Finally, a stable asphalt model is formed by relaxing and compressing the NPT system. The miscible model of rejuvenated asphalt with the addition of EO and WTR with a mass ratio of 15% was also established as described above, and each model is shown in Figure 12.
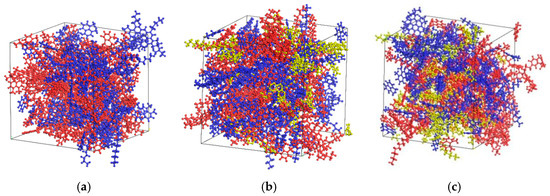
Figure 12.
Miscible model of each rejuvenated asphalt [6]: (a) no rejuvenator; (b) EO; (c) WT. (Note: Blue represents OA, red represents aged asphalt, and yellow represents rejuvenator).
3.2.2. Analysis of the Effect of Miscible Conditions on Properties of Rejuvenated Asphalt
At the end of the contact process, the surface of the original and aged asphalt components comes into contact, and intermolecular miscible diffusion occurs between the OA and the aged asphalt with rejuvenator. The new and old components blend with each other within the crystal cell, finally forming a miscible rejuvenated asphalt. Since macroscopic tests cannot reach the molecular domain, it is impossible to intuitively feel the miscible process of the rejuvenator. Molecular simulation techniques can accurately study the role played by rejuvenators and intermolecular forces in the miscible process of original and aged asphalt.
- (1)
- Effect of temperature
The diffusion coefficient was used to evaluate the effect of temperature on the diffusion rate of molecules in a rejuvenated asphalt system; it denotes the overall average speed at which molecules pass through a unit area when the concentration gradient remains the same. The mean square displacement (Å2) of the molecules in the model system is calculated by the Einstein equation, i.e., the MSD curve. The MSD curve depicts the variation in the molecular displacement magnitude with time during the molecular motion, which is calculated as shown in Equations (11) and (12).
where represents the starting position of the centroid of atom i, represents the position of the centroid of atom i at moment t, D represents the diffusion coefficient of particles in the model system (m2/s), N represents the quantity of molecules diffusing in the system (mol), the differential term represents the linear slope between mean square displacement and time, and the angle brackets represent the overall average of all atoms and all simulation times. Since the number of molecules N in the system is fixed, the obtained diffusion coefficient D is proportional to the mean square displacement MSD. Then, Equation (12) can be approximately simplified to Equation (13) when the linear relationship between the mean square displacement and time is good.
In this case, a represents the linear slope between the MSD and time. By utilizing the Forcite Analysis module of the MS software, calculations were carried out, and a series of trajectory files were derived. These trajectory files reflect the position data of molecules in the rejuvenated asphalt system at various time points, and the mean square displacement figures of the system over time can be analyzed according to the trajectory files. Since the rejuvenated asphalt contains both original and aged asphalt, the unaged asphaltene in OA and the aged asphaltene in aged asphalt were selected as representative substances for comparison. Two methods are used in the calculation process to ensure a good linear relationship between mean square displacement and time. The first is to eliminate the simulation time frame during which the energy and density variations in the system are excessively significant in the early phase of the relaxation process. At this time, the system fails to attain the equilibrium state, and the equilibrium state of the system is selected as the research period. The second is to screen the molecular trajectories of Brownian motion that are consistent with Einstein’s theory [21]; that is, the part with a slope of 1 was selected by the log-mean azimuthing displacement and log-time curve to exclude the influence of anomalous diffusion on molecules in asphalt models with a wide variety and complexity. The MSD fitting line was obtained by Origin linear fitting, and the slope of the fitting line was calculated according to Equation (13) for characterizing the diffusion coefficient.
The miscible process discussed in this section is based on the complete contact between asphalt and rejuvenator, and van der Waals forces are easily generated between the two. Meanwhile, to evaluate the diffusion rate of rejuvenated asphalt at low temperature, 273 K was added as the MSD analysis temperature based on the three research temperatures set in Section 3.1. The fitting results of MSD curves of original and aged asphalt in rejuvenated asphalt are shown in Figure 13 and Figure 14. It should be noted that the influence of temperature on MSD shows significant nonlinear characteristics.
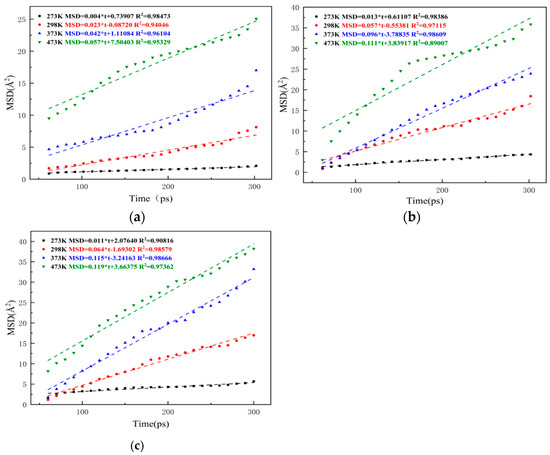
Figure 13.
Fitting results of MSD curves of OA in each rejuvenated asphalt: (a) no rejuvenator; (b) EO; (c) WT.
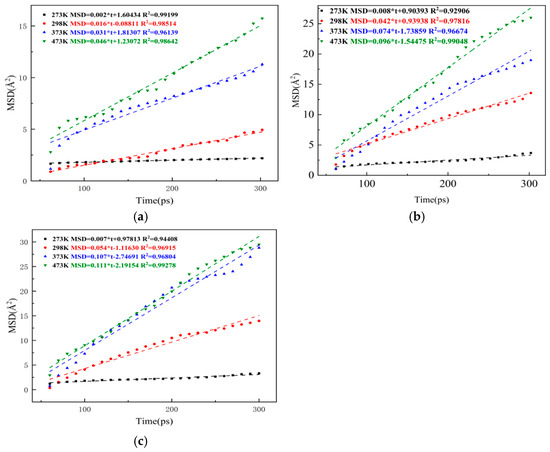
Figure 14.
Fitting results of MSD curves of aged asphalt in each rejuvenated asphalt: (a) no rejuvenator; (b) EO; (c) WT.
From Figure 13 and Figure 14, it can be seen that the MSD values show an increasing trend with the extension of simulation time, and the effect of temperature on molecular diffusion is very significant. At a low temperature of 273 K, the rejuvenator could only slightly increase the molecular diffusion rate, and its MSD curves are all very flat. At the room temperature of 298 K, although the asphalt is still in a solid state, the slope of the MSD curves of both original and aged asphalt in the rejuvenated asphalt is significantly increased, and the MSD curves of the rejuvenated asphalt with rejuvenator are steeper than those of the rejuvenated asphalt without rejuvenator. When the system temperature rises to 373 K, asphalt already has a certain degree of fluidity, and the slope of its MSD curves increases more obviously. Comparing the slopes of the MSD curves of three types of rejuvenated asphalt, it can be seen that the slopes of the fitted straight lines of extracted oil rejuvenated asphalt (EORA) and WTRA at 373 K are 0.054 and 0.063 higher than those of rejuvenated asphalt without rejuvenator and 0.043 and 0.076 higher than that of aged asphalt, which indicates that rejuvenator has a significant effect on promoting the uniform distribution of molecules in asphalt and the self-healing of cracks. When the system temperature increased to 473 K, the slope of the MSD curve of rejuvenated asphalt further increased, but compared with the temperature range of 298 K~373 K, the growth of the slope of the MSD curve in the temperature range of 373 K~473 K slowed down, which also indicates that the flowability of rejuvenated asphalt improves with the increase in temperature. However, the ability of the rejuvenator to promote the diffusion of internal molecules inside the rejuvenated asphalt is limited, and its effect is weakened with the increase in temperature, so the two rejuvenators have the best effect on improving the diffusion ability of the new-old asphalt systems at about 373 K. By comparing Figure 13 and Figure 14, it can be known that during the process when the temperature rises from 273 K to 473 K, the slope of EORA increased by 0.088, with an average increase of 0.022 per 50 K; the slope of WTRA increased by 0.104, with an average increase of 0.026 per 50 K, indicating that the miscibility effect of WT is better at the same temperature. Combining Figure 13 and Figure 14, it can also be found that the MSD values of the virgin bitumen are a little higher than those of the aged asphalt at the same time, which is similar to the results obtained from the experiment [24]. This is due to the fact that the relative molecular mass of the aged bitumen is larger than that of the OA, resulting in a stronger intermolecular attraction of the aged asphalt, thereby reducing the molecular movement rate. The diffusion coefficients of original and aged asphalt at different temperatures and in different models were calculated according to Equation (11), and the results are shown in Figure 15.
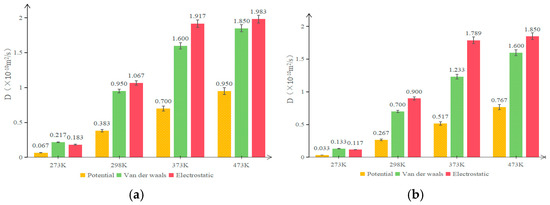
Figure 15.
Diffusion coefficients of original and aged asphalt in each rejuvenated asphalt: (a) OA component; (b) aged asphalt component.
As can be seen from Figure 15, the magnitudes of the diffusion coefficients of asphalt at room temperature and high temperature are roughly 10−11 m2/s and 10−10 m2/s, respectively, which coincide with the diffusion characteristics of conventional solid and liquid states. The diffusion coefficients of both original and aged asphalt in rejuvenated asphalt increased with temperature, and the diffusion coefficient of OA is higher than that of aged asphalt. Specifically, the diffusion coefficients of the aged asphalt components in rejuvenated asphalt without rejuvenator are reduced by 50.7%, 30.3%, 26.1%, and 19.3% at 273 K, 298 K, 373 K, and 473 K, respectively, compared to the OA components. Therefore, the difference in molecular diffusion ability between original and aged asphalt at normal temperature is obvious, and the difference in molecular diffusion ability between original and aged asphalt decreases as the molecular movement intensifies at high temperature.
Comparing the calculated results of the diffusion coefficients of the two types of rejuvenated bitumen containing rejuvenators, it can be seen that the diffusion coefficients of OA components in WTRA are -15.7%, 12.3%, 44.6%, and 15.6% higher than those of EORA at 273 K, 298 K, 373 K, and 473 K, respectively; The diffusion coefficients of aged asphalt components in WTRA are −12.0%, 28.6%, 44.6% and 15.6% higher than those of EORA at 273 K, 298 K, 373 K, and 473 K, respectively. Therefore, the rejuvenation performance of the EOR is marginally superior to that of the WTR. at low temperature, but at room temperature and above, the WTR exhibits a far more pronounced rejuvenation effect compared to the EOR. It also shows that the maximum difference is at 373 K, which is consistent with the conclusion drawn from the above MSD curves. In addition, both rejuvenators can increase the diffusion coefficient of aged components, indicating that rejuvenators accelerate the diffusion rate of aged macromolecular groups in the rejuvenated asphalt, thus achieving a uniform distribution of molecules in the rejuvenated asphalt and making it less susceptible to cracking.
- (2)
- Effect of rejuvenator type
The type of rejuvenator has a significant effect on the performance of rejuvenated asphalt, and the macroscopic performance recovery of aged asphalt is due to the presence of aromatic compounds lost in aged asphalt, which compensates for the disproportionate composition of aged asphalt and makes it close to the proportion of OA composition, thus achieving rejuvenation. But in reality, it is not the rejuvenator containing the most aromatic fraction that works best, because the compatibility of different rejuvenators with aged bitumen varies greatly. In this study, two rejuvenators, WT and EO, were taken for comparison to further investigate the effect of rejuvenator type on the performance recovery of aged asphalt.
Two parameters, the Flory-Huggins parameter χ and the mixing free energy , were used to evaluate the compatibility between rejuvenator and aged asphalt, which were calculated as shown in Equations (14) and (15).
where χ is the interaction factor; and are the solubility parameters of aged asphalt and rejuvenator (J/cm3)1/2, respectively; is the reference volume of polymer chain segments in asphalt with average repeating unit, taken as 1564 cm3/mol [10,25]; T is the temperature (K); R is the gas correlation constant, taken as 8.314 J/k·mol; is the mixing free energy (J); and are the molar number of aged asphalt and rejuvenator, respectively; and are the volume fractions of aged asphalt and rejuvenator, respectively.
The mixing free energy indicates the energy required to completely mix the two materials. When is negative, it indicates that energy is released from the mixing system and this phenomenon is thermodynamically spontaneous. The larger the absolute value of , the better the compatibility of the two materials. The temperature, volume fraction of the rejuvenator, and volume fraction of the aged bitumen were taken as 298 K, 0.1 and 0.9, respectively. The amount of each material was calculated according to the volume fraction and the mass proportion of each material in the mixing system, and the calculation results of solubility parameters were obtained according to the material model verification, as shown in Table 10.

Table 10.
value and value of aged asphalt and each rejuvenator.
Equation (15) showed that the χ value between the two materials is inversely proportional to the absolute value of their . According to Table 8, at 298 K, the interfusion between WT and aged asphalt is faster and better, and the rejuvenation effect on aged asphalt is better.
Considering the complex conversion relationship between the actual solubilities of asphalt and rejuvenator and the , and the need to take into account issues such as chemical equilibrium and reaction rate, the analysis of variance (ANOVA) method is adopted for the sensitivity analysis of solubility parameters. Specifically, temperature, volume fraction of rejuvenator, and volume fraction of aged asphalt were set as dependent variables at three levels, was set as the response variable, and a significance level of 0.05 was selected. The AVONA method was used to analyze the effects of each variable and interaction on . According to the F-value analysis, when F > Fr, it indicates that this factor is sensitive to the result, and vice versa. The AVONA analysis results are shown in Table 11.

Table 11.
AVONA analysis results.
As can be seen from Table 11, the F-values of temperature, volume fraction of rejuvenator, and volume fraction of aged asphalt are all greater than Fr, indicating that all the above factors have a significant impact on the , and the influence from largest to smallest is temperature, volume fraction of rejuvenator, volume fraction of aged asphalt, and interaction. Among them, the F-value of temperature is much higher than other factors, indicating that the most sensitive factor of is temperature.
For mixed systems, the compatibility level of the two materials can also be judged by the interaction energy. The interaction energy between the rejuvenator and the aged asphalt is negative, and the larger its absolute value, the better the compatibility between the two and the more closely the rejuvenator can adhere to the aged asphalt and avoid shedding. The van der Waals potential energy and electrostatic potential energy of the rejuvenator were calculated by molecular simulation according to Equations (8) and (9), respectively, and the results are shown in Table 12.

Table 12.
Potential energy of rejuvenator with a 15% dosage at 298 K.
According to the data in Table 12, the interaction energy of each rejuvenator was calculated separately according to Equation (10), and the results are illustrated in Figure 16.
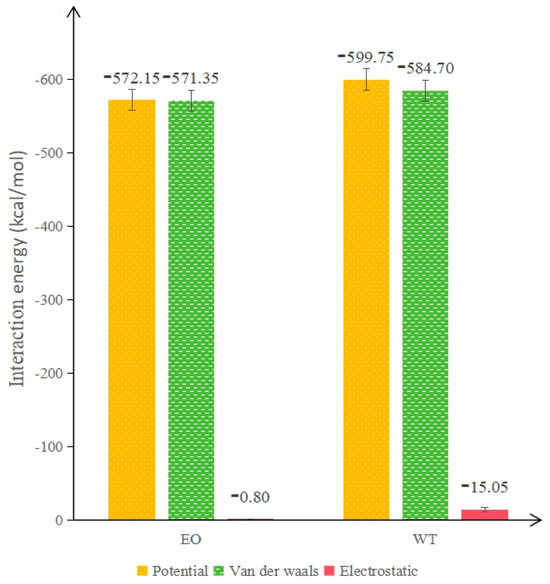
Figure 16.
Interaction energy of each rejuvenator.
As can be seen from Figure 16, the interaction between the rejuvenator and the aged asphalt is still dominated by van der Waals potential energy, and the interaction energy of the WTR is 27.6 kJ/mol higher than that of the EOR, and its relative value reached 4.85%, which proves that the compatibility between WTR and aged asphalt is better. The reason may be that the van der Waals forces between the aromatic compounds contained in WT and the polar molecules in aged asphaltene molecules are stronger; that is, the WT contains more polar molecules, and the orientation forces generated between the polar molecules strengthen the bonding effect. Meanwhile, the electrostatic potential energy of WTR is 14.25 higher than that of EOR, with a relative increase of over 1700%, thus offering better compatibility.
In summary, when selecting materials to make asphalt rejuvenator, in addition to the chemical composition of the materials themselves, two important factors need to be taken into account: One is the requirement that the rejuvenator can react spontaneously with asphalt, and the greater the mixing free energy released during the binding process, the more suitable the material is for the preparation of rejuvenator. Secondly, material with high van der Waals potential energy should be selected as far as possible to prepare the rejuvenator to enhance the interaction energy between the rejuvenator and aged asphalt and subsequently enhance the reciprocal attraction between the two entities.
- (3)
- Effect of rejuvenator dosage
Obviously, rejuvenator can effectively improve the performance of aged asphalt, but its optimal dosage is a problem worthy of study, and analysis of the variation in rejuvenator content is important to explore the action mechanism of rejuvenation. In this paper, the radial distribution function (RDF) is selected to analyze the aggregation state of rejuvenated asphalt molecules. RDF characterizes the probability of the appearance of other particles in the range of r around the selected particle, which can be used to characterize the aggregation of molecules in the model system. Its calculation is shown in Equation (16).
where g(r) is the radial distribution function, N represents the number of molecules in the whole rejuvenated asphalt, and r represent the model density (g/cm3) and the distance to the target molecule (Å), respectively.
For polymers, when g(r) = 1, the particles are uniformly distributed. When g(r) > 1 or g(r) < 1, it means that the probability of other particles appearing at that location tis higher or lower than that of a uniform distribution. In general, the radial distribution curve tends to have some maximum values, which means that the possibility of a target molecule emerging at these locations is higher than at other locations, indicating the phenomenon of molecular aggregation at that location. In this paper, the molecular models of OA-, PA- and WT-based rejuvenated asphalt with 0%, 5%, 15%, and 25% WTR dosage were selected for simulation at 298 K. The RDF curves of asphaltene–asphaltene, asphaltene–saturate, asphaltene–aromatic, and asphaltene-resin in each asphalt were obtained, as shown in Figure 17.
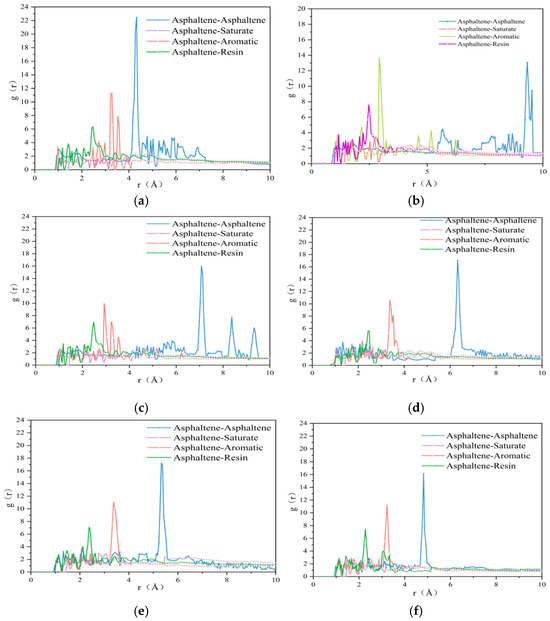
Figure 17.
RDF curves between different components of each asphalt: (a) OA; (b) aged asphalt: (c) 0 wt% rejuvenated asphalt; (d) 5 wt% rejuvenated asphalt; (e) 15 wt% rejuvenated asphalt; (f) 25 wt% rejuvenated asphalt.
As can be seen in Figure 17, the only peak between asphaltenes and asphaltenes in the OA (Figure 17a) occurs at 4.3 Å, so the asphaltene is in a state of aggregation. There are resin and aromatic molecules interspersed between asphaltene and asphaltene, and such a nano-aggregated structure is also the main reason for the formation of the asphalt gel structure [26]. After asphalt aging (Figure 17b), asphaltenes showed an obvious separation phenomenon, and the peak value of the RDF curve moved from 4.3 Å in the original state to 9.4 Å in the aggregation state, while the peak value decreased, demonstrating that asphalt aging weakens its aggregation state. The reason is that the ketone and sulfoxide functional groups formed by oxidation in aged asphaltene cause the asphaltene molecules to push away from each other [27], which is also the reason for hardness and brittleness of asphalt after aging. At this time, the distance between asphaltene molecules is extended, and hard components such as large molecules can diffuse to the surface to replace the soft components with small molecules, resulting in a decrease in asphalt penetration. However, due to the destruction of the gel structure of asphalt after aging [26], the internal core hard components are lost and the shear resistance is weakened; thus, the asphalt becomes brittle. Similar conclusions can be drawn by comparing the aggregation phenomena of aromatic components in Figure 17a,b, where the aromatic components move from a distance of 3.5 Å from the asphaltene to 3 Å with a higher peak after aging, indicating that along with the widening of the asphaltene spacing, aromatic components change from being attracted by multiple asphaltene molecules to being attracted to a single asphaltene molecule, and thus the aromatic components move closer to the aged asphaltene. This coincides with the phenomenon of aged asphaltenes absorbing lighter components to form larger molecular components in laboratory tests.
After asphalt rejuvenation, Figure 17c clearly shows that the asphaltene molecules move forward from 9.4 Å in the aged state to 6.6 Å, which also proves that the 1:1 miscibility of aged asphalt with OA can indeed help the aged asphalt to recover its once gel structure. However, from the aggregation of asphaltenes in the range of 8.2 Å to 9.1 Å, it can be seen that the aged asphaltenes are still separated from each other, and only the newly added original asphaltenes are at the position of 6.6 Å. After adding 5 wt% WTR (Figure 17d), the distance between asphaltene molecules moved from 6.6 Å to 6.3 Å, manifesting that the effect of 5 wt% WTR on restoring the gel structure of aged asphalt was not significant enough. However, the addition of rejuvenator obviously weakened the aggregation effect of asphaltenes except for the main peak, presumably because the WTR adhered to the aged asphalt and hindered the exclusive effect between the ketone and sulfoxide functional groups in the aged asphaltene. It follows that compared with the rejuvenated asphalt without rejuvenator, the non-bonded interaction occurs between the rejuvenator and the aged asphalt, which makes the aggregation phenomenon of aged asphaltenes inside the rejuvenated asphalt more similar to that of the original asphaltenes.
As shown in Figure 17d–f, the distance between asphaltene molecules gradually decreased with the increase in rejuvenator concentration, and the intermolecular distance of asphaltenes was 6.3 Å, 5.2 Å, and 4.8 Å when the content of WTR was 5 wt%, 15 wt%, and 25 wt%, respectively. As the increase in rejuvenator dosage is 10 wt%, the intermolecular distance of asphaltene molecules decreased by 1.1 Å and 0.4 Å in the range of 5 wt%~15 wt% and 15 wt%~25 wt%, respectively, which indicates that the optimal effect of 25 wt% WTR is achieved if the standard is to restore the gel state of aged asphalt. If the standard is the performance recovery efficiency per unit amount of rejuvenator, the rejuvenation efficiency of 15 wt% WTR is the highest. Considering the effects of cost control and component blending, it is recommended to use 15% as the optimal dosage for WTR in practical engineering.
4. Conclusions
In this paper, the molecular dynamics simulation software MS was used to simulate the process of rejuvenating aged asphalt with WTR. The miscible effect of rejuvenated asphalt is evaluated through relevant parameters and indicators, and the recovery mechanism of the service performance of aged asphalt is finally obtained. The main conclusions obtained are as follows:
- (1)
- In the contact process between original and aged asphalt, the addition of rejuvenator decreases the absolute value of interaction energy between original and aged asphalt molecules, and the attraction effect weakens, so that the original and aged asphalt molecules are evenly distributed inside the asphalt.
- (2)
- In the miscible process of original and aged asphalt components, 15 wt% WTR at 373 K can restore the performance of aged asphalt to the best based on the consideration of economic benefits.
- (3)
- The addition of WTR can increase the interaction energy between original and aged asphalt by 12.9%, reduce the Van der Waals potential energy of aged asphalt by 13.85%, and thus ensure the uniform distribution of internal molecules in rejuvenated asphalt.
- (4)
- 15 wt% WTR can reduce the intermolecular distance of asphaltenes from 9.4 Å to 5.2 Å, thereby alleviating the displacement effect during the asphalt aging process. The diffusion coefficients of WTRA at 298 K and 373 K are 28.6% and 44.6% higher than those of EORA, respectively; thus, WTRA has better crack resistance.
- (5)
- The main difference between the composition of WT and EO is the composition of the aromatic components. WTRA has a similar gel structure to the OA, which can alleviate the harder and brittle characteristics of the aged asphalt and exhibit the same physical properties as the OA.
- (6)
- The research results of this paper can guide physical rejuvenation projects to select appropriate rejuvenators based on local conditions, further optimize the composition design of rejuvenated asphalt binders and mixtures, and extend the service life of rejuvenated pavements. It is worth noting that all the asphalt models used for MD simulation in this paper are representative models, which still have a considerable gap from the actual asphalt. Moreover, due to the limitations of simulation duration and scale, there are inevitable errors in the research results. In the future, with the advancement of computer and simulation science, it will be necessary to further enhance simulation accuracy and conduct multi-scale simulations to obtain more accurate simulation and calculation results.
- (7)
- The most significant limitation of this paper lies in the lack of experimental binder verification under the studied temperatures and dosages. The research group will verify the accuracy of MD simulation through DSR-based rheology and SARA fraction measurements subsequently, thereby truly guiding the design and regulation of rejuvenated asphalt performance.
Author Contributions
Conceptualization, W.Y. and K.L.; methodology, Y.L.; validation, X.Y. and Y.L.; formal analysis, X.Y.; resources, W.Y.; writing—original draft preparation, X.Y.; writing—review and editing, K.L. All authors have read and agreed to the published version of the manuscript.
Funding
This research was funded by [the Natural Science Foundation Project of Hunan Province, China] grant number [2025JJ70647].
Institutional Review Board Statement
Not applicable.
Informed Consent Statement
Not applicable.
Data Availability Statement
All data were contained in the main text.
Conflicts of Interest
Author Xiaozhuo Yan was employed by the company Weekee Planning and Design Co., Ltd. The remaining authors declare that the research was conducted in the absence of any commercial or financial relationships that could be construed as potential conflicts of interest.
Nomenclature
| Abbreviations | Full name |
| MD | Molecular dynamics |
| MS | Materials Studio |
| OA | 70# matrix petroleum asphalt |
| PA | PAV aged asphalt |
| WT | Wood tar |
| WTR | Wood tar rejuvenator |
| WTRA | Wood-tar-rejuvenated asphalt |
| EO | Extracted oil |
| EOR | Extracted oil rejuvenator |
| EORA | Extracted oil rejuvenated asphalt |
| CED | Cohesive energy density |
| SFE | Surface free energy |
| CW | Cohesive work |
| MSD | Mean square displacement |
| RDF | Radial distribution function |
References
- Li, Q.; Zeng, X.; Wang, J.; Luo, S.; Meng, Y.; Gao, L.; Wang, X. Aging performance of high viscosity modified asphalt under complex heat-light-water coupled conditions. Constr. Build. Mater. 2022, 325, 126314. [Google Scholar] [CrossRef]
- Liu, K.; Zhang, X.; Jiang, K.; Wu, C. Durability of wood tar-based rejuvented asphalt mixture. Highway 2021, 66, 308–312. [Google Scholar]
- Zahoor, M.; Nizamuddin, S.; Madapusi, S.; Giustozzi, F. Sustainable asphalt rejuvenation using waste cooking oil: A comprehensive review. J. Clean. Prod. 2021, 278, 123304. [Google Scholar] [CrossRef]
- Petersen, J.C.; Glaser, R. Asphalt oxidation mechanisms and the role of oxidation products on age hardening revisited. Road Mater. Pavement Des. 2011, 12, 795–819. [Google Scholar] [CrossRef]
- Yao, X.; Wang, Y.; Xu, T. Development on recycling, aging simulation and regeneration methods of reclaimed styrene-butadiene-styrene modified asphalt. J. Clean. Prod. 2021, 312, 127767. [Google Scholar] [CrossRef]
- Xu, L.; Gong, G.; Zeng, D.; Li, Y.; Chen, X.; Liu, K.; Li, Q. Analysis of the interfacial interaction between wood tar-rejuvenated asphalt and aggregate based on molecular dynamics simulation. Coatings 2024, 14, 905. [Google Scholar] [CrossRef]
- Gao, Y.; Tian, W.; Zhu, J.; Liao, M.; Xie, Y. Study on compatibility mechanism of plasticizer and asphalt based on MD. Mater. Des. 2023, 228, 111827. [Google Scholar] [CrossRef]
- Gao, Y.; Xie, Y.; Liao, M.; Li, Y.; Zhu, J.; Tian, W. Study on the mechanism of the effect of graphene on the rheological properties of rubber-modified asphalt based on size effect. Constr. Build. Mater. 2023, 364, 129815. [Google Scholar] [CrossRef]
- Fallah, F.; Khabaz, F.; Kim, Y.R.; Kommidi, S.R.; Haghshenas, H.F. MD modeling and simulation of bituminous binder chemical aging due to variation of oxidation level and saturate-aromatic-resin-asphaltene fraction. Fuel 2019, 237, 71–80. [Google Scholar] [CrossRef]
- Zadshir, M.; Oldham, D.J.; Hosseinnezhad, S.; Fini, E.H. Investigating bio-rejuvenation mechanisms in asphalt binder via laboratory experiments and MD simulation. Constr. Build. Mater. 2018, 190, 392–402. [Google Scholar] [CrossRef]
- Ren, S.; Liu, X.; Lin, P.; Gao, Y.; Erkens, S. Insight into the compatibility behaviors between various rejuvenators and aged bitumen: MD simulation and experimental validation. Mater. Des. 2022, 223, 111141. [Google Scholar] [CrossRef]
- JTG E20-2011; Test Procedure for Bitumen and Bitumen Mixture for Highway Engineering. China Communications Press: Beijing, China, 2011.
- GB/T 1632-93; Determination of Viscosity Number and Limiting Viscosity Number of Polymers in Dilute Solution. China Standards Press: Beijing, China, 1993.
- Artok, L.; Su, Y.; Hirose, Y.; Hosokawa, M.; Murata, S.; Nomura, M. Structure and reactivity of petroleum-derived asphaltene. Energy Fuels 1999, 13, 287–296. [Google Scholar] [CrossRef]
- Greenfield, M.L. Molecular modelling and simulation of asphaltenes and bituminous materials. Int. J. Pavement Eng. 2011, 12, 325–341. [Google Scholar] [CrossRef]
- Storm, D.A.; Sheu, E.Y.; DeTar, M.M. Macrostructure of asphaltenes in vacuum residue by small-angle X-ray scattering. Fuel 1993, 72, 977–981. [Google Scholar] [CrossRef]
- Kowalewski, I.; Vandenbroucke, M.; Huc, A.Y.; Taylor, M.J.; Faulon, J.L. Preliminary results on molecular modeling of asphaltenes using structure elucidation programs in conjunction with molecular simulation programs. Energy Fuels 1996, 10, 97–107. [Google Scholar] [CrossRef]
- Su, M.; Zhang, H.; Zhang, Y.; Zhang, Z.P. Miscibility and mechanical properties of SBS and ashpalt blends based on MD simulation. J. Chang. Univ. 2017, 37, 24–32. [Google Scholar]
- Li, Y.; Lin, H. Comparative study on capillary gas chromatographic analysis of organic components of wood vineger and water-extract of wood-tar prepared from hard wood barks. J. Anal. Sci. 2012, 28, 58–62. [Google Scholar]
- Fagernäs, L.; Kuoppala, E.; Tiilikkala, K.; Oasmaa, A. Chemical composition of birch wood slow pyrolysis products. Energy Fuels 2012, 26, 1275–1283. [Google Scholar] [CrossRef]
- Robbins, W.K.; Hsu, C.S. Petroleum, composition. Kirk-Othmer Encycl. Chem. Technol. 2000. [Google Scholar] [CrossRef]
- Lin, Y.J. MD Study of Diffusion Behavior of Virgin and Recycled Asphalt Binder. Master’s Thesis, Southeast University, Dhaka, Bangladesh, 2019. [Google Scholar]
- Xu, M. Analysis of the Diffusion of Rejuventor into Asphalt Based on the, M.D. Simulation. Ph.D. Thesis, Harbin Institute of Technology, Harbin, China, 2015. [Google Scholar]
- Wu, J.; Liu, Q.; Yang, S.; Oeser, M.; Ago, C. Study of migration and diffusion during the mixing process of asphalt mixtures with RAP. Road Mater. Pavement Des. 2021, 22, 1578–1593. [Google Scholar] [CrossRef]
- Yang, J.; Gong, X.; Wang, G. Compatibility and mechanical properties of BAMO–AMMO/DIANP composites: A MD simulation. Comput. Mater. Sci. 2015, 102, 1–6. [Google Scholar] [CrossRef]
- Lian, H.; Lin, J.R.; Yen, T.F. Peptization studies of asphaltene and solubility parameter spectra. Fuel 1994, 73, 423–428. [Google Scholar] [CrossRef]
- Xu, G.; Wang, H. MD study of oxidative aging effect on asphalt binder properties. Fuel 2017, 188, 1–10. [Google Scholar] [CrossRef]
Disclaimer/Publisher’s Note: The statements, opinions and data contained in all publications are solely those of the individual author(s) and contributor(s) and not of MDPI and/or the editor(s). MDPI and/or the editor(s) disclaim responsibility for any injury to people or property resulting from any ideas, methods, instructions or products referred to in the content. |
© 2025 by the authors. Licensee MDPI, Basel, Switzerland. This article is an open access article distributed under the terms and conditions of the Creative Commons Attribution (CC BY) license (https://creativecommons.org/licenses/by/4.0/).