Article

Effect of Nitrogen Ratio in Sputtering on the Quality of Film Formation and Electron Emission Properties of Nitride Films

by
Yuqing Gu
1,
Juannan Li
1,
Dan Wang
2,* and
Na Zhang
3
1
School of Artificial Intelligence and Big Data, Chongqing Industry Polytechnic College, Chongqing 401120, China
2
School of Microelectronics, Xi’an Jiaotong University, Xi’an 710049, China
3
National Key Laboratory of Science and Technology on Space Microwave, China Academy of Space Technology (Xi’an), Xi’an 710100, China
*
Author to whom correspondence should be addressed.
Coatings 2025, 15(1), 55; https://doi.org/10.3390/coatings15010055
Submission received: 8 December 2024 / Revised: 20 December 2024 / Accepted: 3 January 2025 / Published: 6 January 2025
(This article belongs to the Special Issue Advanced Nanostructured Coatings Deposited by Magnetron Sputtering)

Abstract

:
Nitride films such as tantalum nitride (TaN), titanium nitride (TiN) and boron nitride (BN) are widely used in aerospace and vacuum electronics. The electron emitting properties of these nitride films are of great interest due to the phenomenon of surface electron emission when the films are irradiated, leading to surface modification. In this study, we have prepared three kinds of thin films, TaN, TiN and BN, by sputtering. Then the effect of the nitrogen component on the film formation quality and the dependence of the electron emission coefficient (EEC) on the film’s physical properties were investigated. The results of elemental analysis show that by rising the nitrogen gas flow during sputtering, the N elemental ratios inside the TaN and TiN films can be increased, and the film resistivity decreases follow, while BN films do not show such a tunable characteristic of the elemental ratios or resistivity. The conductivity test results show that TaN and TiN films exhibit conductive properties like those of semiconductor materials. The proportion of N elements inside the films has a significant effect on the film conductivity, namely, the conductivity of the film shows an upward trend with the increase in the proportion of N elements. The EEC test shows that TaN and TiN films with good conductive properties have relatively low EEC values, which are generally lower than 2.10. For TaN and TiN, the test results show that the EEC decreases with the increase of the conductivity. The EEC peak values are 1.92 and 1.56 for TaN and TiN films when their resistivities are 1.45 × 10⁻⁵ Ω·m and 7.26 × 10⁻⁶ Ω·m, respectively. The EEC values of BN are larger than TaN and TiN, with an EEC peak value higher than 2.49, and the electron energy to obtain the peak value is about 250 eV. The results are instructive for revealing the electron emission regularity of nitride thin films.

1. Introduction

Nitride films have a wide range of industrial applications due to their excellent physical and chemical properties. For instances, transition elements of nitrides, known as metal-type nitrides, own excellent physical properties like high hardness, a high melting point and high chemical stability. Tantalum nitride (TaN) and titanium nitride (TiN) are two typical transition metal nitrides. Therefore, TaN has applications in micro electromechanics and energy harvesting [1,2,3,4], and titanium nitride (TiN) is widely used in electronics and functional coatings [5,6,7]. Unlike TaN and TiN, boron nitride (BN) ceramic possesses a covalent structure, known as covalent nitrides, and is generally very stable, so BN has some superiority in microelectronics and optical devices [8,9]. In addition, parts of nitride films play an important role in vacuum systems and vacuum electronic devices involving particle motion processes. For example, TiN shows a poor ability in secondary electron emission, so it can be used in particle accelerators to reduce the risk of the electron cloud effect [10,11]. In addition, in space high power microwave systems, TiN films can be used as functional layers to significantly reduce the electron emission coefficient (EEC), further reducing the risk of discharge induced by secondary electron avalanche [12,13]. BN, as a typical ceramic with a low sputtering rate, can be used as a material for the discharge chamber of the thruster, and has the characteristics of a small oscillation and stable amplitude of the discharge current in the discharge chamber [14,15,16]. In the devices or systems involving particle motion, the EEC of functional ceramics or functional coatings is an important covariate that affects the performance of the system in many aspects; therefore, research on the electron emission properties of nitride materials is needed. From above discussion, we know that the EEC characteristics of various materials are of significant distinctions, and for different working occasions, the suitable materials ought to possess a certain EEC level to match the working environment [17,18,19,20].
In the past few decades, the electron emission properties of TiN and BN have received a lot of attention since the secondary electron emission in applied systems may lead to some reliability problems. For TiN functional films, scholars have worked to seek its application in mitigating discharges induced by secondary electron avalanche. During 1990s~2000s, Michizono et al. systematically researched the reliability issues (including surface charging, flashover and multipacting) of alumina ceramic used in radio-frequency dielectric windows [21,22,23,24,25], and finally, they demonstrated the practical value of TiN functional coating in suppressing electron emission [25]. In 2007, Montero et al. reported a kind of TiN:O film with the extraordinary property of low EEC [26]. Therefore, by employing the treatment of Ar+ cleaning, carbon ion implantation and high temperature annealing, the TiN:O film showed an EEC below 0.97. Also in 2007, Ruiz et al. achieved the fabrication of TiN film with an ultralow EEC, and they researched the dependence of the EEC on storage duration [27]. In the work, the mechanism that the EEC of TiN films increased with extending the storage duration was revealed, and the EEC of TiN became stable after 59 days’ exposure had been demonstrated. In terms of TaN, although there are few reports on its electron emission properties, since TaN has similar physical properties to TiN, we expected that TaN would also exhibit a unique EEC regularity. Therefore, in this work, we also investigate the EEC for TaN, and see whether it can be used in certain applications involving electron emission. As for BN, its EEC property is of great significance since it is always utilized in Hall thrusters as a support material for discharge channels. The previous literature has demonstrated that the power losses of thruster wall material decreased as the inner wall material’s EEC decreased [28,29], further leading to higher propulsion efficiency. In 2023, Yao et al. reported the EEC characteristics of BN bulk and explored the effect of constructing microstructures on the surface EEC of the bulk surface, achieving an effective reduction in the surface EEC of BN bulk [30]. In 2024, Lian et al. achieved an EEC of less than 1 by plating a TiN film on the microstructured BN surface [31]. In addition, they verified the regularity of the charge accumulation effect for the BN surface on the EEC by simulation. Even so, research on the properties of the EEC in a wide range of scenarios is sorely lacking and requires further in-depth study since the EEC affects the discharge characteristics in many occasions for various vacuum structures, devices and systems [28,32,33]. For systems applying nitride as a functional layer and involving an electron emission process, the electron emission properties of the surface for the nitride functional layer need to be further investigated.
In this work, we prepared TaN, TiN and BN thin films by sputtering process and investigated their electron emission properties. By the adjustment of N2 partial pressure during sputtering, we quantified the effects of gas flow of N2 on the quality of film formation, and we evaluated the composition of the prepared three kinds of films. By measuring the surface EEC, positive correlation between film resistivity and the EEC is evaluated for TaN and TiN. At the same time, the physical properties and EEC of the BN films were measured and shown to be of a completely different regularity compared to TaN and TiN films.

2. Experimental Methods

2.1. Film Preparation by Magnetron Sputtering

Compared with other thin film deposition processes, magnetron sputtering is characterized by low cost, convenient operation and easy control of experimental parameters. The disadvantages of magnetron sputtering are that it is not possible to precisely control the thickness of film growth as in atomic layer deposition, and the stair coverage of sputtered coatings is poor for the surfaces of micro- and nanostructures. In this experiment, we applied the advantage of easy control of the reaction gas for magnetron sputtering, which is very effective for the preparation of oxide and nitride thin films, especially for researching the effect of the ratio of O and N elements in the films on the physical properties of the films. This work focuses on nitride films, so by controlling the ratio and flow rate of N2 during the sputtering process, it is possible to achieve control of the ratio of the N element during film formation.
In the preparation experiments, thin film deposition was carried out using radio frequency magnetron sputtering. The high-resistivity intrinsic monocrystalline silicon wafers of 2 inches are utilized as substrates (crystal orientation 100, resistivity higher than 1 × 10⁴ Ω·m). All silicon substrates were sequentially cleaned with acetone, alcohol and ultrapure water to remove possible contaminants from the substrate surface. The sputtering source used in the experiments was a circular flake compound target (76.2 mm in diameter and 5 mm in thickness), and the purity of the TaN, TiN and BN targets was 99.99%. Prior to the experiment, the gas in the sputtering chamber needs to be pumped to less than 3 × 10⁻⁴ Pa to minimize the influence of other residual gases on the sputtering process. High-purity argon (Ar, 99.999%) was used as the working gas for ionization. At the same time, to modulate the proportion of elemental N in the film layer, we introduced different flow rates of high-purity nitrogen (N2, purity 99.999%) as the reaction gas according to the different experimental conditions. During the sputtering process, two gas flow meters were used to control the flow of Ar and N2 in the chamber. During the sputtering process, the substrates were not heated, the sputtering time was 120 min and the gas pressure in the chamber was controlled at 1.2 Pa by controlling the gas out–in balance. In the experiments, the sputtering power of TaN and TiN was 100 W, the sputtering power of BN was 80 W, the gas flow rate of Ar was set at 15 sccm and the flow rate of N2 was set at 0 sccm, 7 sccm and 14 sccm according to the plan, respectively.

2.2. Physical Characterization

In the characterization experiments, the surface morphology and the cross-sectional images of the prepared film samples were characterized using a scanning electron microscope (SEM, Zessi Gemini 500, Oberkochen, Germany). The information about the film thickness can be read out from the SEM images of the sample cross-section. For the characterization of the surface element composition of the fabricated BN film, X-ray photoelectron spectroscopy (XPS, made by Thermo Fisher, ESCALAB Xi+, Waltham, MA, USA) was employed. In order to obtain the resistivity of the film, firstly, we obtain the square resistance RS of the film by four-probe test, and then we combine it with the thickness t obtained from the SEM observation of the film cross-section, and then, the resistivity of the film can be calculated by the following equation:
film resistivity = RS × t,

2.3. Electron Emission Coefficient Characterization

A self-developed EEC measurement system [34] equipped with two neutralization guns is employed to finish the EEC measurements for all sputtered nanofilms. Here, the exact principle of the EEC measurement method can be illustrated as follows. The EEC is defined as the ratio of secondary electrons to incident electrons, and the EEC is usually calculated by measuring the electron emission current and primary electron current due to the difficulty of counting the number of electrons. The system uses a three-gun neutralization method for EEC testing, where two neutralization guns are set up in addition to the primary electron gun to remove the surface charge. Before the test starts, the neutralization guns 1 and 2 are at the same potential with the sample holder. At the beginning of the test, the primary electron gun emits electrons, and at the same time, completes the detection of the primary electron current. Then, the neutralization guns 1 and 2 are turned on, and at this time, if the sample surface accumulates a positive charge, due to the existence of a potential difference, the neutralization guns 1 and 2 automatically emit electrons to carry out the neutralization. On the contrary, if the surface accumulates negative charge, the cathode of the neutralization guns 1 and 2 is lower than the sample surface and cannot emit electrons. In this case, the neutralization gun 2 obtains a bias voltage (about 300 V); at this time, the electron beam emitted by the neutralization gun 2 bombards the surface, and the positive charge generated on the surface can neutralize the accumulated electrons. After the electrons on the sample surface are neutralized, the negative bias applied on the neutralizing gun 2 is withdrawn, and the residual positive charge on the surface is neutralized again by the neutralizing guns 1 and 2. After completion, the sample surface is at the same potential as the sample primary state, and the neutralizing guns 1 and 2 are stopped. Then, the EEC test at the next energy point is started. During the test, the detected currents include two kinds of currents: the sample current IS and the collector current IC. According to Kirchhoff’s current law, the sum of the two kinds of currents is the primary electron current IP, and the current of the collector is the electron emission current. On the basis of the measurements to obtain the two kinds of currents, it is possible to use Equation (2) to carry out the EEC calculation:
EEC = IC/IP = IC/(IC + IS),

3. Results and Discussion

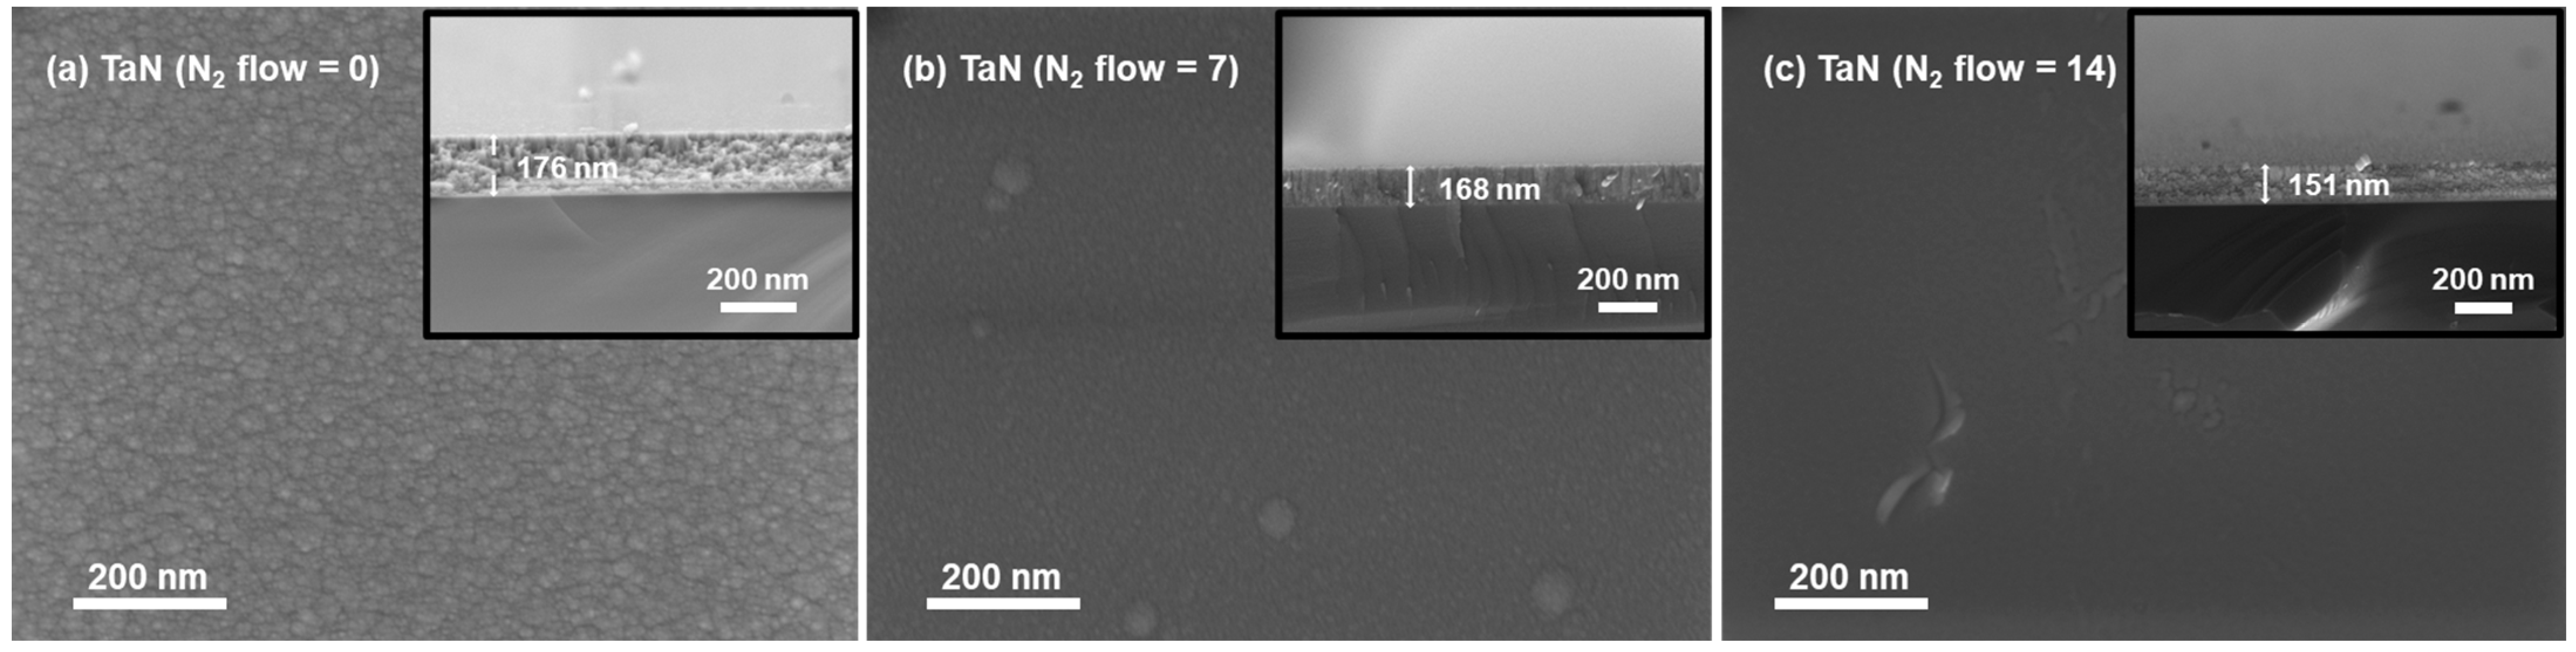
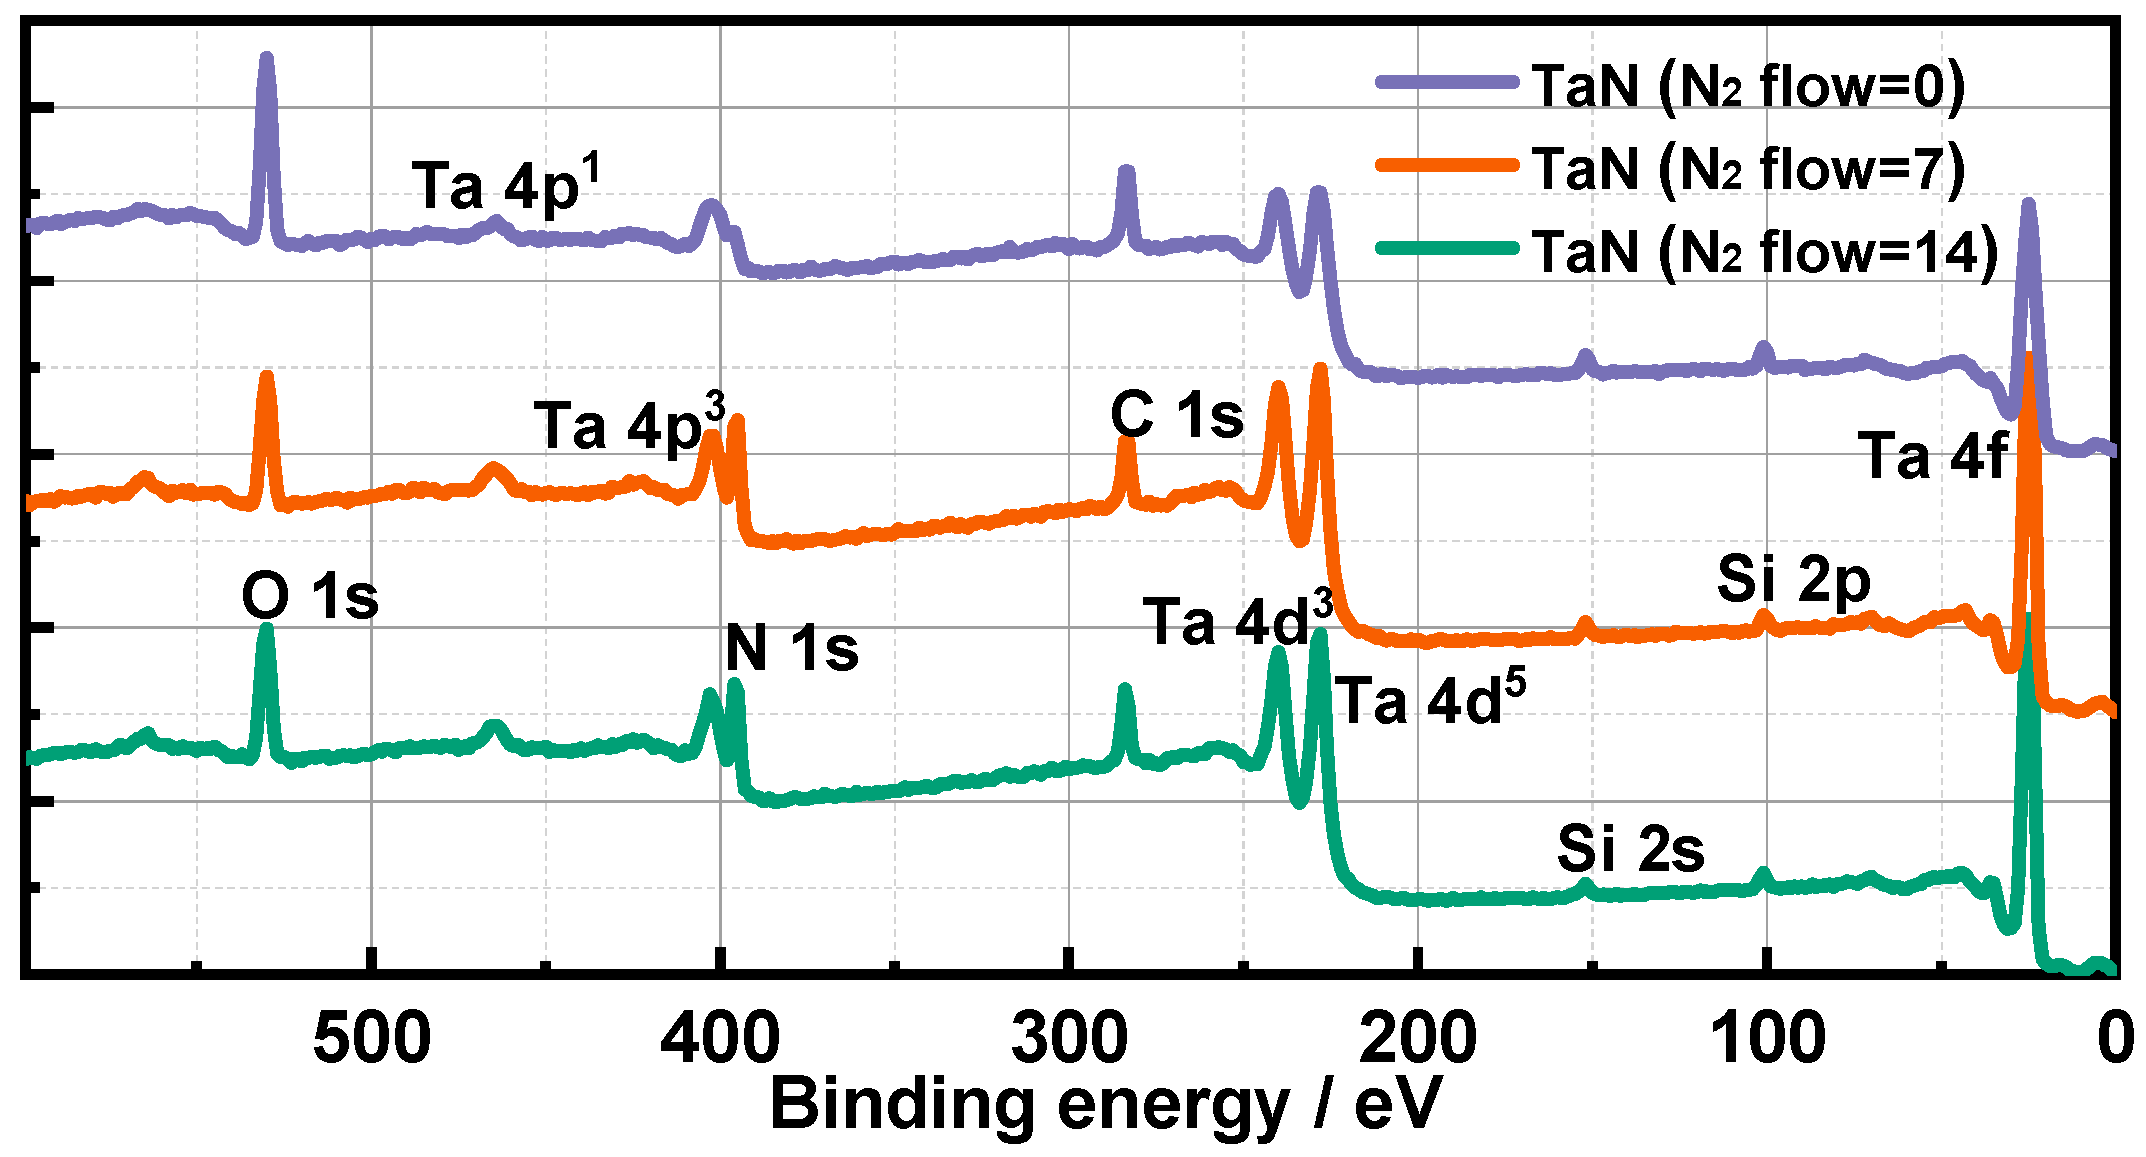
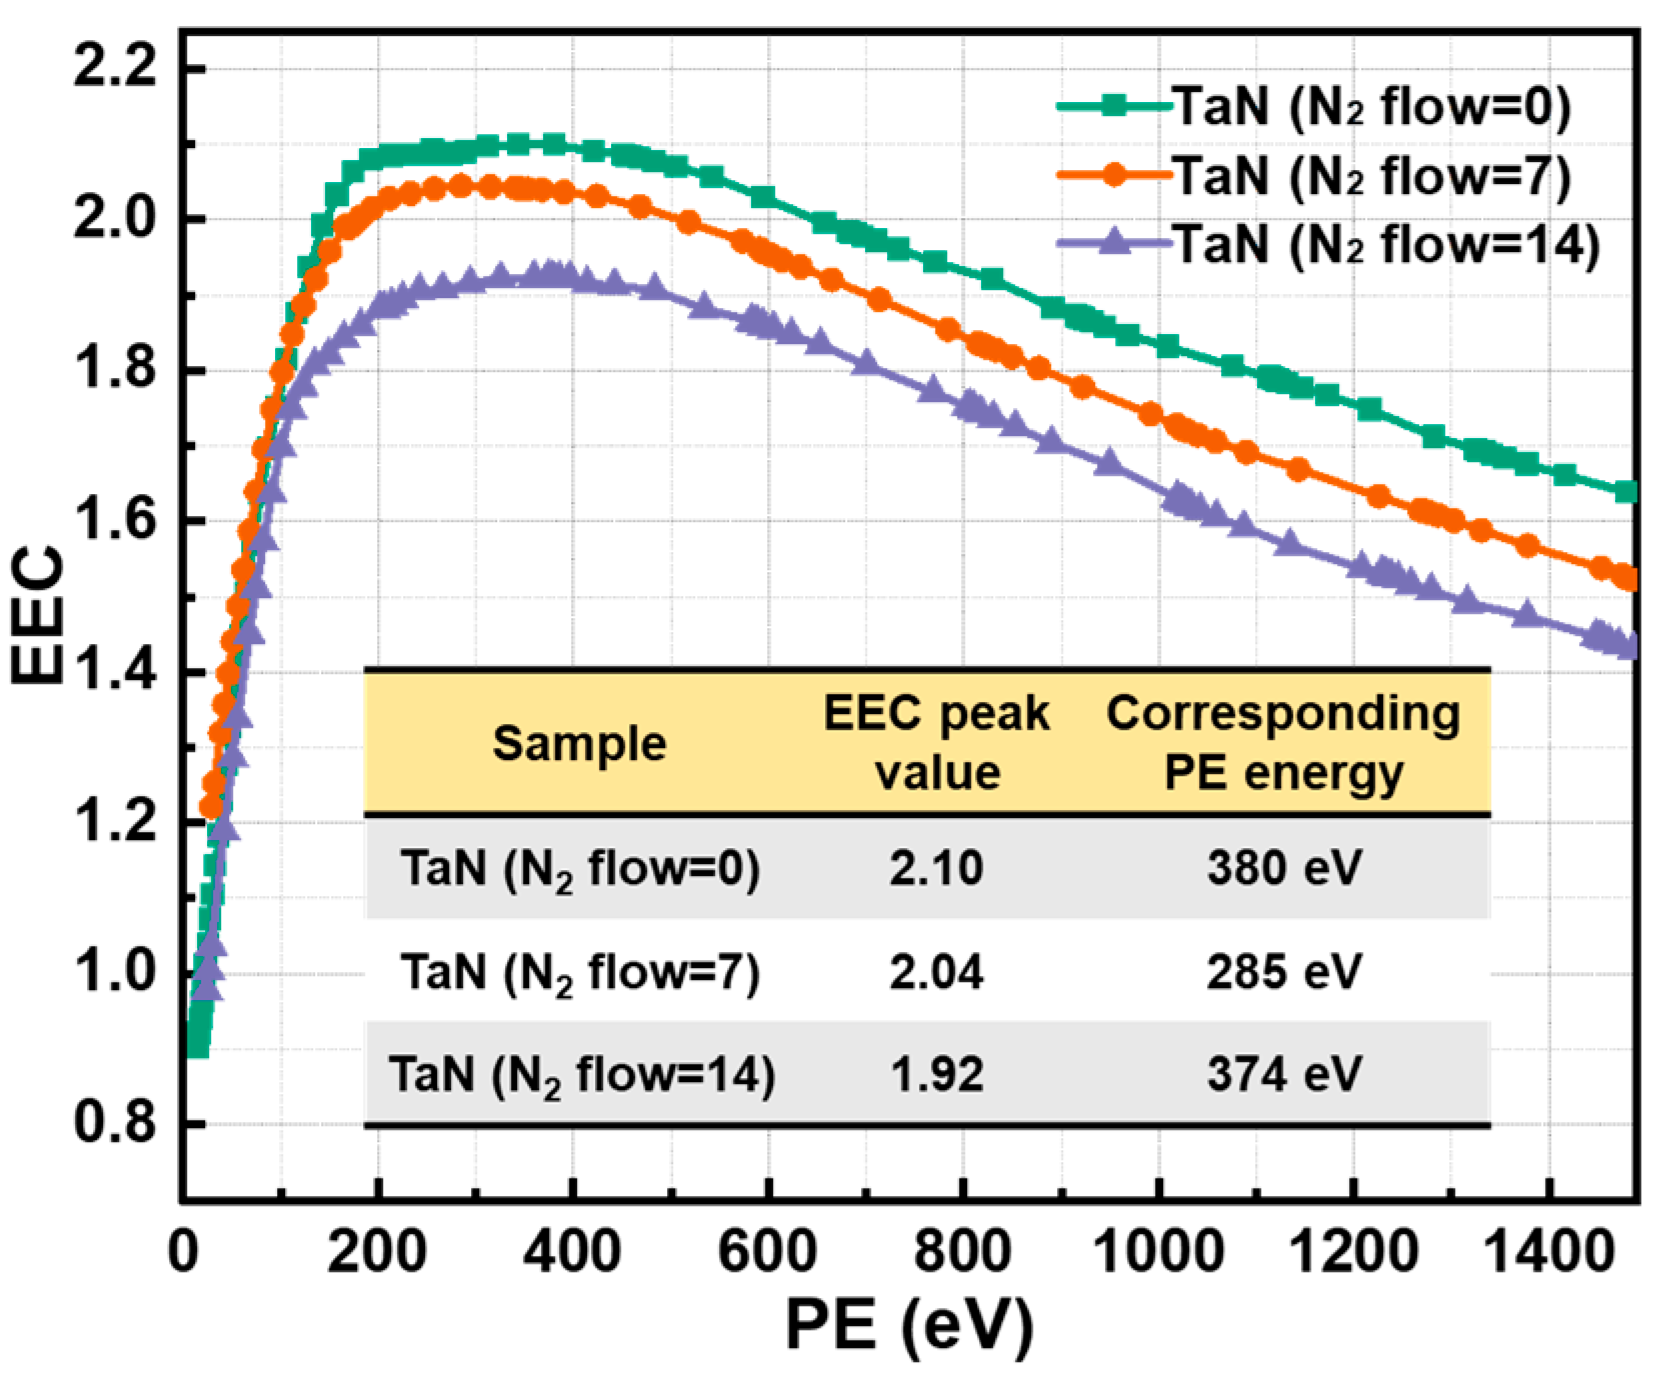
3.1. Morphology, Surface Components and EEC Results of TaN Films

Figure 1 gives the surface morphologies and cross-section images of three sets of TaN films obtained using SEM characterization. From the surface morphology in Figure 1a, it can be seen that there are a very large number of crystal grains on the TaN film surface when there is no N2 introduced during sputtering, and the boundaries between the crystal grain boundaries are relatively obvious. These crystal grains are of different sizes, with dimensions on the order of tens of nanometers. For this sample, the thickness of the film is observed to be about 176 nm through the subfigure in Figure 1a, and the film deposition rate is known to be about 1.47 nm/min based on the deposition time of 120 min. In addition, crystal grain boundaries are again evident on the fracture surface of the film, as is also evident through the inset in Figure 1a. With the passage of N2 during the sputtering process, as shown in Figure 1b, when the N2 flow rate is 7 sccm, only a few crystal grains of slightly larger sizes can be observed at the observed magnification, and no obvious crystal grain boundaries can be seen in other regions. A closer look reveals that only small grains with very little color differentiation can be seen, which are on the order of a few nanometers. The subfigure in Figure 1b shows that the film thickness is about 168 nm, and the film deposition rate is 1.40 nm/min. The surface and cross-section of the TaN film obtained by sputtering with a N2 flow rate of 14 sccm are shown in Figure 1c. As can be seen from Figure 1c, almost no crystal grain boundaries can be observed on the surface of the film under this deposition condition, and the surface appears to be very smooth, which is corroborated by the characterization results of the cross section in the subfigure in Figure 1c. Besides, the subfigure in Figure 1c shows that the thickness of the film is about 151 nm, and the film deposition rate is about 1.26 nm/min. From the cross-section characterization results, namely, the subfigures in Figure 1a–c, we know the thicknesses of the three groups of TaN films are 176 nm, 168 nm, and 151 nm, which indicates that the sputtering rate decreases slightly with the increase in the partial pressure of N2 in the sputtering chamber, due to the decrease in the partial pressure of the working gas, Ar, and the concentration of ionized Ar+ decreases.
The XPS test results of the three TaN films are presented in Figure 2. In the test spectra, the characteristic peak of Ta 4f corresponds to a binding energy of 24.75 eV, and the characteristic peak of N 1s corresponds to a binding energy of 395.14 eV. In fact, after XPS fine spectroscopy analysis, it is clear that the characteristic peak of Ta 4f is a double peak, with a 23.67 eV binding energy corresponding to Ta 4f7 and a 25.54 eV binding energy corresponding to Ta 4f5. The spectral analysis results show that the elemental N in the formed films is significantly increased with the increase in the N2 gas flow in the experiment; the corresponding film contents of elemental N in the films at a N2 gas flow of 0 sccm, 7 sccm and 14 sccm are 5.92%, 15.87% and 19.27% and the content of elemental Ta is 16.89% 20.41% and 18.19%, respectively. This result shows that the elemental content of N and Ta in the film gradually increases with increasing N2 gas flow. In addition, the test results include a C 1s peak at 283.80 eV and an O 1s peak at 530.16 eV, indicating the presence of gas adsorption via CO2, water vapor and organic contamination on the sample surface.
Through the four-probe test, the square resistances, RS, of the three groups of TaN films were tested and obtained as 3.94 × 10⁵ Ω/□, 1.66 × 10³ Ω/□ and 96 Ω/□, respectively. Combined with the film thicknesses obtained from the tests in Figure 1, the resistivities of the three groups of TaN films can be obtained as 6.94 × 10⁻² Ω·m, 2.79 × 10⁻⁴ Ω·m and 1.45 × 10⁻⁵ Ω·m, respectively. Considering the results of the elemental content analysis for Figure 2, it is obvious that for the TaN films prepared in this work, the resistivity of the films decreases gradually with the increase in the percentage of N elements in the films.
The EEC data of TaN films are given in Figure 3. The statistical results of the feature parameters in the EEC curves, the EEC peak value and its corresponding PE energy, are also given in Figure 3. The EEC test results in Figure 3 show that the EEC peak value of the TaN films ranged from 1.92 to 2.10. Additionally, with the increase in N2 gas flow, the EEC of the TaN films has a decreasing trend in the measured PE energy range. When the PE energy exceeds 400 eV, the difference between the adjacent EEC curves is basically stable at about 0.1. The comparison of the resistivity data shows that the N2 flow increases, resistivity decreases, and the EEC decreases. It has been theorized that the electrons receiving energy inside the material during electron emission are affected by the scattering of free electrons in the material during their movement [35]. Applying this theory to this experiment, we can think that there is the following influence relationship between each physical parameter: The sample with low resistivity has a relatively high concentration of free electrons, which leads to an increase in the chance of the inner excited electrons to be scattered, which, further, leads to a high rate of energy loss of the excited electrons, and a decrease in the probability of emission, which macroscopically manifests itself as a decrease in the EEC.

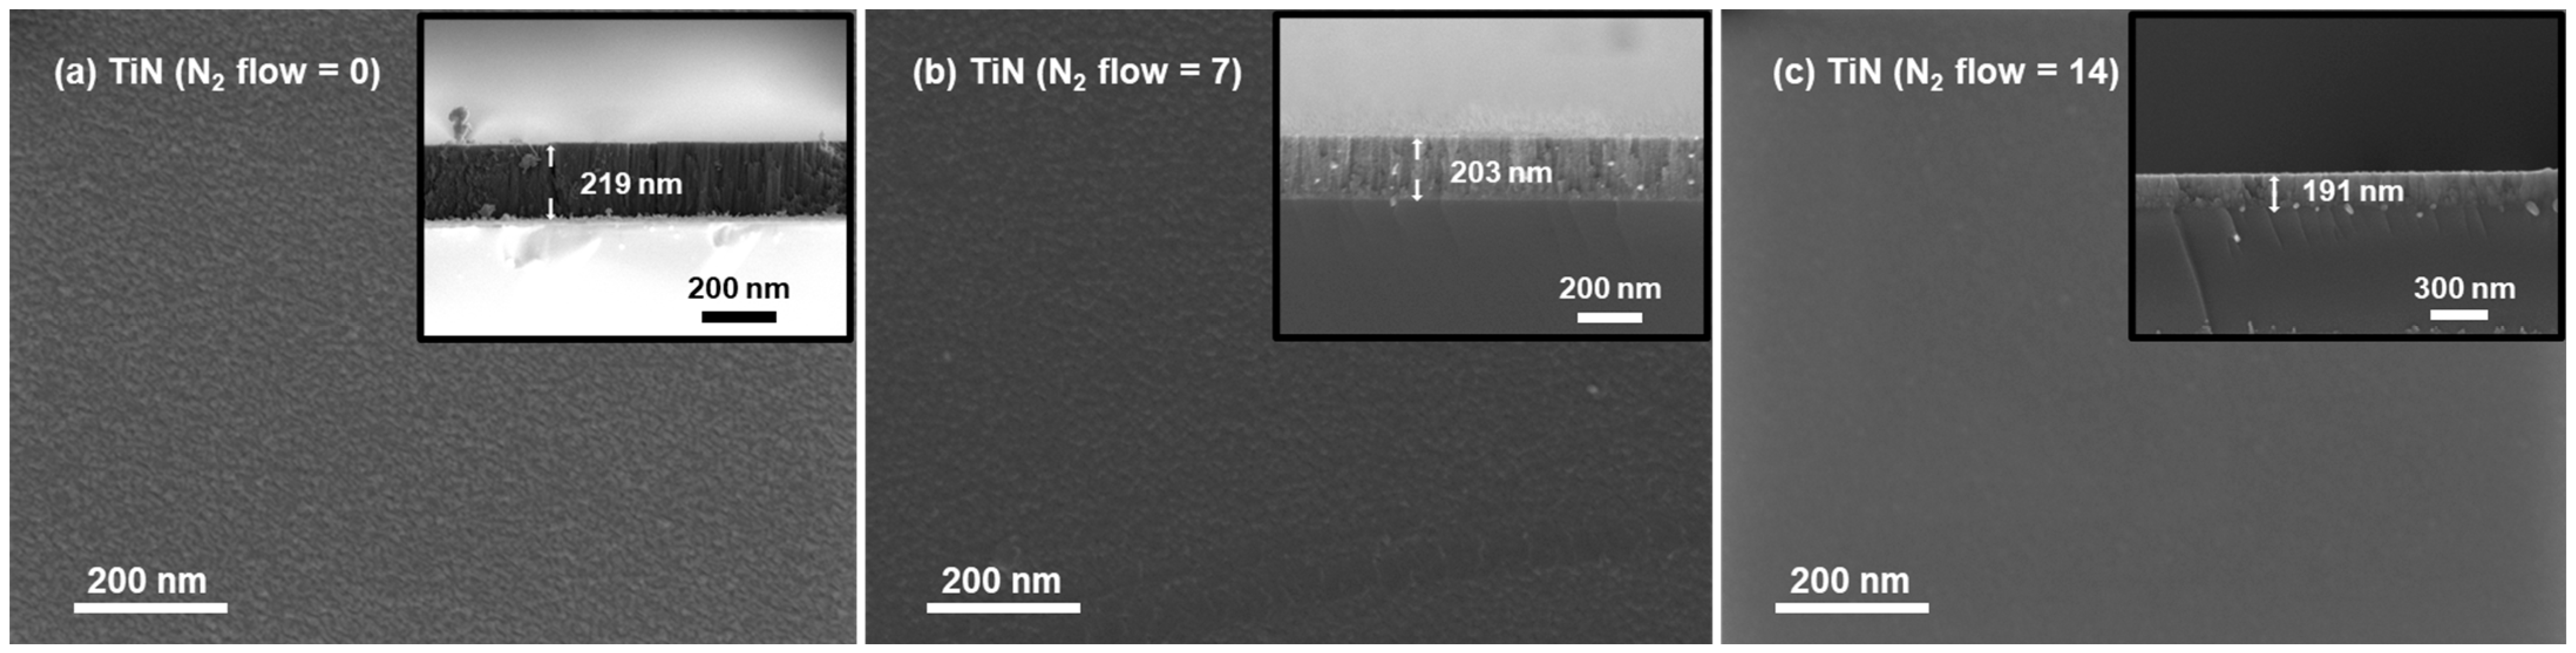
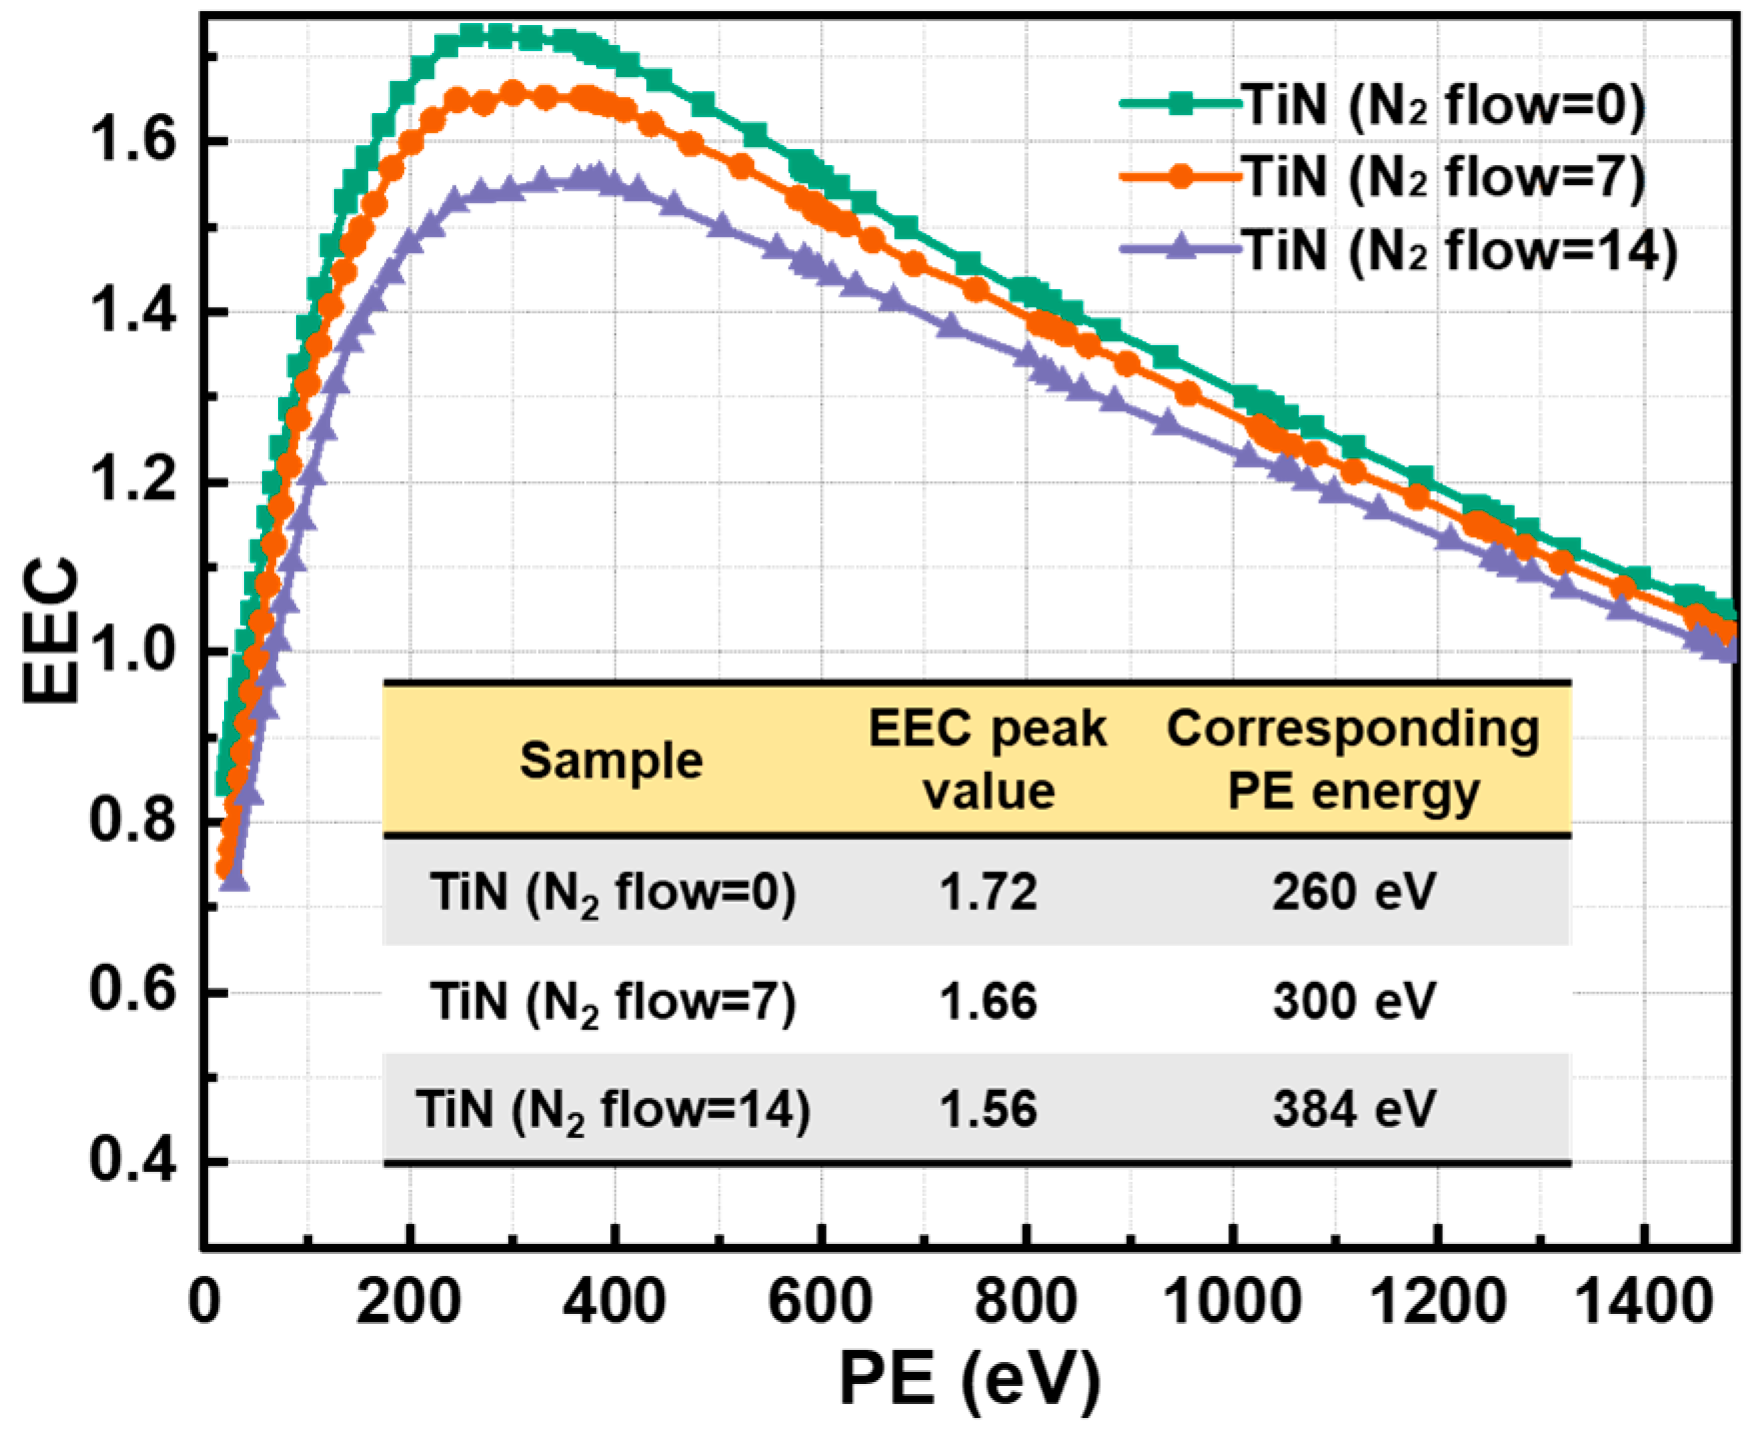
3.2. Morphology, Surface Components and EEC Results of TiN Films

Similarly, by SEM characterization, we obtain the surface morphologies and cross-section images of the three sets of TiN films obtained, just as shown in Figure 4. From the surface morphology in Figure 4a, it can be seen that when no N2 was introduced during the sputtering process, similar to the TaN films, the TiN films have a very large number of crystal grains on the surface, but the size of the grains is very small, around the nanometer scale, and the crystal boundaries between the grains are not obvious. The subfigure in Figure 4a shows that the film thickness is about 219 nm, and a deposition rate of about 1.83 nm/min can be deduced. In Figure 4b, when N2 is introduced during the sputtering process at a flow rate of 7 sccm, no obvious grain boundaries can be seen in the observation area at the magnification, and only small grains with very small differences in color can be seen under close observation. The subfigure of Figure 4b shows that the thickness of the film is about 203 nm, which gives an extrapolated film deposition rate of 1.69 nm/min. Figure 4c shows the surface and cross-section of the TiN film obtained by sputtering at a N2 flow rate of 14 sccm. As can be seen from Figure 4c, no grain boundaries are observed on the surface of the film under these deposition conditions and the surface is very smooth. The subfigure of Figure 4c shows that the thickness of the film is about 191 nm and the film deposition rate is about 1.26 nm/min. From the SEM cross-sectional characterization shown in subfigures in Figure 4a~c, we know the thicknesses of the three sets of TiN films are 219 nm, 203 nm and 191 nm, respectively, which is consistent with the TaN films in Figure 1, namely, the sputtering rate decreases slightly with the increase in the N2 partial pressure in the sputtering chamber.
Figure 5 presents the XPS test results of the three TiN films with increasing N2 gas flow. From the spectra shown in Figure 5, we observe that the characteristic peak of Ti 2p is a double peak, corresponding to the binding energies of 455.42 eV for Ti 2p3 and 461.05 eV for Ti 2p1, and the characteristic peak of N 1s corresponds to a binding energy of 395.14 eV. Similar to the results analyzed for TaN films, the spectral analysis results from Figure 5 indicate that the elemental N in the formed films is significantly increased with the increase in the N2 gas flow during the experiment; the corresponding film contents of elemental N in the films at N2 gas flow of 0 sccm, 7 sccm and 14 sccm are 6.74.%, 7.95% 18.05% and the content of elemental Ti is 22.47%, 20.70% and 19.81%, respectively. This result is also similar to TaN’s analysis, namely, the elemental content of N and Ti in the film gradually increases with an increasing N2 gas flow. In addition, the gas adsorption via CO2, water vapor and organic contamination on the sample surface is also presented, since the peaks including C 1s of 282.97 eV and O 1s of 528.31 eV are shown in three spectra.
The same resistivity test was performed on TiN films by employing the four-probe technology. The square resistances, RS, of the three TiN films were 8.78 × 10⁴ Ω/□, 1.21 × 10³ Ω/□ and 38 Ω/□, respectively. Combined with the film thicknesses obtained from the tests in Figure 4 of the three TiN films, 219 nm, 203 nm and 191 nm, then, the resistivity values of the three TiN films are calculated, namely, 1.92 × 10⁻² Ω·m, 2.46 × 10⁻⁴ Ω·m and 7.26 × 10⁻⁶ Ω·m, respectively. Combined with the analytical results in Figure 5, it can be concluded that the TiN film resistivity decreases with the increase in N content in the film.
Figure 6 presents the measured EEC data for the TiN films with increasing N2 gas flow, as well as the statistical results of the feature parameters of the EEC curves. From Figure 6, we see that the EEC peak value of the TiN films ranged from 1.56 to 1.72. It is obvious that the EEC of TiN films is remarkably lower than that of TaN films, which indicates that TiN film is more suitable for the surface requiring a relatively lower EEC. In addition, as the N2 gas flow increases, the EEC of the TiN films also shows a decreasing trend within the measured PE energy range. Specifically, an obvious EEC distinction is revealed from 200 eV to 400 eV, while the EEC distinction in other PE energy ranges decreases. Taking into account the variation regularity of the resistivity and EEC at different N2 gas flow, we are able to establish a positive correlation between the resistivity and EEC. Similarly, we observe a significant decrease in the EEC with decreasing resistivity of TiN films, and here, we can still explain this phenomenon using the theory that free electrons affect the EEC, which is illustrated in Section 3.1.

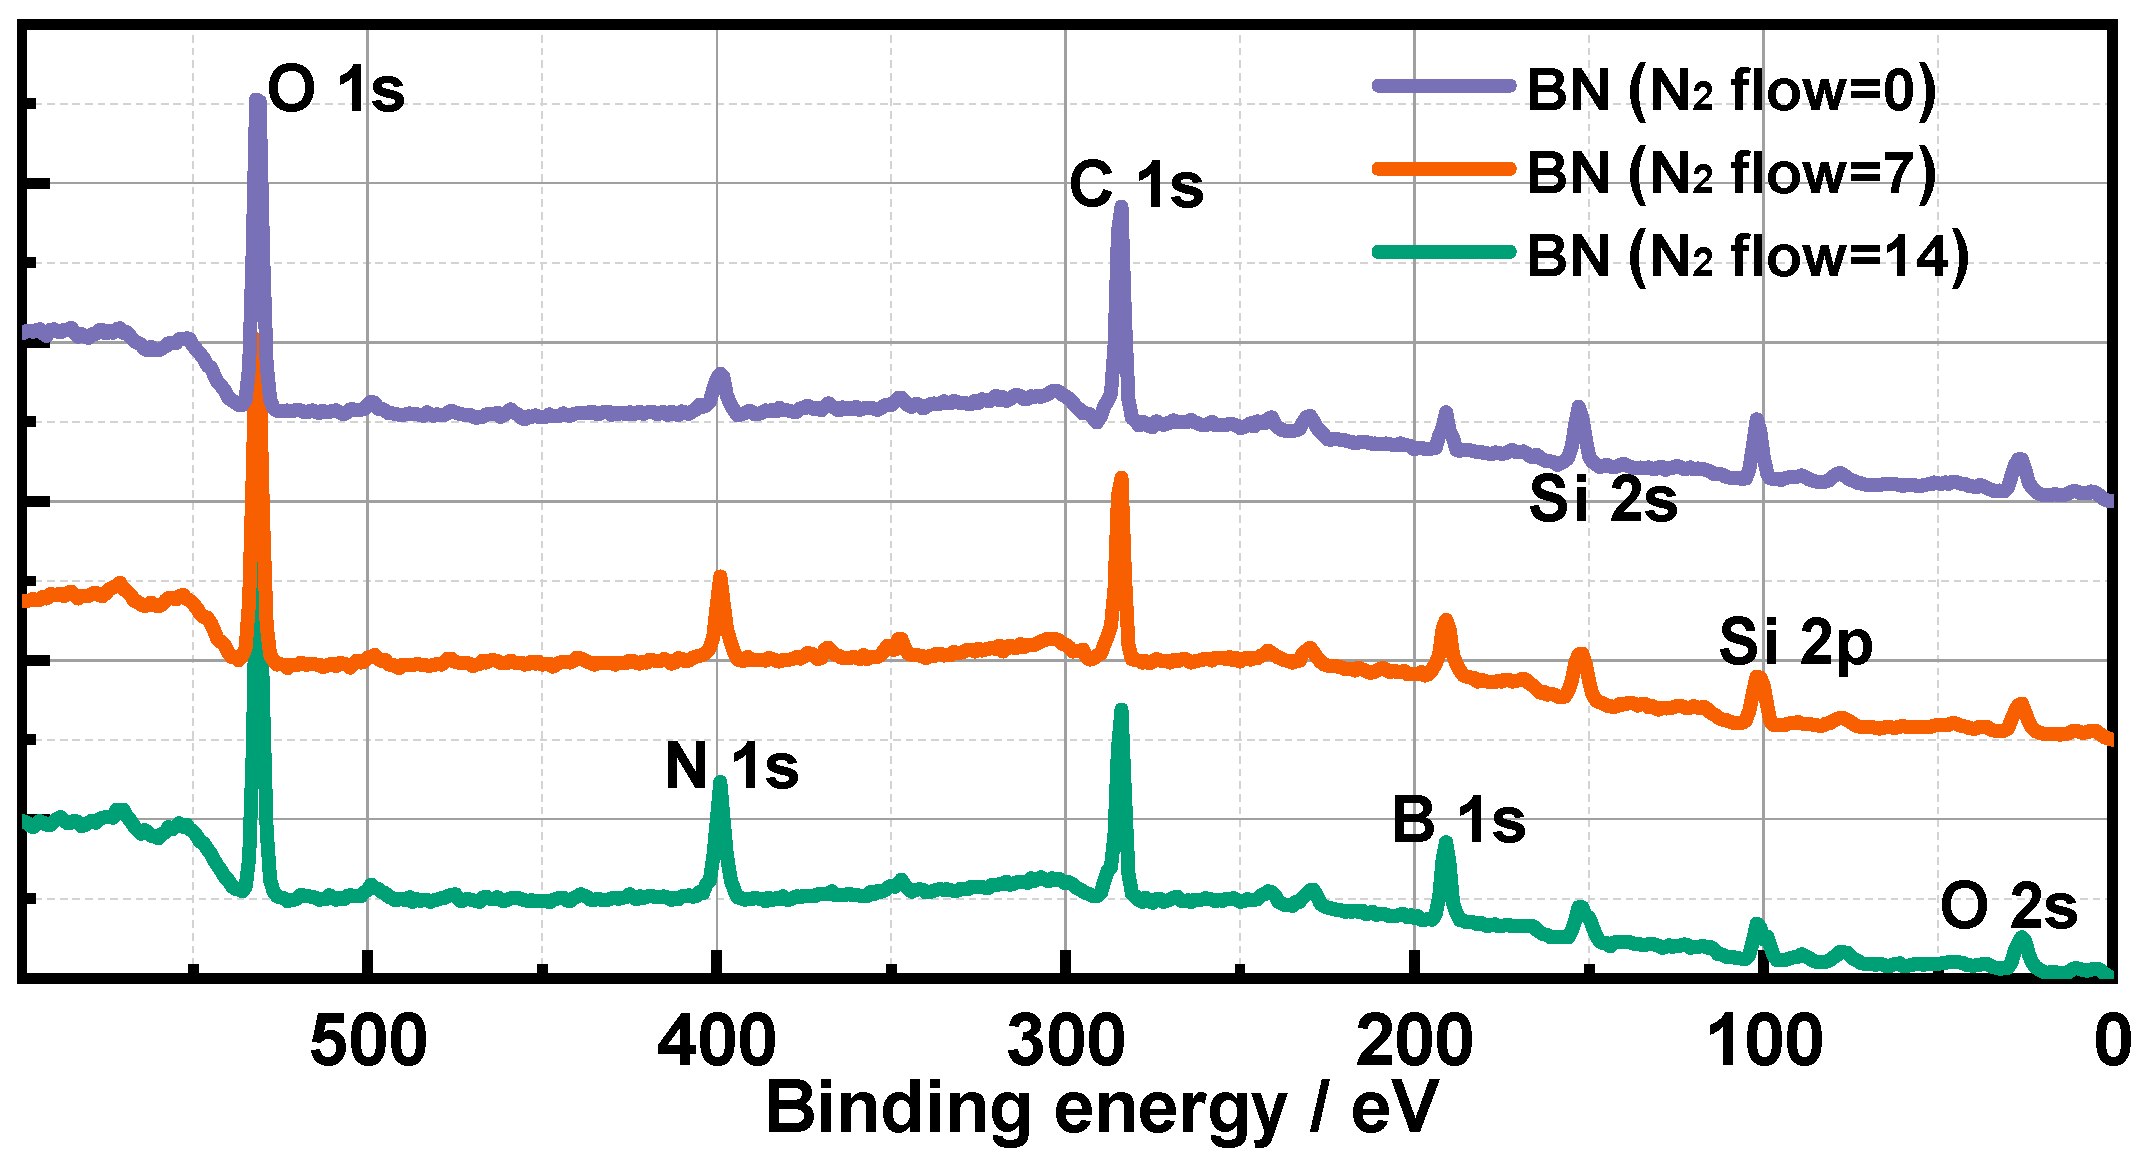
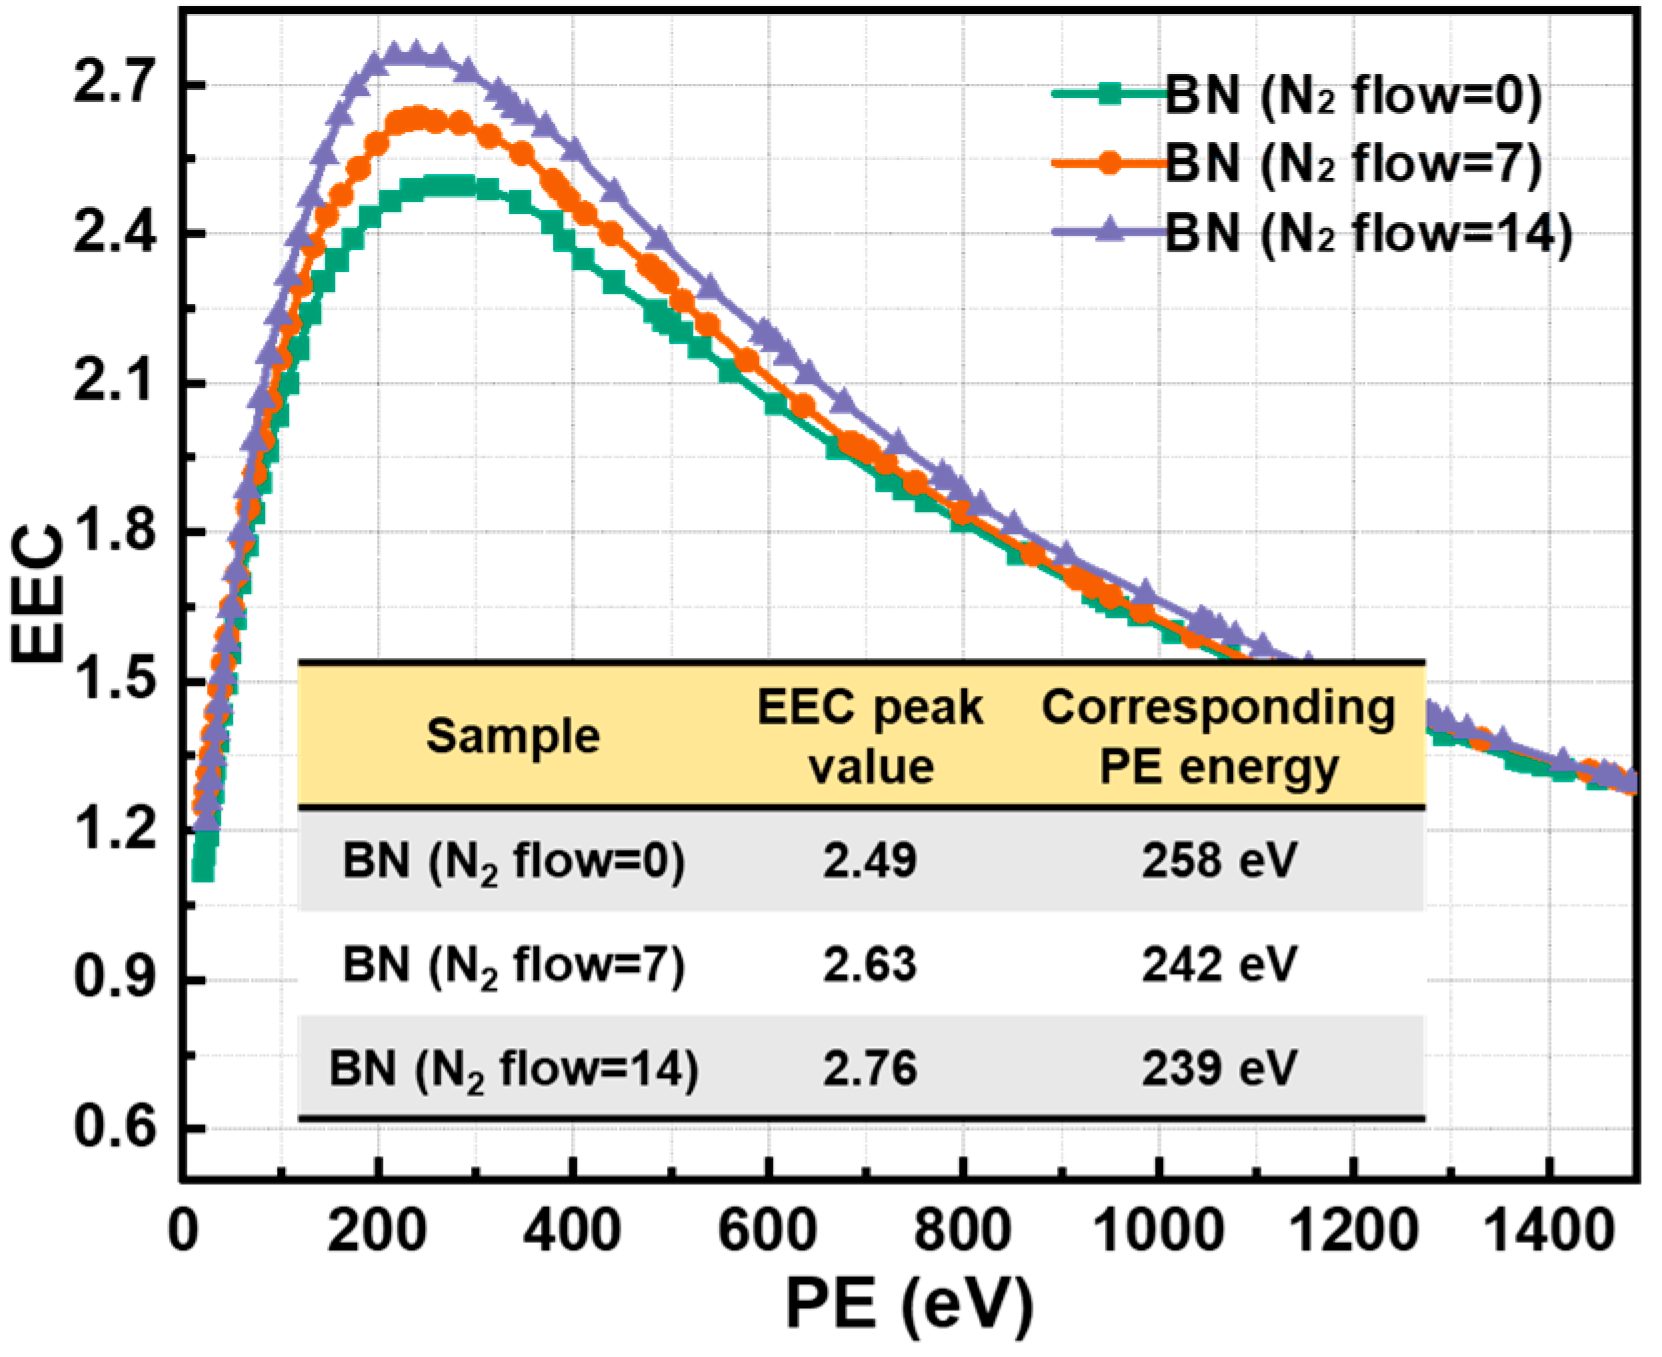
3.3. Morphology, Surface Components and EEC Results of BN Films

Figure 7 demonstrates the SEM characterization results of three sets of BN films. Unlike TaN and TiN, BN is an insulating dielectric with poor electrical conductivity, so it is more difficult to characterize the surface and cross-section by SEM, even in the case of sputtering an ultrathin conductive layer on the surface (e.g., gold spraying). This is evidenced by the SEM test results in Figure 7, which show no visible particles on the surface, and the characterization results of the cross-section do not show any obvious film morphology. In addition, the subfigures in Figure 7a~c show the probable cross-sectional photos of the BN films. However, the thickness characterization results in Figure 7 are only the parts that we observed in our experiments that are likely to be film layers, and these results in the subfigures in Figure 7a–c do not represent the thickness of the real film layer.
Figure 8 demonstrates the XPS test results of three sets of BN films. In the XPS spectrum of Figure 6, the binding energy corresponding to the characteristic peak of N 1s is 398.68 eV, and the binding energy corresponding to the characteristic peak of B 1s is 190.56 eV. The analyzed results in Figure 6 show that the contents of B and N in the three groups of BN thin films are relatively low, even with a N2 gas flow of 14 sccm. Specifically, the enhancement of B and N content in the film with increasing N2 flow rate can still be significantly observed, especially for the element N. The corresponding film contents of elemental N in the films at a N2 gas flow of 0 sccm, 7 sccm and 14 sccm are 4.74%, 7.68% and 10.91%, and the content of elemental B is 3.16%, 5.43% and 7.83%, respectively. This phenomenon indicates that for sputtered BN films, the N2 gas flow has little effect on the adjustment of the elemental ratio of B to N inside the films, but it can enhance the sputtering efficiency of BN films. Furthermore, the intensities of the characteristic peaks of C 1s at the binding energy of 284.17 eV and of O 1s at the binding energy of 531.22 eV are very high, which suggests the presence of very severe CO2 and water vapor adsorption on the film surface, as well as the generation of a large amount of organic contamination. In addition, the characteristic peak of Si 2p can be detected at 101.55 eV, which indicates that the quality of film formation is poor due to the XPS detection depth below 10 nanometers.
For the BN films prepared here, whether it is the highly insulating BN film or the high-resistivity intrinsic Si substrate, the square resistance is beyond the range of the four-probe test. Therefore, the resistivity of BN film samples cannot be obtained by four-probe testing.
The EEC measurement results of the BN film samples are given in Figure 9, and the corresponding feature parameters of the EEC curves are also displayed. As can be seen from Figure 9, there are obvious differences among the EEC curves of the three BN films, and the peak values of the EEC curves are ranging from 2.49 to 2.76. The PE energy corresponding to the acquisition of the peak value is around 250 eV. Since the transmission depth of PE is about a dozen nanometers in the PE energy range we tested, which is similar to the detection depth of XPS, the elemental and atomic structure within the detection depth of XPS in Figure 8 also happens to be the key factor that affects the EEC in Figure 9. In fact, referring to the XPS surface composition analysis results in Figure 8, we can know that the EEC test results in Figure 9 are affected by three factors at the same time, including the gases adsorbed on the surface and contaminated organics, the sputtered BN film and the high-resistance Si as the substrate. Combined with the XPS results in Figure 8, it can be seen that when the sputtering N2 gas flow is low, there is more serious CO2 adsorption and organic contamination on the surface, and the EEC of the BN surface is lower, with a EEC peak value of 2.49. When the N2 gas flow is increased, the quality of the BN films is high, and the proportion of C and O contaminated on the surface is obviously reduced. The EEC peak values are 2.63 and 2.76 for the films with N2 flows of 7 sccm and 14 sccm, respectively. The EEC test results in Figure 9 demonstrate that BN films containing more BN molecules have a higher EEC; they also indicate surface gas adsorption and organic contamination, which reduce the EEC of the BN films.

4. Conclusions

In this work, we prepared three kinds of thin films, TaN, TiN and BN, by RF sputtering. The influence regularities of N2 partial pressure on the film quality and EEC was investigated by controlling the N2 gas flow. The following conclusions were obtained from the study. (1) For TaN and TiN films, the elemental composition of the films can be adjusted by controlling the N2 gas flow during sputtering, while the BN films do not have such a characteristic. (2) The conductivity test results show that TaN and TiN films have a conductive property like that of semiconductor materials, and the film conductivity varies when there are differences in the elemental composition of the films. (3) The EEC tests show that the EEC of TaN and TiN films is positively correlated with their resistivity; the lower the resistivity, the lower the EEC, which is not the case for BN. In this study, the film-forming properties and EEC regularities of sputter-prepared TaN, TiN and BN films are fully investigated, which is of engineering significance for practical scenarios of applying nitride films as functional layers.

Author Contributions

Conceptualization, D.W.; methodology, Y.G. and D.W.; software, Y.G. and J.L.; validation, Y.G. and J.L.; formal analysis, Y.G.; investigation, Y.G.; resources, J.L.; data curation, Y.G., D.W. and N.Z.; writing—original draft preparation, Y.G. and D.W.; writing—review and editing, D.W.; visualization, Y.G.; supervision, D.W. and J.L.; project administration, J.L.; funding acquisition, Y.G. and N.Z. All authors have read and agreed to the published version of the manuscript.

Funding

This work was supported by Project of Science and Technology Research Program of Chongqing Education Commission of China (No. KJQN202303210), the Project of Science and Technology Research Program of Chongqing Education Commission of China (No. KJQN202403217) and the National Natural Science Foundation of China (Grant No. 62101434).

Institutional Review Board Statement

Not applicable.

Informed Consent Statement

Not applicable.

Data Availability Statement

The original contributions presented in the study are included in the article; further inquiries can be directed to the corresponding authors.

Conflicts of Interest

The authors declare no conflicts of interest.

References

  1. Pihosh, Y.; Minegishi, T.; Nandal, V.; Higashi, T.; Katayama, M.; Yamada, T.; Sasaki, Y.; Seki, K.; Suzuki, Y.; Nakabayashi, M.; et al. Ta3N5-nanorods enabling highly efficient water oxidation via advantageous light harvesting and charge collection. Energy Environ. Sci. 2020, 13, 1519–1530. [Google Scholar] [CrossRef]
  2. Ding, C.; Shi, J.; Wang, Z.; Li, C. Photoelectrocatalytic Water Splitting: Significance of Cocatalysts, Electrolyte, and Interfaces. ACS Catal. 2016, 7, 675–688. [Google Scholar] [CrossRef]
  3. Li, Y.B.; Takata, T.; Cha, D.; Takanabe, K.; Minegishi, T.; Kubota, J.; Domen, K. Vertically aligned Ta3N5 nanorod arrays for solar-driven photoelectrochemical water splitting. Adv. Mater. 2013, 25, 125–131. [Google Scholar] [CrossRef] [PubMed]
  4. Jiang, C.M.; Wagner, L.I.; Horton, M.K.; Eichhorn, J.; Rieth, T.; Kunzelmann, V.F.; Kraut, M.; Li, Y.B.; Persson, K.A.; Sharp, I.D. Metastable Ta2N3 with highly tunable electrical conductivity via oxygen incorporation. Mater. Horiz. 2021, 8, 1744–1755. [Google Scholar] [CrossRef]
  5. Patsalas, P.; Kalfagiannis, N.; Kassavetis, S. Optical Properties and Plasmonic Performance of Titanium Nitride. Materials 2015, 8, 3128–3154. [Google Scholar] [CrossRef]
  6. Chaudhry, A.; Mansoor, B.; Mungole, T.; Ayoub, G.; Field, D.P. Corrosion mechanism in PVD deposited nano-scale titanium nitride thin film with intercalated titanium for protecting the surface of silicon. Electrochim. Acta 2018, 264, 69–82. [Google Scholar] [CrossRef]
  7. Chin, Y.-L.; Chou, J.-C.; Lei, Z.-C.; Sun, T.-P.; Chung, W.-Y.; Hsiung, S.-K. Titanium Nitride Membrane Application to Extended Gate Field Effect Transistor pH Sensor Using VLSI Technology. Jpn. J. Appl. Phys. 2001, 40, 6311. [Google Scholar] [CrossRef]
  8. Shayeganfar, F.; Shahsavari, R. Electronic and pseudomagnetic properties of hybrid carbon/boron-nitride nanomaterials via ab-initio calculations and elasticity theory. Carbon 2016, 99, 523–532. [Google Scholar] [CrossRef]
  9. Zhou, J.; Wang, Q.; Sun, Q.; Jena, P. Electronic and magnetic properties of a BN sheet decorated with hydrogen and fluorine. Phys. Rev. B 2010, 81, 085442. [Google Scholar] [CrossRef]
  10. Backfish, M.; Eldred, J.; Tan, C.-Y.; Zwaska, R. Beam Tests of Beampipe Coatings for Electron Cloud Mitigation in Fermilab Main Injector. IEEE Trans. Nucl. Sci. 2015, 63, 957–964. [Google Scholar] [CrossRef]
  11. Kirby, R.; King, F. Secondary electron emission yields from PEP-II accelerator materials. Nucl. Instrum. Methods Phys. Res. Sect. A Accel. Spectrometers Detect. Assoc. Equip. 2001, 469, 1–12. [Google Scholar] [CrossRef]
  12. Meng, X.C.; Xu, Y.N.; Lian, Z.X.; Wang, J.Y.; Wang, D.; Qi, K.C. Secondary roughness effect of surface microstructures on sec-ondary electron emission and multipactor threshold for PTFE-filled and PI-filled single ridge waveguides. J. Phys. D Appl. Phys. 2024, 57, 265301. [Google Scholar] [CrossRef]
  13. Kalboussi, Y.; Dadouch, S.; Delatte, B.; Miserque, F.; Dragoe, D.; Eozenou, F.; Baudrier, M.; Tusseau-Nenez, S.; Zheng, Y.; Mau-rice, L.; et al. Multipacting mitiga-tion by atomic layer deposition: The case study of titanium nitride. J. Appl. Phys. 2024, 136, 085306. [Google Scholar] [CrossRef]
  14. Levchenko, I.; Xu, S.; Teel, G.; Mariotti, D.; Walker, M.L.R.; Keidar, M. Recent progress and perspectives of space electric pro-pulsion systems based on smart nanomaterials. Nat. Commun. 2018, 9, 879. [Google Scholar] [CrossRef]
  15. Barral, S.; Makowski, K.; Peradzyński, Z.; Gascon, N.; Dudeck, M. Wall material effects in stationary plasma thrusters. II. Near-wall and in-wall conductivity. Phys. Plasmas 2003, 10, 4137–4152. [Google Scholar] [CrossRef]
  16. Burton, T.; Schinder, A.M.; Capuano, G.; Rimoli, J.J.; Walker, M.L.R.; Thompson, G.B. Plasma-induced erosion on wall struc-tures in Hall-effect thrusters. J. Propuls. Power. 2014, 30, 690–695. [Google Scholar] [CrossRef]
  17. Vaughan, J.R.M. Multipactor. IEEE Trans. Electron. Dev. 1988, 35, 1172–1180. [Google Scholar] [CrossRef]
  18. Cimino, R.; Demma, T. Electron cloud in accelerators. Int. J. Mod. Phys. A 2014, 29, 1430023. [Google Scholar] [CrossRef]
  19. Manalio, A.A.; Burin, K.; Rothberg, G.M. More efficient channel electron multiplier by coating of the cone with a high second-ary electron yield material. Rev. Sci. Instrum. 1981, 52, 1490–1492. [Google Scholar] [CrossRef]
  20. Prodanovic´, V.; Chan, H.W.; Mane, A.U.; Elam, J.W.; Minjauw, M.M.; Detavernier, C.; van der Graaf, H.; Sarro, P.M. Effect of thermal annealing and chemical treatments on secondary electron emission properties of atomic layer deposited MgO. J. Vac. Sci. Technol. A 2018, 36, 06A102. [Google Scholar] [CrossRef]
  21. Suharyanto; Yamano, Y.; Kobayashi, S.; Michizono, S.; Saito, Y.; Tumiran. Effect of mechanical finishes on secondary electron emission of alumina ceramics. IEEE Trans. Dielectr. Electr. Insul. 2007, 14, 620–626. [Google Scholar] [CrossRef]
  22. Michizono, S.; Saito, Y.; Suharyanto; Yamano, Y.; Kobayashi, S. Estimation of surface charges on dielectric materials for high power rf windows. Appl. Surf. Sci. 2009, 256, 950–953. [Google Scholar] [CrossRef]
  23. Suharyanto; Yamano, Y.; Kobayashi, S.; Michizono, S.; Saito, Y. Secondary electron emission and surface charging evaluation of alumina ceramics and sapphire. IEEE Trans. Dielectr. Electr. Insul. 2006, 13, 72–78. [Google Scholar] [CrossRef]
  24. Michizono, S.; Saito, Y.; Suharyanto; Yamano, Y.; Kobayashi, S. Surface characteristics and electrical breakdown of alumina mate-rials. Vacuum. 2007, 81, 762–765. [Google Scholar] [CrossRef]
  25. Michizono, S.; Kinbara, A.; Saito, Y.; Yamaguchi, S.; Anami, S.; Matuda, N. TiN film coatings on alumina radio frequency win-dows. J. Vac. Sci. Technol. A 1992, 10, 1180–1184. [Google Scholar] [CrossRef]
  26. Montero, I.; Mohamed, S.H.; García, M.; Galán, L.; Raboso, D. Effect of surface reactions of low-energy carbon ions on the sec-ondary electron emission of TiN:O thin films. J. Appl. Phys. 2007, 101, 113306. [Google Scholar] [CrossRef]
  27. Ruiz, A.; Román, E.; Lozano, P.; García, M.; Galán, L.; Montero, I.; Raboso, D. UHV reactive evaporation growth of titanium nitride thin films, looking for multipactor effect suppression in space applications. Vacuum 2007, 81, 1493–1497. [Google Scholar] [CrossRef]
  28. Gascon, N.; Dudeck, M.; Barral, S. Wall material effects in stationary plasma thrusters. I. Parametric studies of an SPT-100. Phys. Plasmas 2003, 10, 4123–4136. [Google Scholar] [CrossRef]
  29. Locke, S.; Shumlak, U.; Fife, J.M. A numerical study of the effect of channel insulator discontinuity on Hall thruster discharge. In Proceedings of the 27th International Electric Propulsion Conference, Pasadena, CA, USA, 15–19 October 2001; pp. 1–23. [Google Scholar]
  30. Yao, L.; Ouyang, L.J.; Wang, D.; Chen, J.X.; He, Y.N.; Xu, Y.N. Modulation of secondary electron emission from boron nitride composite ceramics. High Volt. Eng. 2023, 49, 3848–3855. [Google Scholar]
  31. Lian, Z.; Xu, Y.; Meng, X.; Wang, D.; Chen, J.; Qi, K.; He, Y. Secondary electron emission reduction from boron nitride composite ceramic surfaces by the artificial microstructures and functional coating. J. Phys. D Appl. Phys. 2024, 57, 315304. [Google Scholar] [CrossRef]
  32. Lian, Z.; Li, D.; Wang, D.; He, Y. Discharge characteristics of the planar microscale gap electrodes with various geometry structures in the atmosphere environment. Results Phys. 2024, 62, 107823. [Google Scholar] [CrossRef]
  33. Dunaevsky, A.; Raitses, Y.; Fisch, N.J. Secondary electron emission from dielectric materials of a Hall thruster with segmented electrodes. Phys. Plasmas 2003, 10, 2574–2577. [Google Scholar] [CrossRef]
  34. Cai, Y.; Wang, D.; Qi, K.; He, Y. Measurement of total electron emission yield of insulators based on self-terminating charge neutralization. Rev. Sci. Instrum. 2022, 93, 055103. [Google Scholar] [CrossRef] [PubMed]
  35. Seiler, H. Secondary electron emission in the scanning electron microscope. J. Appl. Phys. 1983, 54, R1–R18. [Google Scholar] [CrossRef]
Figure 1. Surface morphologies and cross-sectional images of three Si-based TaN nanofilms acquired by using SEM characterization.
Coatings 15 00055 g001
Figure 2. Surface elemental component analysis of three Si-based TaN films acquired by using XPS characterization.
Coatings 15 00055 g002
Figure 3. Measured EEC data of the sputtered TaN nanofilms with three different N2 flows applied.
Coatings 15 00055 g003
Figure 4. Surface morphologies and cross-sectional images of three Si-based TiN nanofilms acquired by using SEM characterization.
Coatings 15 00055 g004
Figure 5. Surface elemental component analysis of three Si-based TiN films acquired by using XPS characterization.
Coatings 15 00055 g005
Figure 6. Measured EEC data of the sputtered TiN nanofilms with three different N2 flows applied.
Coatings 15 00055 g006
Figure 7. Surface morphologies and cross-sectional images of three Si-based BN nanofilms acquired by using SEM characterization.
Coatings 15 00055 g007
Figure 8. Surface elemental component analysis of three Si-based BN films acquired by using XPS characterization.
Coatings 15 00055 g008
Figure 9. Measured EEC data of the sputtered BN nanofilms with three different N2 flows applied.
Coatings 15 00055 g009
Disclaimer/Publisher’s Note: The statements, opinions and data contained in all publications are solely those of the individual author(s) and contributor(s) and not of MDPI and/or the editor(s). MDPI and/or the editor(s) disclaim responsibility for any injury to people or property resulting from any ideas, methods, instructions or products referred to in the content.

