Article

Corrosion Resistance of Atomically Thin Graphene Coatings on Single Crystal Copper

by
Md Mahmudul Hasan
1,2,3,
Ramesh Devadig
1,2,3,
Pawan Sigdel
1,2,3,
Alexey Lipatov
2,4,
Recep Avci
5,
Bharat K. Jasthi
1,2,6,* and
Venkataramana Gadhamshetty
1,2,3,*
1
Civil and Environmental Engineering, South Dakota School of Mines and Technology, 501 E. St. Joseph Street, Rapid City, SD 57701, USA
2
2D-Materials for Biofilm Engineering, Science and Technology (2DBEST) Center, South Dakota School of Mines and Technology, 501 E. St. Joseph Street, Rapid City, SD 57701, USA
3
Data-Driven Materials Discovery for Bioengineering Innovation Center, South Dakota School of Mines and Technology, 501 E. St. Joseph Street, Rapid City, SD 57701, USA
4
Chemistry, Biology and Health Sciences, South Dakota School of Mines and Technology, 501 E. St. Joseph Street, Rapid City, SD 57701, USA
5
Department of Physics, Montana State University, Bozeman, MT 59717, USA
6
Materials and Metallurgical Engineering, South Dakota School of Mines and Technology, 501 E. St. Joseph Street, Rapid City, SD 57701, USA
*
Authors to whom correspondence should be addressed.
Coatings 2024, 14(6), 656; https://doi.org/10.3390/coatings14060656
Submission received: 18 April 2024 / Revised: 11 May 2024 / Accepted: 16 May 2024 / Published: 22 May 2024
(This article belongs to the Special Issue Wear-Resistance and Corrosion-Resistance Coatings)

Abstract

:
Designing minimally invasive, defect-free coatings based on conformal graphene layers to shield metals from both abiotic and biotic forms of corrosion is a persistent challenge. Single-layer graphene (SLG) grown on polycrystalline copper (PC-Cu) surfaces often have inherent defects, particularly at Cu grain boundaries, which weaken their barrier properties and worsen corrosion through grain-dependent mechanisms. Here, we report that an SLG grown via chemical vapor deposition (CVD) on Cu (111) single crystal serves as a high-performance coating to lower corrosion by nearly 4–6 times (lower than bare Cu (111)) in abiotic (sulfuric acid) and microbiologically influenced corrosion (MIC) environments. For example, the charge transfer resistance for SLG/Cu (111) (3.95 kΩ cm2) was 2.5-fold higher than for bare Cu (111) (1.71 kΩ cm2). Tafel analysis corroborated a reduced corrosion current (42 ± 3 µA cm−2) for SLG/Cu (111) compared to bare Cu (111) (115 ± 7 µA cm−2). These findings are consistent with the results based on biofilm measurements. The SLG/Cu (111) reduced biofilm formation by 3-fold compared to bare Cu (111), increasing corrosion resistance, and effectively mitigating pitting corrosion. The average depths of the pits (3.4 ± 0.6 µm) for SLG/Cu (111) were notably shallower than those of bare Cu (111) (6.5 ± 1.2 µm). Surface analysis of the corrosion products corroborated these findings, with copper sulfide identified as a major component across both surfaces. The absence of grain boundaries in Cu (111) resulted in high-quality SLG manifesting higher barrier properties compared to SLG on PC-Cu. Our findings show promise for using the presented strategy for developing durable graphene coatings against diverse forms of corrosion.

1. Introduction

The escalating global cost of corrosion, surpassing USD 1 trillion in the US alone, accounts for a significant 3.1% of its gross domestic product (GDP) [1]. Microbially induced corrosion (MIC) issues alone contribute to nearly 20% of the total costs for corrosion mitigation [2,3]. MIC is a ubiquitous phenomenon that is driven by microorganisms, particularly sulfate-reducing bacteria (SRB), which actively promote and contribute to the rate of increase in metallic corrosion even under ambient and neutral conditions. SRB’s substantial contributions to corrosion have led the US government to spend USD 1 billion annually to mitigate its impacts [4]. Metals such as copper (Cu) that are widely used in various industries (e.g., oil and gas industry, water infrastructure) are susceptible to MIC. Developing protective coatings to resist Cu corrosion in biological environments is essential to upkeep equipment performance and longevity, especially with its projected annual usage of 260,000 tons in water and wastewater sectors alone by 2027 [5], and given the prevalence of SRB in these sectors.
Common coatings for corrosion mitigation are based on zinc and chromium [6,7,8], and polymers [8,9,10] such as polyaniline [11,12], polyurethane [13,14,15], and zeolite [16,17]. Despite their effectiveness against abiotic corrosion, they exhibit limited efficiency against biotic corrosion [7]. Advanced materials, including S-Se alloys, especially those based on two-dimensional (2D) materials [18,19,20,21] such as hexagonal boron nitride [22,23,24] and graphene [3,5,25,26,27], offer a potential avenue for developing non-invasive coatings that protect metals against both abiotic and biotic forms of corrosion. Leveraging a decade of fundamental studies, the commercial interest in graphene coatings is evident from the projected graphene coatings market set to reach USD 137 million by 2028 [28]. Despite graphene’s exceptional barrier properties, including resistance to diffusion [29], high energy barrier (18.8 eV), small pore size (0.064 nm), high electron density, strong C-C bond (4.9 eV), intrinsic strength (43 N/m) [30], and impermeability to small molecules such as helium [29], its scale-up efforts are hindered by the presence of inherent defects [31]. For instance, the presence of double vacancy defects [32,33] locally changes the work function of SLG, especially when grown on polycrystalline Cu (PC-Cu), which in turn aggravates the local corrosion rates [4,34,35]. The presence of grain boundaries [36,37] also lowers the work function behavior of Gr/PC-Cu surfaces, encouraging their tendency to donate electrons and reduce corrosion resistance. In addition, when graphene layers undergo functionalization, they can serve as centers for initiating corrosion [38], further complicating the scalability efforts despite graphene’s remarkable barrier properties.
Single-crystal Cu displays unique properties due to the absence of a grain boundary, strong anisotropy due to its lattice structure, and high purity. The quality of graphene, a crucial factor in its barrier properties, depends on the facet of Cu on which it is deposited [39]. The single-crystal Cu (111) substrates that have a small lattice mismatch with graphene (~3–4%) can be used for the heteroepitaxial growth of graphene crystals with fewer defects [40,41]. In contrast, PC-Cu (100) exhibits a lattice mismatch of 19.9% with graphene [42]. Additionally, single-crystal Cu (111) benefits from lower surface energy compared to other crystalline structures of Cu, facilitating the formation of single-layer graphene with homogeneous carbon nucleation [43]. The quality of the graphene layer can be assessed by Raman spectroscopy, where spectra lacking a D-band signify high-quality graphene with minimal defects [44,45]. Our prior works focused extensively on the barrier properties of CVD-grown graphene on PC-Cu crystals under diverse abiotic and biotic environments [4,45,46]. Here, we explore the influence of a Cu (111) crystal structure on the quality of graphene synthesized via CVD for use as a barrier coating against both abiotic corrosion and MIC.

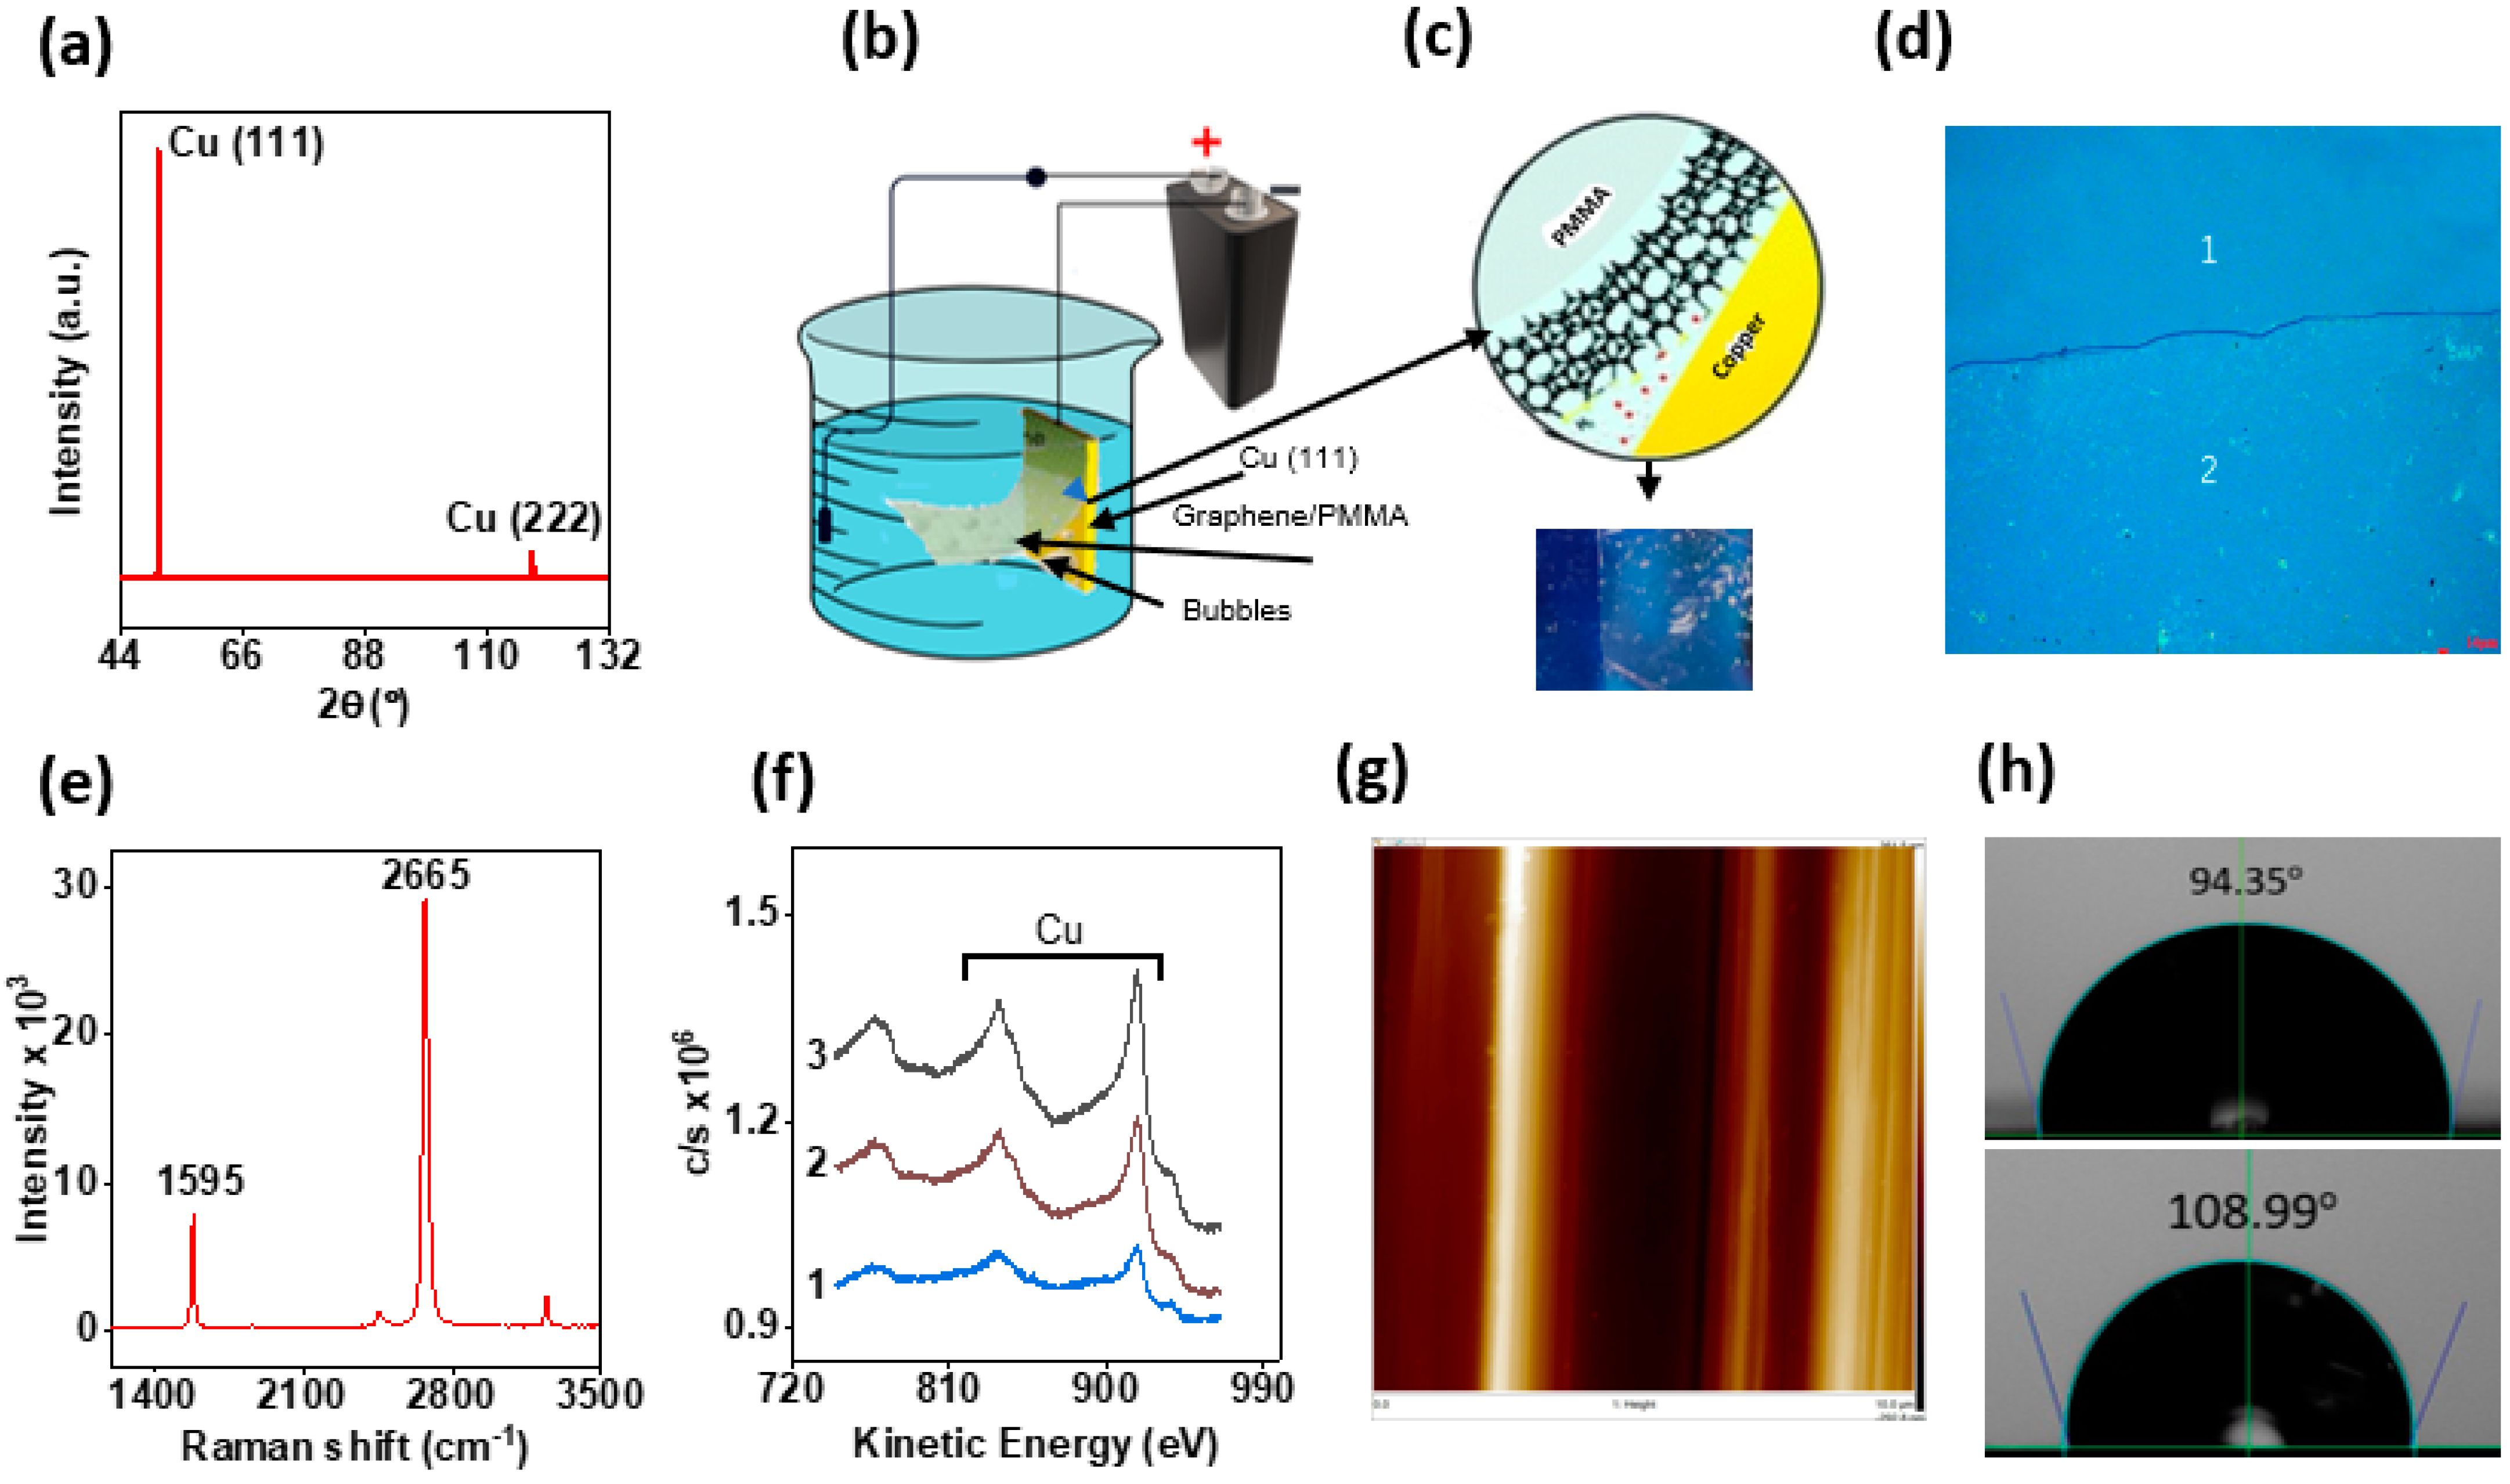
2. Material Synthesis and Characterization

2.1. Materials Synthesis

CVD methods were set up to grow SLG coatings on 1 mm thick Cu (111) coupons developed using a Bridgeman technique at MTI Corporation. The coupons were cleaned with acetone (10 min), acetic acid (10 min), and isopropyl alcohol (10 min) and dried with dry nitrogen. Subsequently, the Cu (111) coupons were placed in the CVD chamber, evacuated to 10 mtorr, and heated to 1000 °C for approximately 30 min in an H2 flow rate of 6 sccm. After annealing the coupons in H2 at 1000 °C for an additional 30 min, graphene growth was initiated by introducing methane gas into the CVD chamber. The growth process occurred at 1000 °C for 20 min in a CH4:H2 atmosphere (30 sccm: 6 sccm) at a total pressure of 650 mTorr. The Cu coupons were then removed from the heating zone and rapidly cooled to room temperature.

2.2. Characterization

The quality of graphene coatings on Cu (111) samples was investigated using a Horiba XploRA Plus Raman confocal microscope (Horiba Scientific, Edison, NJ, USA). The Raman spectra for as-grown graphene samples were obtained with 532 nm excitation, a cutoff optical filter at 50 cm−1, a 1200 nm grating, and a 100× magnification objective. Subsequently, the data were collected and processed using LabSpec6 software (Horiba Scientific, USA). The graphene coatings were further analyzed with nano-Auger spectroscopy (Physical Electronics Integrated, Chanhassen, MN, USA) with 10 kV and 10 nA electrons. Given the relatively large thickness of Cu (111) substrates, the transfer of graphene onto a SiO2/Si wafer was achieved using an electrochemical delamination technique [47,48,49] rather than conventional polymethyl methacrylate (PMMA)-based etching methods [50]. Atomic force microscopy (AFM) was used to assess the surface topographies (Bruker, Billerica, MA, USA). Bruker Corporation’s NanoScope Analysis 1.4 (Build R3Sr2.90423) was employed for analysis, featuring a scan size of 500 nm, a scan rate of 0.977 Hz, and 512 samples/line. Tapping mode was chosen for image acquisition using Multimode 8 as a microscope, and Hauppauge WinTV capture for vision. The resulting image was flattened using the Flatten tool in the NanoScope application.
Helios 5CX series Dual Beam system scanning electron microscope (SEM) (Thermo Scientific, Waltham, MA, USA) with a 21 pA probe current, 1.0 kV accelerated voltage, was used to examine the attachment of bacterial cells onto the surfaces of bare Cu (111) and SLG/Cu (111). The exposed surfaces of the samples were fixed by submerging them in 2% glutaraldehyde for two hours at 60 °C, followed by consecutive drying with an ethanol solution and overnight drying in a desiccator for SEM analysis [51]. For elemental analysis of the corrosion product, energy dispersive spectroscopy (EDS) (Oxford Instruments, Concord, MA, USA) was employed using 10 keV primary electrons at 17 nA target current. Corrosion product composition analysis was carried out using an Ultima-Plus X-ray diffractometer (Rigaku, Tokyo, Japan) with CoKα radiation configuration, a scintillator counter, and a graphite monochromator. The Jade 7.5 software was used for the analysis of X-ray diffraction (XRD) peaks.

2.3. SRB Cultivation and Growth

Pure cultures of Oleidesulfovibrio alaskensis G20 (OA-G20) were used for this study. The lactate-C media for bacterial culture was prepared with the following concentrations measured in grams per liter (g/L): sodium lactate (6.8 g/L), sodium sulfate (4.5 g/L), sodium citrate (0.3 g/L), dehydrated calcium chloride (0.06 g/L), ammonium chloride (1.0 g/L), magnesium sulfate (2.0 g/L), potassium phosphate monobasic (0.5 g/L), yeast extract (1.0 g/L), ascorbic acid (0.1 g/L), and sodium thioglycolate (0.1 g/L). After purging the sterile serum bottle with nitrogen gas, it underwent autoclaving and received a bacterial inoculum. The bottle was then incubated for nearly three days, and the optical density was measured to confirm bacterial growth prior to introducing the culture into corrosion cells. All the experiments were conducted in an anaerobic chamber.

2.4. Electrochemical Analysis

The corrosion cell consisted of a working electrode (WE) (bare Cu (111) or SLG/Cu (111)), a counter electrode (graphite plate), and a reference electrode (Ag/AgCl/1 M KCl) in a reference bridge tube. Nearly 40 mL of the OA-G20 culture was extracted from the exponential phase and used to inoculate 360 mL of lactate-C medium in the corrosion cell, which was maintained in an anaerobic condition. The working electrode samples were secured on a stainless-steel bracket with electrochemical sample masks, limiting the exposed surface area to 1 cm2. The cell was maintained under sterile and anaerobic conditions throughout the MIC tests, which spanned 42 days. The corrosion cells were transferred to a Faraday cage for electrochemical tests, including electrochemical impedance spectroscopy (EIS) and linear polarization resistance (LPR). Measurements were conducted periodically over the 42-day period. On day 42, destructive tests based on Tafel analysis and cyclic voltammetry were performed. All electrochemical analyses were carried out only after ensuring that the system achieved a stable open-circuit potential (Eocp). The potentiostat employed was a Reference 600 (Gamry Instruments, Warminster, USA). The measured test data were analyzed using Gamry Echem Analyst software (v 7.06), and Origin software (Version 2024) was subsequently utilized to plot the obtained data.
The EIS test setup utilized an AC signal of 10 mV, with a frequency range spanning from 100,000 Hz to 0.01 Hz. The measurements produced EIS spectra, which included Nyquist and Bode plots. These spectra were fitted into an equivalent electrical circuit (EEC) to calculate the impedance values. LPR tests were used to calculate the corrosion rates of the samples in abiotic conditions. This involved polarizing the working electrode from +10 mV to −10 mV from the Eocp value, with a scan rate of 0.125 mV/s and a stability value of 0.1 mV/s. The LPR test generated a potential vs. current plot, and the slope of this plot was utilized to calculate the polarization resistance (Rp) value. The Stern–Geary equation was then applied to determine the corrosion current (icorr) as follows [52]:
E i c o r r = R p = β a β c 2.303   i c o r r ( β a + β c )
where βa, βc, and E represent the anodic Tafel constant, cathodic Tafel constant, and applied potential, respectively. Subsequently, corrosion rates were calculated as icorr values [52].
C o r r o s i o n   r a t e   ( m p y ) = 0.129 i c o r r a   n ρ
where
  • n is the number of exchanged equivalents;
  • ρ   is the density of the metal (g/cm3);
  • a is the atomic weight of the metal (g/mol).
Tafel analysis provided Tafel constants, with a scan rate of 1 mV/s and initial/final applied potentials of −0.25 V and +0.25 V (vs. Eocp). Cyclic voltammetry (CV) tests were conducted on both samples on the 42nd day, consisting of four cycles with a scan rate of 25 mV/s and a potential range from −1.0 V to +1.0 V (vs. Eocp).

2.5. Molecular Characterization of the SRB

At the end of the corrosion tests, the spent electrolyte was collected and subjected to DNA extraction and 16S rRNA sequencing to validate the purity of the SRB. An ideally higher percentage of the initial bacterial species (OA-G20) was expected to be present in the media. Molecular characterization of the SRBs was performed and confirmed using 16S rRNA gene amplification and gene sequencing techniques. Planktonic cells were harvested and centrifuged at 8000 rpm for 15 min. Genomic DNA extraction utilizes a DNA extraction kit following the manufacturer’s protocol (PureLinkTM Microbiome DNA Purification Kit, Thermo Fisher Scientific, Waltham, MA, USA). PCR tests were conducted with 100 ng of genomic DNA template using 8F and 1492R as universal primers. The 16S rRNA conserved region was amplified using 5′—AGAGTTTGATCCTGGCTCAG—3′ and 5′—GGTTACCTTGTTACGACTT—3′ as forward and reverse primers.
A 50 µL reaction mixture contained Platinum™ II Hot-Start Green PCR Master Mix (2×), 4 µL of genomic DNA of both forward and reverse primers, and 13 µL of Invitrogen RT-PCR grade water. The PCR thermal cycler MiniAmp Plus (Applied Biosystems, Thermo Fisher Scientific, Waltham, MA, USA) was programmed as follows: initial denaturation at 95 °C for 5 min, 35 cycles of denaturation at 95 °C for 1 min, annealing at 60 °C for 1 min, extension at 72 °C for 1 min, and final extension at 72 °C for 10 min. A negative control using RT-PCR grade water Invitrogen was included as the PCR template. Amplified PCR products were separated on a 1.2% agarose gel via electrophoresis for 30 min at 60 V. Visualization and confirmation of PCR amplicons (~1500 bp) were achieved using a UV transilluminator and ethidium bromide staining. Positive amplicons were excised and eluted using the PureLinkTM Quick Gel Extraction Kit. Sanger’s dideoxy gene sequencing was employed for amplicon sequencing, followed by BLAST analysis on www.ncbi.nlm.nih.gov. Homologous sequences were identified and compared using an e-value and query coverage parameters against published 16S rRNA sequences.

3. Result and Discussion

The as-received Cu (111) substrates were subjected to a controlled CVD process within a specialized apparatus to grow a pristine SLG layer as a coating. The integrity of the Cu (111) lattice at the end of the CVD process was verified with the XRD analysis (Figure 1a). The presence of graphene was confirmed using Raman spectroscopy, which revealed distinct G and 2D peaks, respectively, which confirmed the presence of a Gr on Cu [53]. The as-grown graphene film from the Cu (111) samples was transferred onto a Si/SiO2 wafer using an electrochemical delamination method (Figure 1b,c) [48]. A relative different contrast was observed for SLG compared to the wafer, which was evident under an optical microscopy test (Figure 1d) [52,53]. The Raman spectra of the transferred SLG onto the Si/SiO2 wafer exhibited sharp peaks at 1595 cm−1 and 2665 cm−1 [54] (Figure 1e). The ratio of calculated intensity values for 2D to G bands was of nearly 4, which confirms the single-layered nature of the synthesized graphene [55]. Meticulous readings based on diverse regions from the SLG-coated Si/SiO2 wafer consistently revealed the absence of the D-band, which reveals the high quality of as-grown Gr layers [39]. Nano-Auger spectra at eight different locations were taken, and the identical C KLL Auger electron intensity at each of these locations suggests the graphene layer to be uniform on the Cu (111) (Figure 1f) [56]. The underlying crystalline structure [42] is the key to obtaining high-quality, ample-domain area coverage of SLG on Cu (111) substrates [39]. The fact that both Cu (111) and Gr have a hexagonal structure and the lattice mismatch is just 3.8% [42] between them helps SLG to grow faster with a high diffusion rate, fewer defects, and enhanced adsorption [39]. Moreover, the uniformity of graphene coatings on Cu (111) was confirmed with AFM analysis after observing very low surface roughness and very smooth surfaces (Figure 1g). Also, the contact angle measurements revealed the SLG/Cu (111) samples to be more hydrophobic than bare Cu (111) (Figure 1h).
To analyze the role of Cu (111) in determining the quality of as-grown graphene films, we conducted a detailed characterization of bare Cu (111) compared to typical PC-Cu substrates (see Figure S2). The surface of bare Cu (111) was remarkably smooth and devoid of grains or grain boundaries, as convincingly illustrated by the SEM image (Figure S2a). The AFM height image (Figure S2b), three-dimensional representation (Figure S2c), and roughness profile (Figure S2d) portray the surface as smoother, with an RMS roughness value (Rq) as low as 8.58 nm. A stark contrast was observed when a similar analysis was applied to PC-Cu. The surface appeared conspicuously rough with a considerably higher Rq value of 128 nm (Figure S2e–h). Repeated AFM measurements at various locations on the PC-Cu sample consistently yielded analogous results. These results explain the reasons for the high quality of graphene films on Cu (111) (Figure 1), compared to a relatively defective quality of graphene films grown on PC-Cu substrates [4,46]. Notably, the surface roughness of Cu (111) remained low even after the growth of SLG, as evidenced by the Rq values of 10.9 nm and 12.2 nm for SLG/Cu (111) (Figure S3). This finding aligns with the recent works from the literature that reports the smooth characteristics of monolayered graphene grown on single copper crystals [57,58]. Hence, the SLG demonstrated minimal impact on the substrate’s roughness.

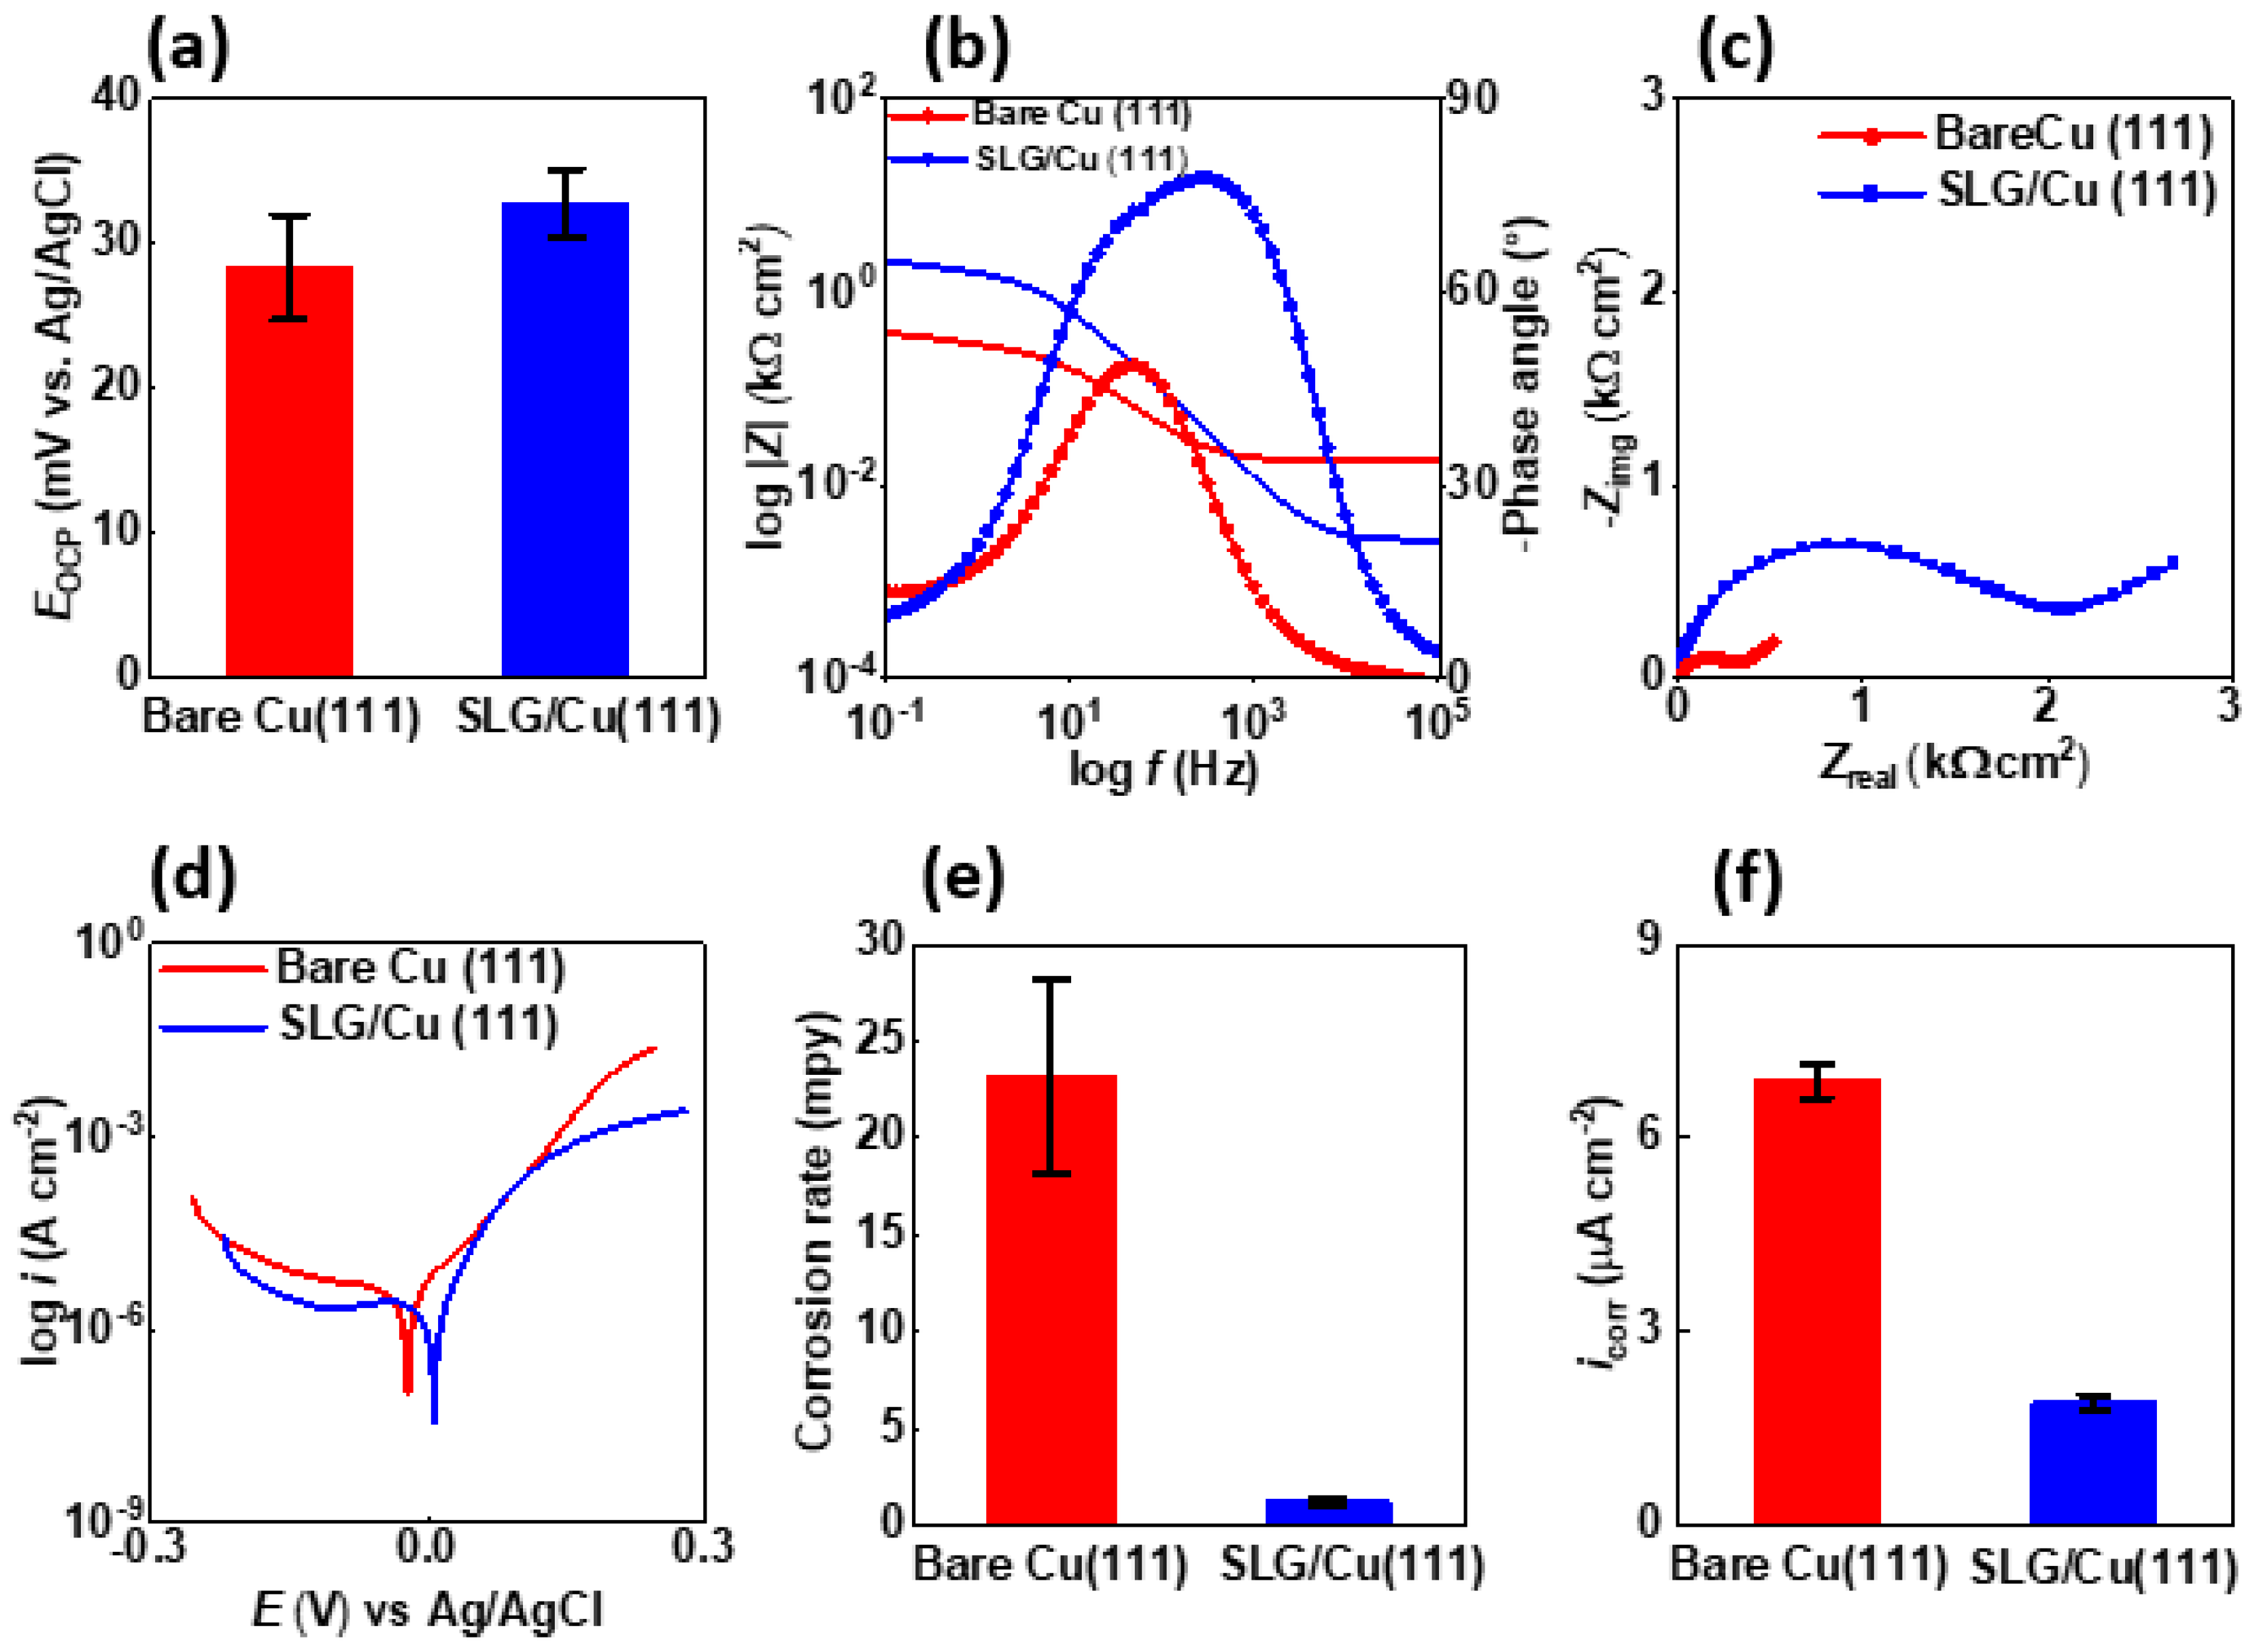
3.1. Corrosion Resistance in an Abiotic Environment

The SLG/Cu (111) displayed a more positive open-circuit potential (Eocp) (32.8 ± 2.4 mV vs. Ag/AgCl/1 M KCl) compared to bare Cu (111) (28.42 ± 3.6 mV vs. Ag/AgCl/1 M KCl) (Figure 2a) under identical abiotic conditions (0.5 M H2SO4). This nobler Eocp (more positive) suggests reduced chemical reactivity, a diminished thermodynamic driving force for oxidation, and enhanced corrosion resistance of SLG/Cu (111). The absolute impedance for SLG/Cu (111) (2 kΩ cm2) was five times greater than that for bare Cu (111) (0.3 kΩ cm2), based on the y-intercept values in the lower-frequency domains of the Bode plots (Figure 2b). The phase angle maxima for SLG/Cu (111) (77.65°) was also greater than that of bare Cu (111) (48.51°) at the low-frequency region. Even in the high-frequency region, the phase angle values for SLG/Cu (111) (4.02°) were greater than those of bare Cu (111) (−0.7132°), which further affirms heightened resistance to corrosion [59,60,61,62,63]. The EEC fitting (Figure S4) of the Nyquist plot (Figure 2c) for SLG/Cu (111) showed a 2-fold higher pore resistance (Rpo) and 1.7-fold higher charge transfer resistance (Rct) compared to bare Cu (111) (Table S1). The results from Tafel analysis demonstrate the utility of this technique in assessing the corrosion resistance of as-grown SLG films. The Tafel analysis revealed a nobler corrosion potential (Ecorr) (7.22 mV) than bare Cu (111) (-21.8 mV) (Table S2). The SLG/Cu (111) also experienced a lower anodic current in the anodic branch compared with its counterpart (Figure 2d). Finally, the corrosion rates for SLG/Cu (111) (1.2 ± 0.2 mpy) were 19-fold less than those of bare Cu (111) (23.1 ± 5 mpy) (Figure 2e), based on the Tafel analysis. The lower corrosion rates aligned well with a 3.6-fold lower corrosion current density (icorr) for SLG/Cu (111) (1.9 µA cm−2) compared to bare Cu (111) (6.9 µA cm−2) (Figure 2f). Overall, these outcomes demonstrate the promise of leveraging SLG films grown on copper single crystals as high-performance coatings.

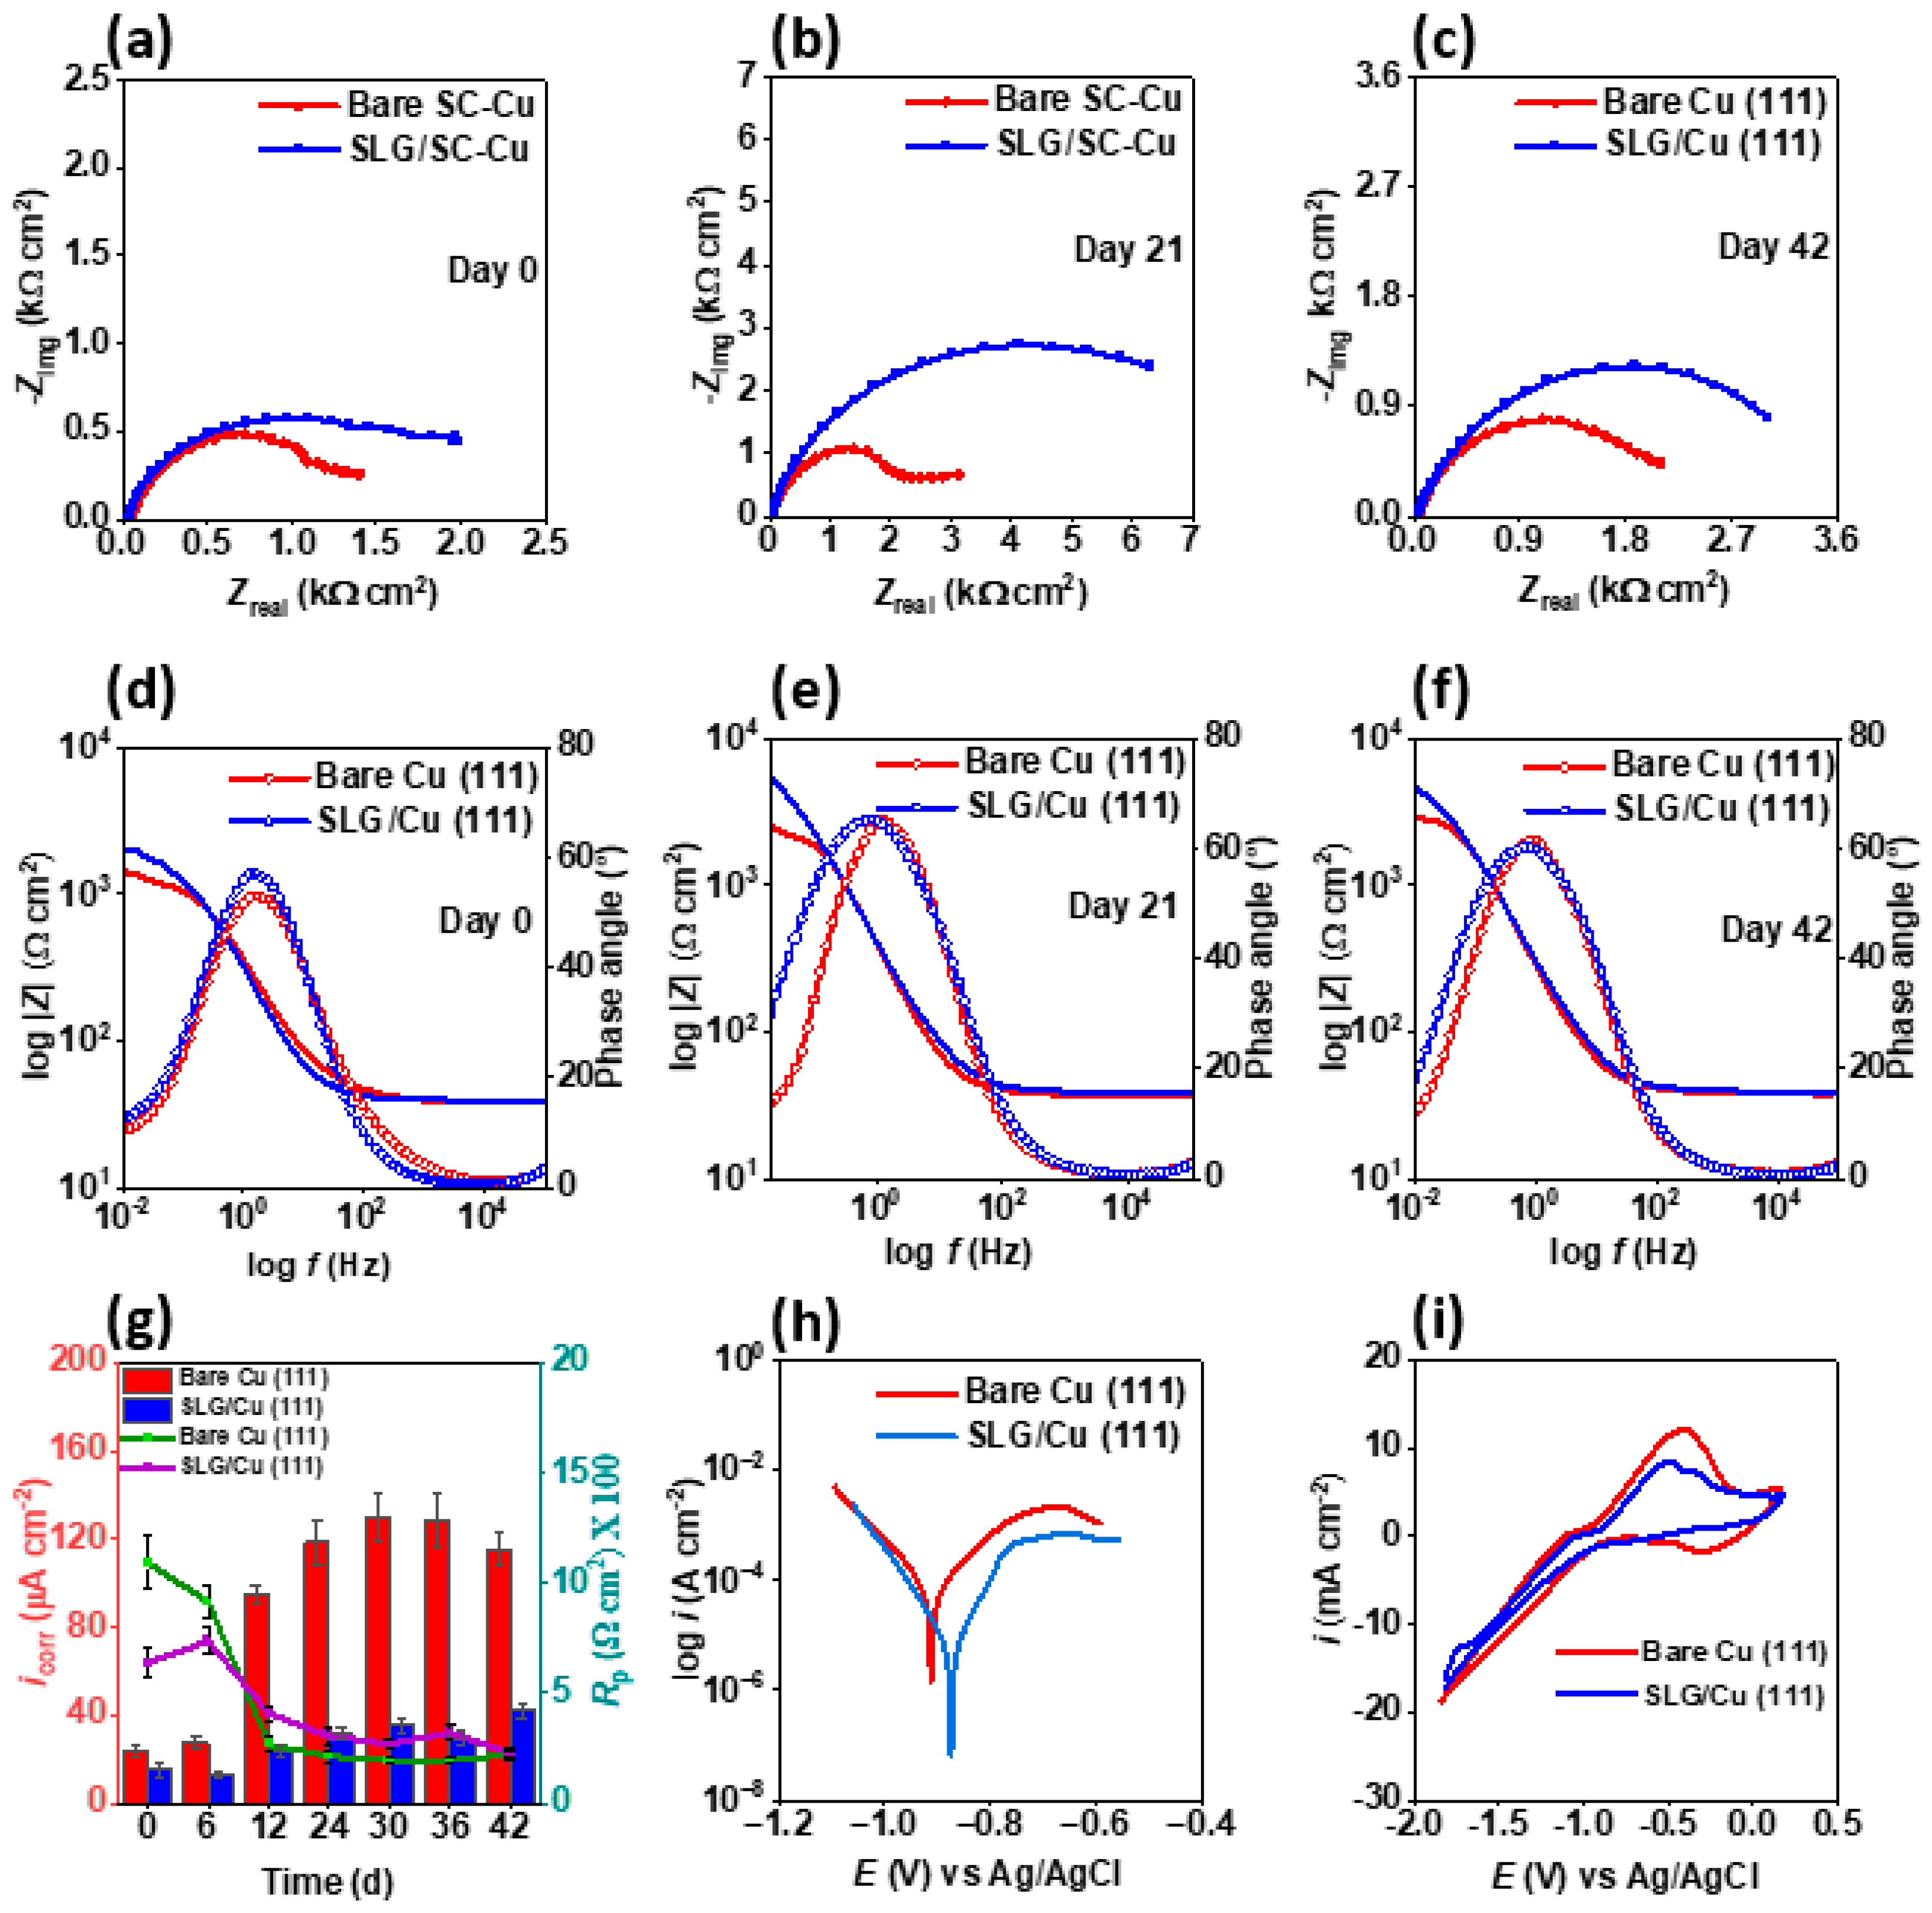
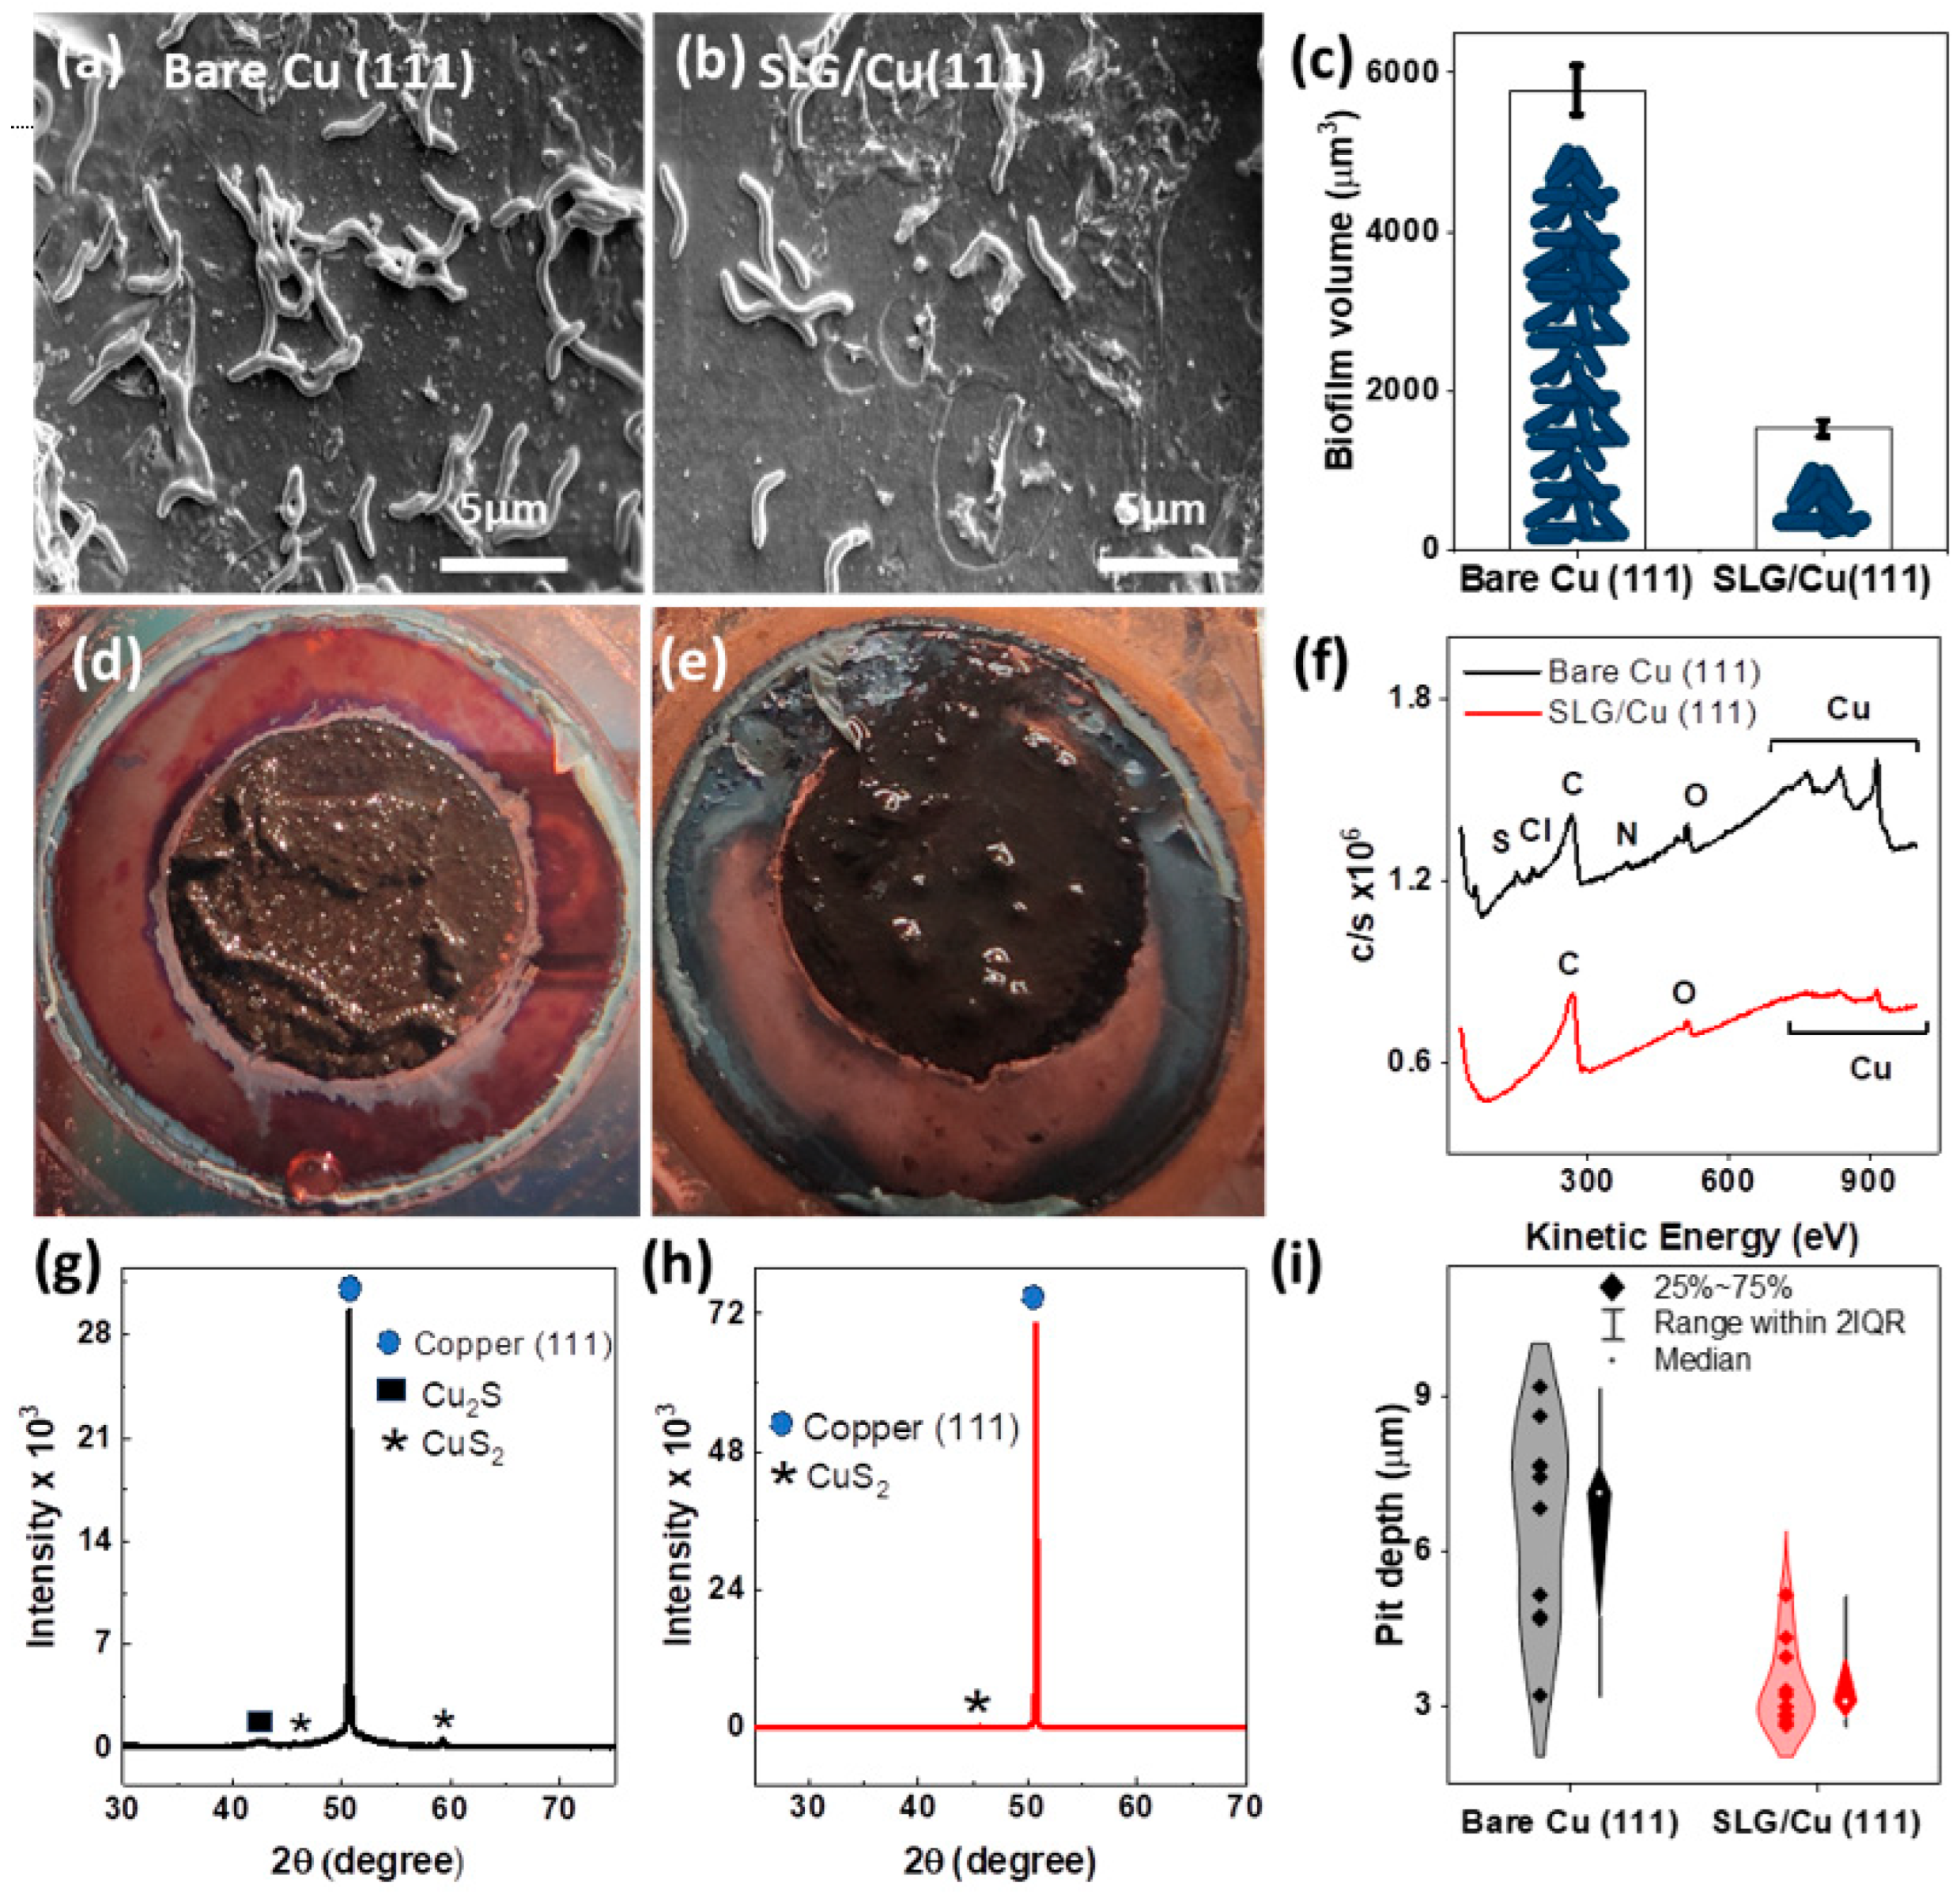
3.2. Corrosion Resistance in the Biotic Environment

After demonstrating the corrosion resistance of SLG on single-crystal Cu (111) under abiotic conditions, we assessed its performance against planktonic (0-h mark) and sessile forms (day 3 to day 42) of OA-G20 cells. Then, 16S rRNA gene sequencing tests were used to establish the purity of OA-G20 cells in bare Cu (111) and SLG/Cu (111), which confirmed 97.99% identity (with 99% query coverage) and 98.66% identity (with 100% query coverage), respectively, with O. alaskensis FC18565 (Acc No: CP000112.1). The Nyquist plots revealed higher overall resistance of SLG/Cu (111) compared to bare Cu (111) throughout the test duration (Figure 3a–c). The larger the diameter of the semicircle, the higher the overall charge transfer resistance (Rct) at the Cu (111) interface (Figure 3a–c). The Rct and Rpo values for SLG/Cu (111) were 2-fold higher and 3.5-fold greater than those of bare Cu (111) on day 42, based on the EEC fitting analyses (Figure S3, Table S3). Notably, the goodness of fit of EEC was more than 10−4, confirming a satisfactory fitting. Under planktonic conditions, the phase angle maxima for SLG/Cu (111) (77.65°) was greater than that of bare Cu (111) (48.51°). In the high-frequency region, the phase angle only decreased to 3.3°, still exceeding the corresponding value for bare Cu (111) (Figure 3d). On day 21, the phase angle maxima at the low-frequency region remained elevated for SLG/Cu (111) compared to bare Cu (111) (Figure 3e). However, on the same day, the phase angles in the high-frequency region for both samples were equivalent, measuring 2.8° for bare Cu (111) and 2.7° for SLG/Cu (111). By the 42nd day, the phase angle maxima remained higher for the coated sample in the low-frequency region, while the peaks at the high-frequency region were closely aligned (Figure 3f). The superior phase angle maxima exhibited by the coated sample in the high-frequency region emphasizes the corrosion resistance conferred by the graphene coating [59,60]. Moreover, in the low-frequency region (0.01 Hz), the absolute modulus value for the coated sample was 1.4, 2.2, and 1.5 times higher than the bare sample on days 0, 21, and 42, respectively (Figure 3d–f), indicating higher resistance to electron flow from the coated sample [2]. These findings collectively corroborate the barrier properties of SLG/Cu (111) [63] under MIC conditions.
The Eocp values were diligently recorded for both systems daily throughout the 42-day test duration (Figure S5). The SLG/Cu (111) consistently exhibited a higher Eocp than the bare Cu (111) throughout the experimental period, except for a few exceptions. Both the systems experienced a gradual decline in Eocp values. However, the bare Cu (111) experienced a greater decrease in OCP (−776.9 mV, day 0; −801.7 mV, day 21, and −821.5 mV, day 37) compared to SLG/Cu (111) (−773.6 mV, day 0; −801.8 mV, day 21; and −817.0 mV, day 37). The greater corrosion resistance of SLG/Cu (111) was corroborated by the LPR test data throughout the test duration. The anodic slope constant (βa), 43 mV/decade, and cathodic slope constant (βc), 45.8 mV/decade from Tafel fitting, were used to calculate corrosion current (icorr) and polarization resistance (Rp) for SLG/Cu (111). Similarly, βa of 142.4 mV/decade and βc of 100.7 mV/decade were used for bare Cu (111). Notably, the peak value of icorr recorded for the bare Cu (111) (130 ± 10 µA cm−2, day 30) was nearly 3 times greater than that for the SLG/Cu (111) (42 ± 4 µA cm−2, day 42) (Figure 3g). The icorr for bare Cu (111) experienced a roughly 5-fold increase from day 0 to day 24, stabilizing in the range from 119 ± 9 µA cm−2 to 130 ± 10 µA cm−2 for the remainder of the test period. Conversely, the icorr for the SLG/Cu (111) remained within the range from 31 ± 3 µA cm−2 to 42 ± 4 µA cm−2 from day 24 to day 42. The values of Rp corroborated the findings based on icorr values (Figure 3g). A significant decrease in Rp was observed for both systems from day 0 to day 24 followed by its stabilization. However, the Rp remained higher from day 12 to 42 for SLG/Cu (111).
The results from the Tafel analysis further corroborate the performance of the SLG/Cu (111) against the corrosive effects of OA-G20 cells throughout the 42-days exposure period (Figure 3h). The corrosion potential (Ecorr) for SLG/Cu (111) was measured to be higher (−874.2 mV) compared to bare Cu (111) (-911.3 mV), and the icorr from Tafel for the bare Cu (111) (88.10 µA cm−2) was nearly 24 times higher than that for SLG/Cu (111) (3.6 µA cm−2). This combination of a more positive Ecorr and reduced icorr for the coated sample highlights the graphene layer’s ability to inhibit the MIC effects of sulfate-reducing bacteria. Additional destructive analysis involving CV was undertaken on the 42nd day (Figure 3i). After the four CV cycles, the bare Cu (111) displayed considerable deterioration, while the coated SLG/Cu (111) sample exhibited minimal degradation, as also supported by the Auger profiles (Figure 4f).
SEM images of both surfaces after the 42-day exposure displayed distinct signatures of MIC attack. The biofilm growth on these single-crystal copper surfaces was lesser compared to that on PC-Cu substrates (results not shown). This finding can be attributed to the absence of grain boundaries with conformal, smoother, and uniform graphene layers (Figure 1), which restricts the adhesion of OA-G20 cells [64]. However, bare Cu (111) (Figure 4a) encouraged more biofilm formation than SLG/Cu (111) (Figure 4b).
The bare Cu (111) that lacked graphene films displayed thicker, robust, and rigid biofilm compared to SLG/Cu (111). The biofilm on the SLG/Cu (111) was weakly attached to the surface and readily detached when treated with glutaraldehyde. Subsequently, the total biofilm volume measured on bare Cu (111) (5783 ± 309 µm3) exceeded that on SLG/Cu (111) (1531 ± 309 µm3) (Figure 4c). The biofilm’s extent, the number of attached bacterial cells, and the volume of corrosion byproducts byproducts confirmed higher corrosion on bare Cu (111) (Figure 4d) compared to SLG/Cu (111)) (Figure 4e).

3.3. Mechanism of Corrosion Prevention by Graphene on Single Cu (111) Crystals:

In general, Cu undergoes corrosion through biogenic sulfide and proton mediated reactions as follows [65]:
2 C u + H S   + H + C u 2 S   s + H 2                                             Δ G 0 = 58.3 kJ / mol
This excessive flow of biogenic HS generated by SRB is compensated by a rapid supply of electrons from the Cu oxidation to form Cu(HS)ads [66]. As reported in our earlier studies [4,46], single-layered graphene coatings grown on polycrystalline Cu (PC-Cu) are dominated by a greater number of grain boundaries that promote higher charge injection tendency resulting in more Cu(HS)ads as follows:
C u + H S C u H S a d s +   e
This chemisorbed species accounts for the rapid drop of corrosion potential of the Cu electrode forming Cu2S and H2S as follows [67,68]. It can also be noted that higher biofilm volume (Figure 4c) increased the locally available H2S throughout the biofilm, further increasing the corrosion and forming more Cu2S, as confirmed by XRD (Figure 4g,h).
C u + C u ( H S ) a d s + H S   C u 2 S + H 2 S + e
However, SLG/Cu (111) is characterized by conformal, uniform, and smoother graphene growth (Figure 1). This improved the work function of SLG/Cu (111), resisted the SRB attachment, and improved the overall corrosion resistance [69]. In the case of bare Cu (111), the absence of graphene has provided direct access to the Cu surface, leading to more corrosion than with SLG/Cu (111).
Elemental distribution of the exposed surfaces analyzed with Auger electron spectroscopy (AES) supported the above mechanism with the presence of sulfur (S), chloride (Cl), and oxygen (O) on bare Cu (111) (Figure 4f). SLG/Cu (111) surfaces did not show any dominant O and S spectra in AES analysis. Subsequent XRD analysis on these exposed surfaces revealed differences in the composition of resulting corrosion products. The bare Cu (111) featured chalcocite and copper sulfide as corrosion products (Figure 4g), while SLG/Cu (111) exhibited copper sulfide (Figure 4h), although with a notably diminished peak intensity. Elemental mapping using EDS delineated each sample’s elemental composition of the corrosion products (Figure S6). The bare Cu (111) sample displayed Cu, S, O, and C, signifying the presence of sulfides. Notably, the S signature was prevalent throughout the EDS image, underscoring Cu corrosion mechanisms. In contrast, the coated sample contained a lesser S component than the bare sample, substantiating its lower corrosion extent, a direct consequence of the protective graphene layer. Both samples exhibited C and O signatures, potentially attributable to carboxy components, such as the carbon–oxygen bonds (C-O and C=O) inherent to the extracellular polymeric substances (EPSs) of biofilms formed on the sample surfaces [22].
Pitting profile analysis after removing the biofilm and corrosion product indicated higher pitting corrosion in bare Cu (111) compared to SLG/Cu (111) (Figure 4i). The average pit depth of 10 largest pits on bare Cu (111) was 6.5 ± 1.1 µm compared to a shallower pit depth of 3.4 ± 0.5 µm on SLG/Cu (111). The presence of SLG demonstrated its efficacy in safeguarding the Cu surface against severe pitting corrosion by deterring the attachment of SRB biofilms.

4. Conclusions

Graphene, a single layer of carbon atoms in a hexagonal lattice, can form ultra-thin protective coatings on metals against abiotic and microbial corrosion, but defects like grain boundaries increase its vulnerability to chemical corrodents and aggressive bacteria. The CVD techniques used in this study pave a path for forming high-performance graphene coatings by growing them as a single layer on single copper (111) crystals. Owing to the similar hexagonal crystal structure between graphene and Cu (111) and faster diffusion-induced CVD growth rate, we were able to grow high-quality, defect-free, single-layered graphene on Cu (111) substrates. The electrochemical performance of SLG/Cu (111) attests to its quality, showing improved corrosion resistance under both biotic and abiotic environments. The SLG/Cu (111) showed higher resistance to corrosion in EIS (Nyquist, Bode), higher corrosion potential, and lower corrosion rate than bare Cu (111). From equivalent electrical circuit analysis, SLG/Cu (111) showed a 2-fold higher charge transfer resistance and a 4-fold higher pore resistance than bare Cu (111). The absence of grain boundaries and smoother graphene offered reduced energy levels for SRBs to attack the Cu surfaces, hence discouraging the formation of excessive sulfides. As a result, SLG/Cu (111) was found to have lower biofilm volume. Overall, smoother and high-quality graphene on SLG/Cu (111) collectively inhibited the corrosion current, resulting in higher protection. This implies the importance of the quality of the graphene and the crystallinity effect on the corrosion mechanism. Future investigation can comprise fundamental studies to measure adsorption energies for the adhesion of relevant biomolecules responsible for the adhesion of SRB cells on basal planes versus defective regions, including grain boundaries.

Supplementary Materials

The following supporting information can be downloaded at: https://www.mdpi.com/article/10.3390/coatings14060656/s1.

Author Contributions

Conceptualization, M.M.H. and V.G.; Data curation, R.D.; Funding acquisition, V.G.; Investigation, M.M.H.; Methodology, P.S. and V.G.; Project administration, V.G.; Resources, V.G.; Supervision, V.G.; Validation, R.D., P.S., A.L., B.K.J., R.A. and V.G.; Writing—original draft, M.M.H.; Writing—review and editing, R.D. and P.S. All authors have read and agreed to the published version of the manuscript.

Funding

This research was funded by National Science Foundation (NSF) RII FEC (#1849206, #1920954) and NSF CAREER (#1454102).

Institutional Review Board Statement

Not applicable.

Informed Consent Statement

Not applicable.

Data Availability Statement

The datasets generated during and/or analyzed during the current study are available from the corresponding author upon reasonable request.

Acknowledgments

We acknowledge the assistance of the Department of Civil and Environmental Engineering at South Dakota Mines.

Conflicts of Interest

The authors affirm that they do not possess any known competing financial interest or personal relationship that could have potentially influenced the work reported in the paper.

References

  1. Coatings, T.I. The Real Cost of Corrosion. 2013. Available online: https://www.thomasindcoatings.com/the-real-cost-of-corrosion/ (accessed on 12 December 2023).
  2. Singh, A.K. Introduction to Corrosion. In Microbially Induced Corrosion and Its Mitigation. SpringerBriefs in Materials; Springer: Singapore, 2020. [Google Scholar] [CrossRef]
  3. Dou, W.; Xu, D.; Gu, T. Biocorrosion caused by microbial biofilms is ubiquitous around us. Microb. Biotechnol. 2021, 14, 803–805. [Google Scholar] [CrossRef]
  4. Chilkoor, G.; Shrestha, N.; Kutana, A.; Tripathi, M.; Robles Hernández, F.C.; Yakobson, B.I.; Meyyappan, M.; Dalton, A.B.; Ajayan, P.M.; Rahman, M.M. Atomic layers of graphene for microbial corrosion prevention. ACS Nano 2020, 15, 447–454. [Google Scholar] [CrossRef] [PubMed]
  5. BSRIA WMI. Opportunities for Copper in Water and Waste Water Treatment. Available online: https://copperalliance.org/wp-content/uploads/2021/08/fact-sheet-opportunities-for-copper-in-water-and-waste-water-treatment-1.pdf (accessed on 18 December 2023).
  6. Böhm, S. Graphene against corrosion. Nat. Nanotechnol. 2014, 9, 741–742. [Google Scholar] [CrossRef]
  7. Krishnamurthy, A.; Gadhamshetty, V.; Mukherjee, R.; Natarajan, B.; Eksik, O.; Ali Shojaee, S.; Lucca, D.A.; Ren, W.; Cheng, H.-M.; Koratkar, N. Superiority of Graphene over Polymer Coatings for Prevention of Microbially Induced Corrosion. Sci. Rep. 2015, 5, 13858. [Google Scholar] [CrossRef]
  8. Zheludkevich, M.L.; Salvado, I.M.; Ferreira, M.G.S. Sol–gel coatings for corrosion protection of metals. J. Mater. Chem. 2005, 15, 5099–5111. [Google Scholar] [CrossRef]
  9. Ocón, P.; Cristobal, A.B.; Herrasti, P.; Fatas, E. Corrosion performance of conducting polymer coatings applied on mild steel. Corros. Sci. 2005, 47, 649–662. [Google Scholar] [CrossRef]
  10. Tan, C.K.; Blackwood, D.J. Corrosion protection by multilayered conducting polymer coatings. Corros. Sci. 2003, 45, 545–557. [Google Scholar] [CrossRef]
  11. Chen, F.; Liu, P. Conducting Polyaniline Nanoparticles and Their Dispersion for Waterborne Corrosion Protection Coatings. ACS Appl. Mater. Interfaces 2011, 3, 2694–2702. [Google Scholar] [CrossRef]
  12. Chen, Y.; Wang, X.; Li, J.; Lu, J.; Wang, F. Polyaniline for corrosion prevention of mild steel coupled with copper. Electrochim. Acta 2007, 52, 5392–5399. [Google Scholar] [CrossRef]
  13. González-García, Y.; González, S.; Souto, R.M. Electrochemical and structural properties of a polyurethane coating on steel substrates for corrosion protection. Corros. Sci. 2007, 49, 3514–3526. [Google Scholar] [CrossRef]
  14. Khorgami, G.; Solaimany, F.; Haddadi, S.A.; Ramezanzadeh, M.; Ramezanzadeh, B. Polyurethanes for Corrosion Protective Coatings. In Polyurethanes: Preparation, Properties, and Applications Volume 1: Fundamentals; ACS Publications: Washington, DC, USA, 2023; pp. 133–159. [Google Scholar]
  15. Alrashed, M.M.; Jana, S.; Soucek, M.D. Corrosion performance of polyurethane hybrid coatings with encapsulated inhibitor. Prog. Org. Coat. 2019, 130, 235–243. [Google Scholar] [CrossRef]
  16. Cai, R.; Sun, M.; Chen, Z.; Munoz, R.; O’Neill, C.; Beving, D.E.; Yan, Y. Ionothermal synthesis of oriented zeolite AEL films and their application as corrosion-resistant coatings. Angew. Chem. Int. Ed. 2008, 47, 525–528. [Google Scholar] [CrossRef] [PubMed]
  17. Verma, C.; Quraishi, M.; Hussain, C.M. Greenly synthesized zeolites as sustainable materials for corrosion protection: Design, technology and application. Adv. Colloid Interface Sci. 2023, 314, 102868. [Google Scholar] [CrossRef] [PubMed]
  18. Yang, X.; Zhang, R.; Pu, J.; He, Z.; Xiong, L. 2D graphene and h-BN layers application in protective coatings. Corros. Rev. 2021, 39, 93–107. [Google Scholar] [CrossRef]
  19. Yan, H.; Li, W.; Li, H.; Fan, X.; Zhu, M. Ti3C2 MXene nanosheets toward high-performance corrosion inhibitor for epoxy coating. Prog. Org. Coat. 2019, 135, 156–167. [Google Scholar] [CrossRef]
  20. Tanjil, M.R.-E.; Jeong, Y.; Yin, Z.; Panaccione, W.; Wang, M.C. Ångström-scale, atomically thin 2D materials for corrosion mitigation and passivation. Coatings 2019, 9, 133. [Google Scholar] [CrossRef]
  21. Huang, H.; Sheng, X.; Tian, Y.; Zhang, L.; Chen, Y.; Zhang, X. Two-Dimensional Nanomaterials for Anticorrosive Polymeric Coatings: A Review. Ind. Eng. Chem. Res. 2020, 59, 15424–15446. [Google Scholar] [CrossRef]
  22. Chilkoor, G.; Karanam, S.P.; Star, S.; Shrestha, N.; Sani, R.K.; Upadhyayula, V.K.; Ghoshal, D.; Koratkar, N.A.; Meyyappan, M.; Gadhamshetty, V. Hexagonal boron nitride: The thinnest insulating barrier to microbial corrosion. ACS Nano 2018, 12, 2242–2252. [Google Scholar] [CrossRef] [PubMed]
  23. Mahvash, F.; Eissa, S.; Bordjiba, T.; Tavares, A.; Szkopek, T.; Siaj, M. Corrosion resistance of monolayer hexagonal boron nitride on copper. Sci. Rep. 2017, 7, 42139. [Google Scholar] [CrossRef]
  24. Husain, E.; Narayanan, T.N.; Taha-Tijerina, J.J.; Vinod, S.; Vajtai, R.; Ajayan, P.M. Marine corrosion protective coatings of hexagonal boron nitride thin films on stainless steel. ACS Appl. Mater. Interfaces 2013, 5, 4129–4135. [Google Scholar] [CrossRef]
  25. Allen, C.; Aryal, S.; Do, T.; Gautum, R.; Hasan, M.M.; Jasthi, B.K.; Gnimpieba, E.; Gadhamshetty, V. Deep learning strategies for addressing issues with small datasets in 2D materials research: Microbial Corrosion. Front. Microbiol. 2022, 13, 1059123. [Google Scholar] [CrossRef]
  26. Kalita, G.; Ayhan, M.E.; Sharma, S.; Shinde, S.M.; Ghimire, D.; Wakita, K.; Umeno, M.; Tanemura, M. Low temperature deposited graphene by surface wave plasma CVD as effective oxidation resistive barrier. Corros. Sci. 2014, 78, 183–187. [Google Scholar] [CrossRef]
  27. Ren, S.; Cui, M.; Liu, C.; Wang, L. A comprehensive review on ultrathin, multi-functionalized, and smart graphene and graphene-based composite protective coatings. Corros. Sci. 2023, 212, 110939. [Google Scholar] [CrossRef]
  28. Markets, M.A. Graphene Coating Market by Product Type (Solvent-Based and Water-Based), Application (Corrosion-Resistant Coating, Scratch-Resistant Coating, Antifouling Coating, Flame-Retardant Coating), End-Use industry, and Region-Global Forecast to 2028. 2023. Available online: https://www.marketsandmarkets.com/Market-Reports/graphene-coating-market-69854439.html (accessed on 12 December 2023).
  29. Bunch, J.S.; Verbridge, S.S.; Alden, J.S.; van der Zande, A.M.; Parpia, J.M.; Craighead, H.G.; McEuen, P.L. Impermeable Atomic Membranes from Graphene Sheets. Nano Lett. 2008, 8, 2458–2462. [Google Scholar] [CrossRef] [PubMed]
  30. Berry, V. Impermeability of graphene and its applications. Carbon 2013, 62, 1–10. [Google Scholar] [CrossRef]
  31. Luo, D.; Wang, M.; Li, Y.; Kim, C.; Yu, K.M.; Kim, Y.; Han, H.; Biswal, M.; Huang, M.; Kwon, Y. Adlayer-free large-area single crystal graphene grown on a Cu (111) foil. Adv. Mater. 2019, 31, 1903615. [Google Scholar] [CrossRef]
  32. Ansari, R.; Motevalli, B.; Montazeri, A.; Ajori, S. Fracture analysis of monolayer graphene sheets with double vacancy defects via MD simulation. Solid State Commun. 2011, 151, 1141–1146. [Google Scholar] [CrossRef]
  33. Lee, G.-D.; Wang, C.; Yoon, E.; Hwang, N.-M.; Kim, D.-Y.; Ho, K. Diffusion, coalescence, and reconstruction of vacancy defects in graphene layers. Phys. Rev. Lett. 2005, 95, 205501. [Google Scholar] [CrossRef]
  34. Kim, J.-H.; Hwang, J.H.; Suh, J.; Tongay, S.; Kwon, S.; Hwang, C.; Wu, J.; Young Park, J. Work function engineering of single layer graphene by irradiation-induced defects. Appl. Phys. Lett. 2013, 103, 171604. [Google Scholar] [CrossRef]
  35. Long, F.; Yasaei, P.; Sanoj, R.; Yao, W.; Král, P.; Salehi-Khojin, A.; Shahbazian-Yassar, R. Characteristic work function variations of graphene line defects. ACS Appl. Mater. Interfaces 2016, 8, 18360–18366. [Google Scholar] [CrossRef]
  36. Yazyev, O.V.; Louie, S.G. Topological defects in graphene: Dislocations and grain boundaries. Phys. Rev. B 2010, 81, 195420. [Google Scholar] [CrossRef]
  37. Balasubramanian, K.; Biswas, T.; Ghosh, P.; Suran, S.; Mishra, A.; Mishra, R.; Sachan, R.; Jain, M.; Varma, M.; Pratap, R. Reversible defect engineering in graphene grain boundaries. Nat. Commun. 2019, 10, 1090. [Google Scholar] [CrossRef] [PubMed]
  38. Lee, J.; Berman, D. Inhibitor or promoter: Insights on the corrosion evolution in a graphene protected surface. Carbon 2018, 126, 225–231. [Google Scholar] [CrossRef]
  39. Wood, J.D.; Schmucker, S.W.; Lyons, A.S.; Pop, E.; Lyding, J.W. Effects of Polycrystalline Cu Substrate on Graphene Growth by Chemical Vapor Deposition. Nano Lett. 2011, 11, 4547–4554. [Google Scholar] [CrossRef]
  40. Cho, J.; Gao, L.; Tian, J.; Cao, H.; Wu, W.; Yu, Q.; Yitamben, E.N.; Fisher, B.; Guest, J.R.; Chen, Y.P.; et al. Atomic-Scale Investigation of Graphene Grown on Cu Foil and the Effects of Thermal Annealing. ACS Nano 2011, 5, 3607–3613. [Google Scholar] [CrossRef] [PubMed]
  41. Phan, H.D.; Jung, J.; Kim, Y.; Huynh, V.N.; Lee, C. Large-area single-crystal graphene grown on a recrystallized Cu(111) surface by using a hole-pocket method. Nanoscale 2016, 8, 13781–13789. [Google Scholar] [CrossRef] [PubMed]
  42. Ani, M.H.; Kamarudin, M.A.; Ramlan, A.H.; Ismail, E.; Sirat, M.S.; Mohamed, M.A.; Azam, M.A. A critical review on the contributions of chemical and physical factors toward the nucleation and growth of large-area graphene. J. Mater. Sci. 2018, 53, 7095–7111. [Google Scholar] [CrossRef]
  43. Skriver, H.L.; Rosengaard, N. Surface energy and work function of elemental metals. Phys. Rev. B 1992, 46, 7157. [Google Scholar] [CrossRef] [PubMed]
  44. Eckmann, A.; Felten, A.; Mishchenko, A.; Britnell, L.; Krupke, R.; Novoselov, K.S.; Casiraghi, C. Probing the Nature of Defects in Graphene by Raman Spectroscopy. Nano Lett. 2012, 12, 3925–3930. [Google Scholar] [CrossRef]
  45. Jawaharraj, K.; Sigdel, P.; Gu, Z.; Muthusamy, G.; Sani, R.K.; Gadhamshetty, V. Photosynthetic microbial fuel cells for methanol treatment using graphene electrodes. Environ. Res. 2022, 215, 114045. [Google Scholar] [CrossRef]
  46. Chilkoor, G.; Shrestha, N.; Karanam, S.P.; Upadhyayula, V.K.; Gadhamshetty, V. Graphene coatings for microbial corrosion applications. In Encyclopedia of Water: Science, Technology, and Society; Wiley: New York, NY, USA, 2019; pp. 1–25. [Google Scholar]
  47. Seifert, M.; Drieschner, S.; Blaschke, B.M.; Hess, L.H.; Garrido, J.A. Induction heating-assisted repeated growth and electrochemical transfer of graphene on millimeter-thick metal substrates. Diam. Relat. Mater. 2014, 47, 46–52. [Google Scholar] [CrossRef]
  48. Wang, Y.; Zheng, Y.; Xu, X.; Dubuisson, E.; Bao, Q.; Lu, J.; Loh, K.P. Electrochemical Delamination of CVD-Grown Graphene Film: Toward the Recyclable Use of Copper Catalyst. ACS Nano 2011, 5, 9927–9933. [Google Scholar] [CrossRef] [PubMed]
  49. Gao, L.; Ren, W.; Xu, H.; Jin, L.; Wang, Z.; Ma, T.; Ma, L.-P.; Zhang, Z.; Fu, Q.; Peng, L.-M. Repeated growth and bubbling transfer of graphene with millimetre-size single-crystal grains using platinum. Nat. Commun. 2012, 3, 699. [Google Scholar] [CrossRef] [PubMed]
  50. Kang, J.; Shin, D.; Bae, S.; Hong, B.H. Graphene transfer: Key for applications. Nanoscale 2012, 4, 5527–5537. [Google Scholar] [CrossRef] [PubMed]
  51. Chilkoor, G.; Jawaharraj, K.; Vemuri, B.; Kutana, A.; Tripathi, M.; Kota, D.; Arif, T.; Filleter, T.; Dalton, A.B.; Yakobson, B.I.; et al. Hexagonal Boron Nitride for Sulfur Corrosion Inhibition. ACS Nano 2020, 14, 14809–14819. [Google Scholar] [CrossRef] [PubMed]
  52. Jones, D.A. Principles and prevention. Corrosion 1996, 2, 168. [Google Scholar]
  53. Ferrari, A.C.; Meyer, J.C.; Scardaci, V.; Casiraghi, C.; Lazzeri, M.; Mauri, F.; Piscanec, S.; Jiang, D.; Novoselov, K.S.; Roth, S. Raman spectrum of graphene and graphene layers. Phys. Rev. Lett. 2006, 97, 187401. [Google Scholar] [CrossRef] [PubMed]
  54. Lu, J.; Lipatov, A.; Vorobeva, N.S.; Muratov, D.S.; Sinitskii, A. Photoswitchable monolayer and bilayer graphene devices enabled by in situ covalent functionalization. Adv. Electron. Mater. 2018, 4, 1800021. [Google Scholar] [CrossRef]
  55. Kim, D.W.; Lee, J.; Kim, S.J.; Jeon, S.; Jung, H.-T. The effects of the crystalline orientation of Cu domains on the formation of nanoripple arrays in CVD-grown graphene on Cu. J. Mater. Chem. C 2013, 1, 7819–7824. [Google Scholar] [CrossRef]
  56. Xu, M.; Fujita, D.; Sagisaka, K.; Watanabe, E.; Hanagata, N. Single-layer graphene nearly 100% covering an entire substrate. arXiv 2010, arXiv:1006.5085. [Google Scholar]
  57. Kondrashov, I.; Komlenok, M.; Pivovarov, P.; Savin, S.; Obraztsova, E.; Rybin, M. Preparation of copper surface for the synthesis of single-layer graphene. Nanomaterials 2021, 11, 1071. [Google Scholar] [CrossRef] [PubMed]
  58. Xu, X.; Zhang, Z.; Dong, J.; Yi, D.; Niu, J.; Wu, M.; Lin, L.; Yin, R.; Li, M.; Zhou, J. Ultrafast epitaxial growth of metre-sized single-crystal graphene on industrial Cu foil. Sci. Bull. 2017, 62, 1074–1080. [Google Scholar] [CrossRef] [PubMed]
  59. Habib, K.; Al-Sabti, F. Electrochemical impedence spectroscopy versus optical interferometry techniques during anodization of aluminium. Opt. Lasers Eng. 2001, 35, 225–232. [Google Scholar] [CrossRef]
  60. Ramasamy, R.P.; Gadhamshetty, V.; Nadeau, L.J.; Johnson, G.R. Impedance spectroscopy as a tool for non-intrusive detection of extracellular mediators in microbial fuel cells. Biotechnol. Bioeng. 2009, 104, 882–891. [Google Scholar] [CrossRef] [PubMed]
  61. Nkomo, D.; Masia, N. An insight on corrosion resistance ability of biocompatible dental implants through electrochemical impedance spectroscopy. In Corrosion-Fundamentals and Protection Mechanisms; IntechOpen: London, UK, 2021. [Google Scholar]
  62. Chauhan, P.; Kumari, P.; Kumar, A. An environmentally friendly copper-based superhydrophobic coating on steel substrate via electrodeposition to reduce corrosion. In Proceedings of the Bioinspiration, Biomimetics, and Bioreplication XIII, Long Beach, CA, USA, 12–17 March 2023; pp. 117–121. [Google Scholar]
  63. Singh, M.K.; Gautam, R.K.; Ji, G. Mechanical properties and corrosion behavior of copper based hybrid composites synthesized by stir casting. Results Phys. 2019, 13, 102319. [Google Scholar] [CrossRef]
  64. Devadig, R.; Gurung, B.D.S.; Gnimpieba, E.; Jasthi, B.; Gadhamshetty, V. Computational methods for biofouling and corrosion-resistant graphene nanocomposites. A transdisciplinary approach. In Proceedings of the 2023 IEEE International Conference on Bioinformatics and Biomedicine (BIBM), Istanbul, Turkey, 5–8 December 2023; pp. 4494–4496. [Google Scholar]
  65. Huttunen-Saarivirta, E.; Rajala, P.; Carpén, L. Corrosion behaviour of copper under biotic and abiotic conditions in anoxic ground water: Electrochemical study. Electrochim. Acta 2016, 203, 350–365. [Google Scholar] [CrossRef]
  66. Chen, J.; Qin, Z.; Shoesmith, D. Long-term corrosion of copper in a dilute anaerobic sulfide solution. Electrochim. Acta 2011, 56, 7854–7861. [Google Scholar] [CrossRef]
  67. Dou, W.; Jia, R.; Jin, P.; Liu, J.; Chen, S.; Gu, T. Investigation of the mechanism and characteristics of copper corrosion by sulfate reducing bacteria. Corros. Sci. 2018, 144, 237–248. [Google Scholar] [CrossRef]
  68. Raya, D.; Shreya, A.; Kumar, A.; Giri, S.K.; Salem, D.R.; Gnimpieba, E.Z.; Gadhamshetty, V.; Dhiman, S.S. Molecular regulation of conditioning film formation and quorum quenching in sulfate reducing bacteria. Front. Microbiol. 2022, 13, 1008536. [Google Scholar] [CrossRef]
  69. Hasan, M.M.; Sikder, R.; Jasthi, B.K.; Gnimpieba, E.Z.; Gadhamshetty, V. Discovery of 2D Materials with Machine Learning. In Machine Learning in 2D Materials Science; CRC Press: Boca Raton, FL, USA, 2023; pp. 59–88. [Google Scholar]
Figure 1. Bare Cu and SLG/Cu (111) synthesis and characterization: (a) XRD analysis confirms the presence of the (111) crystalline structure, (b) electrochemical delamination technique, (c) transfer of graphene graphene (region 2) on Si/SiO2 (region 1), (d) CLSM image of transferred graphene, (e) Raman spectroscopy confirming SLG, (f) the nano auger spectra confirming conformity and defect-free graphene at different regions (1, 2, 3) of the Cu sample, (g) AFM image of SLG/Cu (111) sample, (h) contact angle measurement of both bare (above) and SLG/Cu (111) (below).
Coatings 14 00656 g001
Figure 2. Electrochemical corrosion test analysis of SLG/Cu (111) sample established corrosion resistance of graphene coating in 0.5 M H2SO4 solution: demonstrating several key points: (a) the coated SLG/Cu (111) sample exhibited a higher open-circuit potential, (b) displayed a higher absolute impedance at low frequency represented by y-intercept for SLG/Cu (111) reflecting higher corrosion resistance compared to Bare Cu (111) in the Bode plot, (c) depicted distinctive features in the Nyquist plot, (d) exhibited a characteristic pattern in the Tafel plot, (e) showed a lower Tafel corrosion rate, and (f) demonstrated a lower corrosion current density compared to the uncoated sample.
Coatings 14 00656 g002
Figure 3. Electrochemical corrosion test analysis of SLG/Cu (111) established corrosion resistance of graphene coating in sulfate-reducing bacterial (Oleidesulfovibrio alaskensis G20) environment: Nyquist plot exhibiting impedance to corrosion for both bare and SLG-coated Cu (111) samples on (a) day 0, (b) day 21, and (c) day 42. Bode plots for both samples on (d) day 0, (e) day 21, and (f) day 42 showing consistently higher absolute impedance at low frequency for SLG/Cu (111) implying higher corrosion resistance compared to bare Cu (111) throughout the test duration (g) corrosion current density, icorr, and polarization resistance, Rp of both, were monitored from day 0 to 42. (h) Tafel plot exhibited higher corrosion resistance for SLG/Cu (111) sample, and (i) cyclic voltammetry was conducted to further investigate the electrochemical properties of the samples.
Coatings 14 00656 g003
Figure 4. Post-corrosion analysis of exposed samples. SEM images of exposed (a) bare Cu (111) and (b) SLG/Cu (111) on (c) biofilm volume on day 42 on both samples; visible morphologies of biofilm and corrosion products of (d) bare Cu and (e) SLG/Cu (111); (f) Nano Auger spectra highlighting the elemental composition of corrosion products; (g) XRD of bare Cu (111) and (h) SLG/Cu (111); (i) pitting profile obtained for ten largest pits.
Coatings 14 00656 g004
Disclaimer/Publisher’s Note: The statements, opinions and data contained in all publications are solely those of the individual author(s) and contributor(s) and not of MDPI and/or the editor(s). MDPI and/or the editor(s) disclaim responsibility for any injury to people or property resulting from any ideas, methods, instructions or products referred to in the content.

