Article

Experimental Evaluation of Ceramic Coatings for Die Protection in Low-Pressure Die-Casting Process

1
Tekniker, Basque Research and Technology Aliance (BRTA), 20600 Eibar, Spain
2
Foseco Española S.A., 48213 Izurtza, Spain
3
Befesa Aluminio S.L., 48950 Erandio, Spain
4
Aalberts Surface Technologies, 48291 Atxondo, Spain
5
Aurrenak S. Coop. L., 01010 Gazteiz, Spain
6
Edertek S. Coop., 20500 Arrasate, Spain
*
Authors to whom correspondence should be addressed.
Coatings 2024, 14(5), 643; https://doi.org/10.3390/coatings14050643
Submission received: 3 May 2024 / Revised: 16 May 2024 / Accepted: 17 May 2024 / Published: 19 May 2024

Abstract

:
One of the most important factors in the LPDC process is the heat transfer during the solidification of the molten alloys, which is responsible for the resulting microstructure and, thus, the quality of the cast piece. The use of foundry coatings has been lately suggested as a proper strategy to control the heat transfer while protecting bonded moulds from aluminium adhesion by providing a barrier between the surface and the liquid metal. LPDC die coating failures usually come from the loss of adherence or excessive wear originated in the successive filling processes, which requires stopping production for the reapplication of the coating. In the present work, coatings with different insulation capabilities have been evaluated, in terms of adherence and wear tests, in order to select the most promising alternative for LPDC die coating. This study confirmed that surface preparation and cleanliness are vital for an adequate adhesion of the coatings to ensure their durability. The results evinced that the use of a primer layer provided a higher adhesion of the coatings and considerably improved their perfomance. The coating that presented the best results in terms of adhesion and wear resistance under different abrasive testing conditions was coating B3.

1. Introduction

Aluminium and its alloys are nowadays the most commonly used non-ferrous metals due to their versatility and unique relation of properties [1]. Their outstanding properties, including low density, high strength-to-weight ratio, and excellent castability, make aluminium casting the reference material in the automotive industry (for engine blocks, heads, pistons, etc.), [2,3], where its use continues to grow at the expense of iron castings [4]. The use of aluminium castings has increased despite their higher cost due to the continuous market requirement of reducing vehicle weight and increasing fuel efficiency. The use of aluminium casting alloys as substitutes for traditional cast iron components can account for a reduction of 40–50% of the total weight of an average vehicle [5].
Aluminium alloys can be cast by several processes, such as gravity die in a permanent mould casting, low-pressure die casting (LPDC) in a metal die using sand cores, high-pressure die casting (HPDC), lost foam, squeeze casting, etc. [6]. Although LPDC is rather slow and expensive, high-quality castings can be produced reliably, which has made this process a preferred method for casting high-quality components such as car wheels, cylinder heads, manifolds, and transmissions [7,8,9]. The cast samples and components obtained by LPDC are of high quality, both in metallurgical and dimensionally terms, as well as possess a good surface finishing and the possibility of casting complex geometries using sand cores. The metallurgical quality is obtained by the filling process, which is carried out from a bath in the bottom of the mould, avoiding the contaminated surface layer, at a low pressure that ensures the absence of turbulence and oxide entrapment. Furthermore, the solidification of the cast samples is directional, which enables a constant feeding of the casting by the maintenance of pressure from below manifolds [10,11].
The metal die is mounted above a sealed furnace containing molten metal and a refractory-lined tube, called a riser tube, extending from the bottom of the die into the molten metal. When air is introduced into the furnace under low pressure (15–100 kPa), the molten metal ascends within the tube to enter the die cavity with low turbulence. The air in the die escapes through vents and the parting lines of the die. Once the metal has solidified, the air pressure is released, allowing the still-molten metal in the riser tube to fall back into the metal reservoir. After a proper time, when the cast sample is fully solidified, the die is opened to extract the sample [12,13,14].
When aluminium alloys are cast, there are many potential sources of defects which can harm the quality of the cast part. All aluminium alloys are subject to shrinkage defects, gas porosity, oxide inclusions, etc. [15]. One of the most important factors in the LPDC process is the heat transfer during the solidification of the molten alloys [16,17], which is responsible for the resulting microstructure that the quality of the cast piece is based on [18]. The cycle time of the process also depends on the dynamics of the heat transfer [11], being shorter for higher heat transfer. A close control of the heat transfer during the solidification stage of the cast samples on the different areas of the mould cavities is important to prevent shrinkage porosity, ensuring a proper control of the contraction dynamics [11,19].
In this regard, the use of foundry coatings has been lately suggested as a proper strategy to prevent moulds from producing defective castings by providing a barrier between the surface and the liquid metal [20]. Furthermore, among the functions of the coating layer (50–200 μm thick) is the facilitation of the removal of the casting after solidification, protecting the surface of the mould and preventing the adhesion of the aluminium alloy to the surface of the mould along with the control of the solidification pattern [11]. To have a proper casting process, the die should be pre-heated up to 100 °C–200 °C to avoid thermal shock and fracture along with preventing the premature solidification of the aluminium alloy before the filling is completed. Then, the aluminium is filled into the die at around 700 °C. Once the die is filled, the solidification of the cast part is achieved by removing the heat from the molten alloy through the die/component interface [18]. The result is high-quality parts with adequate microstructures [21]. A proper heat transfer results in finer microstructures and higher mechanical properties (yield and impact strength) [22]. The heat transfer is governed by different factors related with the interfaces involved in the process, such as the solidified casting layer in the cast/mould interface, the coating composition and thickness, the mould material and its thermal conductivity, and the cooling system employed [11,19,22,23].
A main difference between conventional paints and foundry coatings is that the latter are designed to withstand the high temperatures of the molten metal, to act as a barrier between the molten metal and the mould surface, and to ensure a gradual solidification of the casting. They are also referred to as refractory coatings and consist of suspensions or refractory particles or minerals with high melting points in a liquid carrier, which evaporates from the surface, leaving the refractory on the coated surface. Furthermore, the evaporation rate leaves some air gaps within the coating and plays a critical role in the insulation capability, and hence, in the fluidity and solidification rate of the cast samples [4]. The casting surface finish depends on the particle size, so a proper selection of the coating composition is vital to achieve the desired surface quality of the cast samples [24,25]. Some examples of typical refractory materials employed in foundry coatings are silica flour, zircon flour, olivine, talc, mica, and clays.
Despite the benefits of using these foundry coatings, controlling its application is of paramount importance. In LPDC processes using foundry coatings, variations in the amount of die coating applied to the die were found to be the main reasons for dimensional inaccuracies [4]. Die distortion over time will also affect the dimensions of the castings [23,26], so the control of both the die and coating surface are necessary. LPDC die coating failures usually come from the loss of adherence or excessive wear originated in the successive filling processes, which requires stopping production for the reapplication of the coating. Even though chemical and physical parameters of refractory foundry coatings are known to specialists in the field [27,28,29,30], there is a lack of knowledge regarding the relationship of particle size of the refractory filler and the final appearance and erosion resistance of the layer deposited on the mould [20,31,32,33]. Several authors have claim for the need of a bridge between the foundry coating characteristics and tribological science in order to prove that an improved erosion resistance coating will help to produce better quality cast parts [20,31,32,34,35].
The present work provides novel insights into the relationship between the conductivity, adhesion, and wear resistance of coatings with different insulation capabilities to be used for the protection of LPDC die moulds. The adhesion was assessed through pull-off tests (ISO 4624 [36]), which has been considered the most appropriate to simulate the failure of coatings when it is extracted from the die due to the sticking of the aluminium. The wear of the coatings was evaluated by falling abrasive and taber abrasion tests to simulate erosion and abrasion taking place in the filling process, respectively. The basic characterization of the thickness and roughness are also included. Finally, as an additional result of the investigation, some key actions on the coating application method have been highlighted as recommendations for the industry.

2. Materials and Methods

2.1. Substrates and Coatings

The substrate material employed in the work was an AISI H11 (1.2343) steel, as representative of the typical die steel used in LPDC processes. The material was received under annealed conditions (~200 HB), and it was heat treated to increase its hardness by quenching in oil after 0.5 h at 1020 °C and double tempering, according to the steel manufacturer, to achieve the final hardness of the substrate of 37–38 HRC. The following picture shows the resulting martensitic structure obtained after the heat treatment. The mechanical properties of the heat-treated material are presented in Table 1, and the microstructure is shown in Figure 1.
The size of the samples manufactured for this work was of 100 mm × 100 mm × 5 mm. Three different surface finishing pre-treatments were evaluated: grinding, polishing, and shot blasting. The roughness of the samples for the three surface pre-treatments measured with a Perthometer M2 (Mar GmBH, Germany) profilometer [X] is collected in Table 2. Whenever the substate roughness is not mentioned in the results, it refers to ground pre-treated samples.
All the coatings were applied above a 50 µm primer layer. Some tests were performed for the samples without the primer layer in order to evaluate the influence of this layer on the adhesion and performance of the coatings in the tests. Whenever no information is specified, it refers to the coating applied over the primer layer. The primer employed was the same in all the cases so as to have a direct comparison of the effect of this layer with the different coatings employed. The total target thickness of the coating systems was of 180 ± 30 µm. The primer layer applied was of 50 µm. In the samples without a primer, the minimum total thickness of 150 µm was reached just with the coating.
The coatings selected in this work were new experimental developments of Foseco, conceived in the frame of an industrial project, with different thermal conductivity and insulation capacities were selected. The information of the different coatings studied in this work is collected in Table 3. The seven coatings selected were as follows: a reference coating with very high insulation (A1) and a new development with similar insulation capacity (A2); a coating with medium insulation capacity (D1); a coating as reference of average insulation capacity (B1), a variant of B1 with extra binder (B2) and a new development based on B1 (B3); and a conductive coating containing graphite for the improved release of the cast samples (C1).
The composition of the coatings is confidential, but, in general terms, the high insulation coatings are manufactured with filler materials such as talc, mica, TiO2, limestone or quart, sodium silicate as a binder, and water as a thinner. In the case of the conductive coatings, half-colloidal graphite was employed as filler.
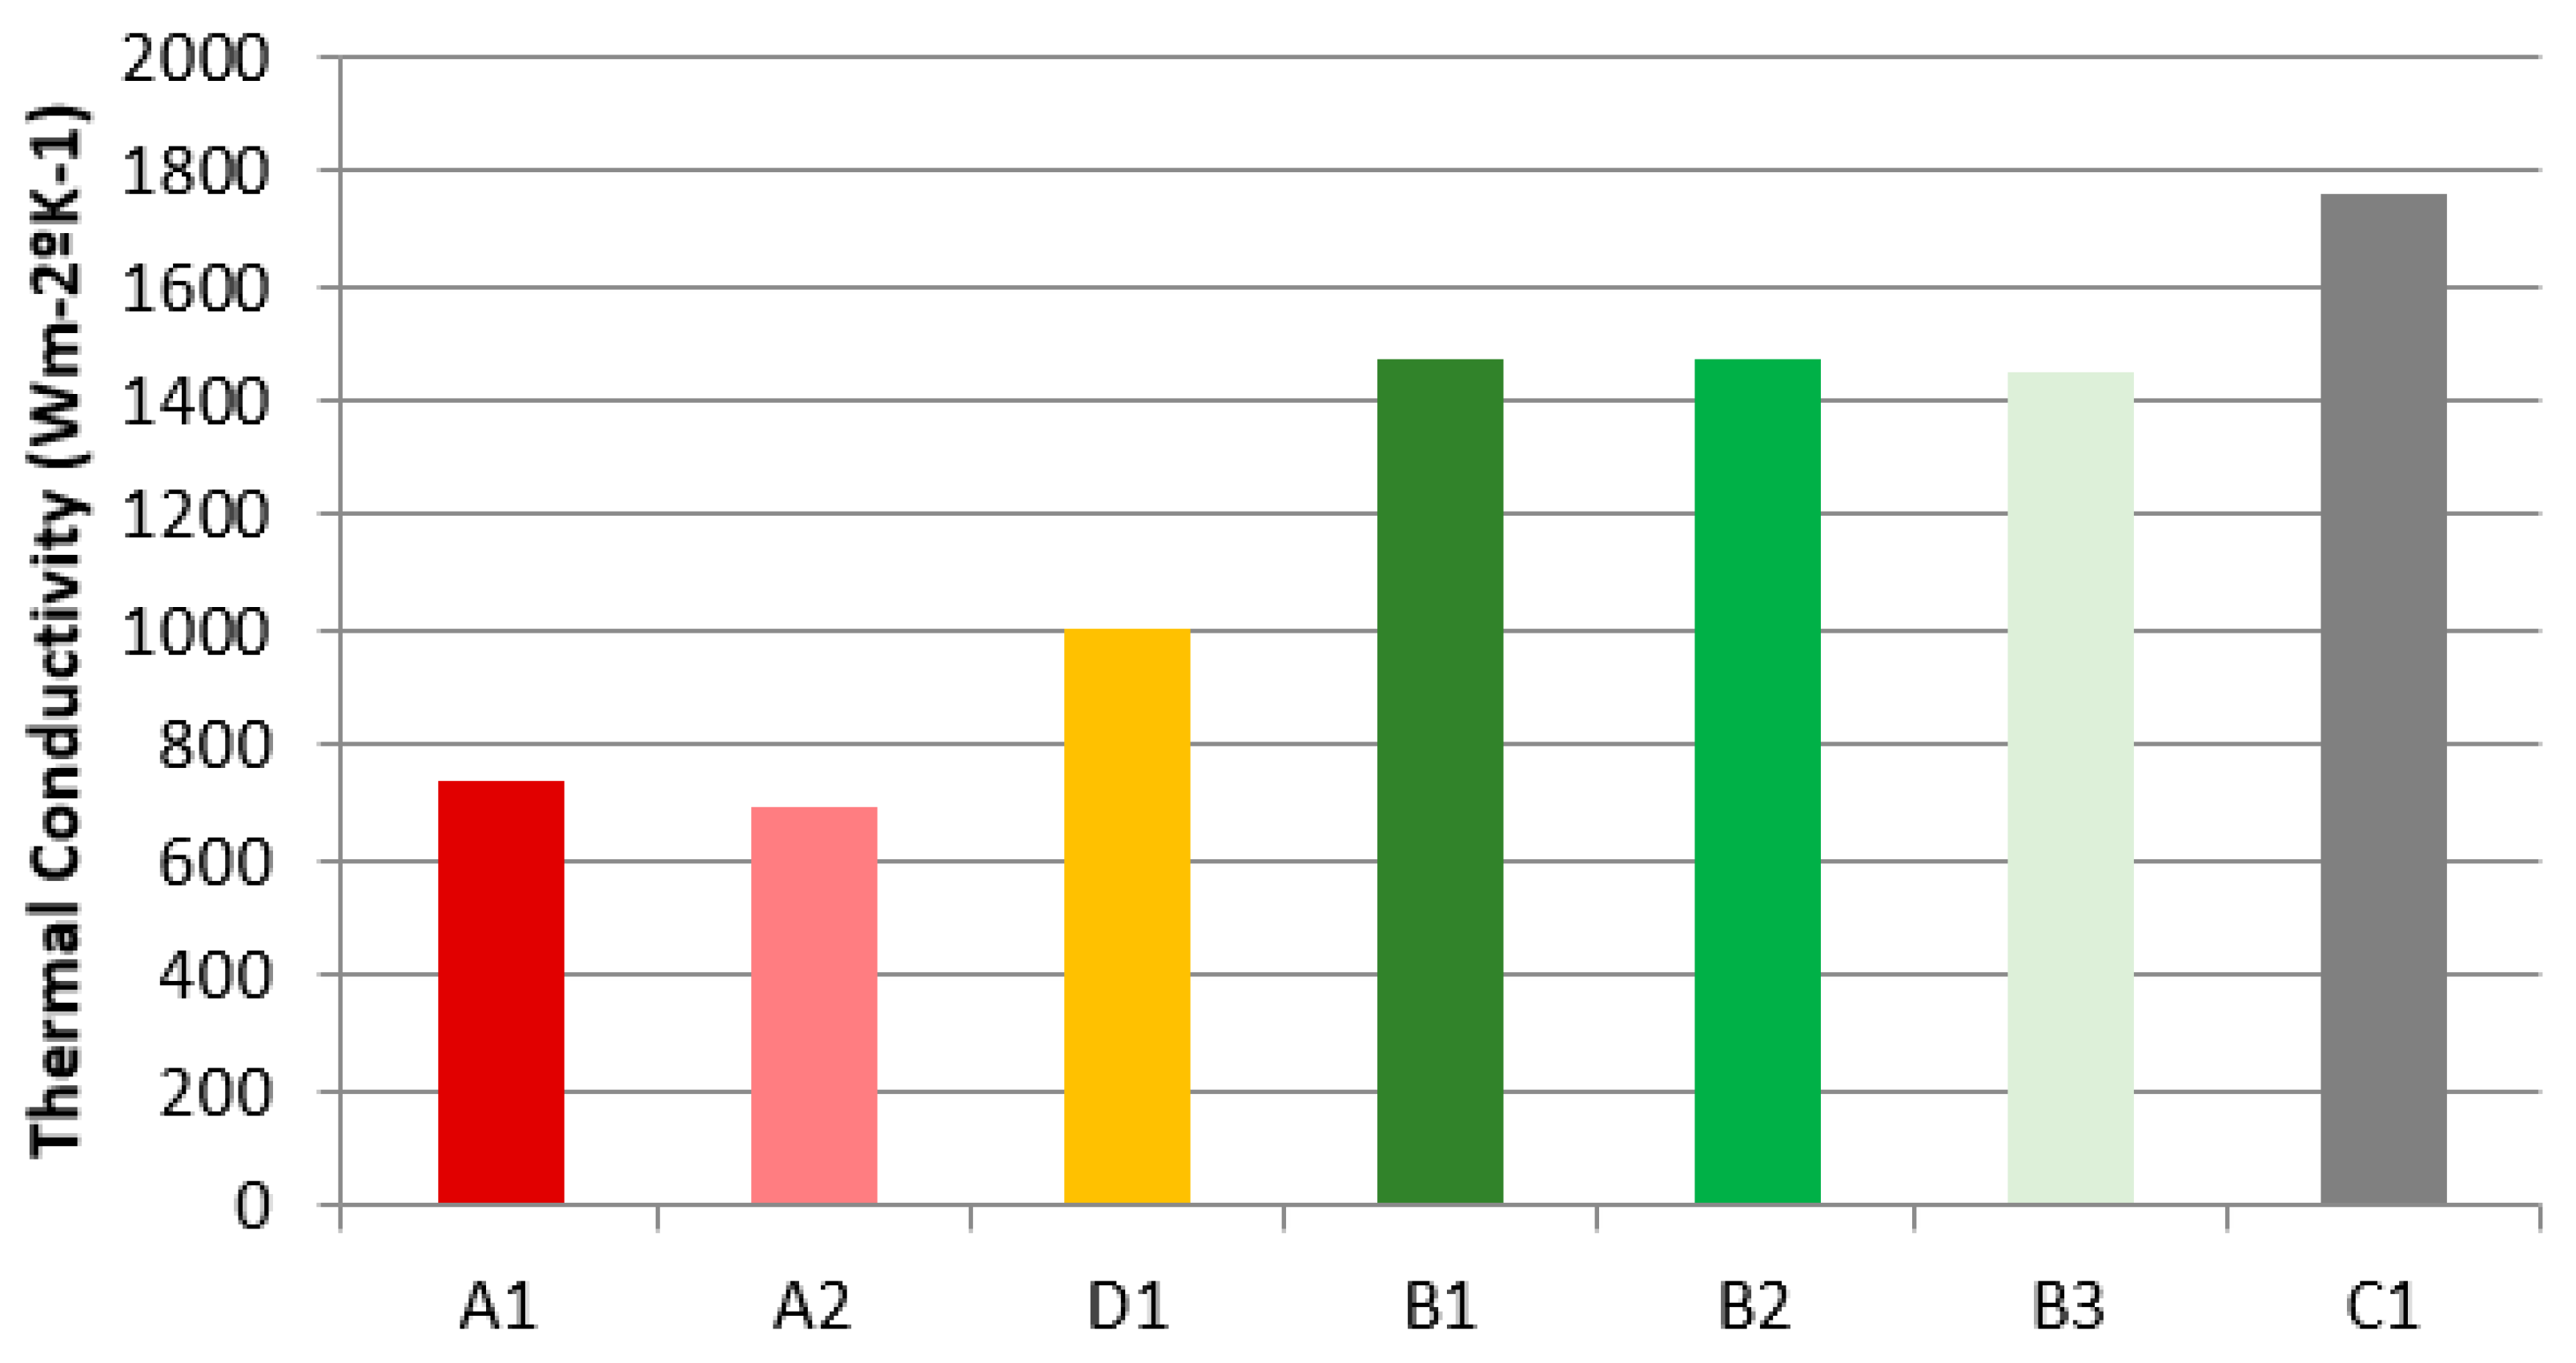
The nominal thermal conductivity of a layer of 200 ± 20 µm provided by the coatings manufacturer is depicted in Figure 2.

2.2. Preparation of the Coatings and Painting Process

The coatings were applied on the steel samples using the painting method, following the manufacturer’s instructions and the specification of the final client, in order to accurately reproduce the painting process employed in actual LPDC dies, minimizing the variabilities of the process that highly depend on the final user as much as possible. The procedure employed was as follows:
  • Manufacture of the 100 mm × 100 mm × 5 mm steel samples and pre-treatment of the surface by different finishing processes: grinding, polishing, or shot blating.
  • Cleaning of the surface of the samples with ether and acetone in an ultrasonic bath for 5 min, respectively. After the ultrasonic bath, the surface of the samples was rubbed with a paper wetted in acetone to remove any remaining dust, dirt, lubricant, etc., and air-dried at room temperature.
  • Preparation of the water–paint mixture in a 1:4 ratio, which was in the middle of the recommended mixing ratio range of the manufacturer (1:3–1:5). The mixture was continuously stirred to avoid deposition of the refractory particles ensuring a homogeneous mix.
  • Application of the coating by spray painting with an SG3041 Optima 601 (Motor Guard Corporation, California, USA) or Perfekt 4 (Krautzberger GmbH, Germany) spray gun:
    • The gun was gravity filled with 0.5 L of the paint mixture. The nozzle of the gun was 1.8 mm, and the air pressure was fixed at 4–4.5 bar, with the flux and spraying angle adequately selected by the user, to have a continuous flux of the painting.
    • Prior to the application of the coatings, the samples were heated above 250 °C to be in the range of 200–220 °C when the coating was applied to ensure a similar evaporation grade of the water in the paint mixture for all the samples. For this, eight samples were put together in a plate that was inserted in a HIGHTEMP 2001406 (JP Selecta, Spain) oven to ensure a higher thermal inertia and a better control of the painting process. The temperature on the samples surface was controlled with a type K thermocouple to ensure they were at the desired temperature range during the painting process.
  • Once the samples were heated, they were extracted from the oven and painted over the plate, with an application distance of 200–300 mm making successive passes of the gun under continuous and relatively fast movements applying several thin paint layers.
  • Curing of the coatings in the oven at 400 °C for 60 min.
  • Determination of the thickness of the coatings for every sample and characterization of the coatings by the tests described in the following sections.

2.3. Coating Characterization

The thickness of the coatings was determined with a Positector FXS1 standard device (DeFelsko, Ogdensburg, New York, NY, USA), in accordance with the standard ASTM D 1186 [38]. The device allows for the determination of coating thickness in the range of 0–1990 µm on ferric material substrates, and the measurement of hot and rough surfaces up to 250 °C. The thickness was measured during the painting process of the samples to ensure the target thickness of 150 µm. The thickness was again measured after curing the coating.
The 3D surface topography measurement and reconstruction were carried out in a Nikon Eclipse ME600 Confocal Microscope (Nikon Corporation, Tokyo, Japan) equipped with an EPI 20× lens, with a >40 nm resolution in height (Z) and 1 µm resolution in the area (XY). A minimum area of 700 × 525 µm2 was analysed, and the roughness (Ra) was measured. The roughness (Ra) of the samples was also acquired with a Perthometer M2 (Mar GmBH, Göttingen, Germany) profilometer (ISO 21920-3 [39]) for comparison.
The adhesion of the coatings was determined by a pull-off adhesion test, with aluminium dollies of 20 mm in diameter at a tensile rate of 0.7 MPa/s, according to the ISO 4624 standard [36]. The tests were performed with the automatic PosiTest AT-A device from DeFelsko. The adhesive used in the tests was an epoxy-based material (bicomponent Araldite 2015). This adhesive was selected from previous tests in which 12 different adhesives were tested, and Araldite 2015 showed the best bonding adhesion to this kind of coatings. Prior to the tests, and after the curing time of the adhesive, the coatings were cut to the substrate around the dollies’ circumference. Six repetitions were performed for each coating, and the main value was obtained. From the tests, the tensile stress necessary to break the weakest interface (adhesive failure) or the weakest coating layer (cohesive failure) is obtained. At the end of the tests, the fracture type, i.e., adhesive or cohesive, was visually estimated according to the ISO 4624 standard. The schematic illustration of the pull-off adhesion test configuration with different coating failures is presented in Figure 3.

2.4. Wear Resistance Evaluation in Falling Abrasive Test

The evaluation of the wear resistance of the coatings was assessed by Falling abrasive tests according to ASTM D968 standard [40]. The standard covers the determination of the resistance of organic coatings to abrasion produced by abrasive particles falling onto coatings applied into plane rigid surfaces. The resistance is considered as the amount of abrasive required to wear through a unit film thickness of the coating. The tests were carried out in a Taber falling sand tester 820 device (Taber Industries, New York, NY, USA), equipped with a support for holding the coated panels at an angle of 45° to the vertical line of the falling abrasive particles. The vertical distance from the exhaust tube of the abrasive to the coated surface at the nearest point was set on 25 mm. The abraded employed in the test was silica sand (method A), discharged in the following order:
  • From 0 to 1000 g in 100 g steps;
  • From 1000 to 3000 g in 200 g steps;
  • From 3000 to 7000 g in 200 g steps;
  • From 7000 g until the end of the test in 1000 g steps.
The coating surface was visually evaluated after every step, and the test was considered finished once the coating was totally abraded and the substrate surface appeared visible in an area of 4 mm × 4 mm. The sand was replaced with a new one after the end of each test. Test panels of 100 mm × 100 mm × 5 mm were used, and a minimum of 3 valid repetitions were performed in each test panel to ensure the repeatability of the results.

2.5. Wear Resistance Evaluation by Taber Abrasion Test

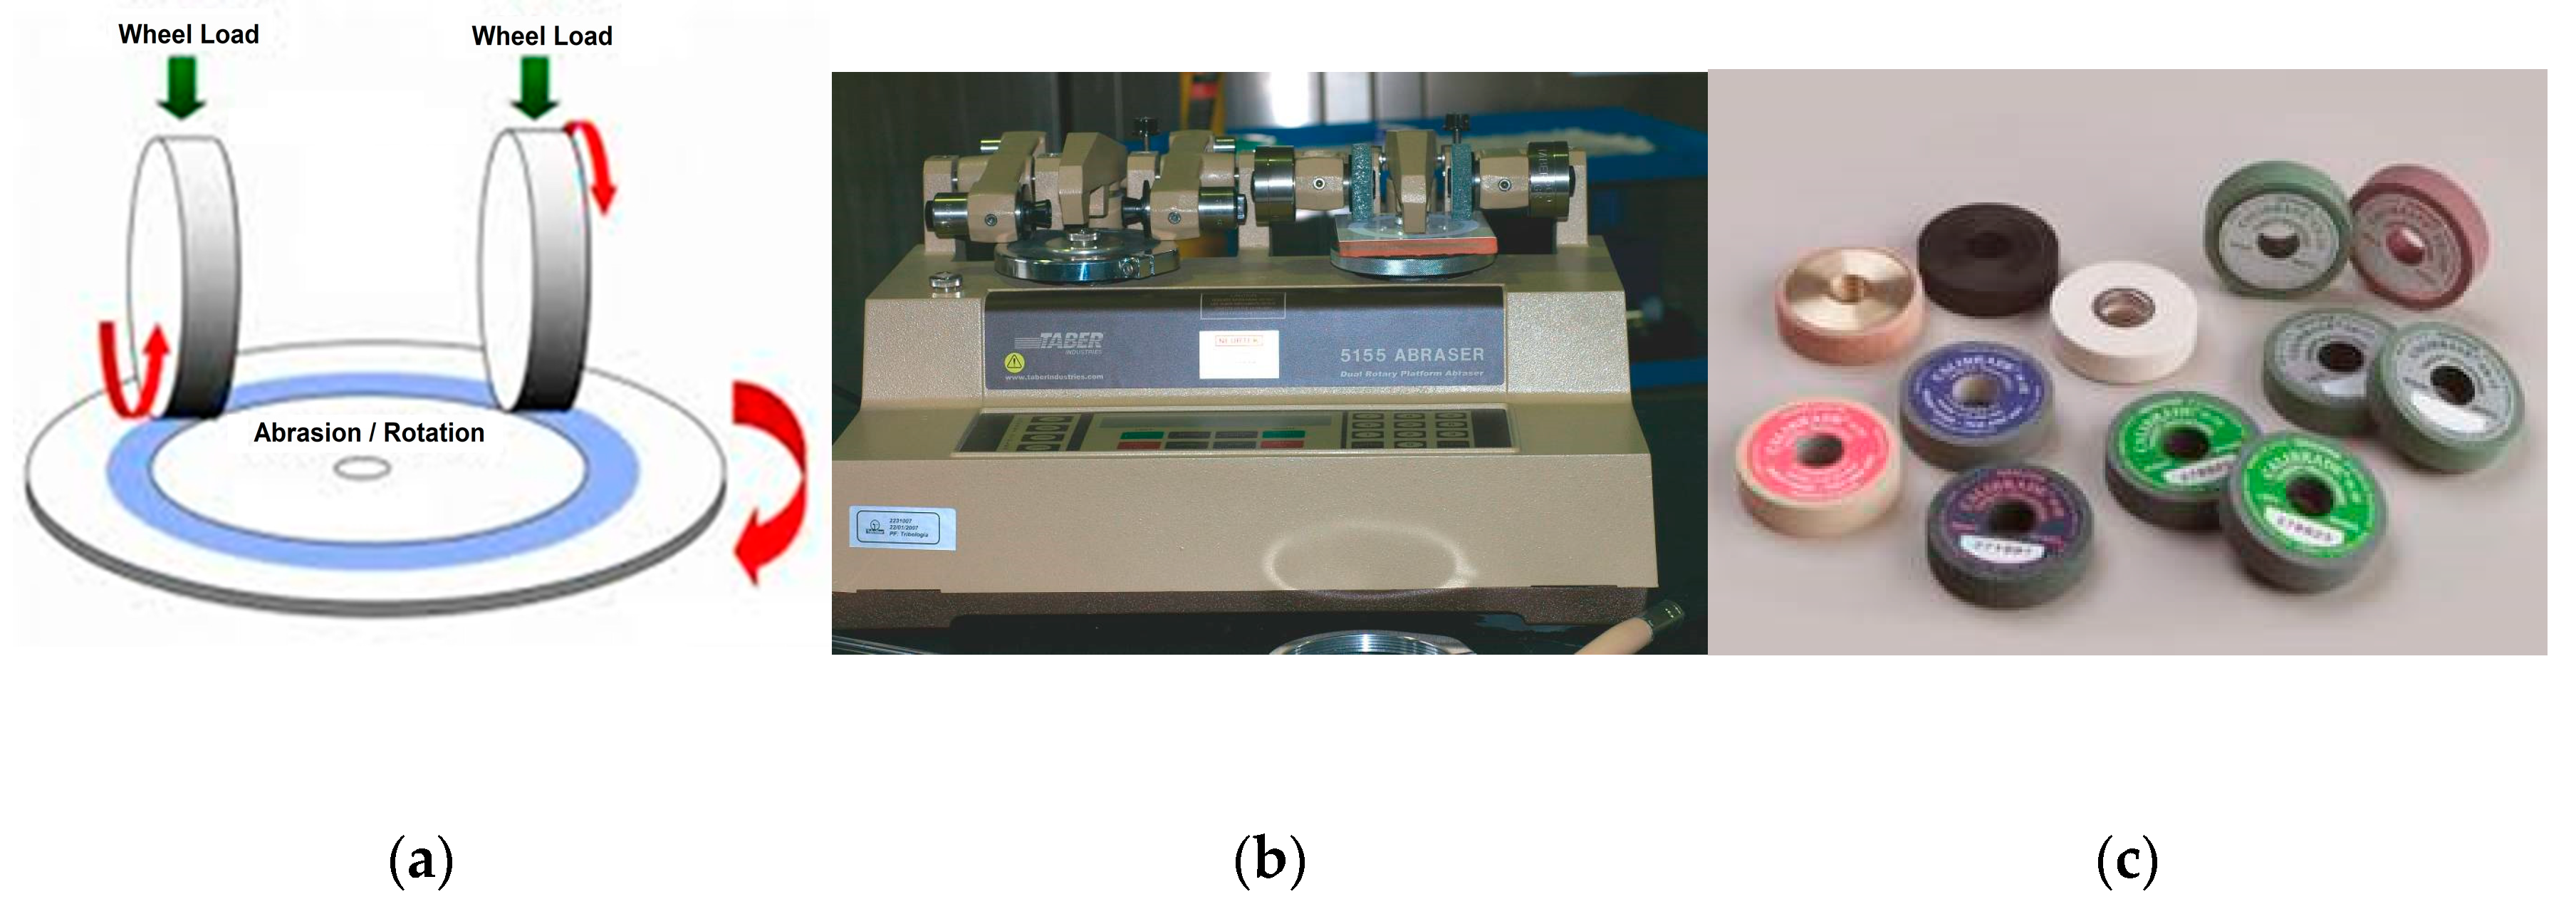
Another complementary abrasion test, i.e., the Taber abrasion test, was performed in accordance with the standard ASTM D4060 [41]. The samples were placed in the rotatory table and rotated at a fixed speed of 60 rpm against two CS-17 abrasive wheels and under a load of 0.5 kg on each wheel (Figure 4). The test was finished once the coating was fully worn, and the steel substrate was clearly visible. The wear of the coatings was quantified through thickness measurements with the Positector FXS1 device after the following test cycle checkpoints: 0, 2, 5, 10, 20, 35, 50, 75, 100, 150, 200, 300, 400, 500, 750, 1000, 1250, 1500, 2000, 2500, and 3000 cycles. Test panels of 100 mm × 100 mm × 5 mm were used, and three replicates of each coating were tested to ensure the repeatability of the results.

3. Results and Discussion

3.1. Application of the Coatings, Problems Solved, and Lessons Learned

During the preparation and application of the coatings on the steel samples, some problems arose during the first trials. As shown in Figure 5, the coatings showed a low adhesion bond to the steel substrates and were easily detached. The sample preparation and painting procedure was revised and repeated until successful coatings with adequate bonding strength were achieved.
The lessons learned from the first trials are listed below:
  • A proper cleaning process of the steel surface prior to coating is critical. Apart from cleaning the sample with ether and acetone in the ultrasonic bath, it was necessary to rub the surface with a paper wet with acetone to remove any remainder of dirt to ensure proper coating bonding. This step was found to be critical for improving the adhesion of the primer to the metal surface, which was confirmed by the results obtained with the pull-off adhesion test above the specification limits.
  • After cleaning and removing the coatings in the ultrasonic bath with water and soap, the samples could be successfully recoated, with good adhesion to the substrate.
  • Even if shot blasting is usually related with improvement in the adhesion of coatings to the metal surface, no big differences were observed in the results obtained in the preliminary trials of this work with respect to the results obtained for the ground and polished samples. In all cases, the results of the pull-off test were above the critical value with no detachment of the coating’s first layer.
  • Bigger refractory particles in size resulted in a more complicated application of the coatings. In order to avoid the particles getting stuck in the gun, an appropriate regulation of air pressure, media flux, and opening angle were optimized for the gun with 1.8 mm orifice diameter, always ensuring a regularly stirred mixture of the paint during the application step.
  • The final coating thickness achieved varied depending on the coating. In some cases, the minimum thicknesses of 150 µm was easily achieved. In the case where the final thickness was below this value, more paint layers were applied to reach the minimum target thickness. The final mean thickness of the coatings ranged from 150 up to 210 µm. Furthermore, the thickness of a coating in the same sample was found to have a significant variation, around ±15%.
  • The temperature of the sample was found to be critical for an adequate application of the coatings and should be within 180–220 °C. Temperatures above 220 °C resulted in an increase in the porosity degree of the coatings, which is not desirable in terms of consistency and wear resistance.
  • The total thickness of the primer was determined from the wear tests, with the Positector device once the coating (white, yellow, etc.) was worn out and the primer (red) was exposed and easily identified. In all cases, the primer applied was around the target 50 µm.

3.2. Coating Characterization

The mean thickness value obtained for each of the coatings selected for this work is depicted in Figure 6. Ten measurements were made in different positions above the coating surface, and the mean values were obtained for each sample.
The roughness of the coatings can be a critical factor for the LPDC process and is usually a compromise between insulation requirements for an adequate filling process for and the surface finishing requirements of the cast parts [20,32,33]. The mean roughness values of the different coatings obtained by confocal microscopy is presented in Figure 6. As it can be observed from the image, the roughness of the coatings was dependent on the formulation used, increasing with the refractory particles grain size. This is in coherence with previous observations in the literature [27,28,29].
The correlation between the refractory particles grain size used on the different formulations and the resulting roughness can be seen in Figure 7. As can be seen in the figure, the roughness increases with the particle size employed. However, there is no linear correlation for this trend since the binder used to stick together the particles also had an influence on the surface topography obtained. The nature and amount of binder employed in paints have already been found to have a direct influence on the coating characteristics, such as reflectance or roughness [42,43]. In this case, the higher roughness was obtained for the high isolation coatings A1 and A2, and the medium isolation coating D1, as a consequence of the bigger size of the refractory particles (80, 50, and 30 µm, respectively). B1, B2, and B3 presented lower roughness due to the smaller particle sizes used in their formulation (15, 15, and 10 µm, respectively). Finally, the roughness of C1 was close to that of B2, even if the particle size in this case were considerably higher (35 µm).
The topography of the coatings was analysed through confocal 3D images (Figure 8). The topographic aspect of all the coatings was different, even for samples with similar Ra values. This could be ascribed to the different type and quantity of binder used, as well as differences in refractory particle sizes [43].
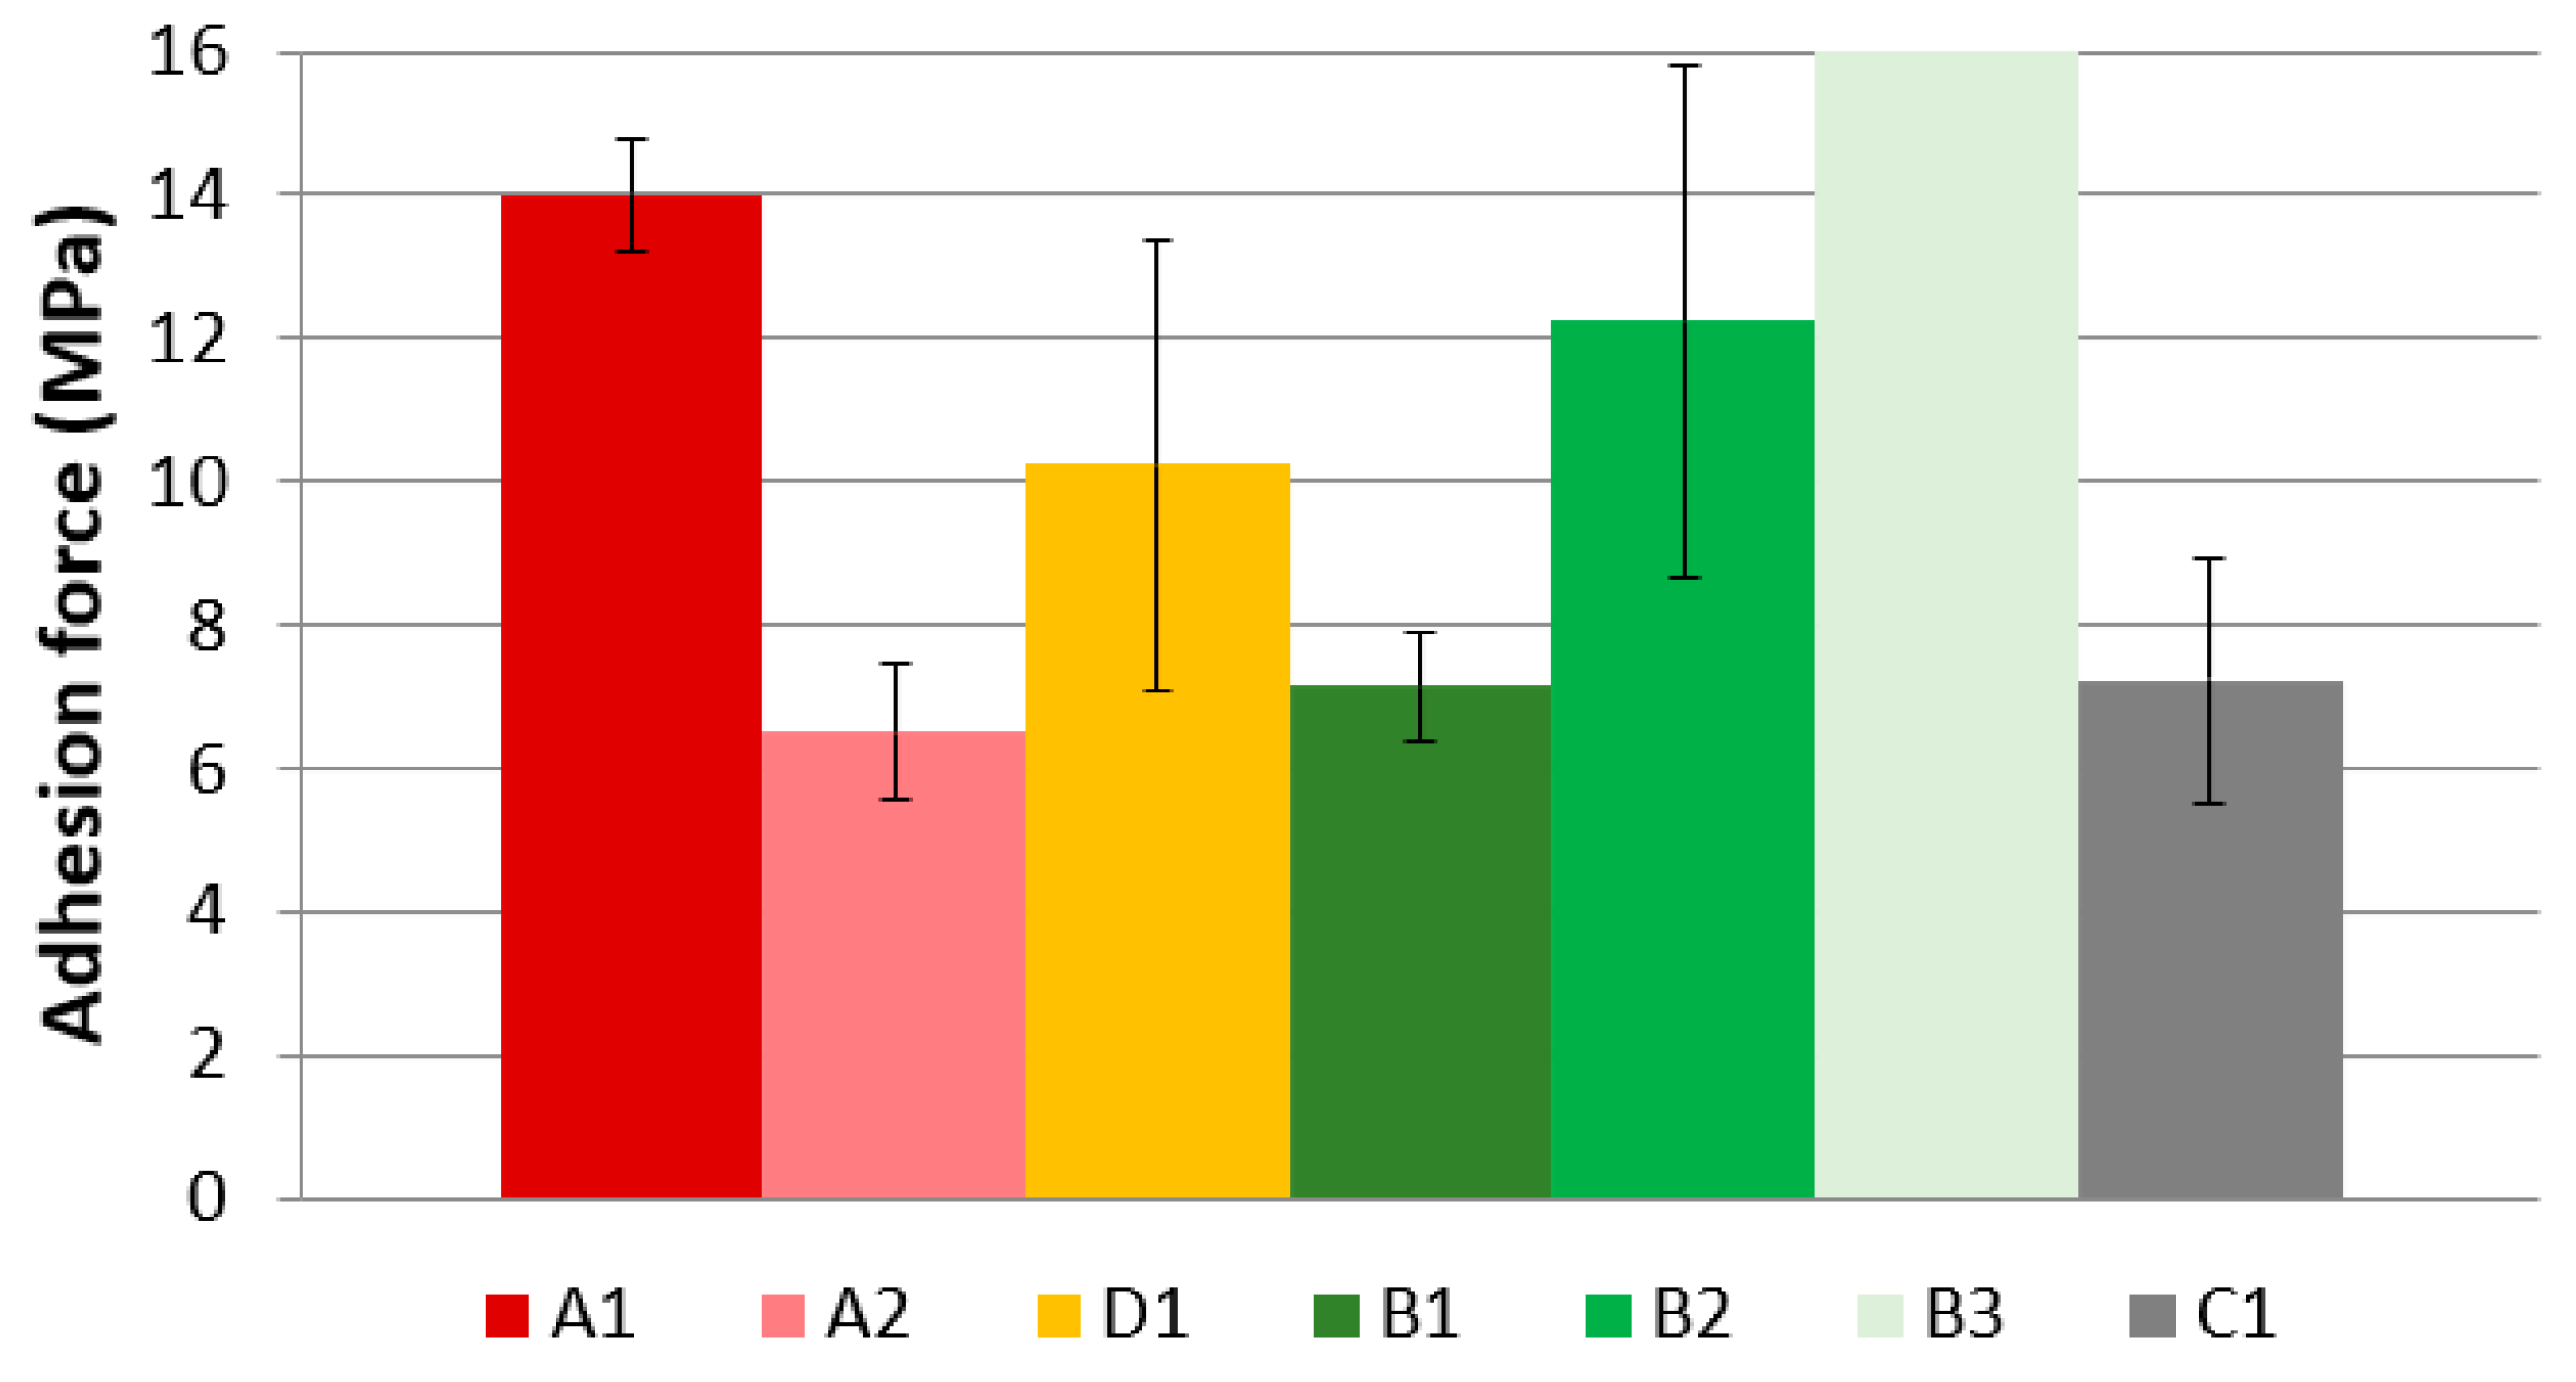
The results obtained for the adhesion of the coatings determined through the pull-off test is presented in Figure 9. As can be noticed from the figure, the results obtained showed significant differences in the adhesion of the different coatings. The higher adhesion was obtained for coating B3 (16 MPa), followed by A1 (14 MPa), B2 (12 MPa), and D1 (10 MPa). The adhesion of coatings A2, B1, and C1 were similar and close to 7 MPa.
Furthermore, the fracture mode of the coatings was also different (Figure 10). The coating with higher adhesion, B3, showed an adhesive failure between the adhesive and the paint; therefore, the real adherence value could not be determined, though it was above the 16 MPa obtained for the weakest interface, in this case, the one between the adhesive and the coating. Coatings A1, D1, and B2, which also presented high adherence results, were formulated with extra binder quantity and presented an adhesive failure between the coating and the primer layer. The rest of the coatings (A2, B1, and C1) presented a cohesive failure within the coating layer. The higher adhesion obtained for the formulations with an extra binder evinced the positive influence of the binder on the adherence of the coatings.

3.3. Influence of the Surface Pre-Treatment and Primer Layer on the Adhesion and Wear Behaviour of the Coatings

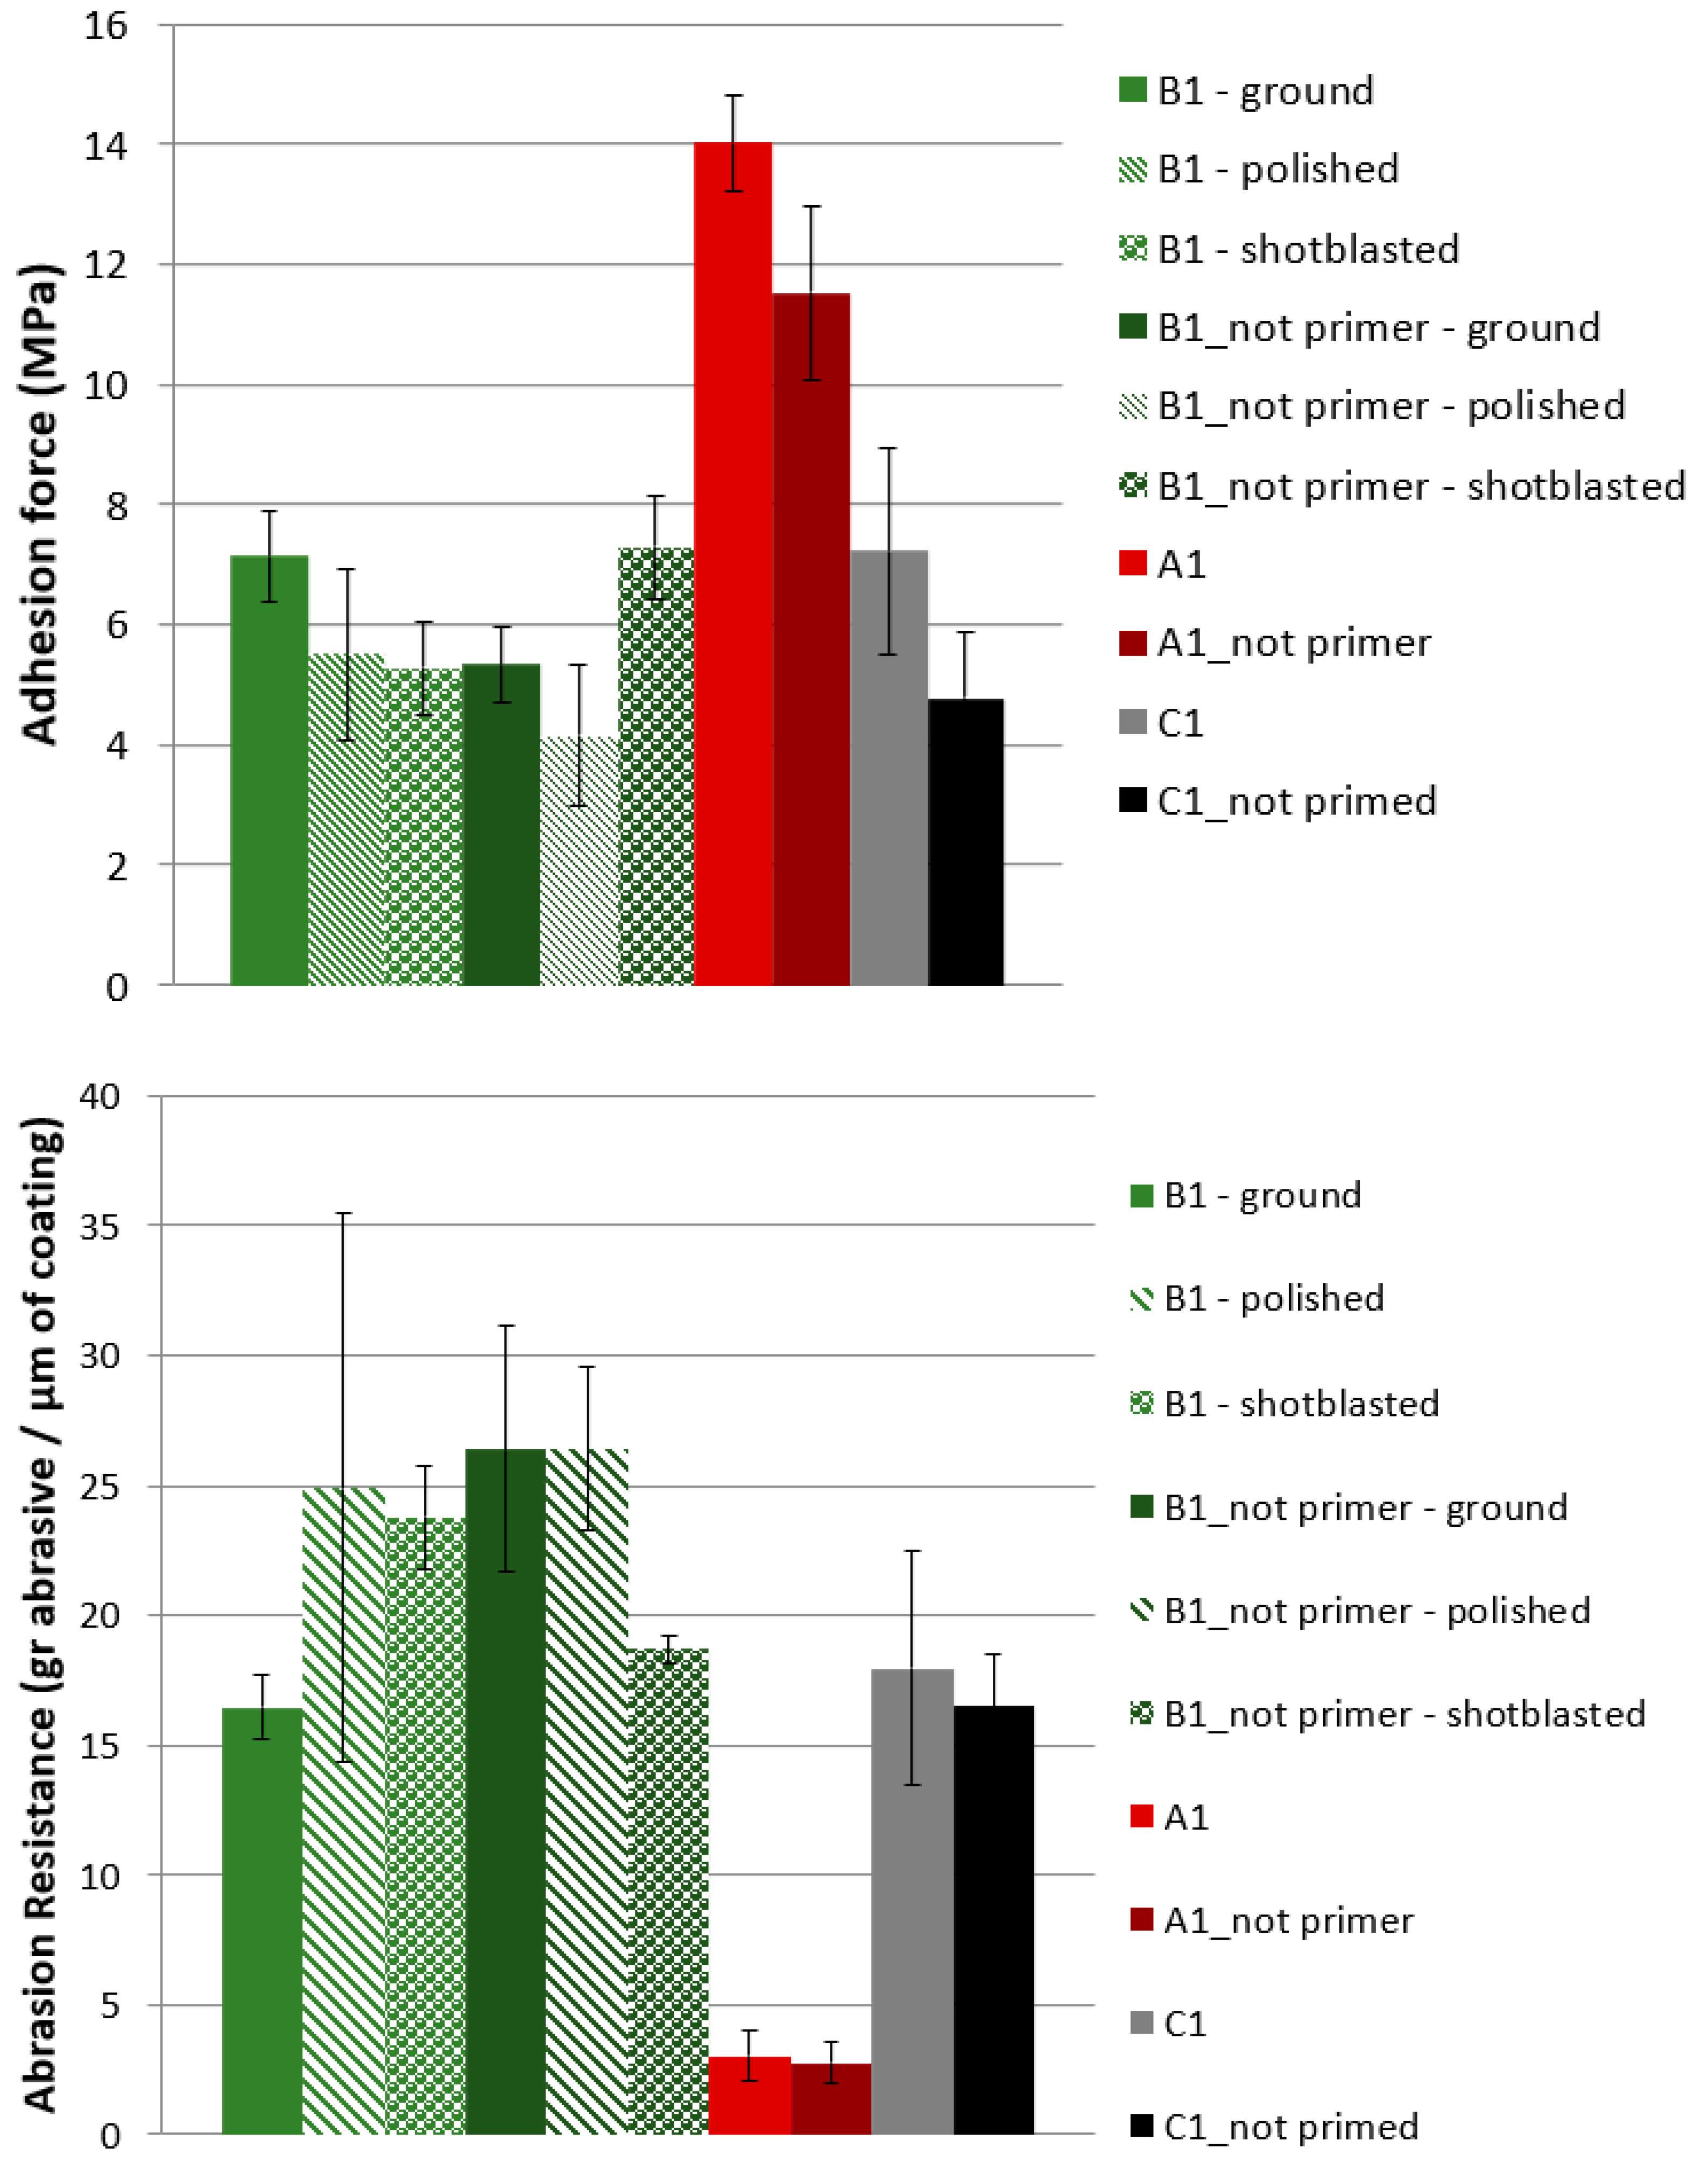
Coatings A1, B1, and C1 have been tested with and without the primer layer. Furthermore, the influence of the substrate surface pre-treatment was evaluated on B1 coating, which was applied on ground, polished, and shot-blasted samples with and without the primer layer. The influence of both the surface pre-treatment and the presence of the primer layer was assessed through roughness, adhesion pull-off tests, and falling abrasive tests. The results are summarized in Figure 11.
The addition of the primer layer was found to improve the adhesion results of the three coatings in about 2 MPa for each coating. The fracture mode of the three coatings without the primer layer was a cohesive fracture of the paint layer, whereas the failure mode on the coatings with the primer was an adhesive fracture between the coating and the primer layer for A1 coating and a cohesive fracture of the coating layer for B1 and C1 coatings. Regarding abrasion resistance, no significant differences were obtained between coatings with and without the primer layer.
In the case of the surface pre-treatment employed with B1 coating, the use of the primer also resulted in an improvement in the adhesion for the ground and polished samples. In the case of the shot-blasted samples, however, the adhesion was 2 MPa higher in the coating without the primer layer. All the mean adhesion values comprised between 4 and 7 MPa. The higher adhesion was obtained for the ground sample with the primer layer and the shot-blasted sample without the primer. On the other hand, no significant differences were observed in the wear resistance of the coatings between the ground, polished, or shot-blasted samples, independent of the use of the primer layer. No influence of the substrate pre-treatment was observed either.
Therefore, the use of a primer layer prior to the coating application was confirmed to improve the adhesion of the coating system, whereas no influence on the wear resistance was observed. Consequently, it can be stated that the wear resistance is more dependent on the nature, composition, and thickness of the topmost layer rather than the substrate preparation and/or primer layer, provided that a minimum adhesion is ensured between the substrate and the coating.

3.4. Influence of Steel Temperature on the Painting Process and Coating Thickness on the Adhesion and Wear Behaviour

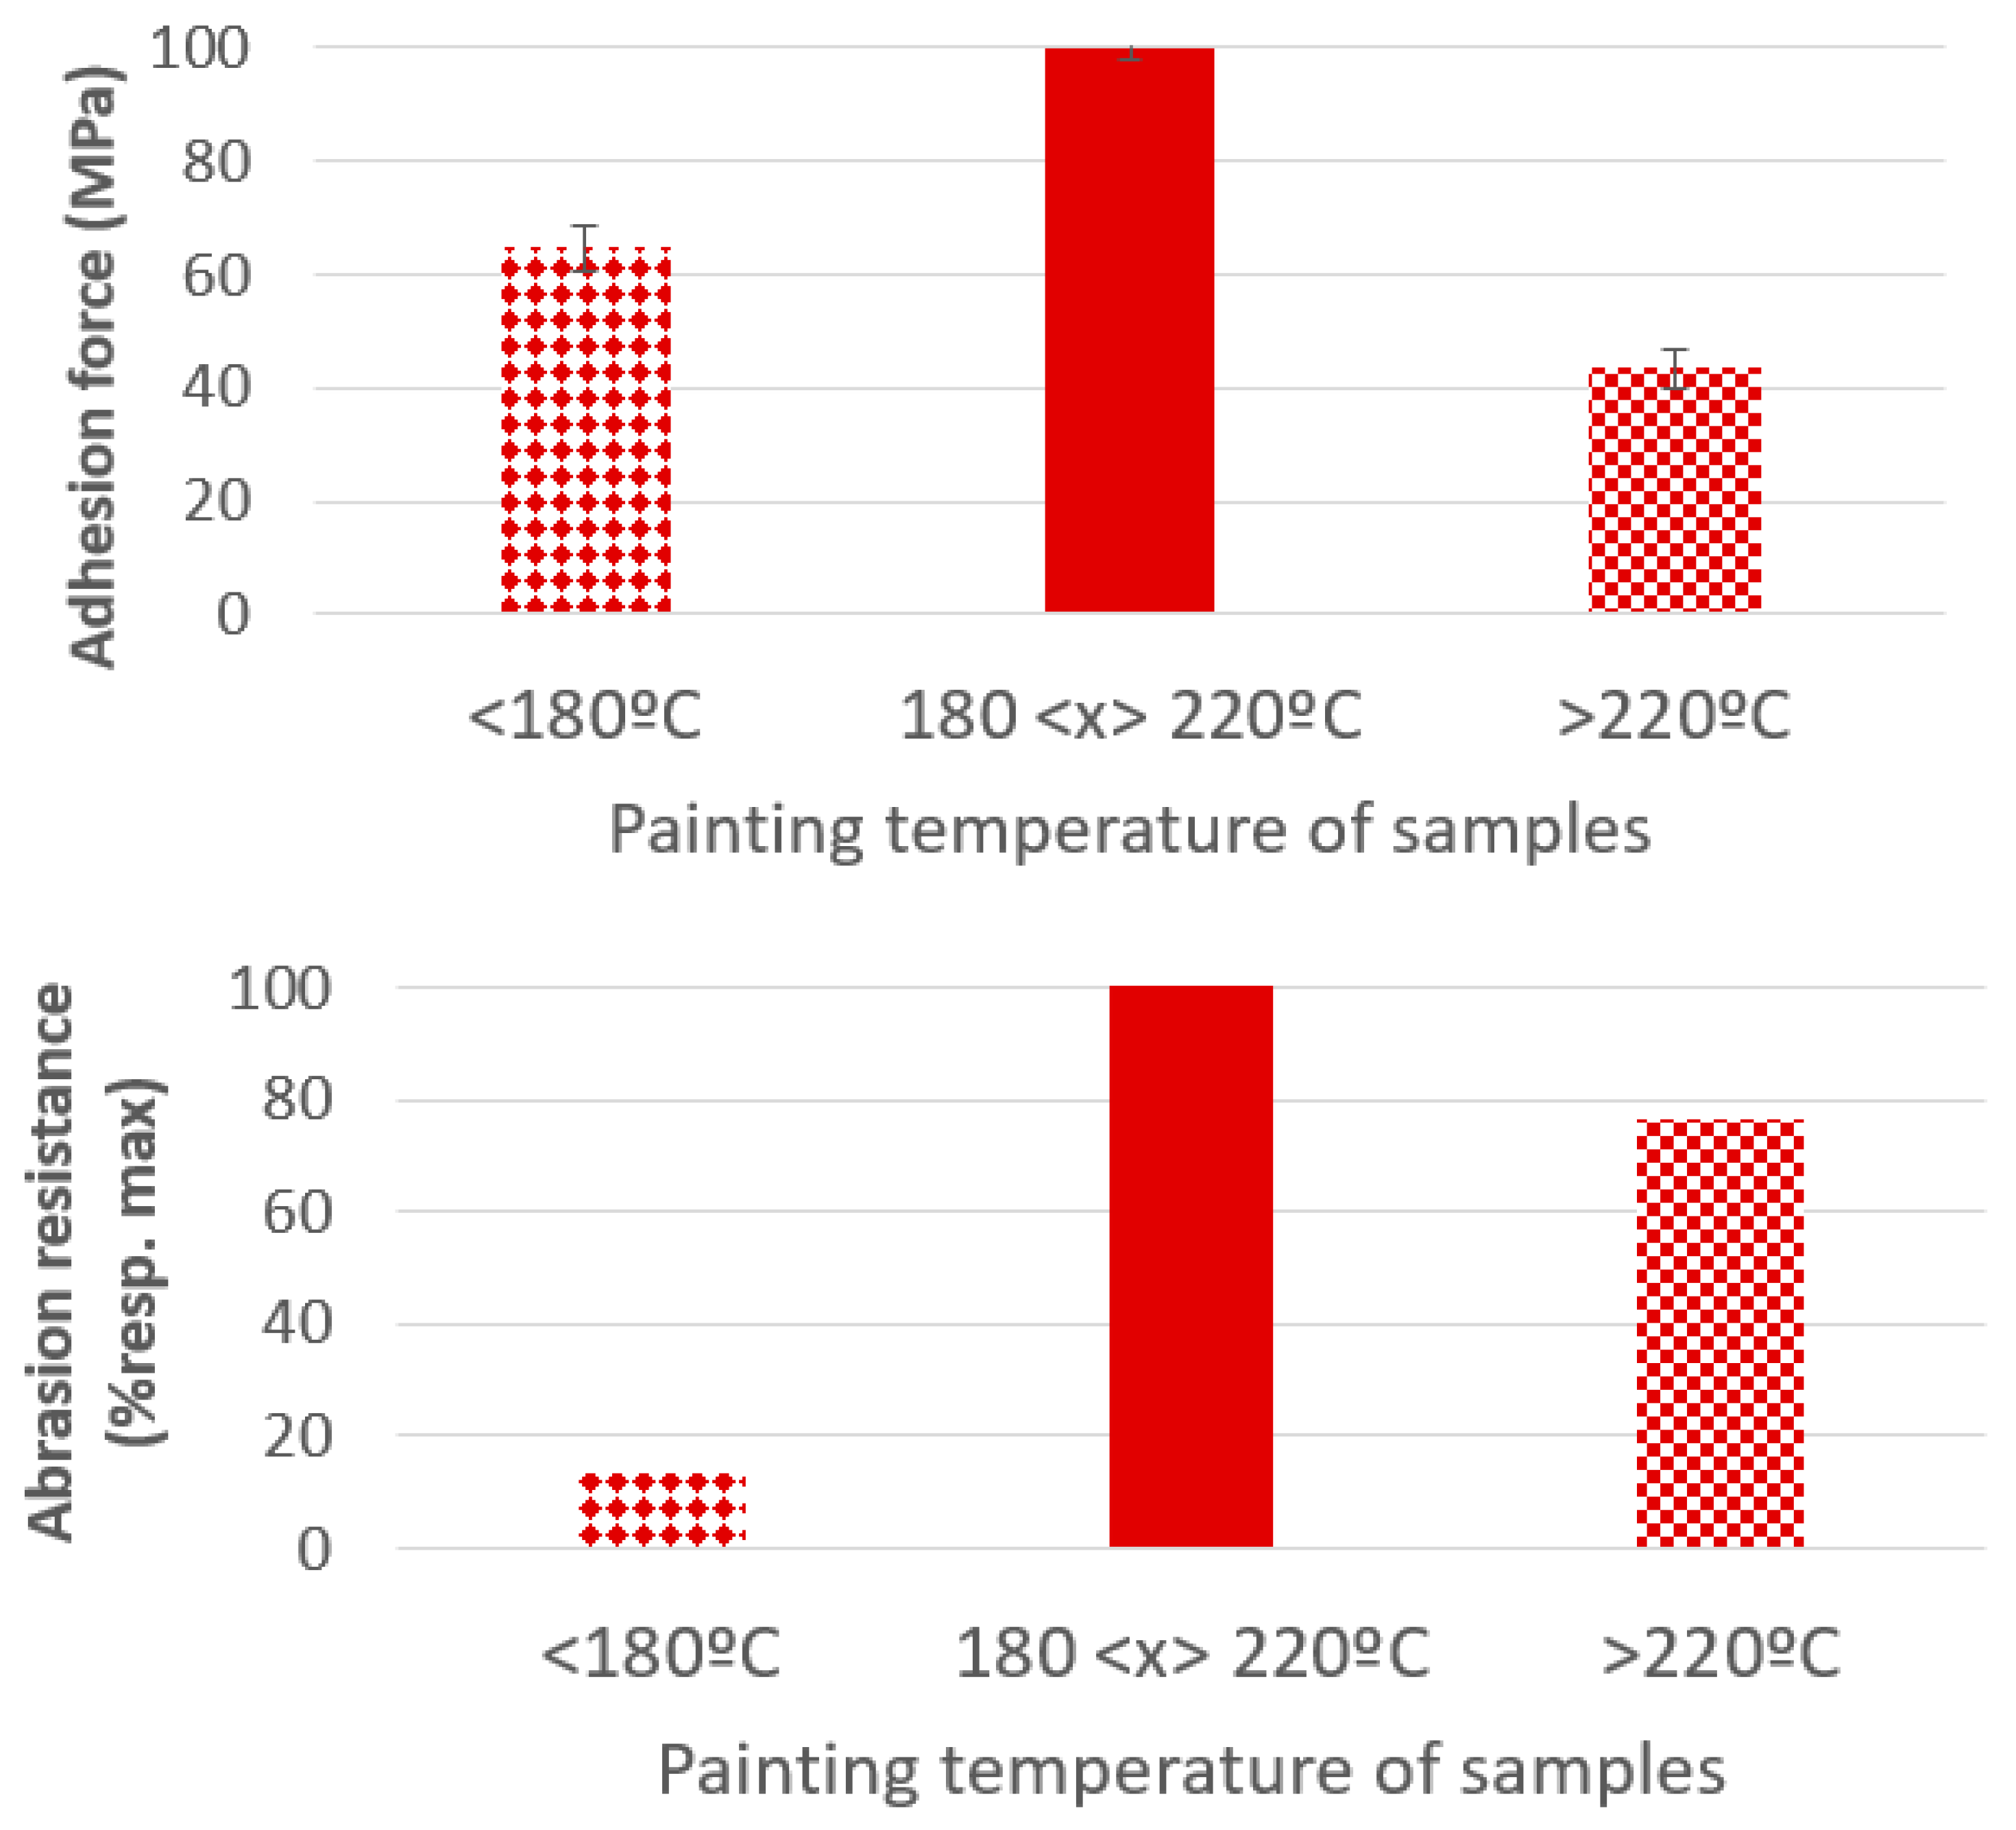
The samples were coated with the primer layer and A1 coating, 20–40 °C below and above the optimum heating temperature of 180–220 °C, to evaluate the effect of temperature on the coating application process, thickness obtained, and adhesion results (Figure 12).
The adhesion of the coating was found to be highly influenced by the sample temperature during the application process. The results obtained for the samples heated in the optimum temperature range were several MPa higher than those heated above or below this temperature range. Similarly, the wear resistance of the coating was reduced considerably for the samples that were painted out of the optimum temperature range. Some investigations have shown that the chemical reactions and interdiffusion of elements between the coating and substrate increase with temperature, which can improve the adhesion strength of the coating [44,45]. However, overheating can cause the opposite effect, reducing the adhesion due to a thermal degradation of the components of the coating [46]. Similarly, an inefficient crosslinking of the coating (lower temperatures) or a thermal degradation (higher temperatures) can lead to lower mechanical resistance of the coating [46,47], which can be more easily worn out.

3.5. Coating Wear Resistance Results on Falling Abrasive Test

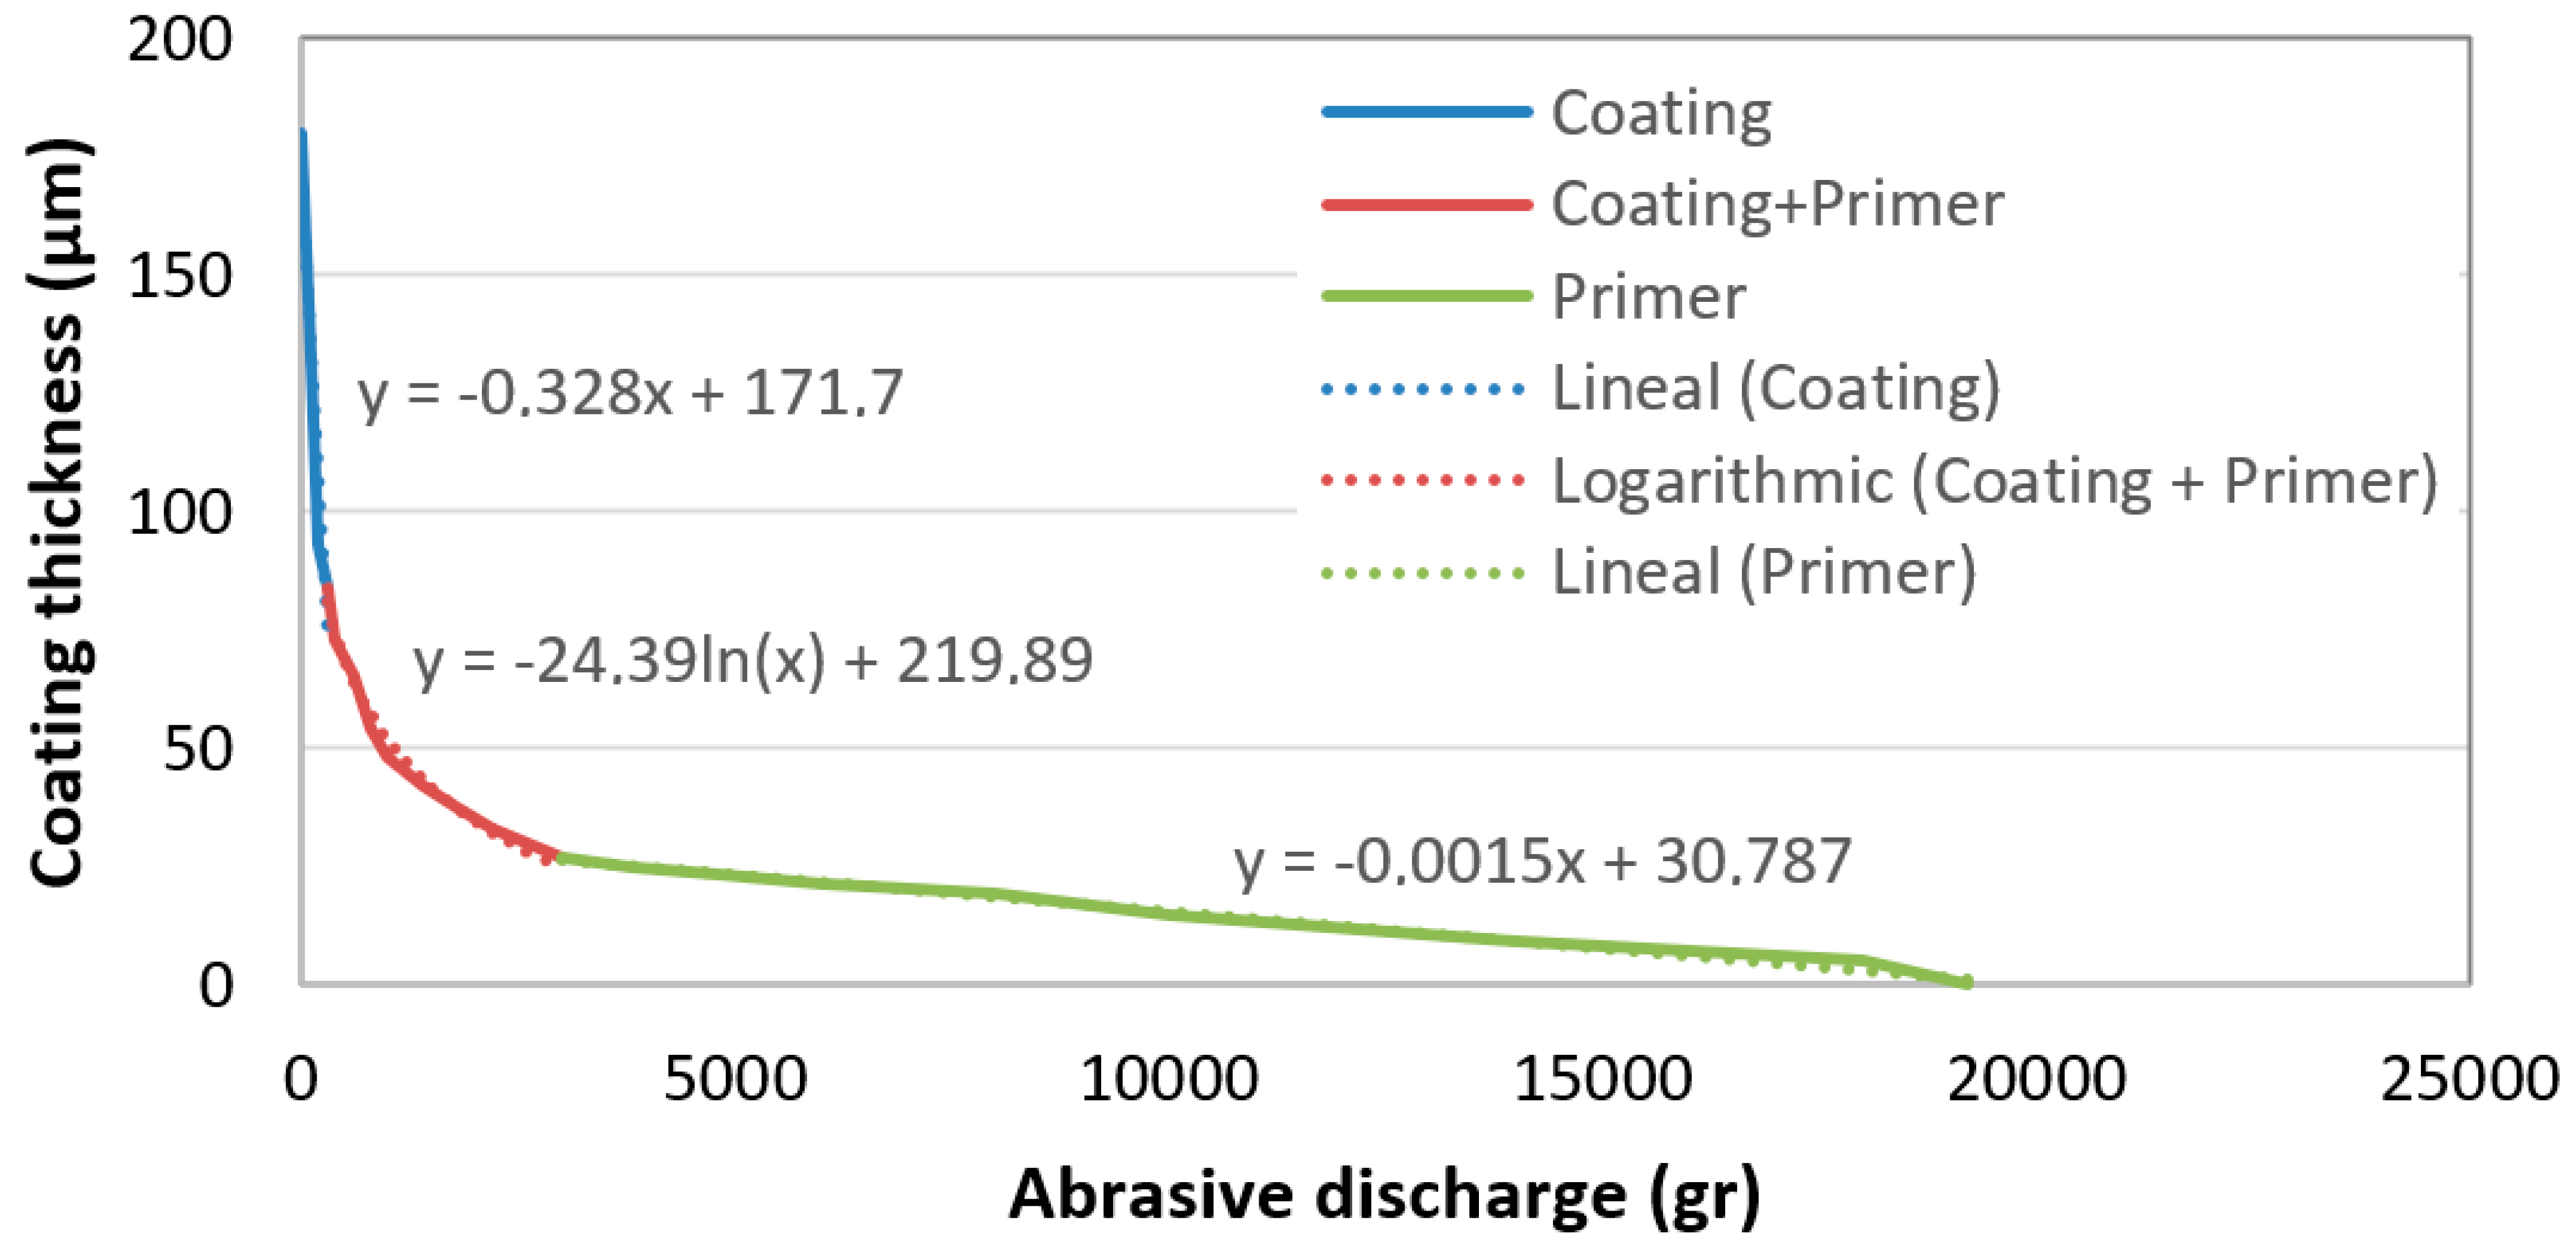
The wearing process of the coatings followed three distinct stages, as shown in Figure 13, with an initial linear wearing stage of the coating, followed by a second logarithmic stage, corresponding to the transition between the coating and the primer layer, and a final linear wearing stage of the primer layer. The wear resistance was calculated for each stage, but the most important for consideration in the final application was the one corresponding to the outermost layer of the coating.
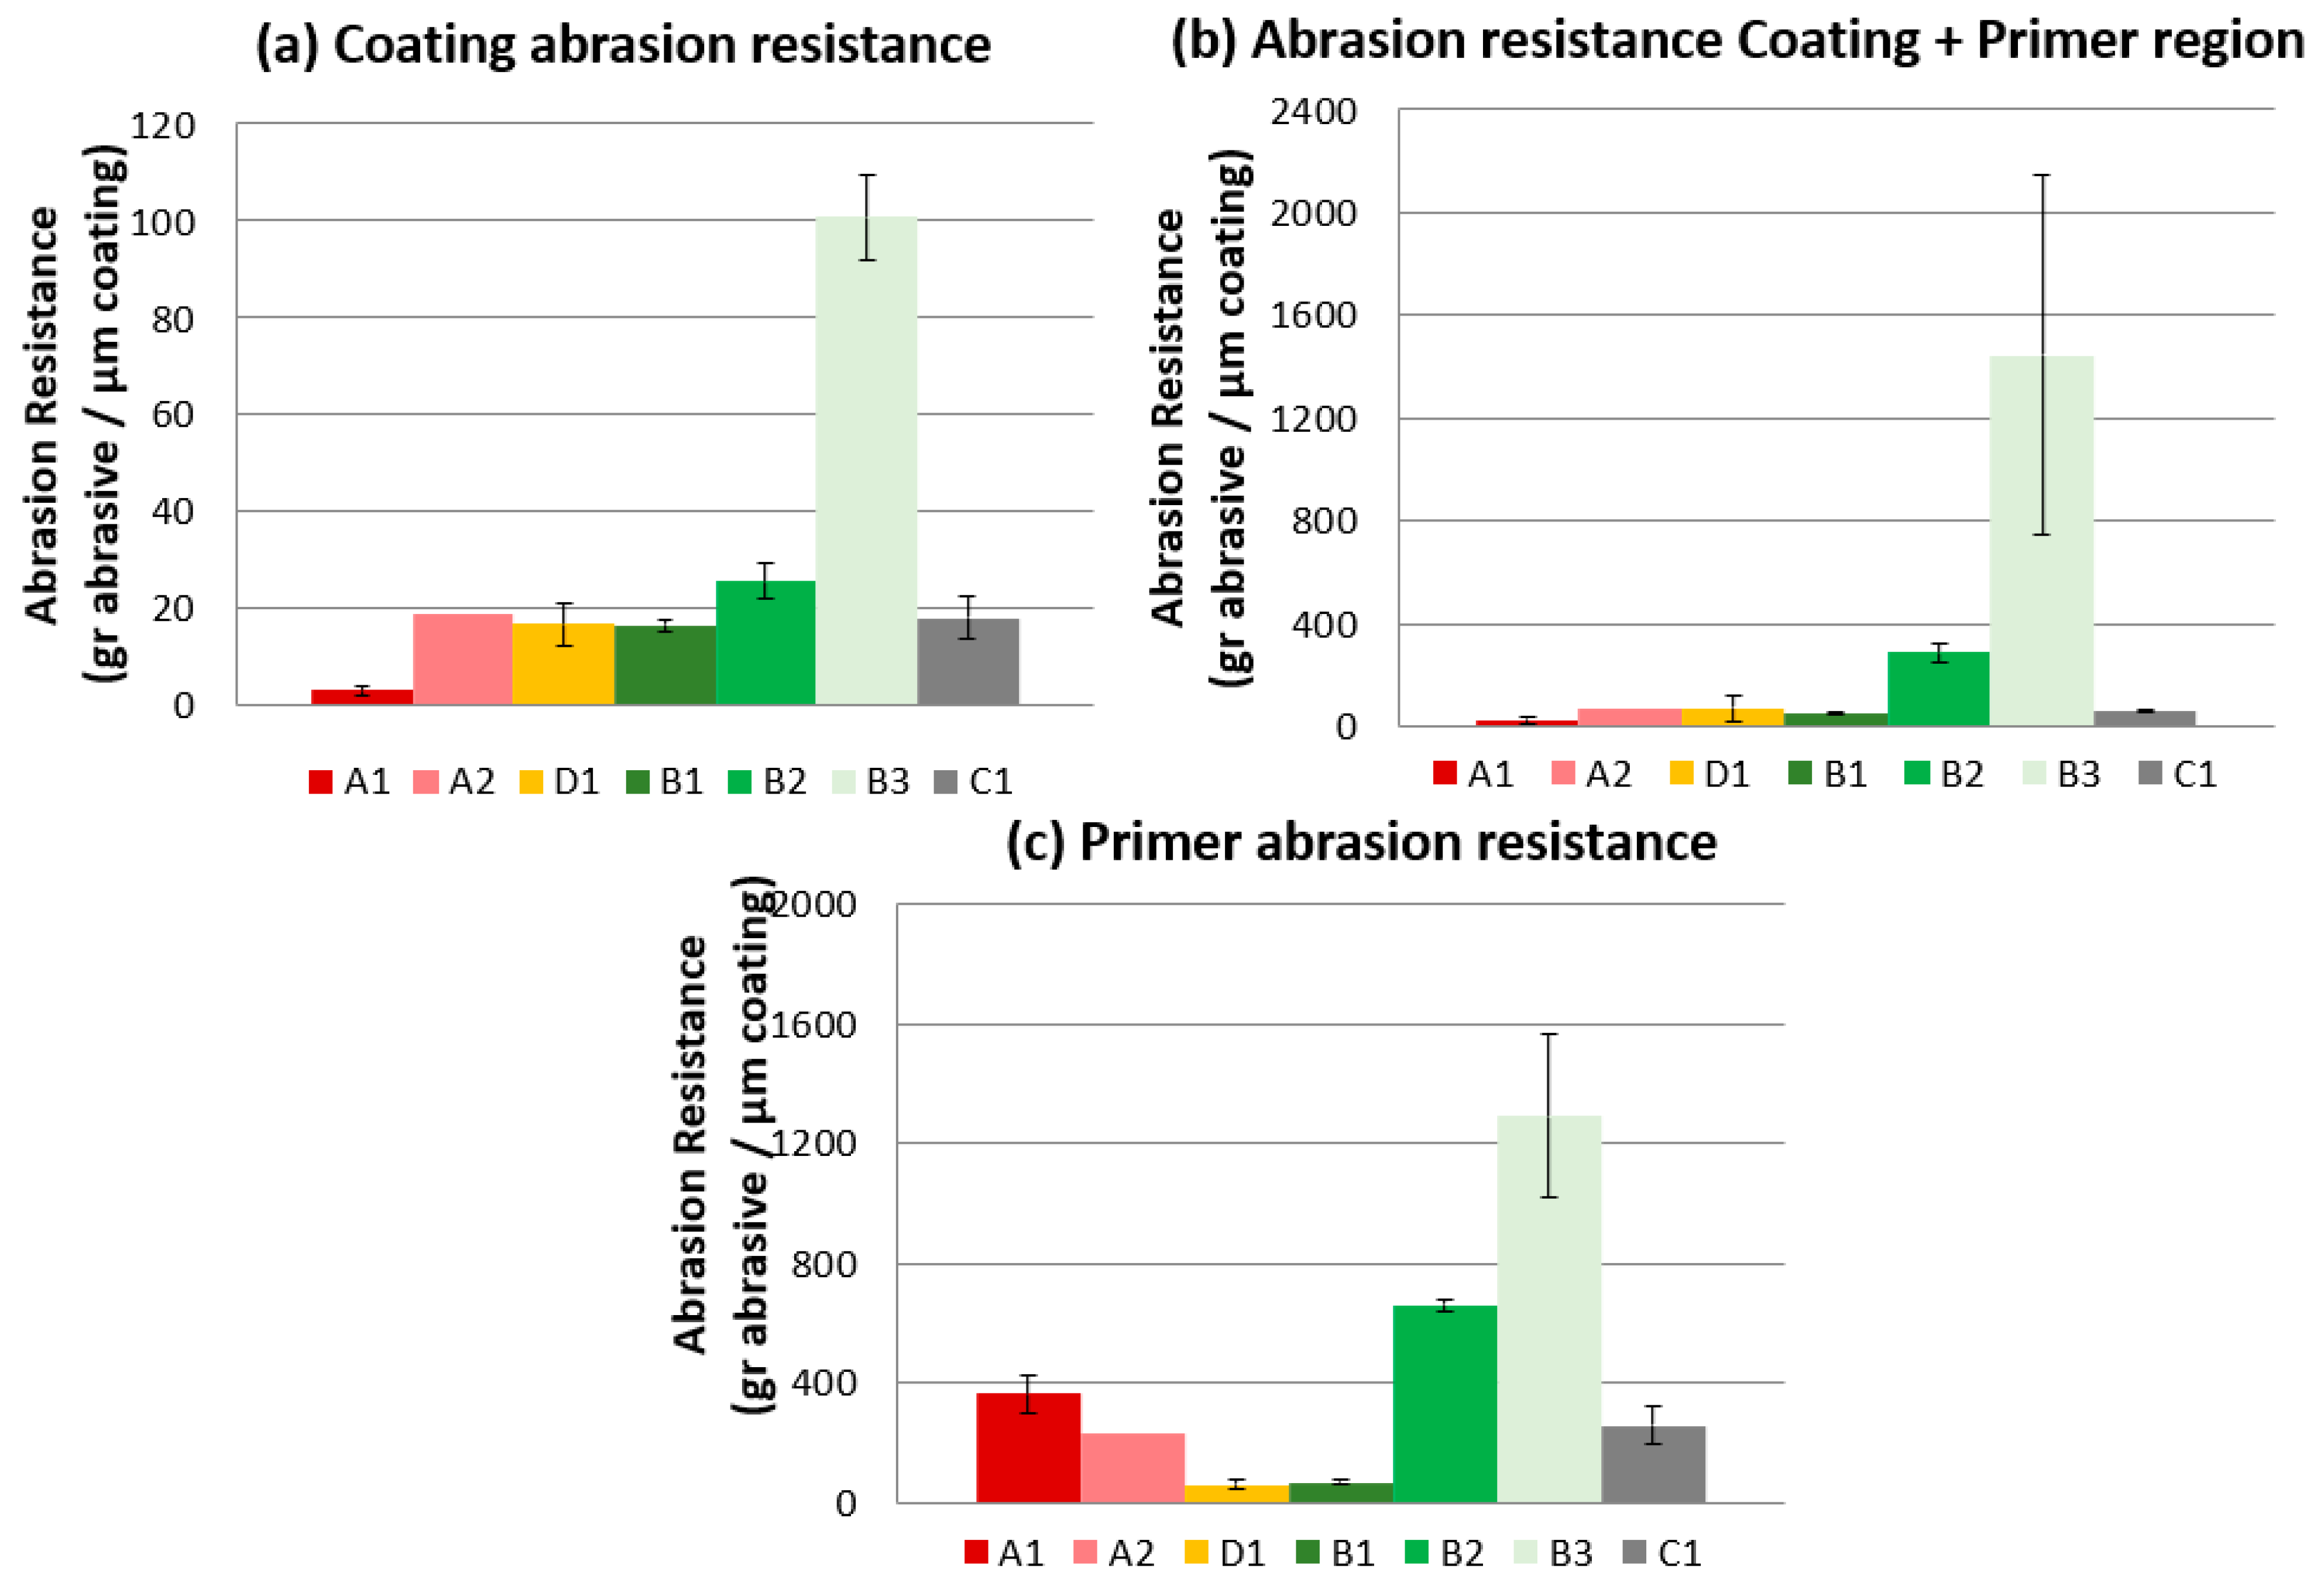
The results obtained for the different coatings are presented in the following figures for the values calculated for the coating linear wear rate, the transition layer logarithmic wear rate, and the primer linear wear rate.
The resistance to abrasive falling obtained in the first linear stage of the coating layers presented in Figure 14a shows that the coating with higher resistance was B3 coating, corresponding to the coating with a smaller particle size (80 µm), with values around 100 gr of abrasive needed to wear out 1 µm of the coating. The rest of the coatings presented similar abrasion resistances around 20 gr per µm, considerably lower than those obtained for B3 coating. Finally, the lowest resistance was obtained for A1 coating, corresponding to the coating with the greater particle size (10 µm), which was close to 5 gr of abrasive per µm. Therefore, the wear extent of the coatings is directly dependent on the particle size. This can be ascribed to a better bonding of lower size particles [48,49]. Furthermore, smaller particles pack more closely, which increases the number of particles in tribological contact, improving the overall wear performance [50]. Finally, for the same number of particles removed, the greater volume of bigger particle sizes leads to a greater material loss.
The wear resistance on the logarithmic region, corresponding to the coating–primer transition, presented in Figure 14b shows the little differences for coatings A1, A2, D1, B1, B2, and C1, but a considerably higher resistance for the B3 coating.
Finally, the wear resistance of the primer layer (Figure 14c) evinces slight differences in the primer layer performance for the different coatings. This could be related to the presence of debris coming from the coating detachment, which could alter the response of the primer layer [51,52,53,54]. The higher resistance once again was shown by B3 coating.

3.6. Coating Wear Resistance Results on Taber Abrasion Test

Similarly to that observed for the falling abrasive tests, the wearing process of the coatings for the Taber abrasion tests followed identical trend, with three differentiated stages: linear wear stage for the coating, a logarithmic stage on the transition layer, and a final linear stage for the primer layer. The different appearances of the sample on the three stages are represented in Figure 15. As can be noticed, the transition layer started after 1000 cycles, and the primer layer was clearly visible after 1500 cycles.
In general, the results obtained in both wear tests, i.e., the falling abrasive and Taber abrasion tests, present a similar ranking of paint resistances. As shown in the results obtained for the paints in Figure 16, the higher resistance corresponded to the B3 coating, considerably higher than the resistance of the remaining coatings, which can be better appreciated in the magnification in the right upper side of the image. No significant differences were observed in the resistance of the rest of the coatings, which was substantially low compared to B3 coating. Again, the higher resistance of B3 coating could be ascribed to its lower particle size, together with the lower third body effect caused during the wearing process [48,49,50,54].

3.7. Selection of the Most Promising Coatings Based on the Adhesion and Wear Tests

The criteria for best coating selection have been built through a comparison table, where a value for each test has been calculated.
The calculation method for these values and the selection criteria are as follows:
  • Roughness: Ratio between each coating mean roughness value and the coating with maximum roughness (A1—46.3 µm).
  • Adherence: Ratio between each coating adhesion force mean value and the highest value registered for all the coatings (B3—16 MPa).
  • Falling abrasion: Ratio between each coating abrasion resistance and the highest value registered for all the coatings (B3—100.72 gr/µm)
  • Taber abrasion: Ratio between each coating abrasion resistance and the highest value registered for all the coatings (B3—70.7 cycles/µm)
  • Conductivity: Ratio between each coating conductivity and the highest value registered for all the coatings (C1-1760 Wm−2 K−1)
Based on the results presented in Table 4, the most promising coating, which showed higher values of adherence and wear resistances in both abrasive tests, was B3 coating.

4. Conclusions

The experimental procedures and experimental results used in this study can be useful to engineers that design LPDC dies and processes. In particular, the following conclusions can be drawn:
  • The surface preparation and especially the cleanliness of the moulds is vital to achieve adequate adhesion of the coatings.
  • Higher refractory particle size leads to higher roughness affecting the surface topography of the cast part but enhance the fluidity through a slower solidification of the aluminium to meet target filing strategies. Furthermore, it has been observed that the wear extent also increases with higher particle sizes. Therefore, the selection of particle size should be made considering the different parts of the moulds, cast geometries, and surface finishing requirements, employing even a combination of sizes to meet the requisites.
  • In the case of average insulation coatings, B3 presented the best results in terms of surface finishing, adhesion, and wear resistance. No significant improvement on the coating performance was observed with the extra binder employed for B2 in comparison with B1, just a slight increase in adhesion.
  • In the case of high insulation capacity coatings, A2 presented higher wear resistance with much lower surface roughness compared to A1, for the same insulating degree, but lower adherence. Similar results were obtained for D1 coating, which possesses lower insulation capacity. The war resistance of all these coatings with coarser gran size was lower than that of B3 coating.
  • The results obtained for C1 conductive coating were similar to those of B2 and B1.
  • Finally, the use of the primer layer was found to be highly recommendable to improve the adherence and wear resistance of the coatings applied on moulds. Furthermore, the red colour of the layer could act as an indicator of the wearing of the coating and the need of recoating the mould.

Author Contributions

Conceptualization, B.Z., A.I., E.F., L.M., E.P., J.M. (Jessica Montero), R.G., I.M.d.l.P. and J.M. (Joannes Mendizabal); methodology, B.Z. and O.A.; validation, L.M., E.P., J.M. (Jessica Montero), R.G., I.M.d.l.P. and J.M. (Joannes Mendizabal); investigation, B.Z., A.L.-O. and E.F.; resources L.M., E.P., J.M. (Jessica Montero), R.G., I.M.d.l.P. and J.M. (Joannes Mendizabal); writing—original draft preparation, A.L.-O. and B.Z.; writing—review and editing, A.L.-O. and B.Z.; supervision, A.I. and J.M. (Joannes Mendizabal); project administration, B.Z., A.I. and J.M. (Joannes Mendizabal); funding acquisition, B.Z., E.F., A.I., L.M., E.P., J.M. (Jessica Montero), R.G., I.M.d.l.P. and J.M. (Joannes Mendizabal). All authors have read and agreed to the published version of the manuscript.

Funding

This research was funded by the European Project “MUSIC”, under Contract FoF-ICT-2011.7.1, and the grant of “ALEPRE” Project (ETORGAI 2015, ER-2015/00002) financed by the Basque Government.

Institutional Review Board Statement

Not applicable.

Informed Consent Statement

Not applicable.

Data Availability Statement

Data are contained within the article.

Acknowledgments

The authors would like to acknowledge the financing entities, as well as the project partners, for their technical support and the materials employed in this work.

Conflicts of Interest

Author L. Merchán and E. Pardo were employed by the company Foseco Española S.A.; Author J. Montero was employed by the company Befesa Aluminio S.L.; Author R. Granado was employed by the company Aalberts Surface Technologies; Author I. Mtz de la Pera was employed by the company Aurrenak S. Coop. L.; Author J. Mendizabal was employed by the company Edertek S. Coop. The remaining authors declare that the research was conducted in the absence of any commercial or financial relationships that could be construed as a potential conflict of interest.

References

  1. Brough, D.; Jouhara, H. The aluminium industry: A review on state-of-the-art technologies, environmental impacts and possibilities for waste heat recovery. Int. J. Thermofluids 2020, 1–2, 100007. [Google Scholar] [CrossRef]
  2. Gulec, A.E.; Gencer, Y.; Tarakci, M. The characterization of oxide based ceramic coating synthesized on Al-Si binary alloys by microarc oxidation. Surf. Coat. Technol. 2015, 269, 100–107. [Google Scholar] [CrossRef]
  3. Javidani, M.; Larouche, D. Application of cast Al-Si alloys in internal combustion engine components. Int. Mater. Rev. 2014, 59, 132–158. [Google Scholar] [CrossRef]
  4. Brown, J.R. Foseco Non-Ferrous Foundryman’s Handbook; Butterworth-Heinemann: Oxford, UK, 1999; ISBN 978-0-7506-4286-6. [Google Scholar] [CrossRef]
  5. Timelli, G.; Caliari, D.; Rakhmonov, J. Influence of Process Parameters and Sr Addition on the Microstructure and Casting Defects of LPDC A356 Alloy for Engine Blocks. J. Mater. Sci. Technol. 2016, 32, 515–523. [Google Scholar] [CrossRef]
  6. Okayasu, M.; Ota, K.; Takeuchi, S.; Shiraishi, T. Material properties of cast aluminium alloys produced by various casting proceses. Mater. Sci. Forum 2013, 765, 241–244. [Google Scholar] [CrossRef]
  7. Erzi, E.; Gürsoy, Ö.; Yüksel, C.; Colak, M.; Dispinar, D. Determination of aceptable quality limit for casting od A356 aluminium alloy: Supplier’s quality index (SQI). Metals 2019, 9, 957. [Google Scholar] [CrossRef]
  8. Otarawanna, S.; Dahle, A.K. Casting of aluminum alloys. In Fundamentals of Aluminum Metallurgy; Production, Processing and Applications; Woodhead Publishing Series in Metals and Surfaces Engineering; Woodhead: Derbyshire, UK, 2011; pp. 141–154. [Google Scholar] [CrossRef]
  9. Weiss, D. Fundamentals of Aluminum Metallurgy; Recent Advances; Woodhead Publishing Series in Metals and Surfaces Engineering; Woodhead: Derbyshire, UK, 2018; pp. 159–171. [Google Scholar] [CrossRef]
  10. Merlin, M.; Timelli, G.; Bonollo, F.; Caragnani, G.L. Impact bejhaviour of A356 alloy for low-pressure die casting automotive wheels. J. Mater. Process. Technol. 2009, 209, 1060–1073. [Google Scholar] [CrossRef]
  11. Hamasaiid, A.; Dargusch, M.S.; Dour, G. The impact of the casting thickness on the interfacial hear transfer and solidification of the casting during permanent mold casting of an A365 alloy. J. Manuf. Process 2019, 47, 229–237. [Google Scholar] [CrossRef]
  12. Zhang, B.; Maijer, D.M.; Cockcroft, S.L. Development of a 3-D thermal model of the low-pressure die-cast (LPDC) process of A356 aluminum alloy wheels. Mater. Sci. Eng. A 2007, 464, 295–305. [Google Scholar] [CrossRef]
  13. Miller, A.E.; Maijer, D.M. Investigation of erosive-corrosive wear in the low pressure die casting of aluminum A356. Mater. Sci. Eng. A 2006, 435–436, 100–111. [Google Scholar] [CrossRef]
  14. Mirbagheri, S.M.H.; Esmaeileian, H.; Serajzadeh, S.; Varahram, N.; Davami, P. Simulation of melt Flow in coated mould cavity in the casting process. J. Mater. Process. Technol. 2003, 142, 493–507. [Google Scholar] [CrossRef]
  15. Hidalgo, R.; Esnaola, J.A.; Llavori, I.; Larrañaga, M.; Hurtado, I.; Herrero-Dorca, N. Fatigue life estimation of cast aluminium alloys considering the effect of porosity on initiation and propagation phases. Int. J. Fatigue 2019, 125, 468–478. [Google Scholar] [CrossRef]
  16. Gowsalya, L.A.; Afshan, M.E. Heat transfer studies on solidification of casting process. In Casting Processes and Modelling of Metallic Materials; InTech Open: London, UK, 2020. [Google Scholar] [CrossRef]
  17. Bouchard, D.; Leboeuf, S.; Nadeau, J.-P.; Guthrie, R.I.L.; Isac, M. Dynamic wetting and heat transfer at the initiation of aluminium solidification on copper substrates. J. Mater. Sci. 2009, 44, 1923–1933. [Google Scholar] [CrossRef]
  18. Nallusamy, S. A Review on the effects of casting quality, microstructure and mechanical properties of cast Al-Si-0.3Mg alloy. Int. J. Perform. Eng. 2016, 12, 143–154. [Google Scholar]
  19. Hamasaiid, A.; Dargusch, M.S.; Davidson, C.J.; Tovar, S.; Loulou, T.; Rezaï-Aria, F.; Dour, G. Effect of Mold Coating Materials and Thickness on Heat Transfer in Permanent Mold Casting of Aluminum Alloys. Metall. Mater. Trans. A 2007, 38, 1303–1316. [Google Scholar] [CrossRef]
  20. Nwaogu, U.C.; Poulsen, T.; Stage, R.K.; Bischoff, C.; Tiedje, N.S. New sol-gel refractory coatings on chemically-bonded sand cores for foundry applications to improve casting surface quality. Surf. Coat. Technol. 2011, 205, 4035–4044. [Google Scholar] [CrossRef]
  21. Decultieux, F. Caractérisation du Comportement Thermomécanique D’alliages de Fonderie Pendant la Solidification. Ph.D. Thesis, Ecole des Mines de Paris, Paris, France, 1996. [Google Scholar]
  22. Zhang, L.; Li, L. Determination of heat transfer coefficients at metal/chill interface in the casting solidification process. Heat Mass Transf. 2013, 49, 1071–1080. [Google Scholar] [CrossRef]
  23. Hofer, P.; Kaschnitz, E.; Schumacher, P. Simulation of distortion and residual stress in high pressure die casting-modelling and experiments. IOP Conf. Ser. Mater. Sci. Eng. 2012, 33, 012055. [Google Scholar] [CrossRef]
  24. Nwaogu, U.C.; Tiedje, N.S. Foundry coating technology: A review. Mater. Sci. Appl. 2011, 8, 1143–1160. [Google Scholar] [CrossRef]
  25. Merchán, M.; de Cortázar, M.G.; Galarraga, H.; Bárcena, J.; Artola, A. Research on coatings and infiltration to strengthen ceramic lost cores used in High-Pressure Die Casting processes. Int. J. Met. 2019, 13, 597–603. [Google Scholar] [CrossRef]
  26. Hofer, P.; Kaschnitz, E.; Schumacher, P. Distortion and Residual Stress in High-Pressure Die Castings: Simulation and Measurements. J. Miner. Met. Mater. Soc. 2014, 66, 1638–1646. [Google Scholar] [CrossRef]
  27. Randhiko, A.; Al Fauzan, J.; Dhaneswara, D. The effect of alumina partial substitution as filler on refractory coating based on zirconium silicate for aluminium casting applications. Adv. Nat. Appl. Sci. 2020, 14, 129–135. [Google Scholar] [CrossRef]
  28. Dhaneswara, D.; Shandiana, B.; Dwinanda, D.A. The effect of various talc composition on zircon based as refractory filler foundry coating for aluminum casting. In Proceedings of the 3ed International Seminar on Metallurgy and Materials (ISMM2019): Exploring New Innovation in Metallurgy and Materials, Tangerang Selatan, Indonesia, 23–24 October 2019; AIP Publishing: College Park, MD, USA, 2020; Volume 2232, p. 070006. [Google Scholar] [CrossRef]
  29. Dwinanda, D.A.; Dhaneswara, D.; Shandiana, B. The Effect of Silica Fused Addition as Filler on Zircon Based Refractory Coating. Mater. Sci. Forum 2020, 988, 23–29. [Google Scholar] [CrossRef]
  30. Nwaogu, U.; Tiedje, N.S. Mechanical properties of chemically bonded sand core materials dipped in sol–gel coating impregnated with filter dust: Novel approach to improve casting quality. Int. J. Cast Met. Res. 2012, 25, 307–317. [Google Scholar] [CrossRef]
  31. Milanova, G. Foundry Coatings: Review. J. Mater. Eng. 2023, 1, 45–53. [Google Scholar] [CrossRef]
  32. Nwaogu, U.C.; Tiedje, N.S.; Hansen, H.N. A non-contact 3D method to characterize the surface roughness of castings. J. Mater. Process. Technol. 2013, 213, 59–68. [Google Scholar] [CrossRef]
  33. Nwaogu, U.; Poulsen, T.; Gravesen, B.; Tiedje, N. Using sol–gel component as additive to foundry coatings to improve casting quality. Int. J. Cast Met. Res. 2012, 25, 176–187. [Google Scholar] [CrossRef]
  34. Dhaneswara, D.; Yasfi, A.F.J.; Randhiko, A. Study of effect partial substitution zirconium silicate and aluminum oxide filler as refractory filler for aluminum casting. In Proceedings of the 3rd International Seminar on Metallurgy and Materials (ISMM2019): Exploring New Innovation in Metallurgy and Materials, Tangerang Selatan, Indonesia, 23–24 October 2019; AIP Publishing: College Park, MD, USA, 2020; Volume 2232, p. 070010. [Google Scholar] [CrossRef]
  35. Di Muoio, G.L.; Tiedje, N.S. Achieving control of coating process in your foundry. Arch. Foundry Eng. 2015, 15, 110–114. [Google Scholar] [CrossRef]
  36. ISO 4624; Paints and Varnishes. Pull-of Test for Adhesion. ISO: Geneva, Switzerland, 2016.
  37. ASTM E407; Standard Practice for Microetching Metals and Alloys. ASTM: West Conshohocken, PA, USA, 2021.
  38. ASTM D1186; Standard Test Methods for Nondestructive Measurement of Dry Film Thickness of Nonmagnetic Coatings Applied to a Ferrous Base. ASTM: West Conshohocken, PA, USA, 2021.
  39. ISO 21920; Geometrical Product Specifications (GPS)—Surface Texture: Profile Method—Rules and Procedures for the Assessment of Surface Texture. ISO: Geneva, Switzerland, 2021.
  40. ASTM D968; Standard Test Methods for Abrasion Resistance of Organic Coatings by Falling Abrasive. ASTM: West Conshohocken, PA, USA, 2017.
  41. ASTM D4060; Standard Test Method for Abrasion Resistance of Organic Coatings by the Taber Abraser. ASTM: West Conshohocken, PA, USA, 2019.
  42. Pozo-Antonio, J.S.; Barral, D.; Herrera, A.; Elert, K.; Rivas, T.; Cardell, C. Effect of tempera paint composition on their superficial physical properties-application of interferometric profilometry and hyperspectral imaging techniques. Prog. Org. Coat. 2018, 117, 56–68. [Google Scholar] [CrossRef]
  43. Pozo-Antonio, J.S.; Cardell, C.; Sánchez, S.; Montes Rueda, J. Reflectance of Oil Paintings: Influence of Paint Layer Thickness and Binder Amount. Coatings 2022, 12, 601. [Google Scholar] [CrossRef]
  44. Li, F.; Wang, Y.; Dang, W.; Xu, Z.; Zhang, X.; Zhang, B.; Zhao, K.; Tang, Y. Effect of curing process and pyrolysis temperature on the microstructure, adhesion and corrosion resistance of PCS-derived coatings. Ceram. Int. 2022, 48, 28046–28058. [Google Scholar] [CrossRef]
  45. Li, C.; Wang, B.; Zhou, L.; Hou, X.; Su, S. Effects of Curing Temperature and Adhesion Promoters on Adhesion of Addition-cure Liquid Silicone Rubber. Silicon 2022, 14, 10495–10507. [Google Scholar] [CrossRef]
  46. Jahani, Y.; Baena, M.; Barris, C.; Perera, R.; Torres, L. Influence of curing, post-curing and testing temperatures on mechanical properties of a structural adhesive. Constr. Build. Mater. 2022, 324, 126698. [Google Scholar] [CrossRef]
  47. Carbas, R.J.C.; Marques EA, S.; da Silva LF, M.; Lopes, A.M. Effect of Cure Temperature on the Glass Transition Temperature and Mechanical Properties of Epoxy Adhesives. J. Adhes. 2014, 90, 104–119. [Google Scholar] [CrossRef]
  48. Kumar, S.; Pandey, R.; Panwar, R.S.; Pandey, O.P. Effect of Particle Size on Wear of Particulate Reinforced Aluminum Alloy Composites at Elevated Temperatures. J. Mater. Eng. Perform. 2013, 22, 3550–3560. [Google Scholar] [CrossRef]
  49. Santos, A.; Guzmán, R.; Ramirez, Z.Y. Influence on the wear resistance of the particle size used in coatings of Alumina. J. Phys. Conf. Ser. 2017, 786, 012012. [Google Scholar] [CrossRef]
  50. Gåhlin, R.; Jacobson, S. The particle size effect in abrasion studied by controlled abrasive surfaces. Wear 1999, 224, 118–125. [Google Scholar] [CrossRef]
  51. Trezona, R.I.; Allsopp, D.N.; Hutchings, I.M. Transitions between two-body and threebody abrasive wear: Influence of test conditions in the microscale abrasive wear test. Wear 1999, 225–229, 205–214. [Google Scholar] [CrossRef]
  52. Landolt, D.; Michler, S.; Stemp, M.; Barril, S. Third body effects and material fluxes in tribocorrosion systems involving a sliding contact. Wear 2004, 256, 517–524. [Google Scholar] [CrossRef]
  53. Diomidis, N.; Mischler, S. Third body effects on friction and wear during fretting of Steel contacts. Tribol. Int. 2011, 44, 1452–1460. [Google Scholar] [CrossRef]
  54. Ciprari, S.; Ripard, V.; Saulot, A.; Massi, F. Investigation of third body role in dry contacts: Experimental procedure to dissociate the effects of substrate and interface layer on the contact pair frictional response. Tribol. Int. 2023, 190, 109047. [Google Scholar] [CrossRef]
Figure 1. Superficial microstructure of the steel substrate after the quenching and tempering heat treatment (ground, polished, and etched on Nital (4% HNO3) [37]).
Coatings 14 00643 g001
Figure 2. Nominal thermal conductivity of a layer of 200 ± 20 µm of the different coatings provided by the coating manufacturer [FOSECO].
Coatings 14 00643 g002
Figure 3. Schematic illustration of the pull-off adhesion test with different fracture mode types.
Coatings 14 00643 g003
Figure 4. (a) Test concept, (b) testing device, and (c) different abrasive wheels.
Coatings 14 00643 g004
Figure 5. (a) Part of the detachment of coating due to poor cleaning method, (b) samples ready to be painted, and (c) result of 4 different coating processes in the furnace ready to cure.
Coatings 14 00643 g005
Figure 6. Mean (a) thickness and (b) roughness values obtained in the different coatings.
Coatings 14 00643 g006
Figure 7. Relationship between grain size of the refractory particles used to formulate the coating and resulting surface roughness.
Coatings 14 00643 g007
Figure 8. Topographies of the coatings obtained by confocal microscopy, showing the different aspect of the coatings surfaces and roughness.
Coatings 14 00643 g008
Figure 9. Mean adhesion values measured with pull of test device.
Coatings 14 00643 g009
Figure 10. Failure mode of the pull-off adhesion test for the different coatings.
Coatings 14 00643 g010
Figure 11. Influence of substrate pre-treatment (grinding, polishing, and shot-blasting) and primer sub-layer on pull-off test (top) and falling abrasive test (bottom).
Coatings 14 00643 g011
Figure 12. Influence of steel temperature during the painting process (top) on the pull-off adhesion test (bottom) and falling abrasive test calculated as a % from the optimum temperature.
Coatings 14 00643 g012
Figure 13. Thickness evolution of A1 sample during the abrasive test.
Coatings 14 00643 g013
Figure 14. Wear resistance on falling abrasive test of (a) the linear coating region, (b) the logarithmic intermediate transition layer, (c) and the primer layer.
Coatings 14 00643 g014
Figure 15. Representative illustration of the different stages during the wear test: linear wearing stage of the coating after (a) 20 and (b) 400 cycles, (c) logarithmic wear stage in the transition layer at 1000 cycles, and (d) linear wear of the primer layer after 1500 cycles.
Coatings 14 00643 g015
Figure 16. Abrasion resistance measured on Taber abrasive test of (a) the linear coating region, (b) the logarithmic intermediate transition layer, (c) and the primer layer.
Coatings 14 00643 g016
Table 1. Mechanical properties of the AISI H11 substrate material after the heat treatment.
Hardness (HRC)Grain SizeElasticity Modulus (GPa)Yield Strength (MPa)Tensile Strength (MPa)Charpy Impact (J)
25 °C500 °C25 °C500 °C25 °C500 °C
37–3862109477401185859113167
Table 2. Roughness of the different substrates finishing pre-treatments.
Surface FinishingRoughness Ra (µm)
Ground1.60
Polished0.02
Shot-blasted2.81
Table 3. Characteristics of the coating selected for the study provided by the coating manufacturer [FOSECO].
NameDescriptionNominal Grain Size of Ceramic Particles (µm)Nominal Thermal Conductivity (Wm−2 K−1), 200 ± 20 µm Layer
PPrimer and function improve the adherence of the painting itself251640
A1Very high insulation, very rough finishing, extra binder80735
A2Very high insulation very rough—new development50690
D1Medium insulation and extra binder301000
B1Average insulation and smooth finishing of final parts151470
B2Average insulation, extra binder, smooth finishing of final parts151470
B3Average insulation and smooth finishing of final parts—new development101450
C1Conductive graphite/release351760
Table 4. Summary table used to compare the different coating alternatives.
% from MaxRoughnessAdherenceFallingTaberConductivity
A1100.0081.063.020.2141.88
A257.0140.3118.504.4839.20
D167.2157.2516.623.6756.82
B140.3637.3821.571.8483.52
B238.5262.8825.303.4383.52
B328.97100.00100.00100.0082.39
C139.1445.1915.231.70100.00
<55% Low
>55% High
<40%
<50%
<10%
<30%
<3%
<5%
>70%
>50%
<50%
Disclaimer/Publisher’s Note: The statements, opinions and data contained in all publications are solely those of the individual author(s) and contributor(s) and not of MDPI and/or the editor(s). MDPI and/or the editor(s) disclaim responsibility for any injury to people or property resulting from any ideas, methods, instructions or products referred to in the content.