Article

Numerical Analysis of Thermal Flow Dynamics of Arc Plasma and Molten Pool in Hollow Cathode Arc Welding with Oxygen Content

1
China Academy of Machinery Science and Technology Group Co., Ltd., Beijing 100044, China
2
School of Material Science and Engineering, University of Science and Technology Beijing, Beijing 100083, China
3
Harbin Welding Institute Limited Company, Harbin 150028, China
4
Shanghai Key Laboratory of Materials Laser Processing and Modification, School of Materials Science and Engineering, Shanghai Jiao Tong University, Shanghai 200240, China
*
Authors to whom correspondence should be addressed.
Coatings 2024, 14(4), 382; https://doi.org/10.3390/coatings14040382
Submission received: 27 February 2024 / Revised: 17 March 2024 / Accepted: 20 March 2024 / Published: 25 March 2024
(This article belongs to the Section Plasma Coatings, Surfaces & Interfaces)

Abstract

:
The mechanism of the pulsed hollow cathode arc welding (HCAW) process was revealed using a fully coupled model with a hollow cathode. We solved the governing equations with the Marangoni effect to study the dynamic behaviors of a molten pool with a square pulsing current (200~400 A, 900 Hz) and varying O2 content; the dynamics of the arc plasma and the weld pool in the HCAW process were investigated quantitatively. The results show that the intensity of the arc plasma was more significantly weakened by the design of the hollow cathode in HCAW than that in GTAW with a solid hollow cathode. We could obtain a stable molten pool even with a large pulsing current section (200 A–400 A) at higher frequencies. The flow dynamics of the molten pool were mainly dominated by the Marangoni effect with varying oxygen content, and we could promote penetration by increasing O2 content in HCAW.

1. Introduction

In order to obtain a stable welding arc and reduce the humping effect which leads to large deformation in higher current arc welding processes, hollow cathode arc welding (HCAW) was first developed for low-pressure applications in the 1960s and proved to be suitable for welding in space. Nerovnyi et al. [1] proved that HCAW can be successfully used for a wide variety of process in vacuum. Nishikawa et al. [2] systemically investigated the fundamental characteristics of gas hollow tungsten arc welding, such as discharge characteristics, plasma properties, and the melting process under a simulated space environment. They reported that the anode size was greater than that for conventional gas tungsten arc welding.
Shobako et al. [3] used the split anode method and probe method to measure the current density distribution and arc floating potential. They confirmed that the heat flux distribution of the HCAW arc was flat. Cho et al. [4] applied the Abel inversion method to calculate the temperature distribution of arc plasma in gas hollow tungsten arc welding. They demonstrated that HCAW was an effective method to control the heat flux in the center of the arc plasma for various gas flow rates. Nishikawa et al. [5] reported that the current distribution on the workpiece surface for HCAW was extremely diffused, and the weld profile was characterized by shallow and wide penetration. They demonstrated that the gas hollow tungsten arc was normally an even heat source. In order to overcome the drawbacks of the flat heat flux of HCAW, many efforts have been made by researchers to increase the energy density of arc plasma in HCAW, indicating that the arc characteristics can be flexibly adjusted through the HCAW process. Cho et al. [4] studied the effect of gas flow rates on arc characteristics in HCAW using experimental and CFD modeling methods and reported that a hollow cathode with higher gas flow rates would increase the energy flux intensity of arc plasma so that productivity is improved. Chen et al. [6] and Jiang et al. [7] illustrated that the arc energy density could be modified with a hollow cathode with negative pressure. They observed that the innovative HCAW process with negative pressure in hollow tungsten can decrease the arc pressure but increases the arc energy density to benefit productivity.
However, the industrial applications of HCAW are limited since there is still a lack of complete understanding regarding the dynamics of the arc and the molten pool in HCAW; only Tashiro et al. [8] established a numerical model to analyze the characteristics of HCAW arc plasma, indicating that the maximum velocity (50 m/s) and arc temperature (11,000 K) are 25% and 60% of these in traditional GTAW with a solid cathode, while the influence of an argon arc on the weld pool is not discussed. Saifutdinov et al. [9] established a numerical simulation model to analyze the main characteristics of DC plasma torches, and in particular, the self-consistent determination of the distribution of temperature fields in electrodes. Margarita et al. [10] demonstrated that the self-consistent coupling of a cathode and LTE plasma submodel is advantageous in the modeling of plasma spray torches. Generally speaking, most of the previous research on the numerical modeling of arcs focus on the dynamic behavior of molten pool subjected to the Marangoni effect, including [1,2,3,5,11,12,13,14,15]; the dynamics of molten pools with gradients of O2 have rarely been mentioned.
In our work, an innovative approach to control the flow dynamics of the weld pool was proposed using a mixture gas of Ar and O2 as the shielding gas, and the flow rate ratio was controlled by inserting O2 in the hollow cathode; the mechanism of the pulsed HCAW process with the mixture gas of argon and O2 was revealed by a fully coupled model with a hollow cathode. We solved the governing equations with the Marangoni effect to study the dynamic behaviors of a molten pool with a square pulsing current (200~400 A, 900 Hz) and varying O2 content; the characteristics of the arc plasma and the dynamics of the weld pool in HCAW were investigated. COMSOL5.4 was used to solve the partial differential equations.

2. Mathematical Model

2.1. Assumptions

  • The shielding gas is in the Local Thermodynamic Equilibrium (LTE) state;
  • The multiphase fluids (gas, liquid) are incompressible with a laminar flow;
  • The Marangoni effect of Fe-O alloy is determined by both temperature and oxygen content [2].
As shown in Figure 1a, a 19 mm length hollow cathode with an inner radius of 1.5 mm and an outer radius of 3 mm was connected to a current inlet B; the square current wave form ranged from 200 A to 400 A with 900 Hz and an EN ratio of 0; A, the Q235 low-carbon steel (O~0.1 wt%), was connected to the ground F. The flow rate of the mixture gas at inlet A1 was 0.01 L/min, while the flow rate of the mixture gas at inlet A2 (with an outer diameter of 5 mm) was 15 L/min; the properties of the hollow cathode were determined by temperature, and the properties of the mixture gas and steel were determined by temperature, level set function, and phase change coefficient.
The Maxwell and heat transfer equations with Joule heat and radiation loss were calculated in the whole domain, while all the momentum sources (shear stress from the plasma jet and the surface tension with the Marangoni effect subjected to temperature and oxygen activity: Lorentz force, Darcy damping force, buoyancy force, and gravity) [3,8,9,10,16,17] were implemented in the momentum equations calculated in the fluid domain. LTE-diffusion approximation [18] was used at both the interfaces between electrodes and the mixture gas, featuring level set delta functions(full derivation in Equation (S1)).
The physical properties of the mixture gas (Ar + O2), hollow cathode, and the solid and liquid phase of the Q235 low-carbon steel and welding parameters can be found in Table 1.

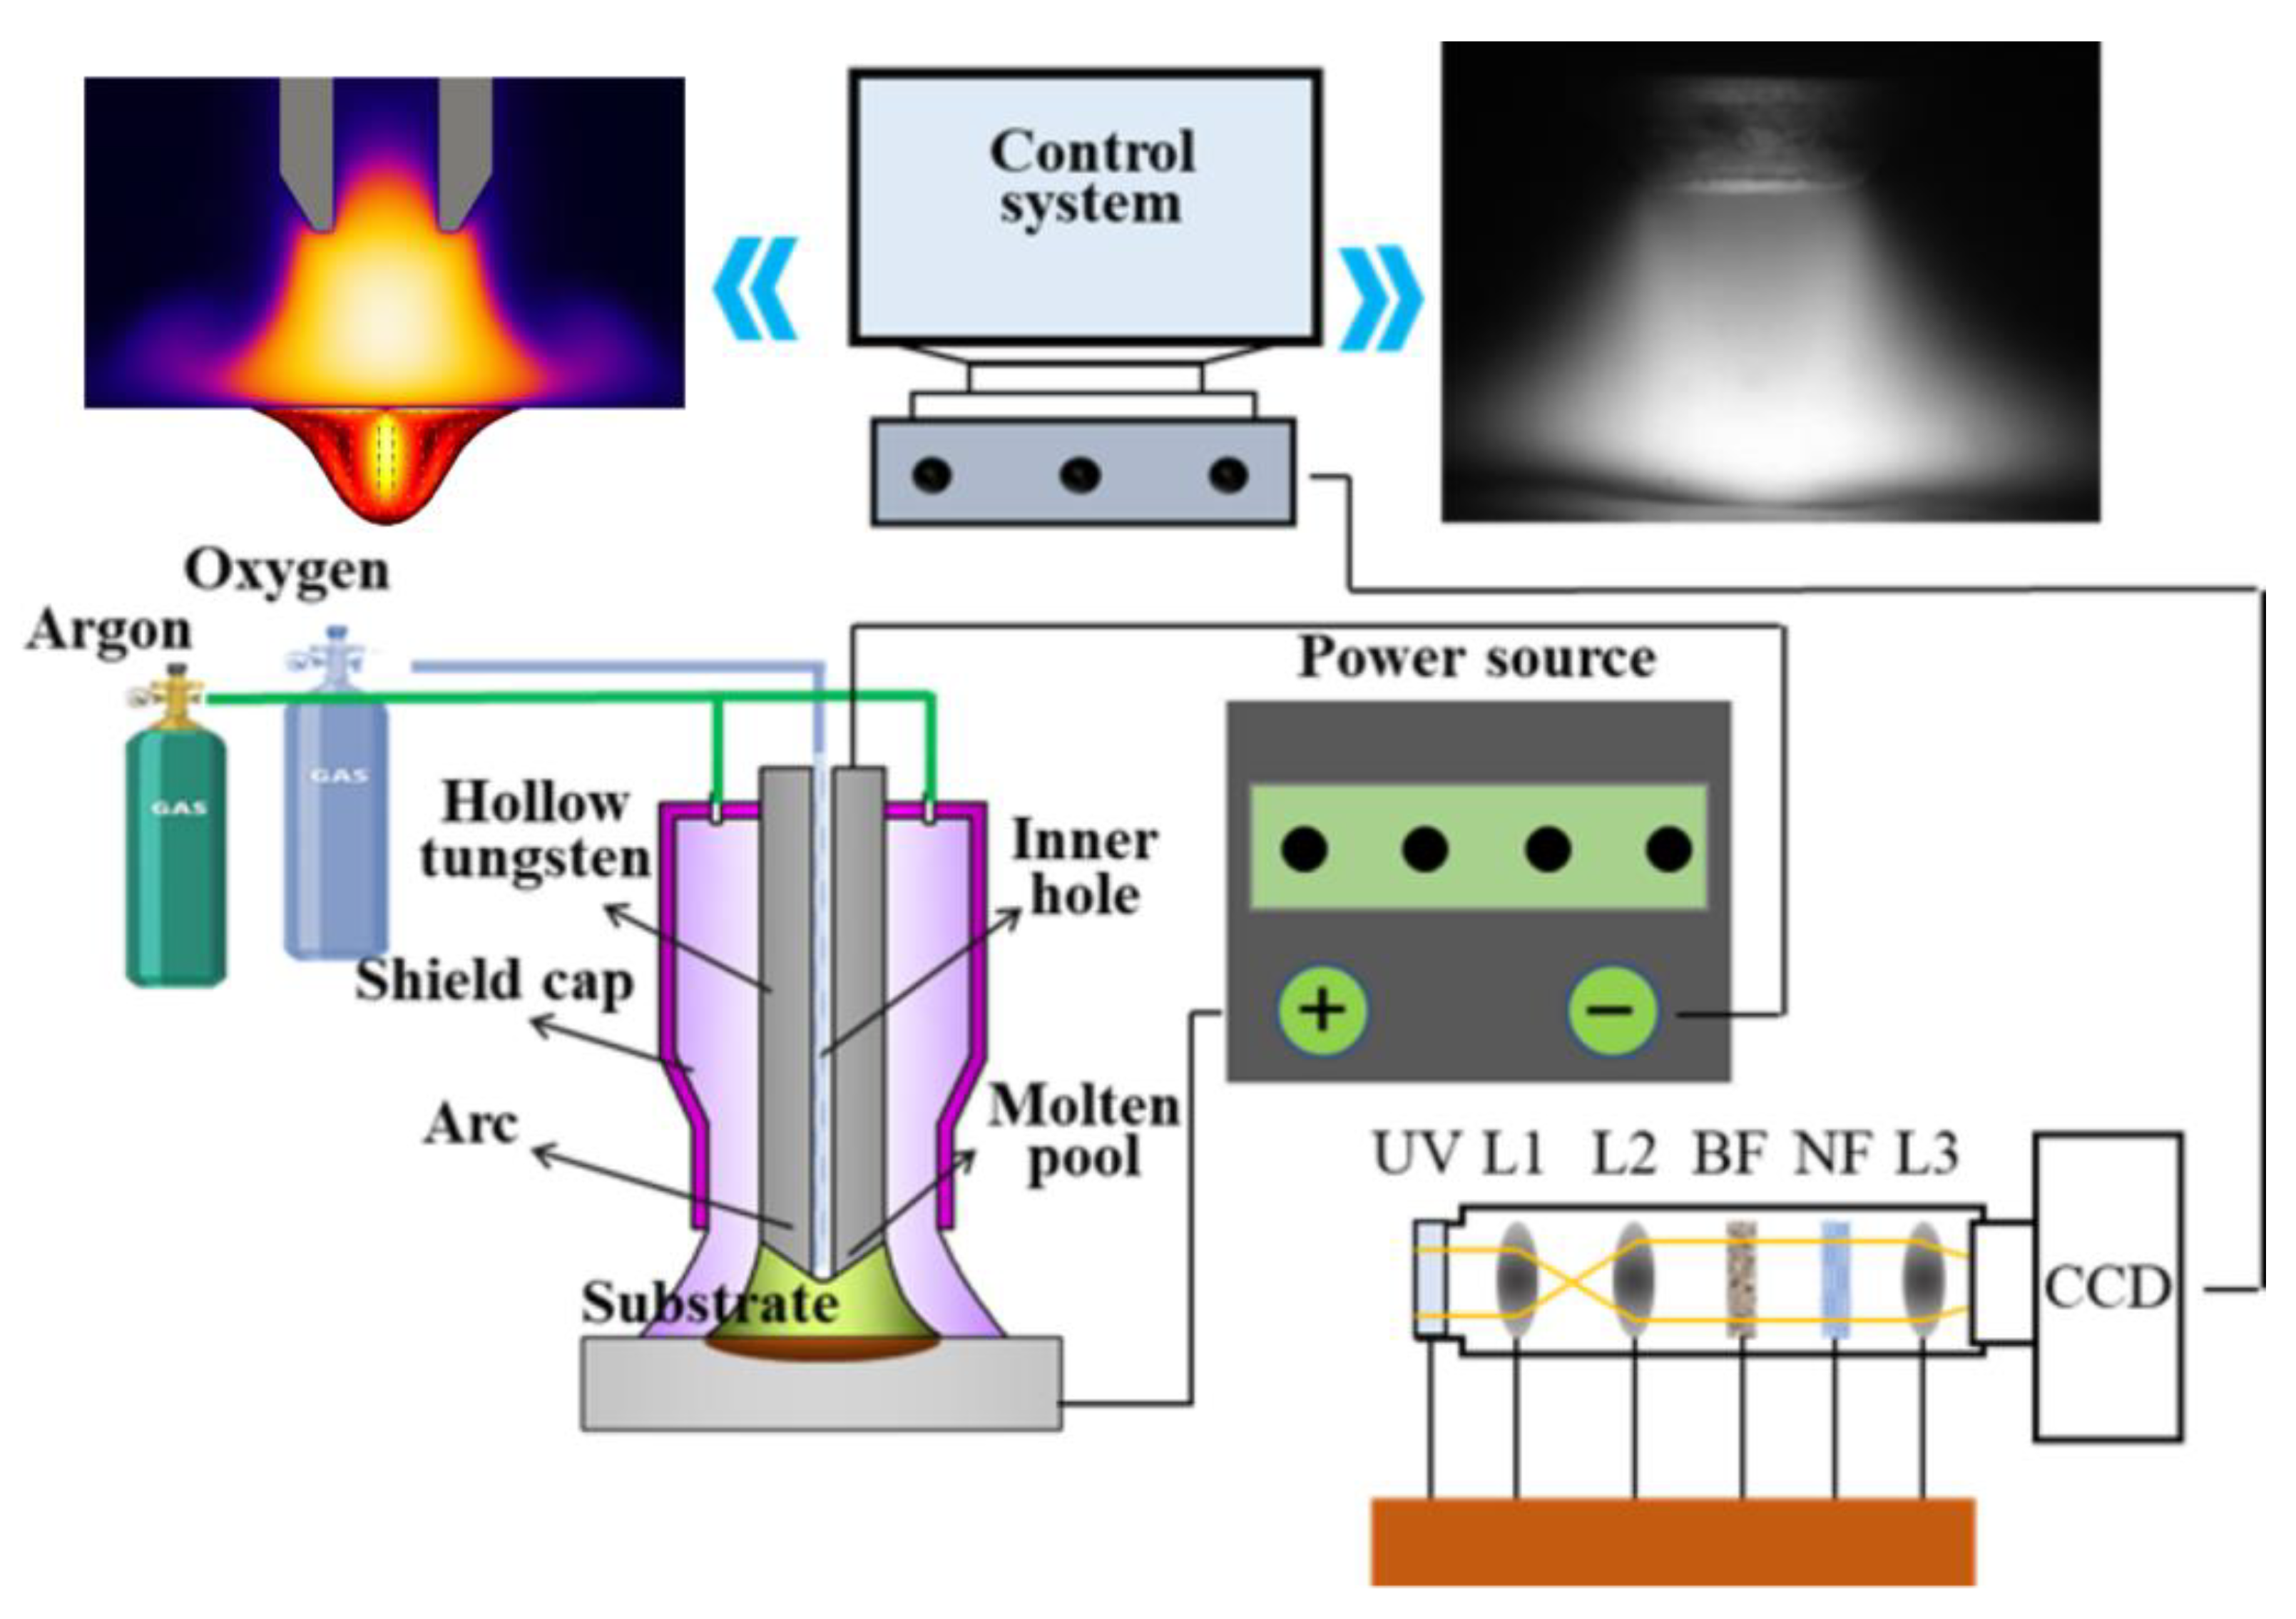
2.2. Boundary Conditions and Meshes

As listed in Table 2, A1 is the inlet of O2 and A2 is the inlet of Ar; the current inlet was set on the hollow cathode on the surface of B. We adopted two meshes for stationary study and transient study to reduce the cost of calculation. The minimum mesh size of 1 × 10⁻⁴ m was near the cathode tip (See Figure 1c).

2.3. Numerical Procedure

The numerical procedure of MHD in HCAW is similar to our previous numerical works of pulsed GTAW [19]; all the partial differential equations were solved using COMSOL5.2. Before the transient study with a square pulsing current from 200 A to 400 A, a stationary study was calculated (I = 200 A) to provide initial values.

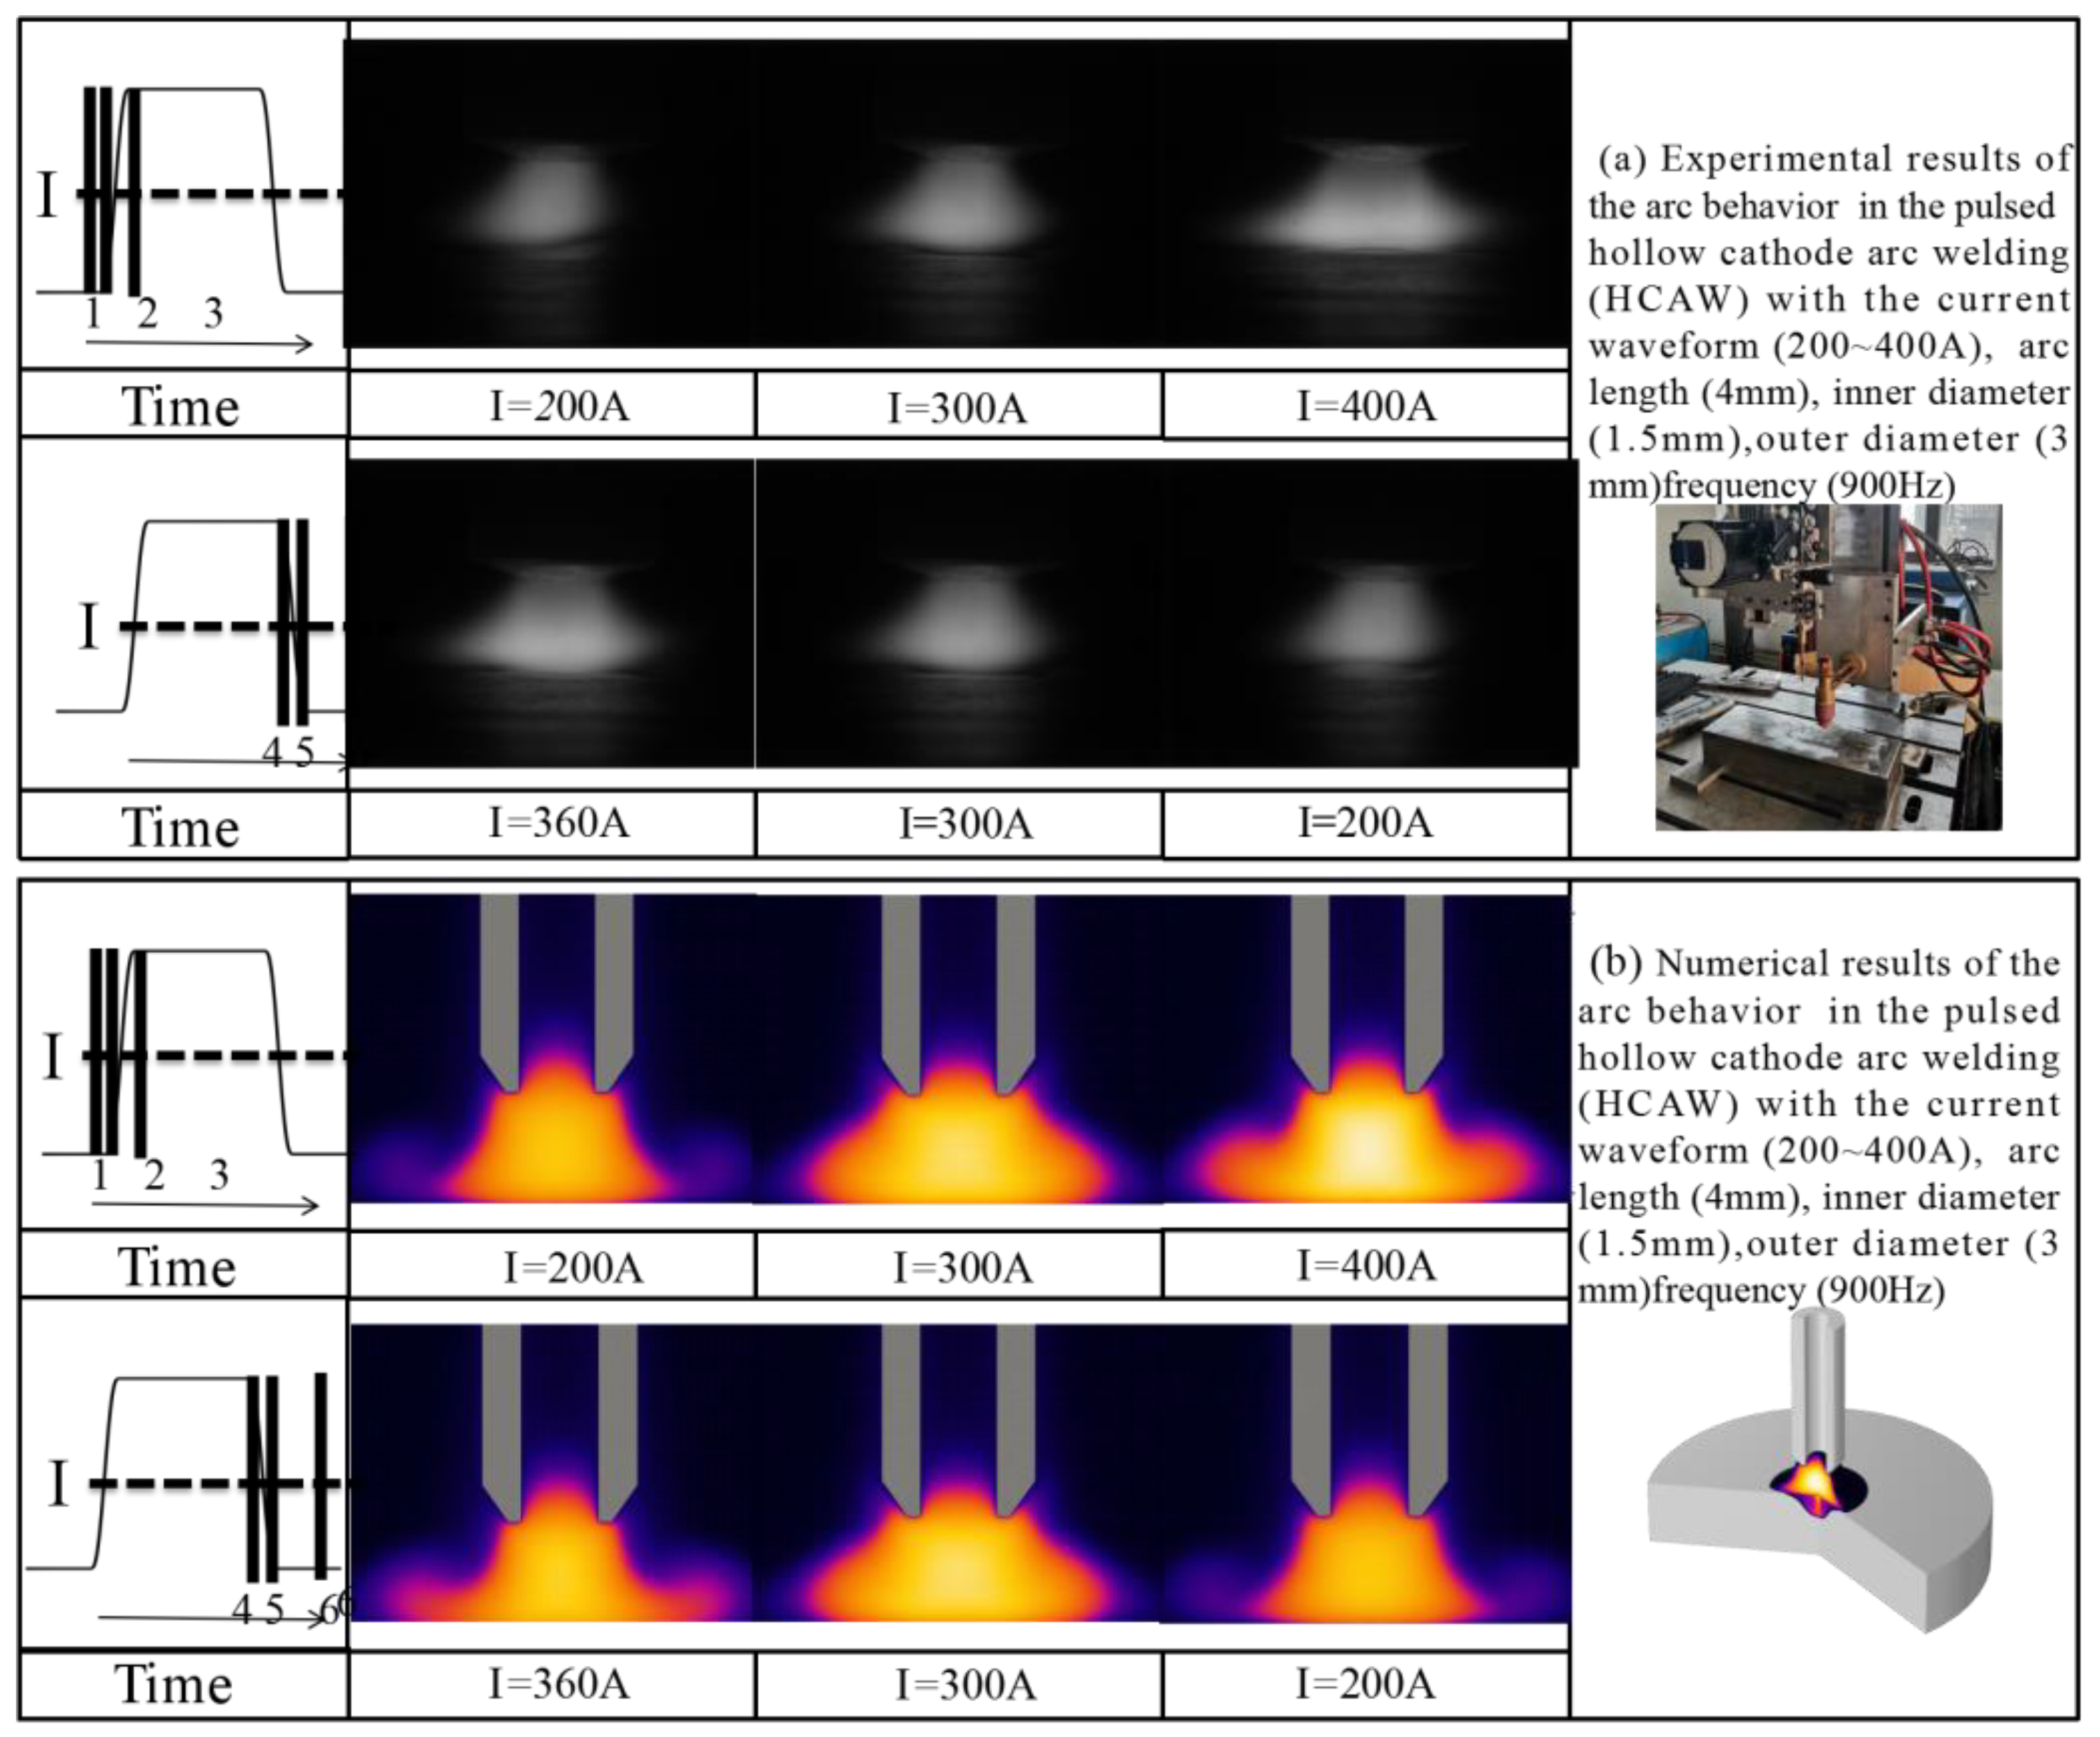
3. Experimental Procedure

As can be seen in Figure 2, the HCAW experimental system included a GTAW power source (Aotai WSME-630Ⅱ, Aotai, Jinan, China), a shielding gas system, and a water-cooling unit. A hollow tungsten electrode was positioned in the center of the welding arc. A bead-on-plate welding wad was used on low-carbon steel plates which were 200 × 200 × 10 mm in size. The base metal surface was cleaned with acetone before welding. The feasibility and accuracy of the fully coupled model based on MHD was verified preliminary by the shape of the welding arc captured by a CCD camera (iX i-SPEED 700, iX Cameras, Rocheford, UK).

4. Results and Discussion

In this section, we first focus on the dynamics of the weld pool with the square pulsing current within one thermal circle, and then, the comparison of varying oxygen contents is made to reveal the mechanism of the flow dynamics of the molten pool.

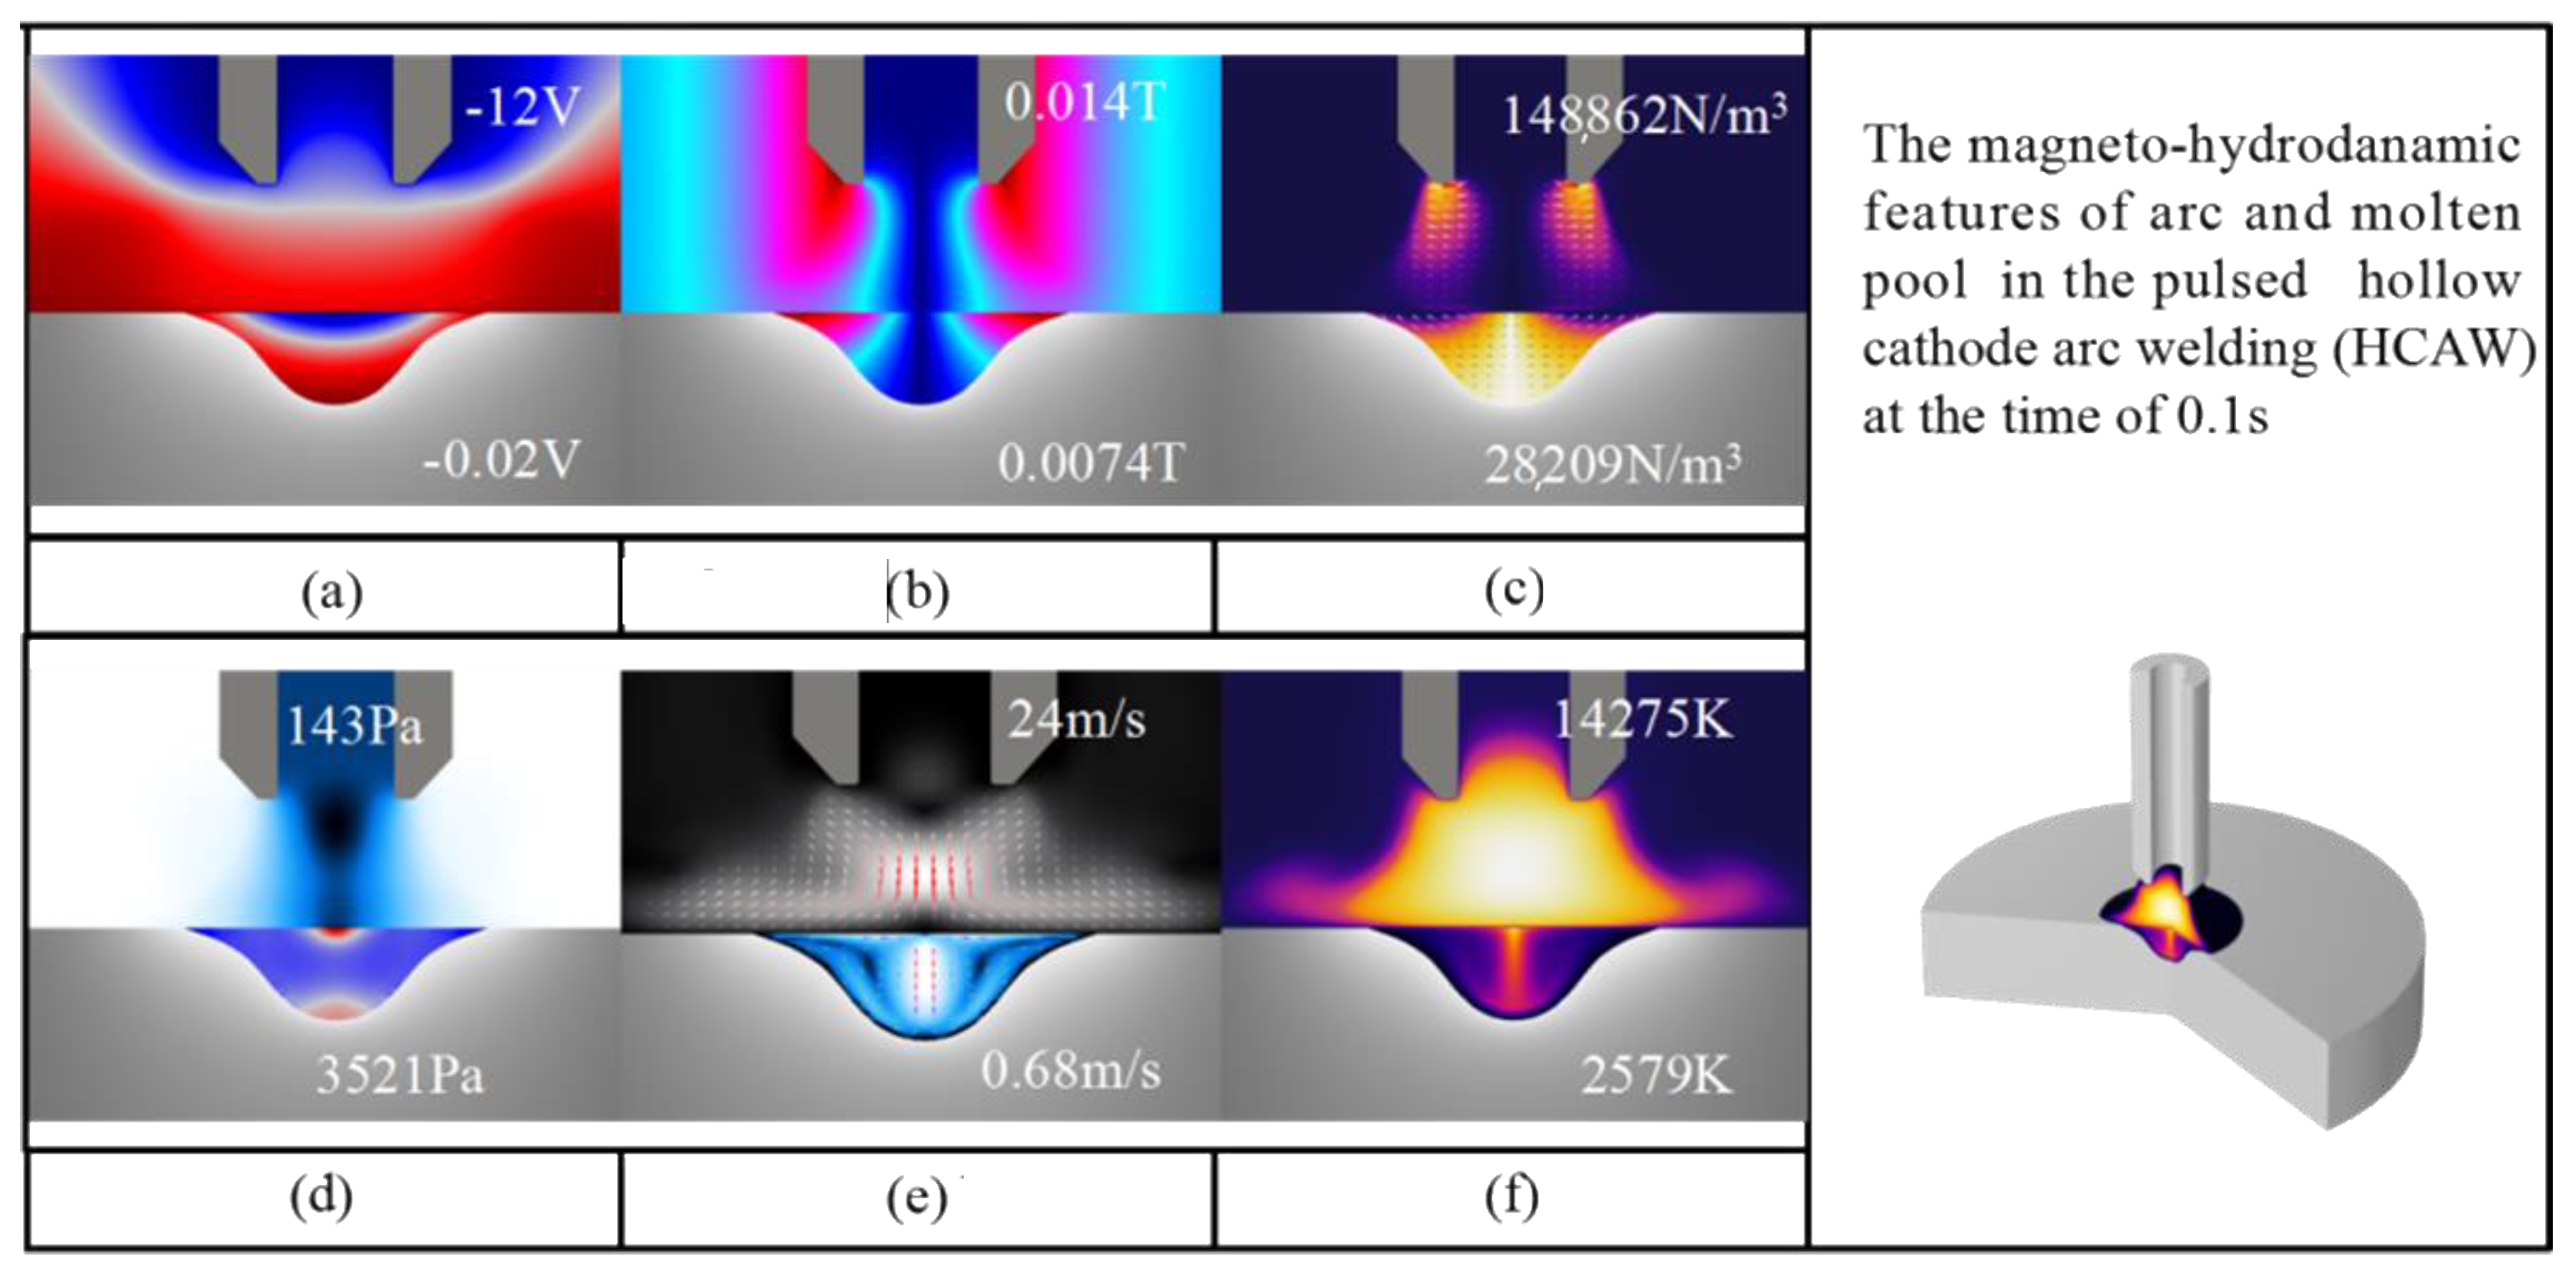
4.1. The Magneto-Hydro Dynamic Characteristics of Arc Plasma and Weld Pool in HCAW (t = 0.1 s, O2 wt% = 0.1)

As shown in Figure 3a–c, while the input of peak current was 200 A, the electric potential near the cathode was calculated to be −12 V, while the magnetic intensity (magnetic flux density~0.014 T) was much smaller than that in GTAW (magnetic flux density~0.1 T), as mentioned in our previous works [20,21], resulting in a smaller Lorentz force both in the arc plasma (1.5 × 10⁵ A/m2 near the hollow tungsten tip) and molten pool (2.8 × 10⁴ A/m2 at the side of the free surface). The maximum arc pressure was 143 Pa in the middle of the hollow cathode tip, while the maximum pressure in the molten pool reached 3521 Pa in the center of the free surface. This was not like the flow pattern in GTAW, in which the maximum velocity was near the cathode tip. The maximum velocity of 24 m/s occurred in the middle of the arc column and hollow cathode tip in HCAW and reduced gradually from the arc column to the side of the work piece, while the weld pool exhibited a typical inside–downward flow, and the velocity reached its maximum (0.68 m/s) at the center of the free surface, resulting in a finger-shape weld pool profile with deep penetration. The maximum arc temperature was 14,275 K in the arc column, and the temperature gradient was very small.
Compared to the GTAW process, we could determine that the hollow cathode led to a less intensive arc flow and a more uniform temperature field in the arc plasma, even at a higher current of 200 A. This could be attributed to the less intensive electromagnetic field near the tip of the hollow cathode leading to a less intensive heat source and Lorentz force, so the heating, accelerating and compressive effects of electromagnetic field on the arc plasma were weakened.

4.2. The Magneto-Hydro Dynamic Characteristics of HCAW in Ten Circles (t = 0~0.01 s, O2 wt% = 0.1)

As shown in Figure 4, we took point A in the center of the hollow cathode, referring to the arc column, and point B, referring to the molten pool. Generally speaking, we could observe from the line graph of point A that the arc plasma exhibited a periodical expansion and contraction with the same frequency of square current waveform not only for the electromagnetic field (the magnetic flux density at point A fluctuated around 3 E–6 T; see Figure 4b), but also for the thermal flow (the velocity magnitude fluctuated around 12 m/s; see Figure 5d, while the temperature fluctuated around 15,000 K at point A; see Figure 4c).
At the peak current of 200 A, the arc column had a relatively uniform thermal flow with the maximum temperature of 14,361 K and the maximum velocity of 22.8 m/s. As the current increased rapidly from 200 A to 300 A, the maximum arc velocity reached 38.5 m/s, and the arc temperature rose to 15,000 K, the arc shape experienced a relatively small expansion; meanwhile, as the current rose to 400 A, the maximum velocity reached 60.9 m/s and the expansion of the arc shape could be clearly identified with a maximum temperature of 17,000 K. However, even at this high current stage, the thermal flow of the weld pool still remained stable. As the current decreased slightly from 400 A to 360 A, the maximum velocity decreased to a very similar value of 53 m/s, and the arc shape exhibited a clear bell shape with the maximum temperature of 16,000 K. As the current decreased from 260 A to 200 A, the arc shape experienced a contraction process, whereas the magnitudes of temperature and the velocities in the arc plasma decreased, respectively, from 15,000 K&27.6 m/s to 14,000 K&22.8 m/s. We could observe that the arc flow mainly started from the hollow cathode tip, concentrating in the center of arc column, then dispersing to the side of work piece. We could observe that the concentration of O2 in the gas mixture of arc plasma also experienced a periodical pulsing flow from the hollow cathode to the surface of the melt pool.
The flow in the weld pool remained stable without significant changes within one thermal circle in such a short period of time (1/900 s). We could observe a typical finger-shaped profile with an inward–downward flow pattern, in which the melt alloy at the surface of weld pool flowed inward, while the melt alloy in the center of weld pool flowed downward, and the velocity reached its maximum (0.6 m/s) at the very center of the molten pool. From Figure 6, we can see that the melt pool at Point B experienced a very small fluctuation of electromagnetic fields, while the velocity was stable at 0.6 m/s and the temperature remained at approximately 2000 K.
Compared to the GTAW process, we can conclude that the intensity of electromagnetic fields is relatively weakened by the design of a hollow cathode, leading to a low-intensity but stable arc flow. Together with a high-frequency pulsing current, the shear stress and electromagnetic force cannot affect the melt pool flow directly in the high-frequency pulsing current arc welding process with a very small duration time within the fluid dynamics level, so the theory of electromagnetic-induced string is not appropriate for describing flow dynamics in high-frequency arc welding process. This also indicates that we could treat the surface as a fixed flat surface in the HCAW process, and the Marangoni effect is predominant in the flow dynamics of molten pools in HCAW.

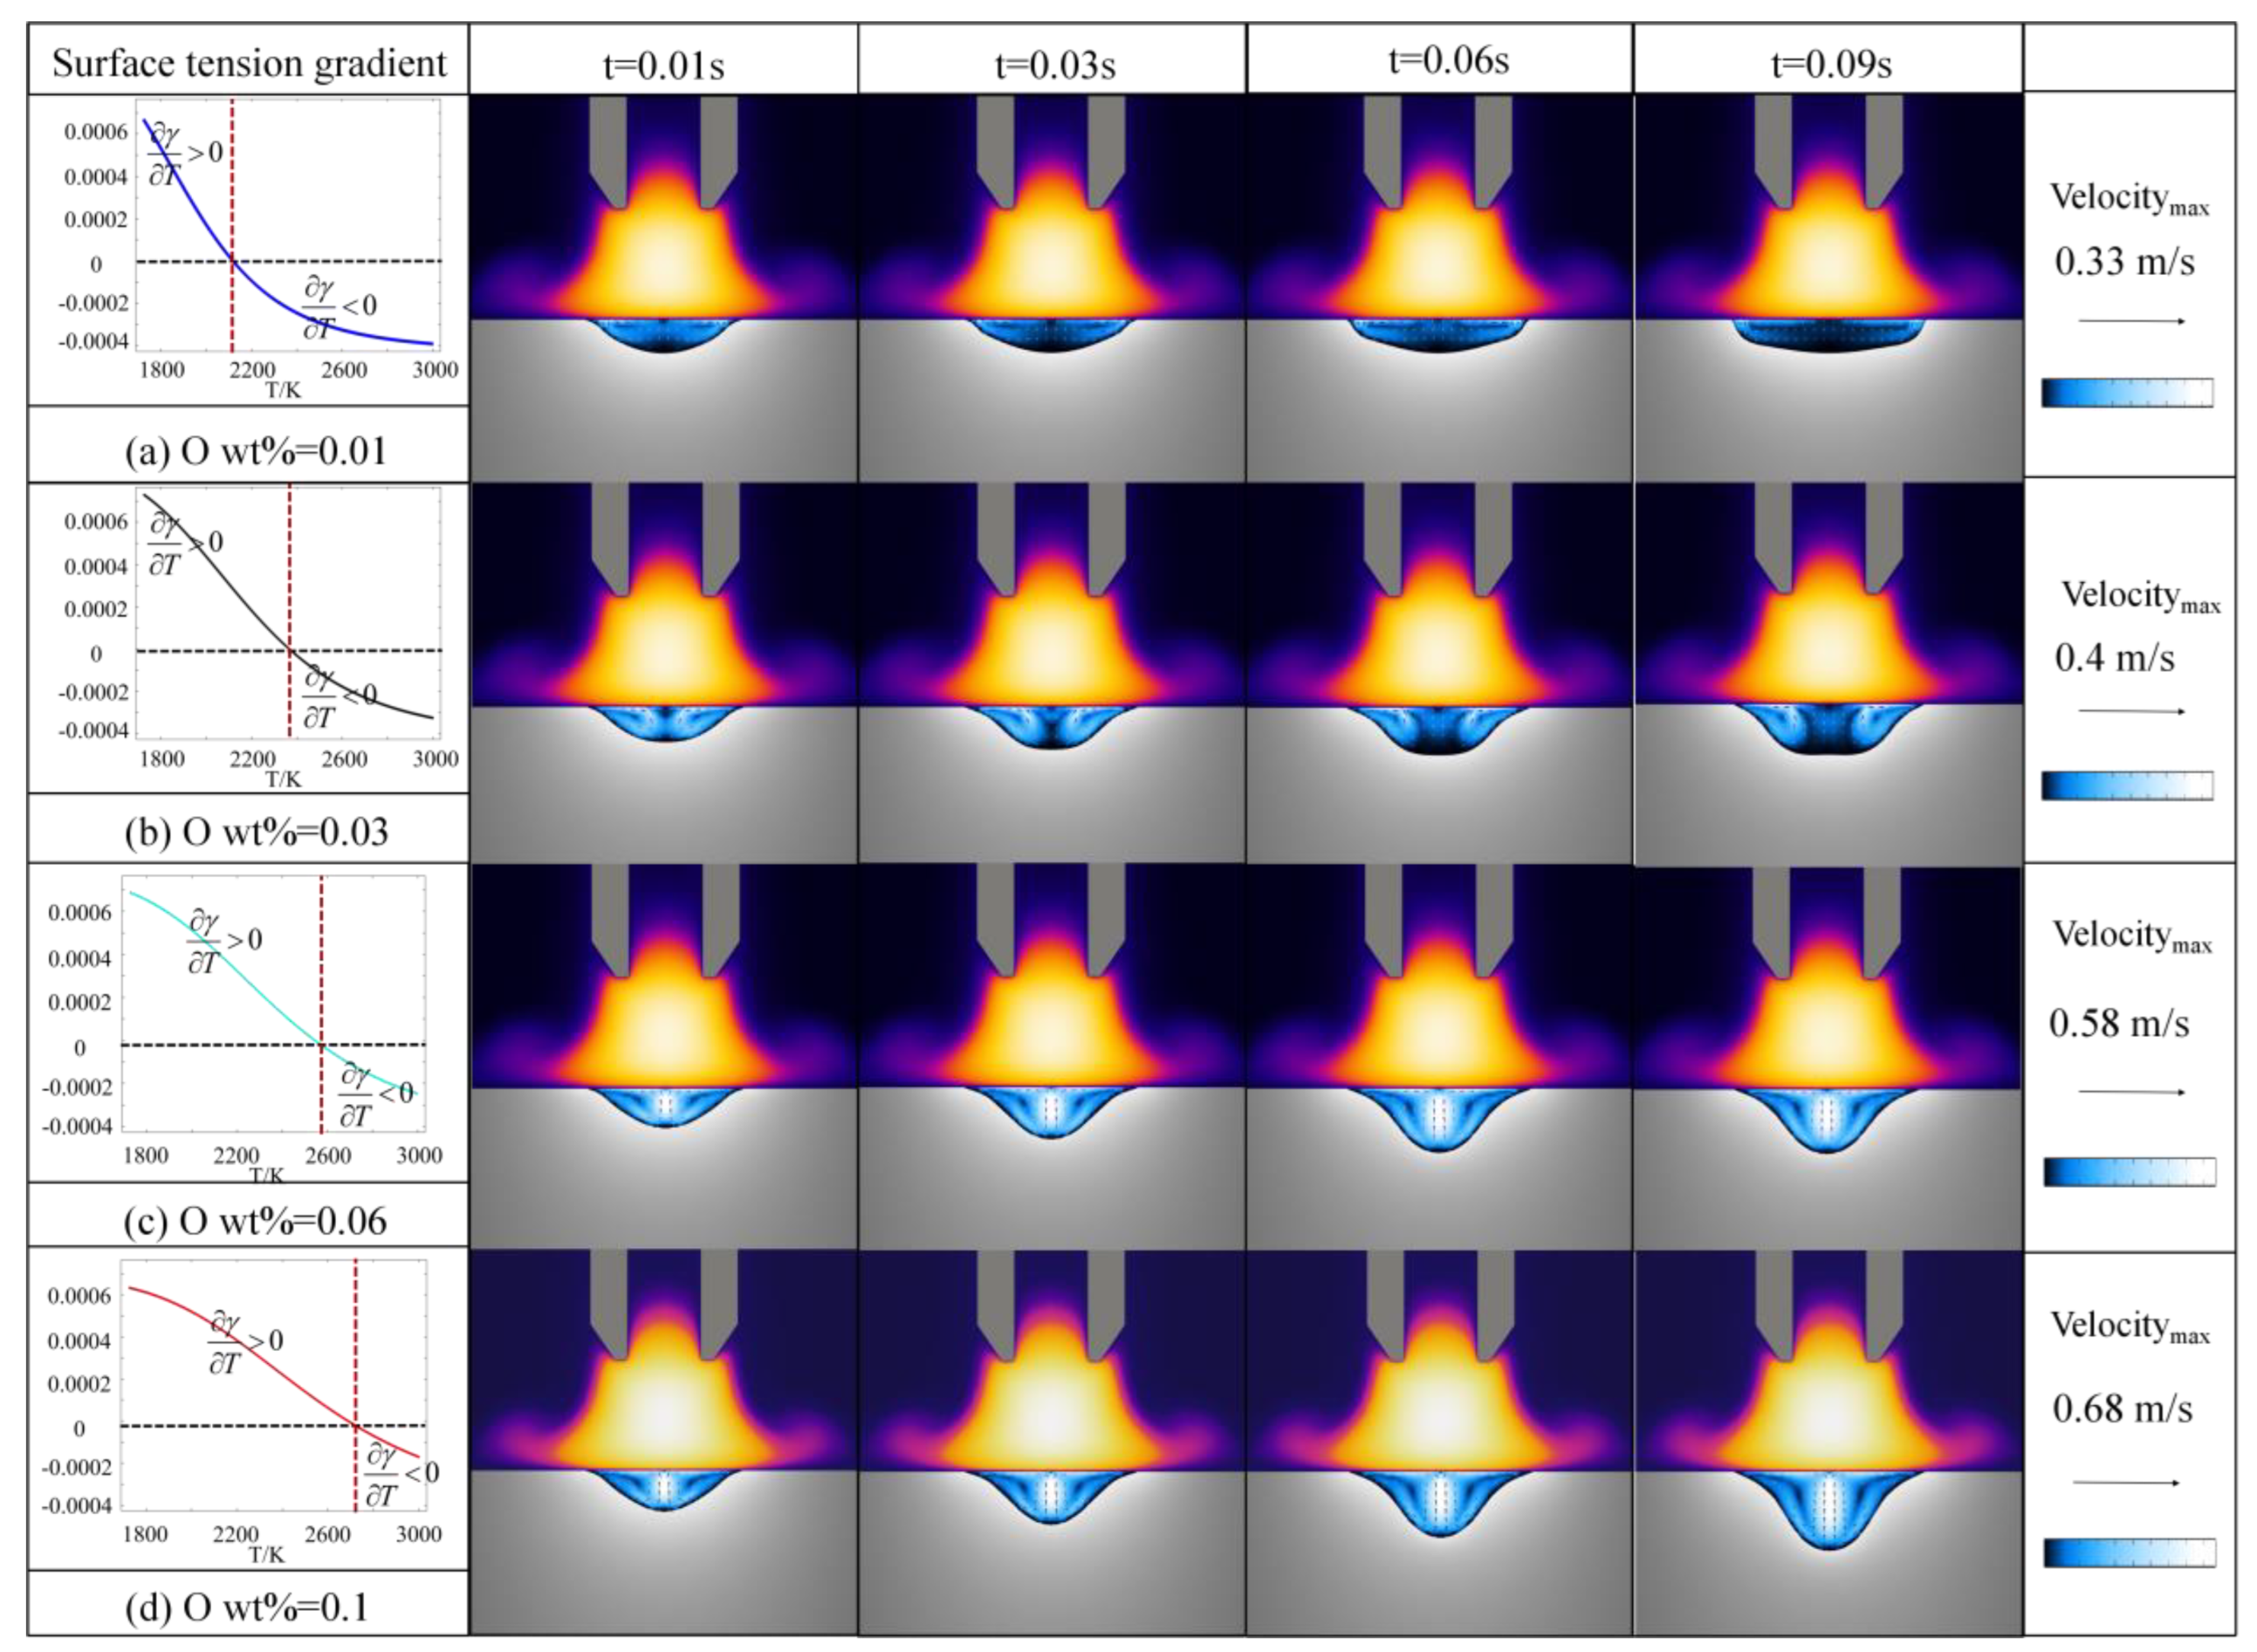
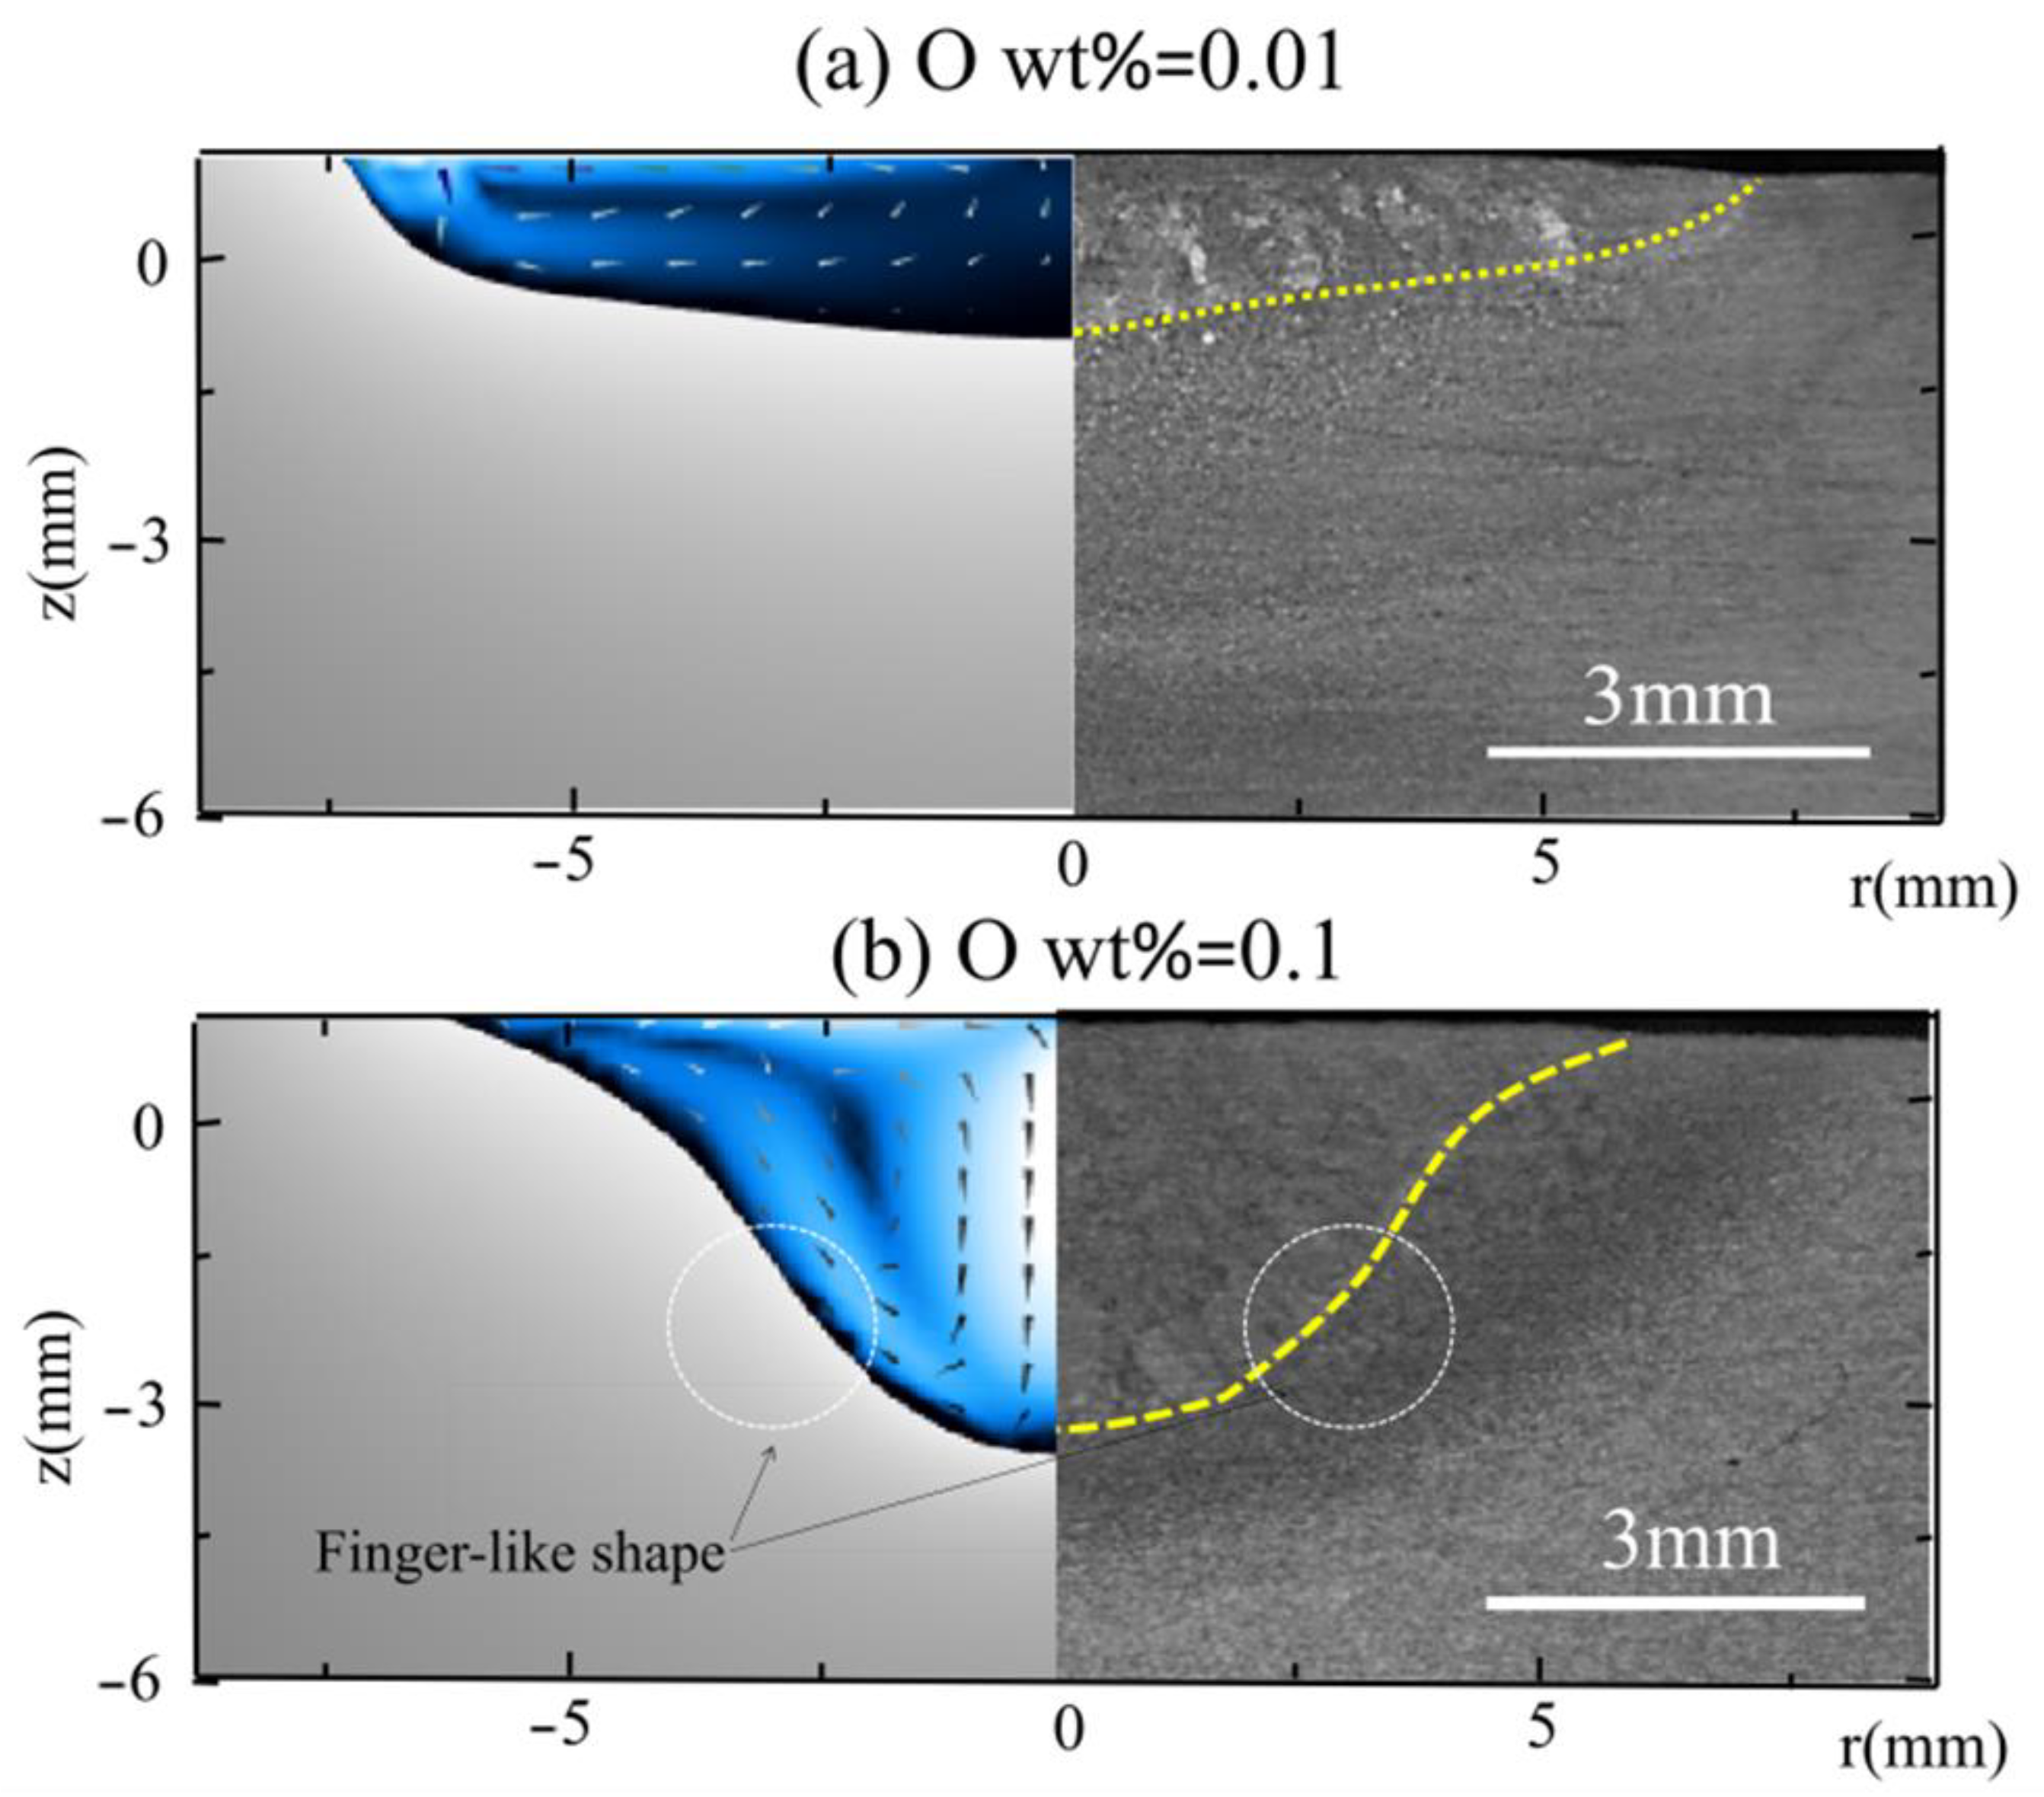
4.3. Influence of Oxygen Content on the Molten Pool Dynamics (t = 0–0.1 s, O2 wt% = 0.01~0.1)

As described in the previous section, the Marangoni effect dominated the dynamics of the molten pool in the HCAW process, so we assumed the surface tension gradient subjected to oxygen content was the main factor of weld pool dynamics with the mixture gas of O2. In this section, since our first priority is give a clear understanding of how oxygen content affects melt flow, we made a comparison by setting a group of parameters of oxygen content from 0.01 wt% to 0.1 wt%. The evolution of the molten pool from 0.01 s to 0.1 s with a DC square-pulsed current was studied. Since the oxygen content was relatively small compared to the Ar content, the influence of oxygen content on the arc plasma was not studied in this paper.
With the oxygen content of 0.01 wt% (see Figure 5a), the surface tension gradient subjected to oxygen content remained negative above the critical temperature (~2100 K), since the temperature was mainly above 2100 K in most regions of the molten pool. A shallow weld pool profile induced by an outward flow pattern could be observed for the γ T , which was negative in the molten pool. The velocity reached its maximum at the side of the melt pool surface. As the oxygen content increased to 0.03 wt% (see Figure 5b), the critical temperature was 2390 K, and two vortexes occurred at the same time in the weld pool. An inward flow vortex induced by positive γ T occurred at the edge of the melt pool. In contrast, another upward flow vortex was induced by negative γ T in the overheated region of the molten pool. The velocity reached its maximum (0.4 m/s) at the intersection point of two kinds of melt flows in the free surface, resulting in a finger-shape weld pool profile with a flat bottom.
While the oxygen content was 0.06 wt% (see Figure 5c), the critical temperature was approximately at 2590 K, and the surface tension gradient subjected to oxygen content was positive below 2590 K in most regions of the molten pool. We could observe a deep finger-like weld pool profile induced by the inward flow pattern for γ T , which was positive in the molten pool. The maximum velocity occurred in the center of the melt pool with a magnitude of 0.58 m/s. The case with oxygen content of 0.1 wt% (see Figure 5d) showed the same characteristics as the case with 0.06 wt%, except for a faster melt flow (0.68 m/s) and deeper penetration.
Now, we conclude that the flow dynamics of molten pools in HCAW are mainly determined by the Marangoni effect subjected to oxygen content, and other driving forces such as shear stress from the plasma jet, arc pressure, and Lorentz force could all be neglected in the case of hollow cathode arc welding with weakened electromagnetics. If we increase the oxygen content from 0.01 wt% to 0.1 wt%, there is a transition of internal flow patterns from upward–outward melt flow, resulting in a shallow weld pool, to inward–downward melt flow, resulting in a deep finger-like weld pool. The critical temperature of this transition increases with the oxygen content, indicating that we could promote penetration by increasing O2 content in HCAW.

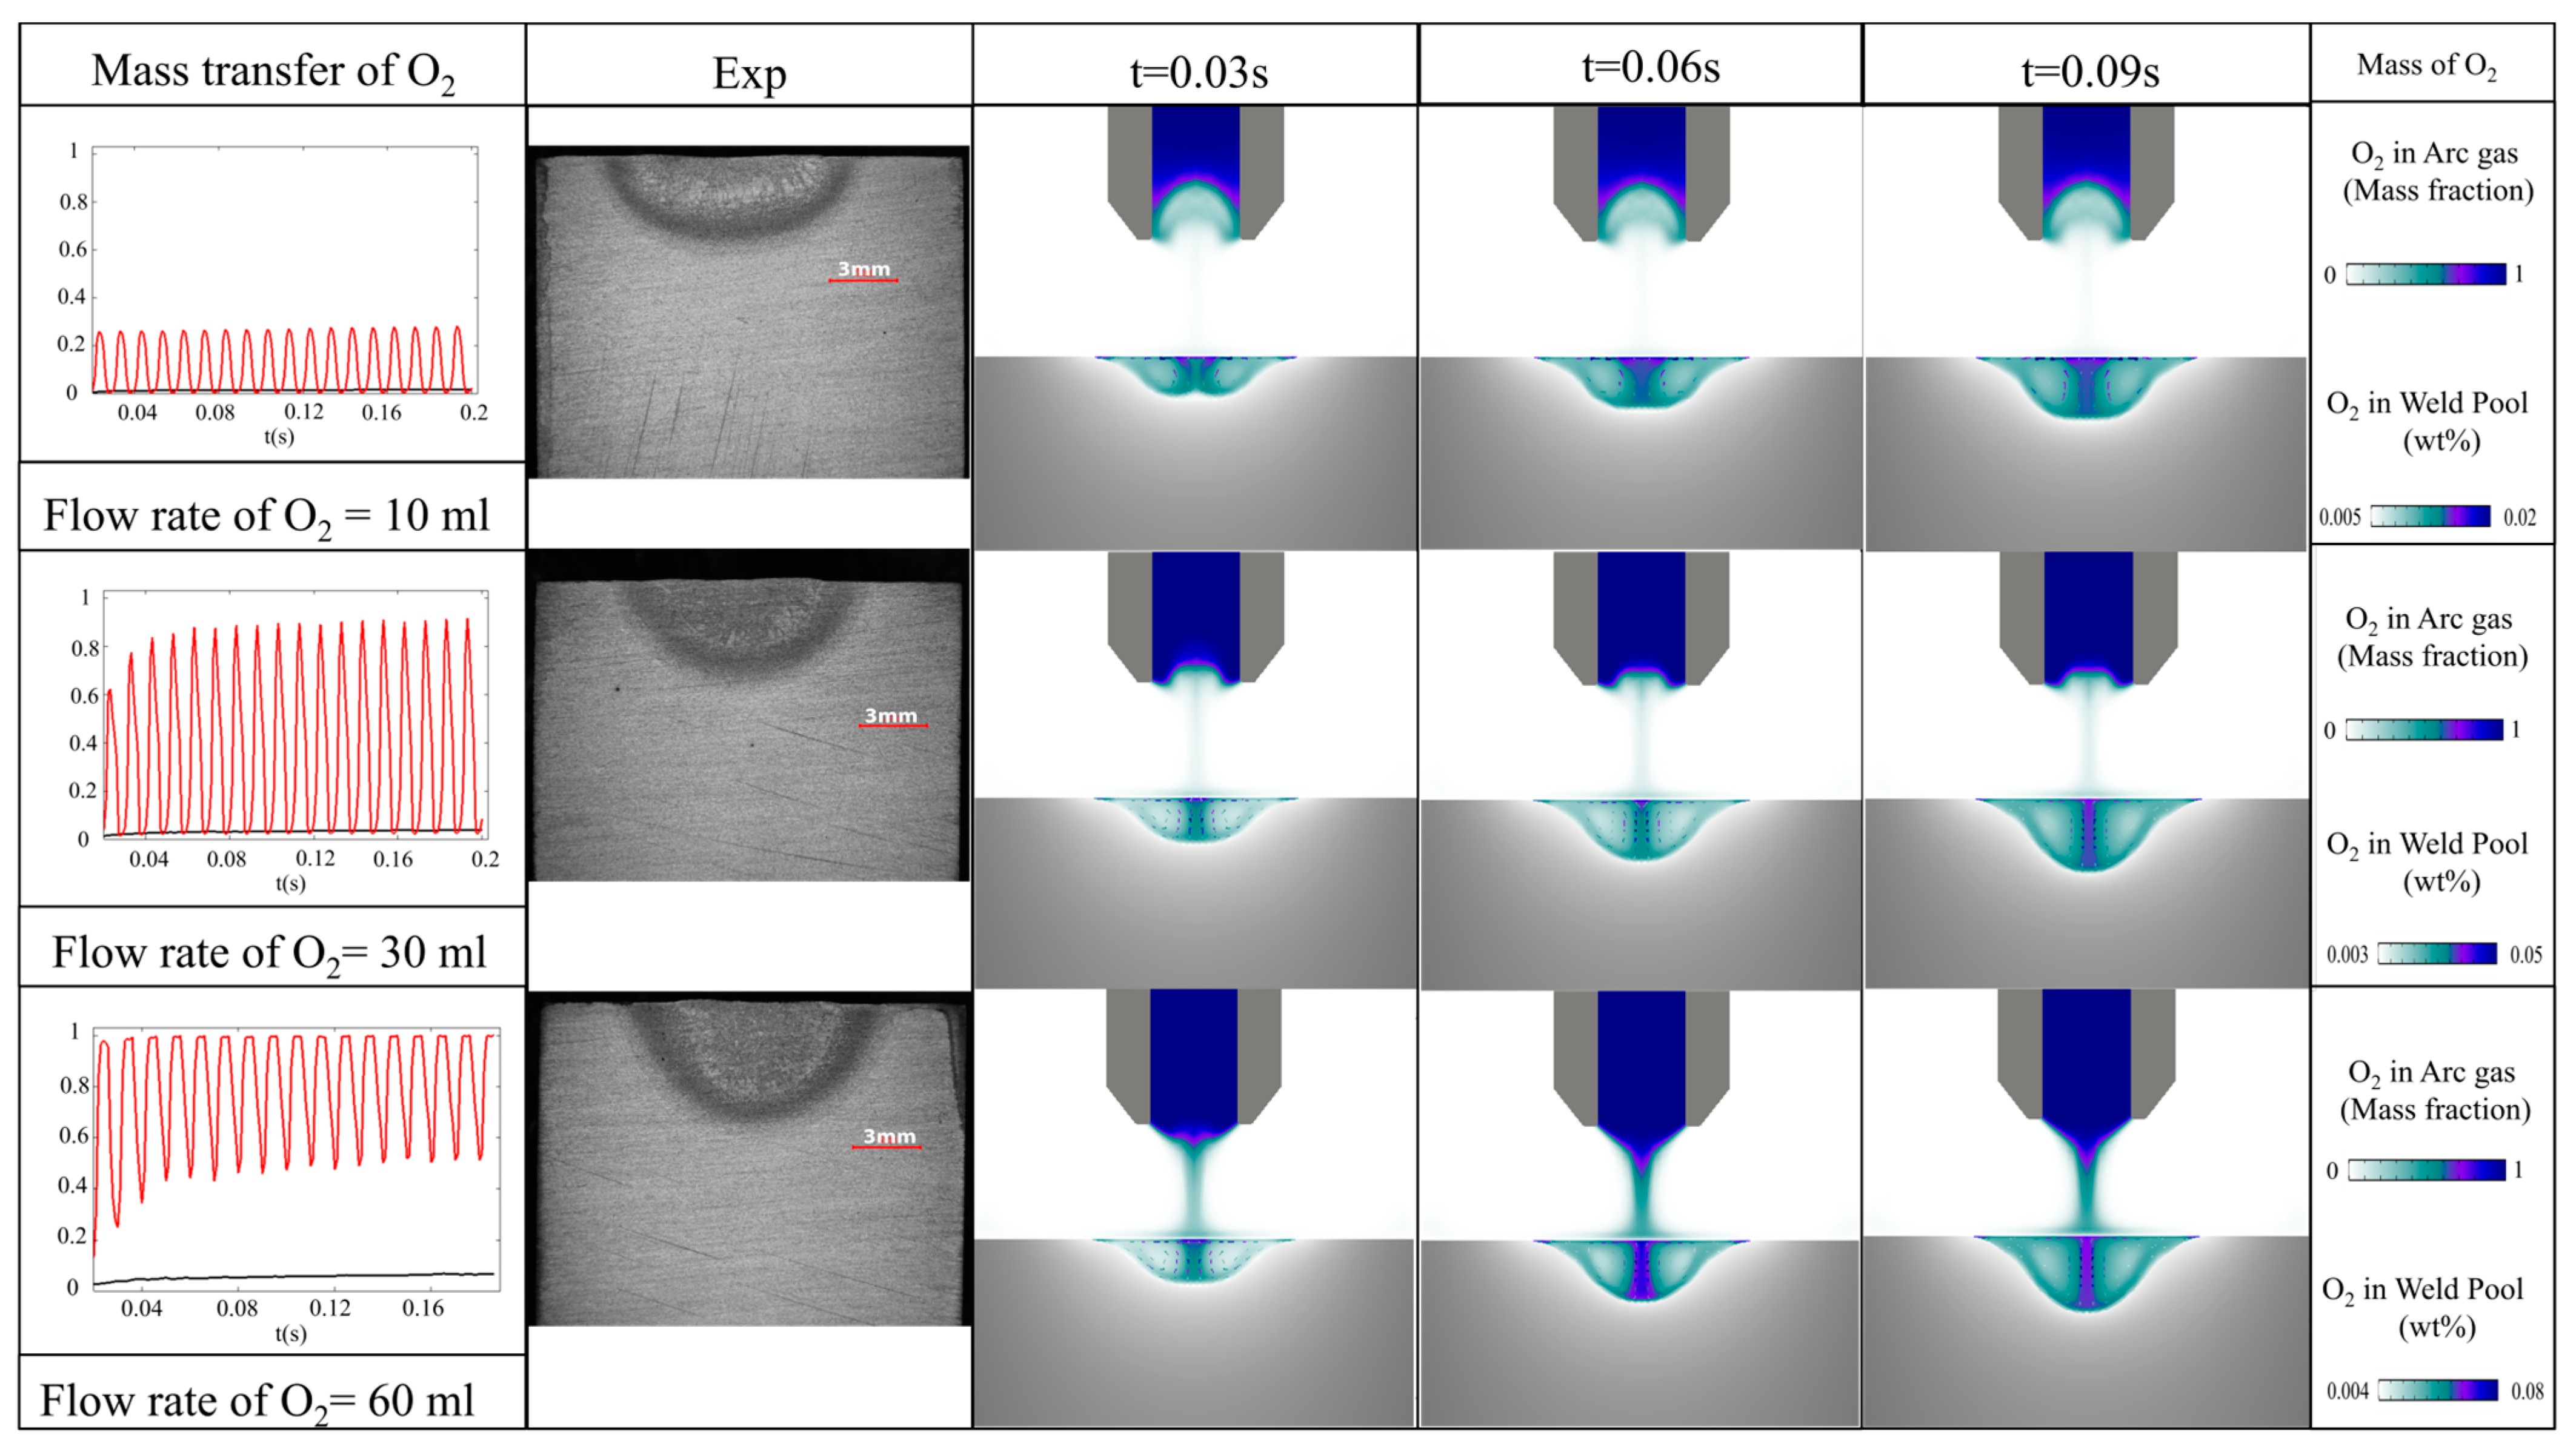
4.4. Mass Transfer of Oxygen in Arc Plasma and Melt Pool (t = 0–0.1 s, Flow Rate O2 = 0.01 L~0.06 L)

In the previous section, we proved that the surface tension gradient subjected to constant oxygen content is the main factor in weld pool dynamics; however, in reality, oxygen transfers from a hollow cathode to the weld pool with a transient varying content, and both the dynamics of arc plasma and melt pool are affected by the composition of O2. We proposed a fully coupled model of the mass transfer of oxygen and MHD dynamics of arc plasma and weld pools to investigate the interactions between oxygen, arc plasma, and weld pools. We made a comparison by setting a group of parameters of oxygen gas flow from 10 mL/s to 60 mL/s. The evolution of the concentration of O2 in the arc plasma and molten pool from 0.01 s to 0.1 s with a DC square-pulsed current was studied. Due to the limitation of length, the influence of oxygen content on arc plasma was considered but not discussed in this paper.
With the oxygen flow rate of 10 mL (see Figure 6), an inward flow pattern could be observed with the surface tension gradient subjected to oxygen transfer and constant sulfur content of 0.03. The concentration of O2 experienced a fluctuation with a maximum of 0.22 at point A of the arc column, while the concentration of O2 remained stable at 0.02 wt% at point B of the weld pool; as the time passed from 0.01 s to 0.09 s, the penetration of the melt pool increased with a slight rise in O2 content in the middle of the melt pool. As the flow rate of O2 increased from 10 mL to 60 mL, we could see that the concentration of the oxygen increased significantly from 0.22 to a maximum of 1 in the arc plasma; in other words, the arc plasma of the mixture gas was completely filled with O2. In the meantime, more O2 was transferred from the arc plasma to the melt pool with an increase from 0.02 wt% to 0.08 wt%, correspondingly, and deeper penetration.
We can conclude that the influence of the gas flow rate of O2 on the dynamics of melt pools could be attributed to the Marangoni effect subjected to the mass transfer process of oxygen; an increase in flow rate of O2 leads to a rise in the concentration of O2 both in the arc plasma and melt pool, finally resulting in a deeper penetration of the weld joint, so we could promote penetration by increasing the flow rate of O2 in HCAW.

4.5. Experimental Validation

We could determine that the calculated arc behavior shows good agreement with the measured arc image in Figure 7; they both exhibited periodical expansion and contraction behavior synchronizing with pulsing frequency. Compared to our previous works, we could observe that the oscillating behavior of the molten pool was diminished in the case of 900 Hz compared to our works with low frequency (10 Hz).
Figure 8a,b show comparisons between our calculated weld profile (left) and the experimental results (right) with oxygen content of 0.01 wt% and 0.1 wt%; we can see that the calculated weld profile is in excellent agreement with the experimental results, and it could precisely predict the shallow–flat molten pool (0.01 wt%) and the finger-like shape with deep penetration (0.1 wt%), implying that our MHD model with a hollow cathode is effective for HCAW applications.

5. Conclusions

  • Compared to the solid cathode GTAW process, the hollow cathode leads to a less intensive arc flow and a more uniform temperature field in the arc plasma, and the intensity of electromagnetic fields is comparatively weakened by the design of a hollow cathode.
  • The momentum sources from plasma jets and Lorentz force could be neglected in the high-frequency pulsing current arc welding process; the Marangoni effect is predominant in the flow dynamics of molten pools in HCAW. The explanation of electromagnetic-induced string is not appropriate for describing flow dynamics in the high-frequency pulsed current arc welding process.
  • The flow dynamics of molten pools are sensitive to oxygen content in HCAW; as the oxygen content increases from 0.01 wt% to 0.1 wt%, there is a transition of internal flow patterns from upward–outward melt flow, resulting in a shallow weld pool, to inward–downward melt flow, resulting in a deep finger-like weld pool; we could promote penetration by increasing O2 content in HCAW.

Supplementary Materials

The following supporting information can be downloaded at: https://www.mdpi.com/article/10.3390/coatings14040382/s1, Equation S1: Governing equations.

Author Contributions

Y.Y.: led the analysis, designed the experimental system, analyzed the experimental data, and wrote the manuscript with input from all authors; B.D.: led the project, acquired funding, and reviewed the manuscript; J.H.: took part in the experiments and the data acquisition of arc images; Z.L. and Q.S.: assisted in designing the experiments and took part in data analysis; F.X., P.W. and D.W.: developed the mathematical model, performed the simulations, and processed visualized theoretical data. All authors have read and agreed to the published version of the manuscript.

Funding

This work was supported by Academician Program of China Academy of Mechanical Science Group Co., Ltd., NO: 202310110.

Institutional Review Board Statement

Not applicable.

Informed Consent Statement

Not applicable.

Data Availability Statement

The corresponding data in our study are available from the corresponding author on reasonable request.

Conflicts of Interest

Authors Yicheng Yang, Bing Du were employed by the company China Academy of Machinery Science and Technology Group Co., Ltd. Authors Zhen Lei, Fujia Xu, Qian Sun, and Pengyu Wei were employed by the company Harbin Welding Institute Limited Company. The remaining authors declare that the research was conducted in the absence of any commercial or financial relationships that could be construed as a potential conflict of interest.

References

  1. Nerovnyi, V.M.; Khakhalev, A.D. Hollow cathode arc discharge as an effective energy source for welding processes in vacuum. J. Phys. D Appl. Phys. 2008, 41, 035201. [Google Scholar] [CrossRef]
  2. Nishikawa, H.; Yoshida, K.; Maruyama, T.; Ohji, T.; Suita, Y.; Masubuchi, K. Gas hollow tungsten arc characteristics under simulated space environment. Sci. Technol. Weld. Join. 2013, 6, 12–16. [Google Scholar] [CrossRef]
  3. Shobako, S.; Ota, M.; Oji, T. Characteristics of an arc column in a hollow cathode arc. Weld. Int. 2006, 20, 111–115. [Google Scholar] [CrossRef]
  4. Cho, D.W.; Lee, S.H.; Na, S.J. Characterization of welding arc and weld pool formation in vacuum gas hollow tungsten arc welding. J. Mater. Process. Technol. 2013, 213, 143–152. [Google Scholar] [CrossRef]
  5. Nishikawa, H.; Shobako, S.; Ohta, M.; Ohji, T. Heat input properties of hollow cathode arc as a welding heat source. J. Phys. D Appl. Phys. 2005, 38, 3451–3456. [Google Scholar] [CrossRef]
  6. Chen, S.; Yan, Z.; Jiang, F.; Lu, Z. The pressure distribution of hollow cathode centered negative pressure arc. J. Manuf. Process. 2016, 23, 21–28. [Google Scholar] [CrossRef]
  7. Jiang, F.; Yan, Z.; Chen, S.; Lu, Z. The energy distribution of electrode in hollow cathode centered negative pressure arc. J. Manuf. Process. 2016, 24, 138–144. [Google Scholar] [CrossRef]
  8. Tashiro, S.; Tanaka, M.; Nakatani, M.; Tani, K.; Furubayashi, M. Numerical analysis of energy source properties of hollow cathode arc. Surf. Coat. Technol. 2007, 201, 5431–5434. [Google Scholar] [CrossRef]
  9. Saifutdinov, A.I.; Timerkaev, B.A.; Ibragimov, A.R. Numerical Simulation of Temperature Fields in a Direct-Current Plasma Torch. Tech. Phys. Lett. 2018, 44, 164–166. [Google Scholar]
  10. Baeva, M.; Zhu, T.; Kewitz, T.; Testrich, H.; Foest, R. Self-Consistent Cathode-Plasma Coupling and Role of the Fluid Flow Approach in Torch Modeling. J. Therm. Spray Technol. 2021, 30, 1737–1750. [Google Scholar] [CrossRef]
  11. Lidsky, L.M.; Rothleder, S.D.; Rose, D.J.; Yoshikawa, S.; Michelson, C.; Mackin, R.J., Jr. Highly Ionized Hollow Cathode Discharge. J. Appl. Phys. 1962, 33, 2490–2497. [Google Scholar] [CrossRef]
  12. Limmaneevichitr, C.; Kou, S. Visualization of Marangoni convection in simulated weld pools containing a surface-active agent. Weld. J. 2000, 79, 324–330. [Google Scholar]
  13. Aucott, L.; Dong, H.; Mirihanage, W.; Atwood, R.; Kidess, A.; Gao, S.; Wen, S.; Marsden, J.; Feng, S.; Tong, M.; et al. Revealing internal flow behaviour in arc welding and additive manufacturing of metals. Nat. Commun. 2018, 9, 5414. [Google Scholar] [CrossRef] [PubMed]
  14. Mills, K.C.; Keene, B.J.; Brooks, R.F.; Shirali, A. Marangoni effects in welding. Philos. Trans. A Math. Phys. Eng. Sci. 1998, 356, 911–925. [Google Scholar] [CrossRef]
  15. Sahoo, P.; DebRoy, T.; McNallan, M.T. Surface tension of binary metal surface active solute systems under conditions relevant to welding metallurgy. Metall. Trans. B 1988, 19B, 483–491. [Google Scholar] [CrossRef]
  16. Mishra, S.; Lienert, T.J.; Johnson, M.Q.; DebRoy, T. An experimental and theoretical study of gas tungsten arc welding of stainless steel plates with different sulfur concentrations. Acta Mater. 2008, 56, 2133–2146. [Google Scholar] [CrossRef]
  17. Ko, S.H.; Choi, S.K.; Yoo, C.D. Effects of surface depression on pool convection and geometry in stationary GTAW. Weld. J. 2001, 80, 39–45. [Google Scholar]
  18. Savage, W.F.; Nippes, E.F.; Agusa, K. Effect of arc force on defect formation in GTA welding. Weld. J. 1979, 58, s212–s224. [Google Scholar]
  19. Kim, W.H.; Na, S.J.; Fan, H.G. Effect of various driving forces on heat and mass transfer in arc welding. Numer. Heat Transf. Part A Appl. 1997, 32, 633–652. [Google Scholar] [CrossRef]
  20. Wang, D.; Lu, H. Numerical analysis of internal flow of molten pool in pulsed gas tungsten arc welding using a fully coupled model with free surface. Int. J. Heat Mass Transf. 2021, 165, 120572. [Google Scholar] [CrossRef]
  21. Wang, D.; Wang, Y.; Liu, W.; Hua, C.; Yu, C.; Lu, H. Multiscale investigation of microstructure optimization in the arc additive manufacturing and arc welding by self-induced ultrasound. Int. J. Heat Mass Transf. 2021, 180, 121790. [Google Scholar] [CrossRef]
Figure 1. (a) Geometry with boundary conditions, (b) initial conditions, and (c) mesh setting near the tip of the hollow cathode.
Coatings 14 00382 g001
Figure 2. The mechanism and the experimental system of hollow cathode arc welding (HCAW).
Coatings 14 00382 g002
Figure 3. Electric potential (a), magnetic flux density (b), Lorentz force (c), pressure (d), velocity (e), and temperature (f) with 900 kHz and O2 wt% = 0.1 at peak current of 200 A.
Coatings 14 00382 g003
Figure 4. The flow dynamics of arc plasma and weld pool within one and nine thermal circles in the hollow cathode (point A) and in the weld pool (point B) (a), flow dynamics within one thermal circle (b), magnetic flux density in nine thermal circles (c), temperature in nine thermal circles, and (d) velocity in nine thermal circles.
Coatings 14 00382 g004
Figure 5. Surface tension gradient ( γ / T ) subjected to oxygen content of Q235 low-carbon steel and evolution of melt pool profile within ninety thermal circles at peak current. (a) O wt% = 0.01; (b) O wt% = 0.03; (c) O wt% = 0.06; (d) O wt% = 0.1.
Coatings 14 00382 g005
Figure 6. Evolution of oxygen content in the mixture arc gas and weld pool of Q235 low-carbon steel within ninety thermal circles at peak current.
Coatings 14 00382 g006
Figure 7. Comparison of computed arc behavior with experimental results.
Coatings 14 00382 g007
Figure 8. Comparison between calculated weld pool profile and experimental results. (a) O wt% = 0.01; (b) O wt% = 0.1.
Coatings 14 00382 g008
Table 1. Material properties and welding parameters.
SymbolNomenclatureValueUnit
I0Continuous current400A
IePulsed current200A
fFrequency900HZ
T0Temperature300K
UgasGas inflow rate15L/min
ρl(T)/ρAr(T)/ρO2(T)Density of liquid/Ar/O27015~6712/1.7~0.008/0.78~0.004kg/m3
kl(T)/kAr(T)/kO2(T)Thermal conductivity of liquid/Ar/O246~5/5~0.1/4.9~0.04W/(m·K)
σl(T)/σAr(T)/σO2(T)Electrical conductivity of liquid/Ar/O26.77 × 105~6.27 × 10⁵/1 × 104~1/1.4 × 104~0S/m
μ(T)/μAr(T)/μO2(T)Viscosity of liquid/Ar/O2(5.8~4.7) × 10−3/(2.5~1.2) × 10−5/(29~3) × 10−5Pa·s
Cpl/CAr/CO2Specific enthalpy of liquid/Ar/O2475/824/8000~800J/(kg·K)
LfLatent heat of fusion2.54 × 105J/kg
αoActivity of oxygen 0.01~0.1wt%
AγConstant in surface tension gradient4.3 × 10−4N/(m·K)
RgGas constant8314.3J/(kg·mol)
ΔH0Standard heat of absorption−1.46 × 10⁸J
tTotal time of heating duration0.1S
NpNumber of thermal circles90kg/m3
σt(T)Electrical conductivity of tungsten cathode4.8 × 107~1 × 10⁶S/m
CtSpecific enthalpy of tungsten cathode130~290Pa·s
ksThermal conductivity of solid steel44.5J/(kg·K)
Table 2. Boundary conditions for modeling in the HCAW process.
Boundary
(Surface)
v T V A
B (Current inlet)~ T = T 0 j n = j 0 + j e e i ω t A n = 0
A1 (O2 inlet) v n = U O 2 T = T 0 j n = 0 A n = 0
A2 (Ar inlet) v n = U Ar T = T 0 j n = 0 A n = 0
C (Interface) v = 0 j e = j r i f ( j n j r ) > 0 j n i f ( j n j r ) 0 j i = j n j e n k T = j i V i j e φ c ε k B T 4 j A n = 0
E (Interface) v n k T = j n φ a ε k B T 4 j A n = 0
D (Outlet) n τ n = 0 T = T 0 j n = 0 A n = 0
F (Ground)~ T = T 0 V = 0 A n = 0
Disclaimer/Publisher’s Note: The statements, opinions and data contained in all publications are solely those of the individual author(s) and contributor(s) and not of MDPI and/or the editor(s). MDPI and/or the editor(s) disclaim responsibility for any injury to people or property resulting from any ideas, methods, instructions or products referred to in the content.

