Abstract
X-ray photoelectron spectroscopy (XPS) and angle-resolved XPS (ARXPS) characterization of surface layers resulting from the functionalization of polymers such as polyvinylchloride (PVC) modified with 3(mercaptopropyl)-trimethoxysilane (MPTMS) and (3-aminopropyl) triethoxysilane (APTES) is challenging due to the overlap in signals, deriving both from the substrate and the functionalized layers. In this work, a freshly cleaved, ideally flat gold surface was used as carbon-free model substrate functionalized with MPTMS and subsequently grafted with APTES. Avoiding the overlap of signals from carbon atoms present in the substrate, the signals in the C1s, O1s, Si2p, S2p and N1s high-resolution spectra could be assigned to the MPTMS/APTES functionalized layer only and the curve-fitting parameters could be determined. Quantitative analysis was in very good agreement with the expected stoichiometry of the functionalized layer, confirming the adopted curve-fitting procedure. In addition, it was found that one molecule of APTES grafted two MPTMS via silane groups. ARXPS allowed for determining the thickness of the functionalized layers: MPTMS thickness was found to be 0.5 (0.2) nm, whereas MPTMS + APTES thickness 1.0 (0.2) nm was in good agreement with Avogadro model calculations. This approach can be considered a powerful tool for characterizing functionalized surfaces of more complex systems by XPS.
1. Introduction
By modifying the surface of the material, it is possible to achieve tailor-made properties different from those in the bulk, thereby opening new perspectives for scientific and technological applications. One way to achieve surface functionalization is the formation of self-assembled monolayers (SAMs) that can be defined as the arrangement of molecules adsorbed onto a solid surface that can aggregate spontaneously from the solution or gas phase [1,2]. SAMs are versatile systems that have been applied in the surface modification of a variety of materials such as metals and polymers. Due to this versatility SAMs can be exploited for different applications ranging from UV-lithography [3] to the production of antimicrobial polymers [4]. Historically gold has been used as substrate for growing thin layers such as SAMs on its surface with organic thiols. In fact, organosulfur compounds such as thiols, disulfides and sulfides can react with a gold substrate by spontaneous adsorption either from liquid or from the vapor phase forming SAMs [5]. Among the organosulfur compounds, 3(mercaptopropyl)-trimethoxysilane (MPTMS) is widely used in the surface modification of gold surfaces due to the presence of thiol groups that can strongly bind to the gold surface [6,7]. The formation of SAMs by immersion of the substrate into a dilute ethanolic solution of thiols is time-dependent and requires 12–18 h of immersion for obtaining a well-organized SAMs [5]. Reduced immersion time may lead to the formation of a weak interaction between sulphur atoms of the thiols onto the gold surface, such as dithiolate [8,9,10]. Moreover, thiols in ambient conditions and in presence of water may react forming disulfides that can physiosorbed onto the sulphur substrate [11]. Another molecule that was used to functionalize silicon-based substrates is (3-aminopropyl)triethoxysilane (APTES) due to the presence of the Si-OEt group. An example of APTES monolayer on gold has been reported by Yang et al. [12]; in that work, the surface of a gold electrode was firstly modified with potassium hydroxide (KOH) in order to have a hydroxyl-activated gold surface, thus allowing the subsequent anchoring of APTES monolayer through the reaction of -OH groups at the surface of gold with Si-OEt groups. No characterization of the surface by XPS was reported. MPTMS and APTES can also be used together to form a multi-layered system through the reaction of the Si-O groups that are present in both the molecules. The reaction between MPTMS and APTES has been proposed for the functionalization of polymers [4,13] as intermediate stage for the surface functionalization of medical-grade PVC to confer antimicrobial property, but no examples of this functionalization are reported in the literature for gold that can be considered an excellent model system for validating the characterization approach based on surface analytical techniques. X-ray photoelectron spectroscopy (XPS) is a powerful analytical tool that is exploited for the characterization of thin layers since it is a surface-sensitive method and allows obtaining in-depth compositional information on layers with a thickness ranging from 0.5 nm to 10 nm [14] depending on the kinetic energy of the photoemitted electrons and the photoelectron inelastic mean free path (λ, IMFP) in [15,16], and on the material and on the emission angle. Angle-resolved XPS (ARXPS) can be successfully used for the characterization of thin layers such as SAMs [17] since the determination of the in-depth distribution and of the thickness of monolayers through the application of various approaches [18,19]. Many examples of gold surfaces functionalization with thiols are reported in the literature [1,20,21] for different applications; some examples of gold surfaces functionalized with MPTMS are reported even if XPS was not exploited in this investigation [7]. On the other hand, XPS results on MPTMS reacted with a glass surface were reported by Penna et al. [22]. Graf et al. [23] applied XPS to APTES monolayers onto a silicon surface and proposed a few possible arrangements of this molecule based on the XPS results. While the literature abounds with examples of surface modification involving MPTMS or APTES investigated by XPS, no papers report the use of XPS and ARXPS for a comprehensive characterization of the overlayer made of MPTMS on gold and further grafted with APTES.
In this paper, the overlayer formed by MPTMS on gold, subsequently grafted with APTES, is investigated by XPS and ARXPS to gain an insight into the spatial arrangement, thickness, and composition of the functionalization layer on gold surfaces. Furthermore, XPS and ARXPS characterization of this model system allows the determination of the curve-fitting parameters for the C 1s signal but also for the other functional groups of the functionalization layer. This is crucial for the development of an analytical strategy and an important reference for whom might be involved in the XPS characterization of more complex system such as polymers functionalized with the same protocol, allowing the identification and the clear distinction of the components of C 1s signal that belong to the functionalization layer from those of the polymer substrate. Additionally, the spatial distribution of the different functional groups and the thickness of the overlayer will be investigated by ARXPS [18,24]. This information might allow ascertaining the possible three-dimensional arrangements of the functionalization layer and the investigation of the formation of a three-dimensional cross-linking of the silanes as proposed in [25] on the basis of FTIR investigation. Finally, another aim of the present investigation is to provide evidence of the formation of a single layer of APTES after its grafting to MPTMS.
2. Experimental
2.1. Materials
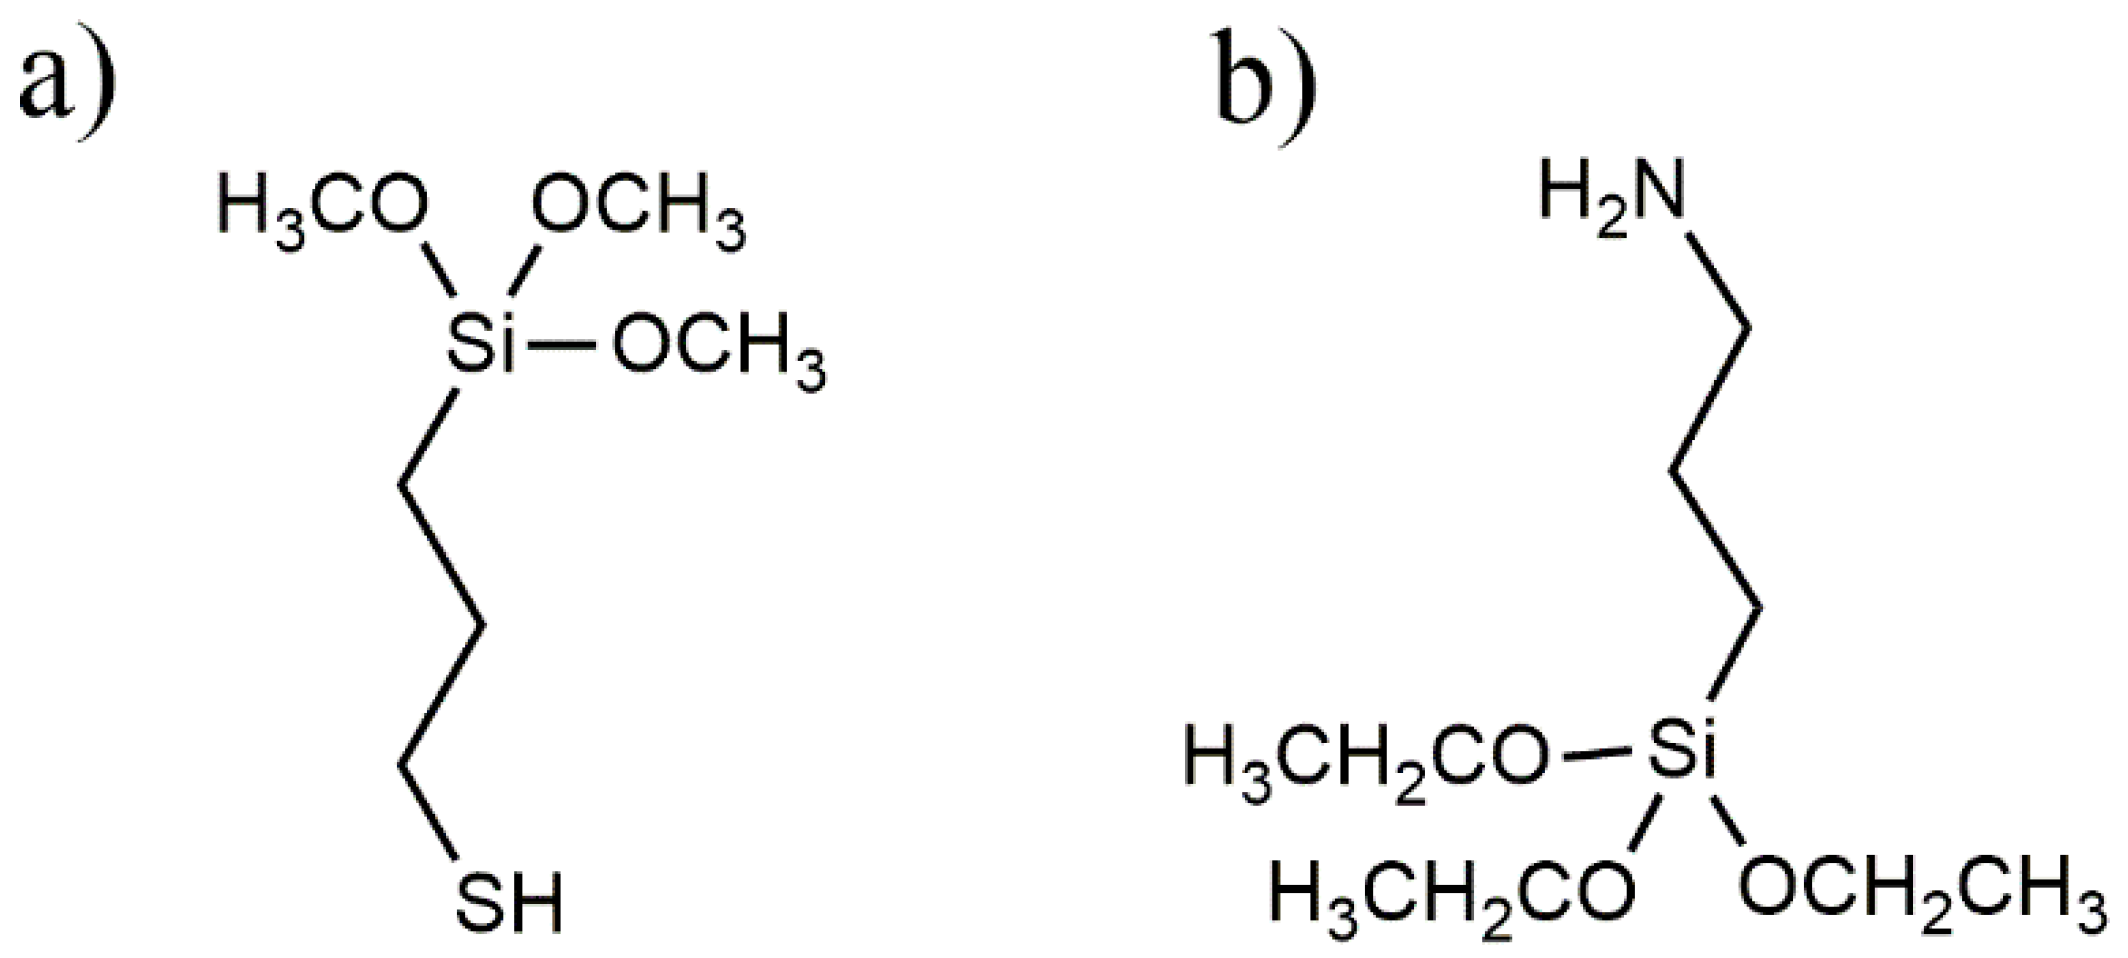
(3-mercaptopropyl) trimethoxysilane (MPTMS) and 96% ethanol were purchased from VWR (Milan, Italy) and used without further purification; (3-aminopropyl)triethoxysilane (APTES) was purchased from Sigma-Aldrich (Darmstadt, Germany). Both MPTMS and APTES are soluble in ethanol and insoluble in water. The chemical formulae of MPTMS and APTES are given in Figure 1.
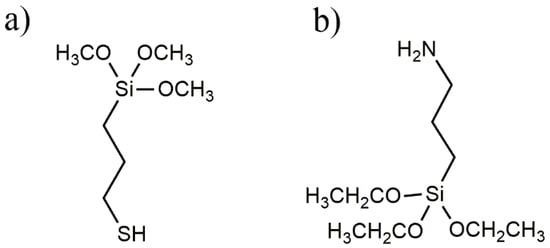
Figure 1.
(3-mercaptopropyl) trimethoxysilane (MPTMS) (a) and aminopropyltiethoxysilane (APTES) (b) molecular formulae.
Gold samples were provided by C. Passiu depositing 80 nm-thick gold films on silicon wafers through electron-beam evaporation following the procedure described in [26]. Template stripping was performed immediately before functionalization to minimize the presence of adsorbed carbon and oxygen species due to the contact with the atmosphere.
The roughness (Ra) of the gold samples was measured by atomic force microscopy (AFM) and resulted to be equal to 0.3 (0.1) nm [27].
2.2. MPTMS Functionalization
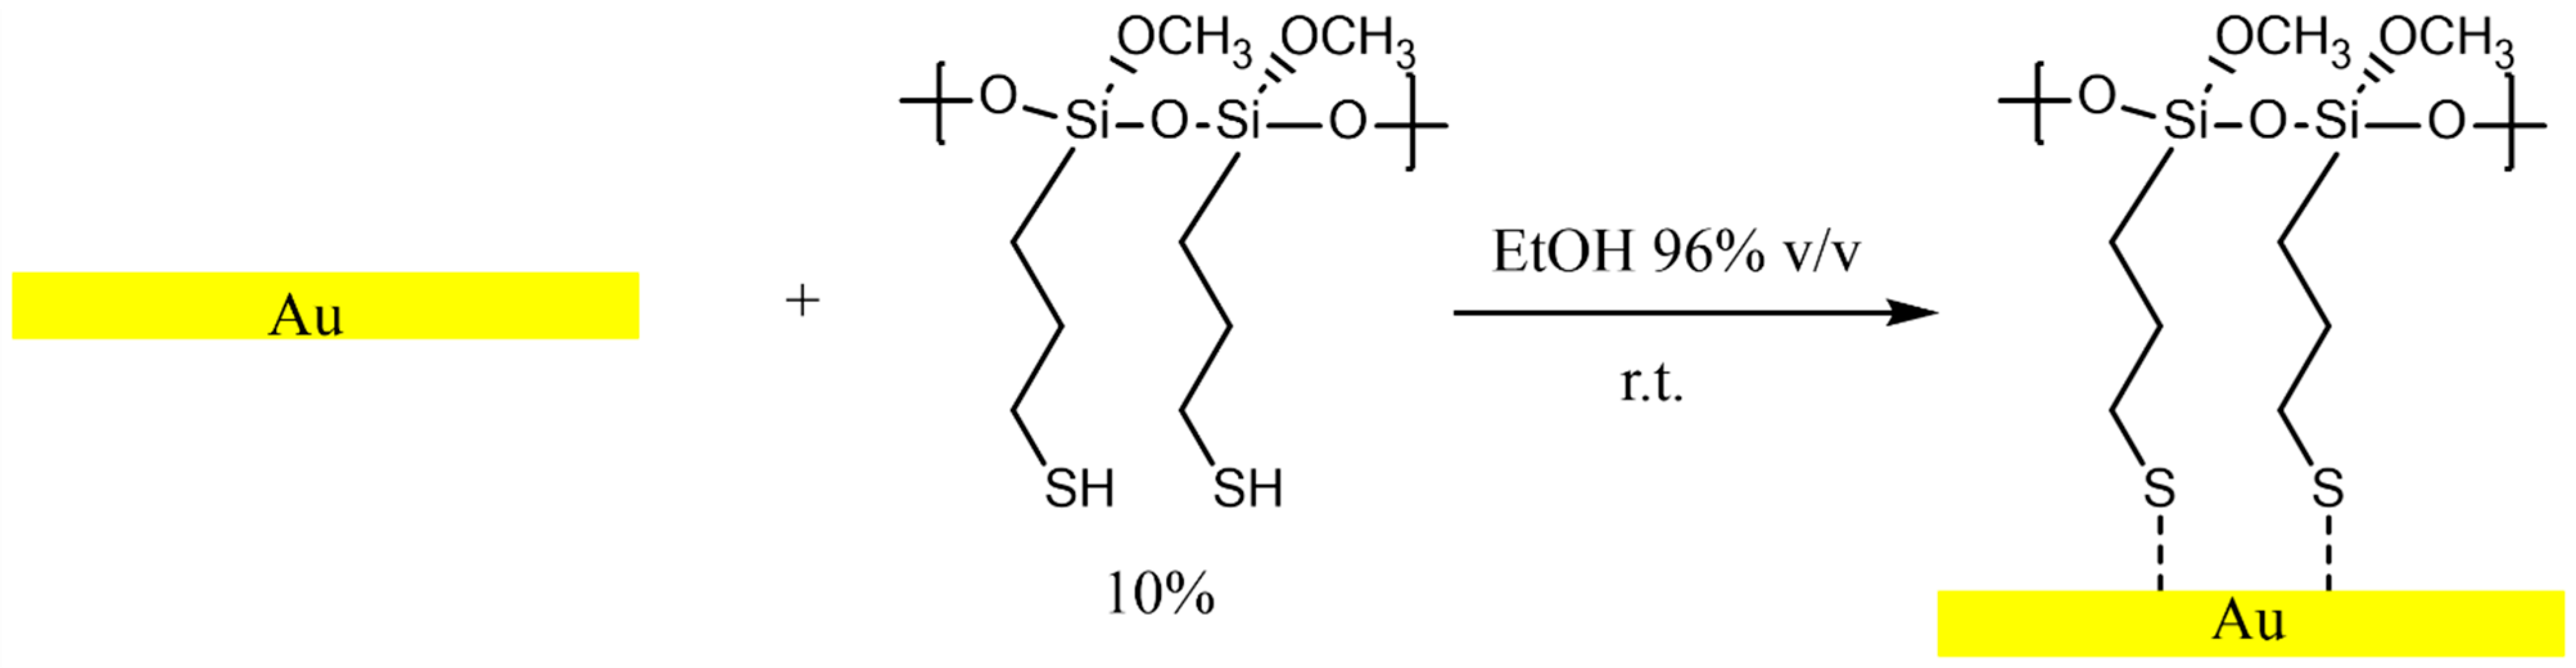
Fresh-cleaved gold samples were initially immersed in ethanol for one hour and then dipped into a 10% solution of MPTMS in ethanol for one hour to allow the reaction with MPTMS. This experimental condition is analogous to the one adopted for forming an MPTMS overlayer onto a food-grade PVC surface [28] and allows limiting the multilayer formation. The samples were then immersed again in ethanol for one hour after the functionalization. No visible change in the surface was observed. The gold samples functionalized with MPTMS are named M-Gold in the following sections, and the reaction scheme is shown in Figure 2.

Figure 2.
Reaction scheme of fresh-cleaved gold surface with MPTMS forming a monolayer on gold (M-Gold) performed at room temperature. The dashed bond indicates that the sulphur may be weakly bonded to the gold surface.
2.3. APTES Functionalization
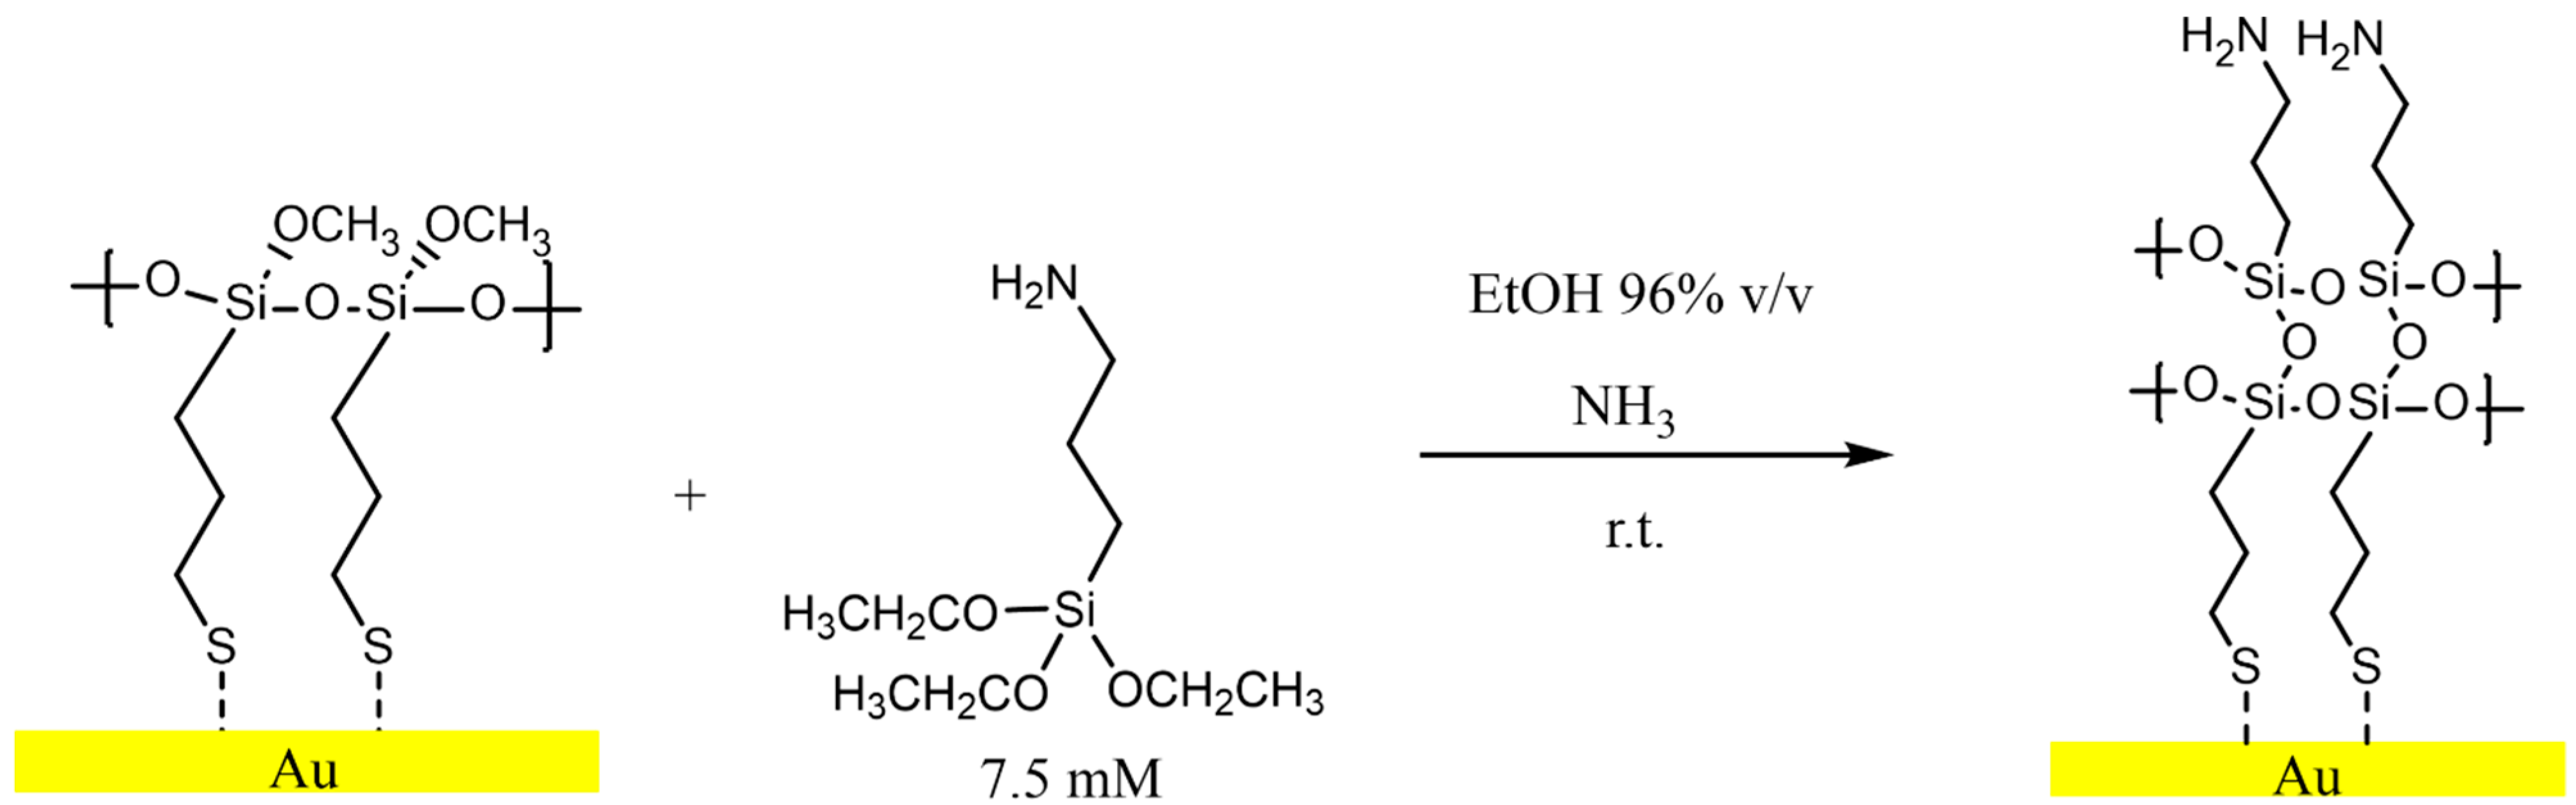
The M-gold samples were immersed in a solution of 7.5 mM of APTES in a mixture of ethanol 96% v/v and ammonia 20% v/v for 1 h (70% ethanol 20% of ammonia). The outward-facing Si-O groups in MPTMS on the M-Gold surface react with the Si-O groups present in APTES, allowing the grafting of APTES onto the M-Gold surface. The reaction scheme between M-Gold and APTES is reported in Figure 3. The final product was named A-Gold. Following the functionalization, A-Gold samples were immersed in ethanol for 1h to remove the non-grafted APTES. The samples were dried with an argon flux and were immediately transferred to the X-ray spectrophotometer.
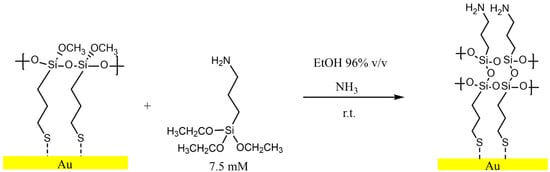
Figure 3.
Reaction scheme of M-Gold exposed to APTES 7.5 mM solution. The dashed bond indicates that the sulphur may be weakly bonded to the gold surface.
2.4. X-ray Photoelectron Spectroscopy (XPS) and Angle-Resolved X-ray Photoelectron Spectroscopy (AR-XPS)
The XPS measurements were carried out with a Theta Probe spectrometer (Thermo Fisher Scientific, East Grinstead, UK). The base pressure in the analysis chamber was 1 × 10⁻⁹ mbar or below, the pressure remained unchanged during the experiments, thus suggesting a good stability of the samples under vacuum. Only one sample was introduced in the analyzing chamber at a time to avoid sample cross-contamination. No charge neutralization was required during the acquisition of the spectra. The spectra were collected using a monochromatic Al-Kα1,2 source (hν = 1486.6 eV) selecting a nominal 400 μm spot size with a power of 100 W. All spectra were acquired in the fixed analyzer transmission (FAT) mode and the pass energy (PE) was set at 200 eV for the survey spectra and at 150 eV for the high-resolution ones and a step size of 0.1 eV. Acquisition time for the survey spectra was 10 min and for the high-resolution spectra was in total equal to 30 min. These conditions allowed obtaining a good signal-to-noise ratio in a minimum time to limit sample damage induced by the X-ray beam. A periodic calibration following ISO 15472:2010 [29] was performed to verify the linearity of the binding energy scale. The Au 4f7/2 was used as internal reference at 83.97 eV, and in these conditions the FWHM at the peak height was found to be 1.2 (0.1) eV. The energy resolution measured on the Ag3d5/2 signal at 368.20 eV was 1.27 eV in these conditions. The high-resolution spectra were resolved into their components after background subtraction using the iterative U3-Tougaard model [30].
The apparent composition in at% was calculated using the peak areas (intensities) of the high resolution spectra following the curve-fitting procedure and corrected for relative sensitivity factors that take into account the Scofield’s photoionization cross section [31], the asymmetry factor [31], the intensity/energy response function [32] and the inelastic mean free path [33]; a table with the parameters is provided in the Supplementary Material (Table S1). High-resolution ARXPS spectra were acquired in angle resolved lens mode: this mode allows the parallel collection of angle-resolved data without tilting the sample with respect to the lens axis, thanks to a 2D detector. In this work, the photoelectrons were detected from 16 different emission angles ranging from 24.9° to 81.1°. Thanks to this combination of radians lens and 2D detector, the analyzed area does not change during the analysis. Emission angle is defined as the angle formed by the direction of the photo-emitted electrons and the normal to the sample surface. In this work, only spectra acquired at angles below 60° were considered in order to mitigate the potential effects of elastic scattering that may occur at angles greater than 60° [25]. This could affect the accuracy of thickness estimation, apparent concentration, and relative depth plot calculations [34,35]. The pass energy was set at 150 eV, the energy resolution was 1.27 eV (FWHM height of Ag3d5/2) the angular signature was collected at 150 eV pass energy and an example is pro- vided in the supplementary (Figure S1). The total acquisition time was 35 min. The conditions selected here allowed for good reproducibility of the results. The spectra were processed either by CasaXPS software (version 2.3.24PR1.0 Casa Software Ltd., Teignmouth, UK) [36] or by Avantage (v4.88, Thermo Fisher Scientific, East Grinstead, UK) software. The residual standard deviation (RSTD) calculated by CasaXPS is provided in Table 1 together with the curve-fitting parameters. The spectra were obtained on three different samples. On each sample, three analysis points were selected. The binding energy values, and the atomic composition are provided as mean values. The standard deviation is given in parentheses.

Table 1.
Curve-fitting parameters used for processing the most intense signals of freshly cleaved gold, M-Gold and A-Gold. RSTD was calculated by CasaXPS software.
3. Results
3.1. X-ray Photoelectron Spectroscopy of Freshly Cleaved Gold before Functionalization
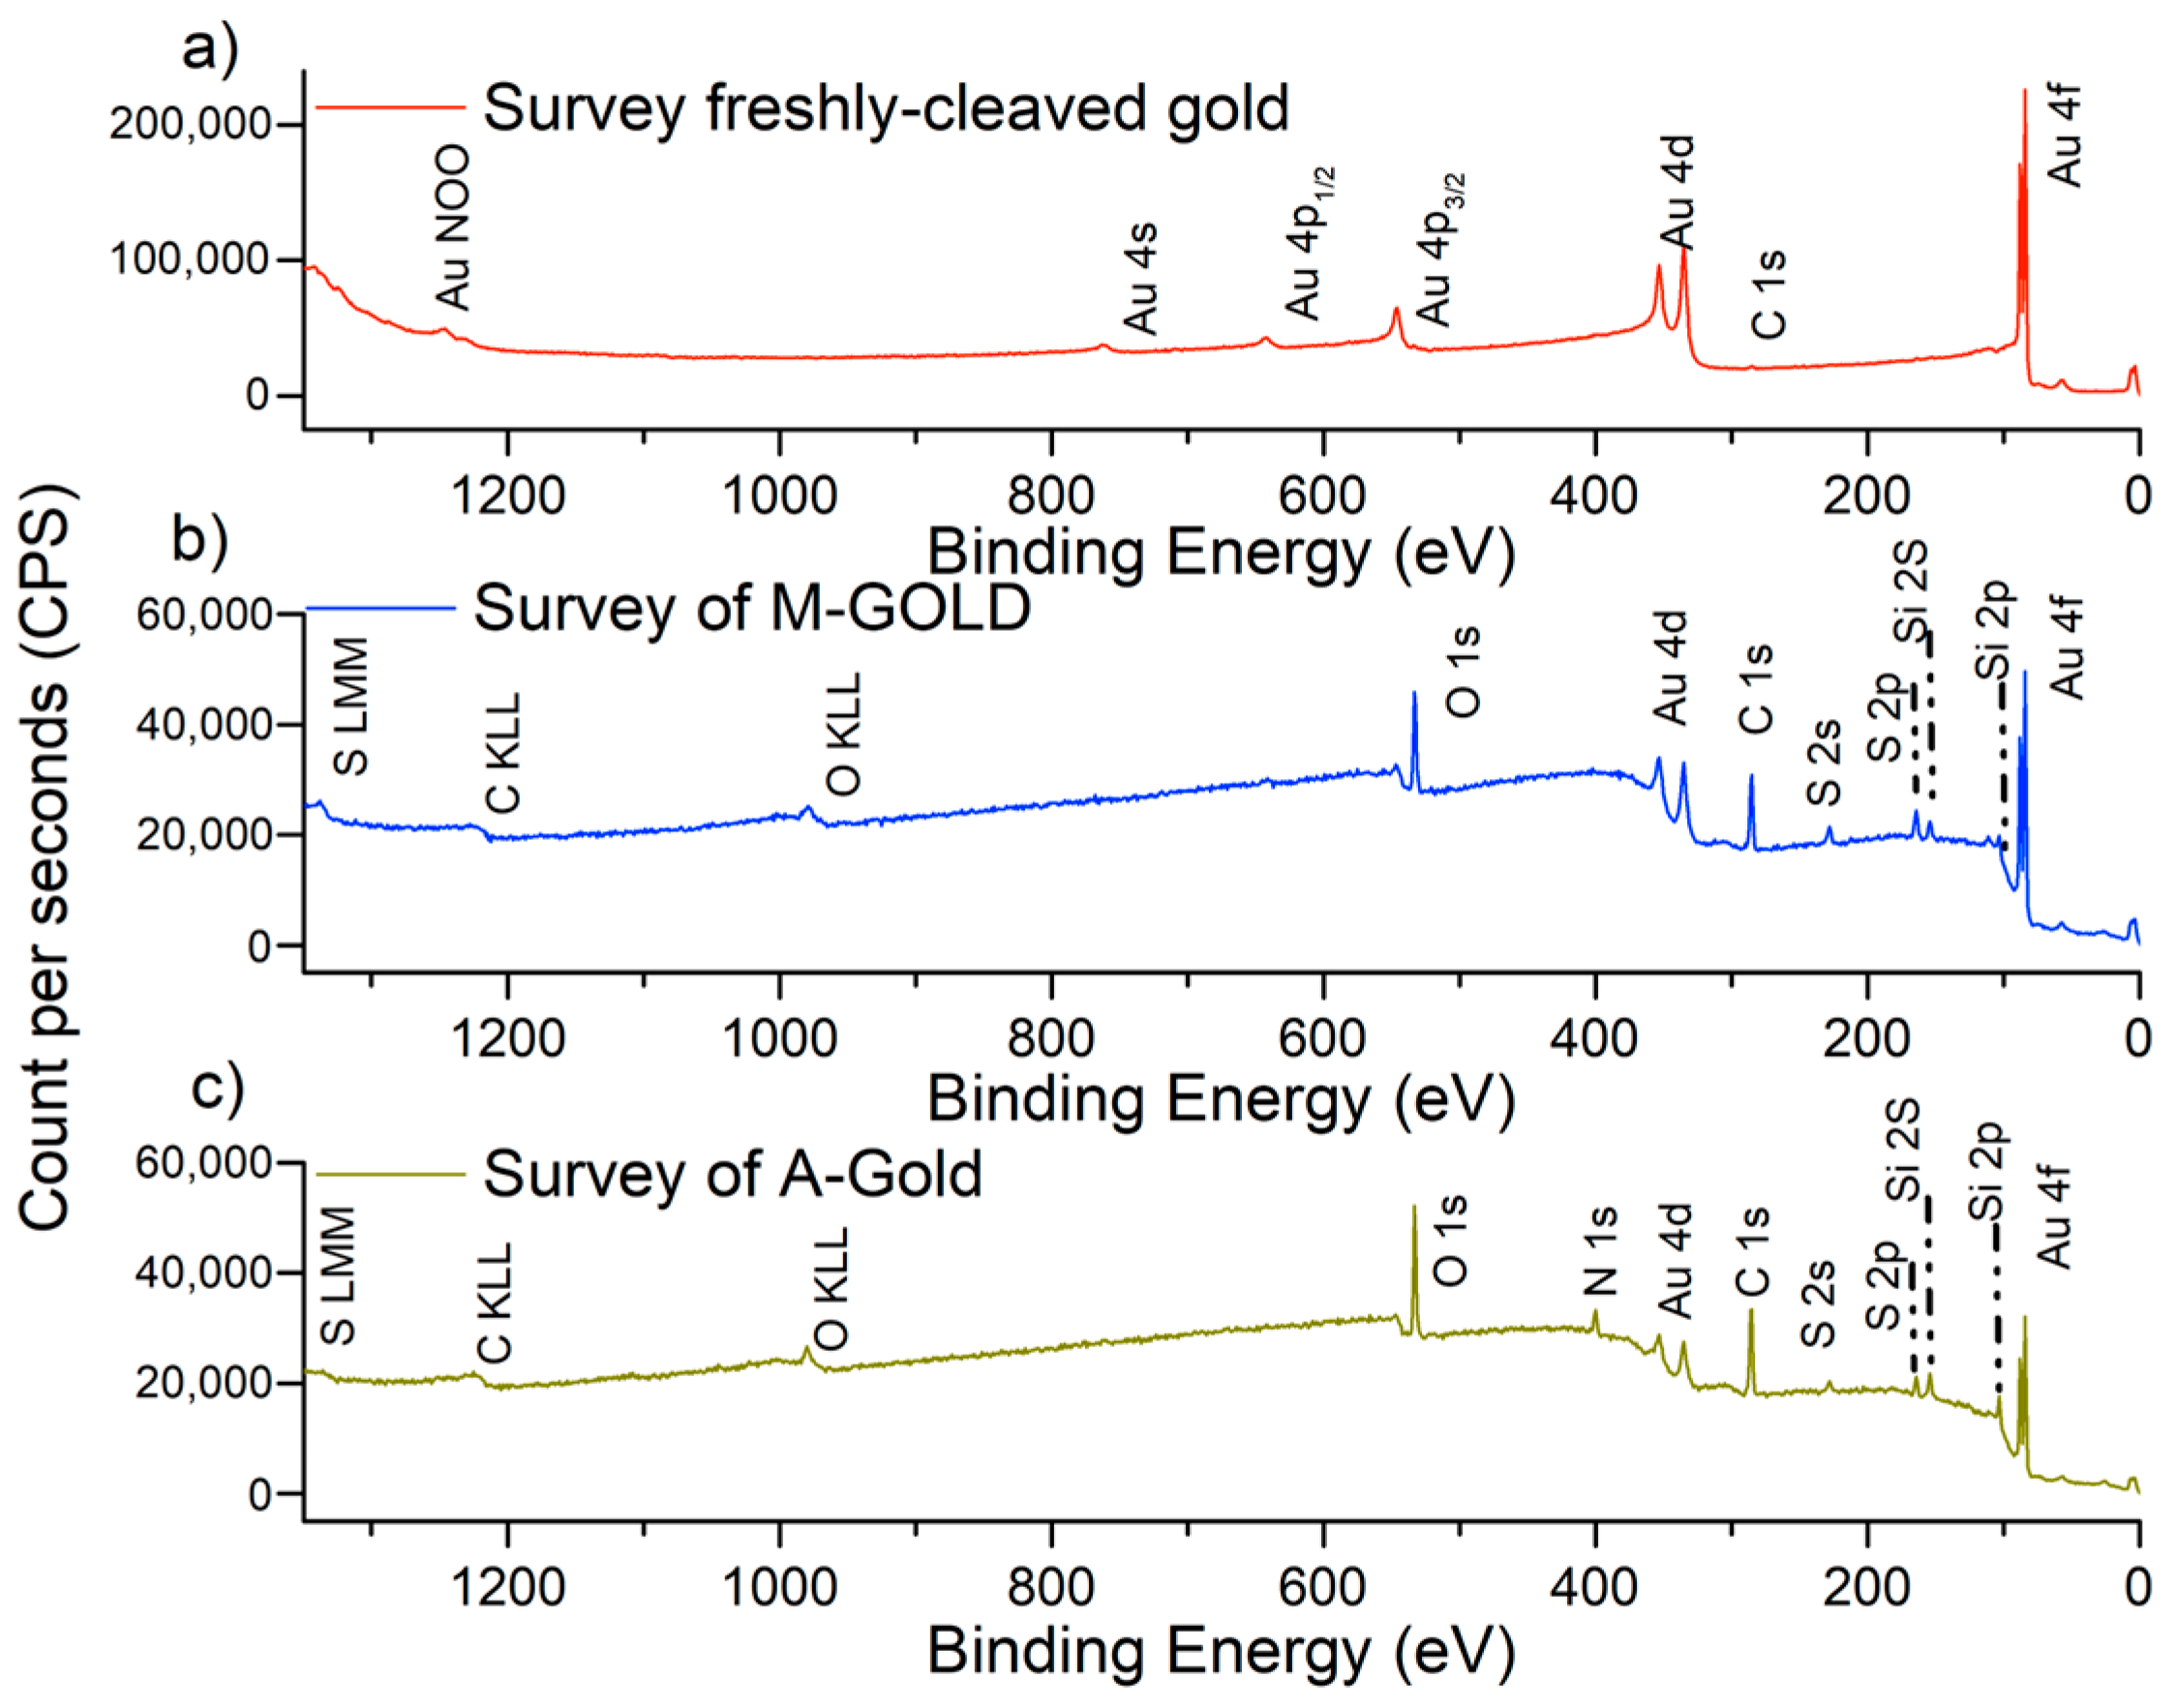
XPS was used for characterizing the freshly cleaved gold surface before and after functionalization with MPTMS (M-Gold). M-Gold grafted with APTES is named A-Gold. XPS allows the identification of the elements, of their chemical state and the determination of the surface composition. The survey spectrum of freshly cleaved gold before the functionalization is reported in Figure 4a. The spectrum shows the presence of a barely visible C 1s signal due to a short-time exposure to the ambient, together with peaks ascribed to gold; no O 1s signal was detectable.
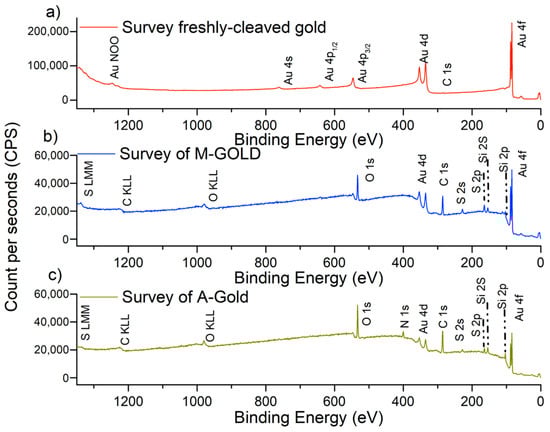
Figure 4.
Survey spectra of (a) fresh-cleaved gold, (b) gold after functionalization with MPTMS (M-Gold), (c) M-Gold after grafting with APTES (A-gold).
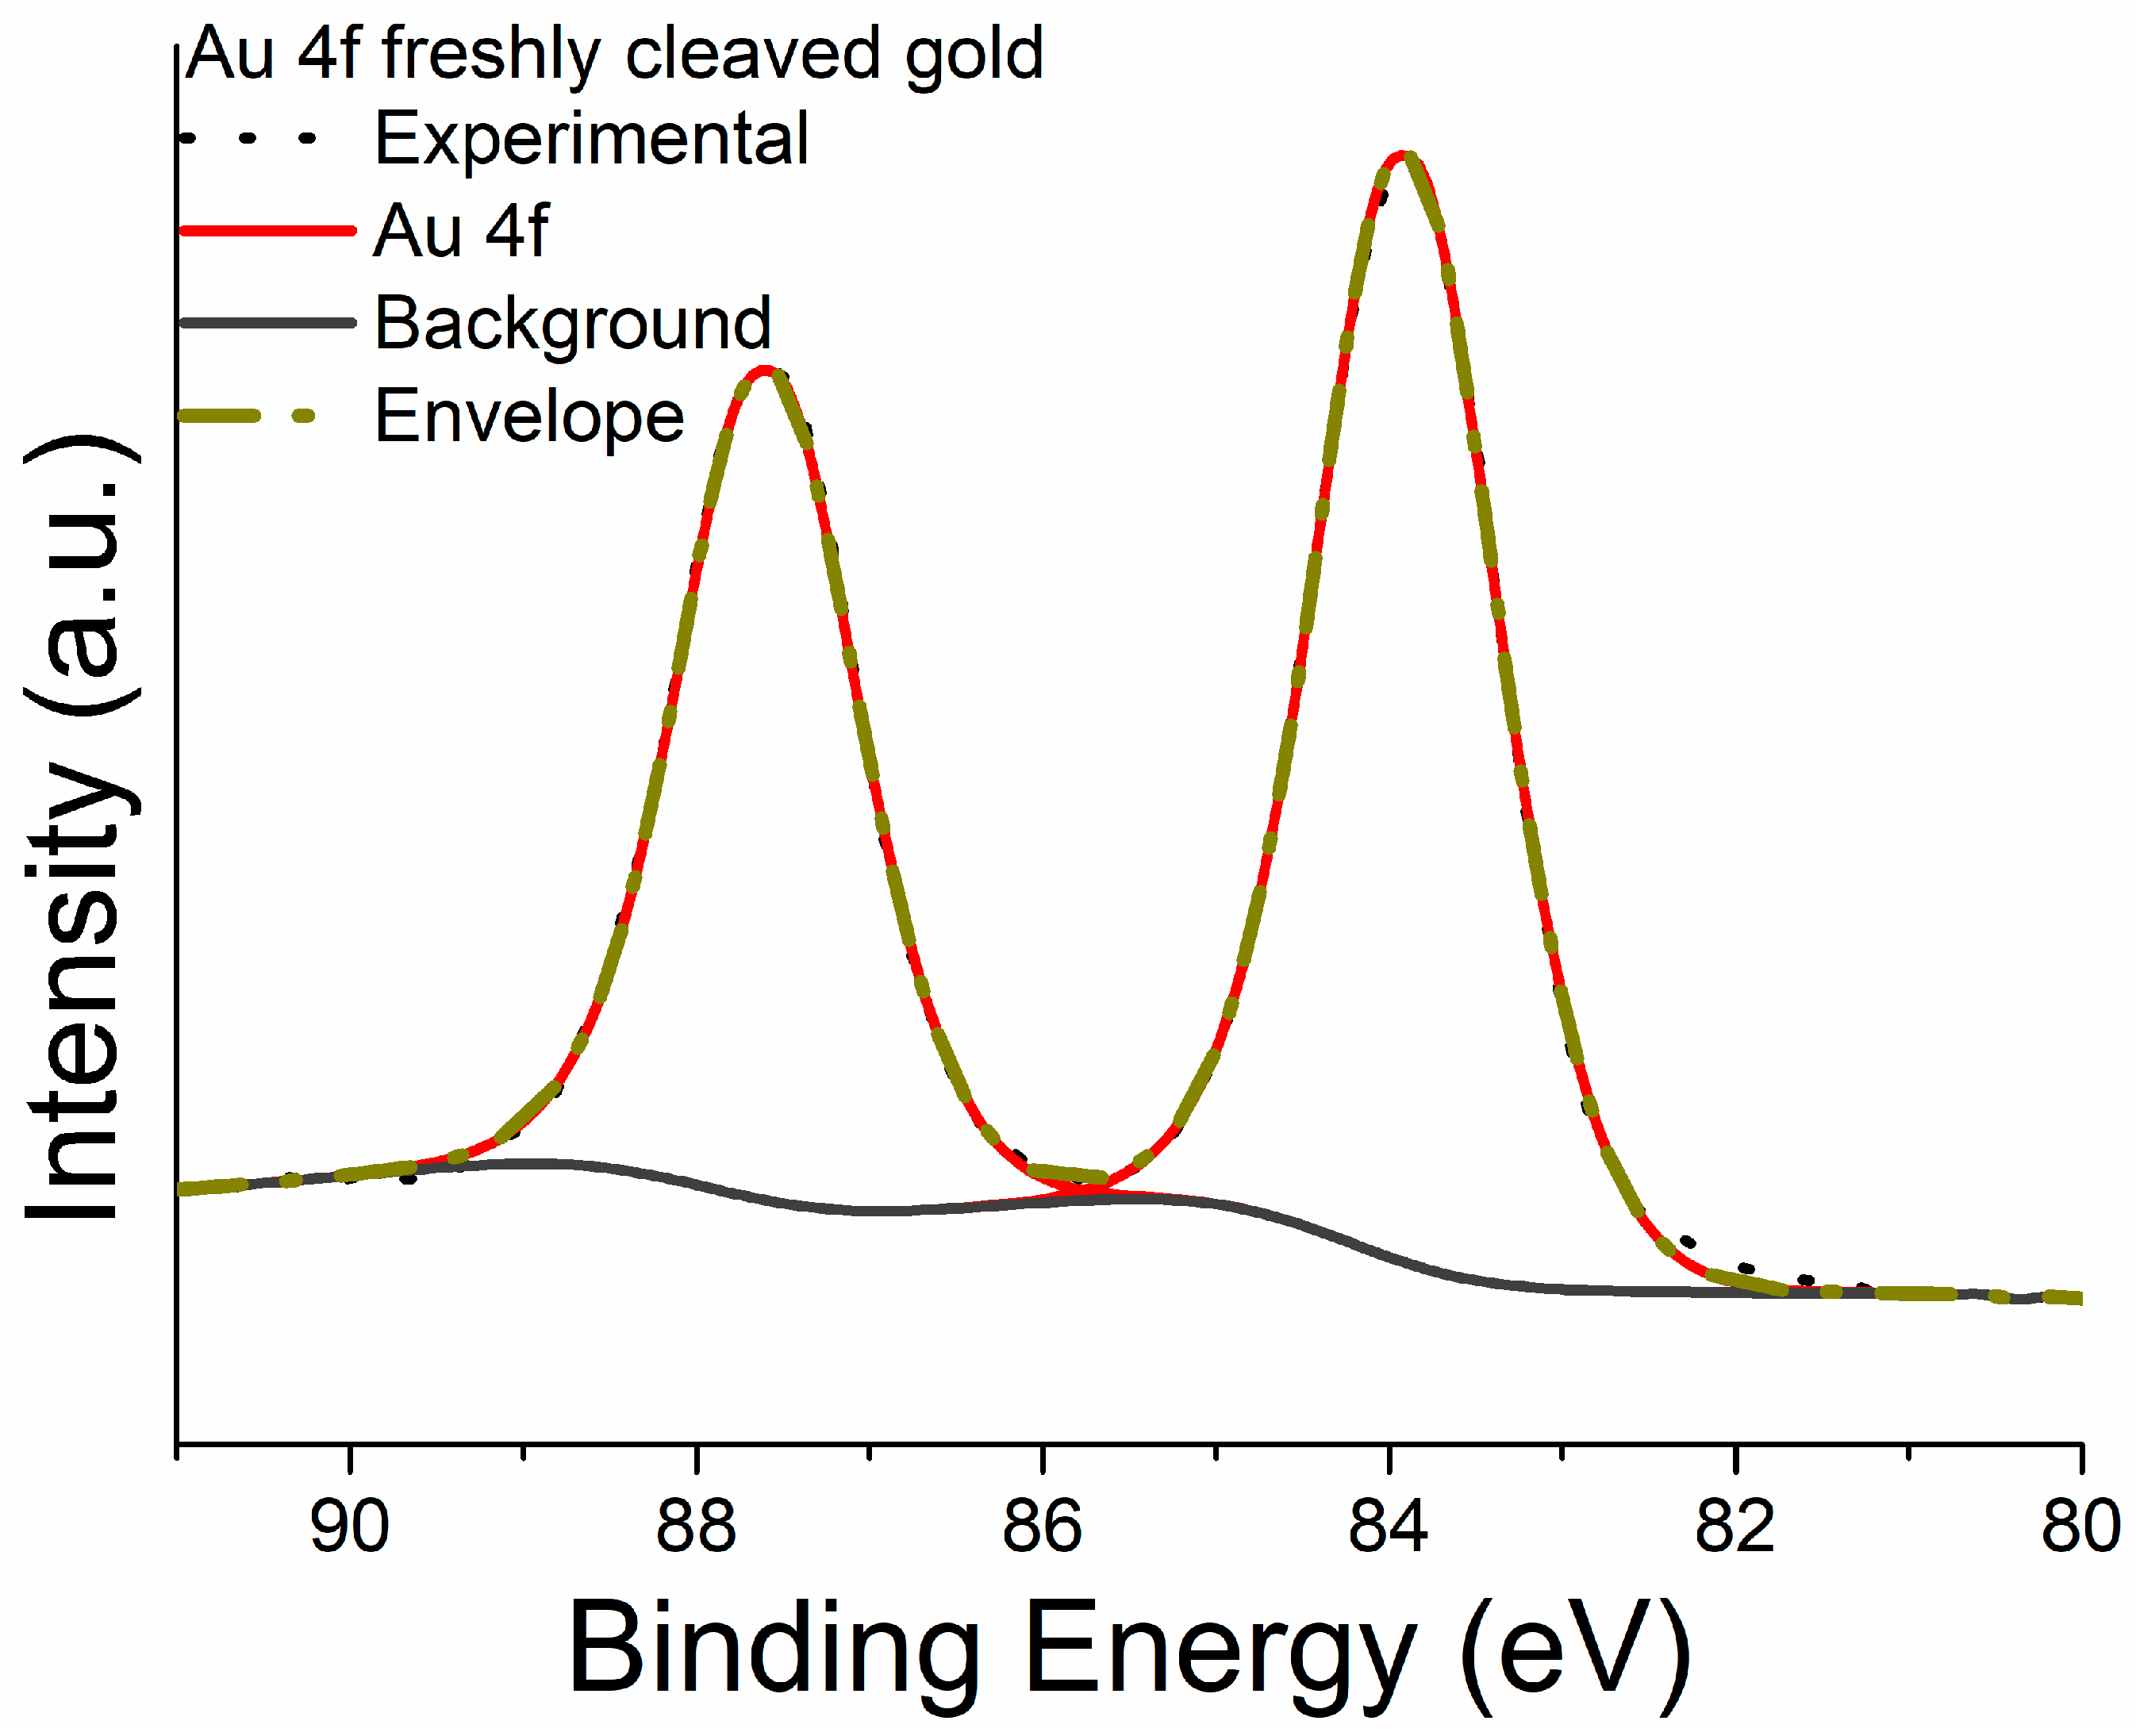
Figure 5 shows the curve-fitted high-resolution Au 4f signal after background subtraction with U 3 Tougaard model. Au 4f peaks were fitted with a doublet due to the spin-orbit coupling being the energy separation between the 4f7/2 and 4f5/2, taken equal to 3.7 eV, and the area ratio equal to 4:3. The full width at half-maximum height (FWHM) was 1.2 eV for both the components. The details on the line shape of the signals and on the constraints adopted for the curve fitting are reported in Table 1 and are in agreement with the literature [27,37].
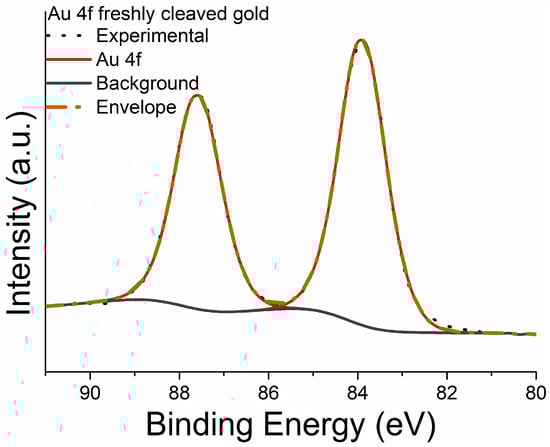
Figure 5.
Example of high-resolution spectrum of Au 4f signal acquired on freshly cleaved gold sample.
3.2. X-ray Photoelectron Spectroscopy after Functionalization with MPTMS
XPS spectra were acquired after the immersion of the freshly cleaved gold samples in the 10% MPTMS solution for one hour and subsequent immersion in ethanol. The survey spectrum of the MPTMS functionalized samples (Figure 4b) showed the presence of silicon (Si 2p, Si 2s), sulphur (S 2p, S 2s), oxygen (O1s) and carbon (C 1s) signals attributed to the presence of an MPTMS surface layer. The Au 4f signals are still revealed but compared to the freshly cleaved sample (Figure 4a) their intensity is attenuated by the organic overlayer. The presence of the overlayer is also responsible for the change in the background shape after the immersion of the freshly cleaved gold in the MPTMS solution.
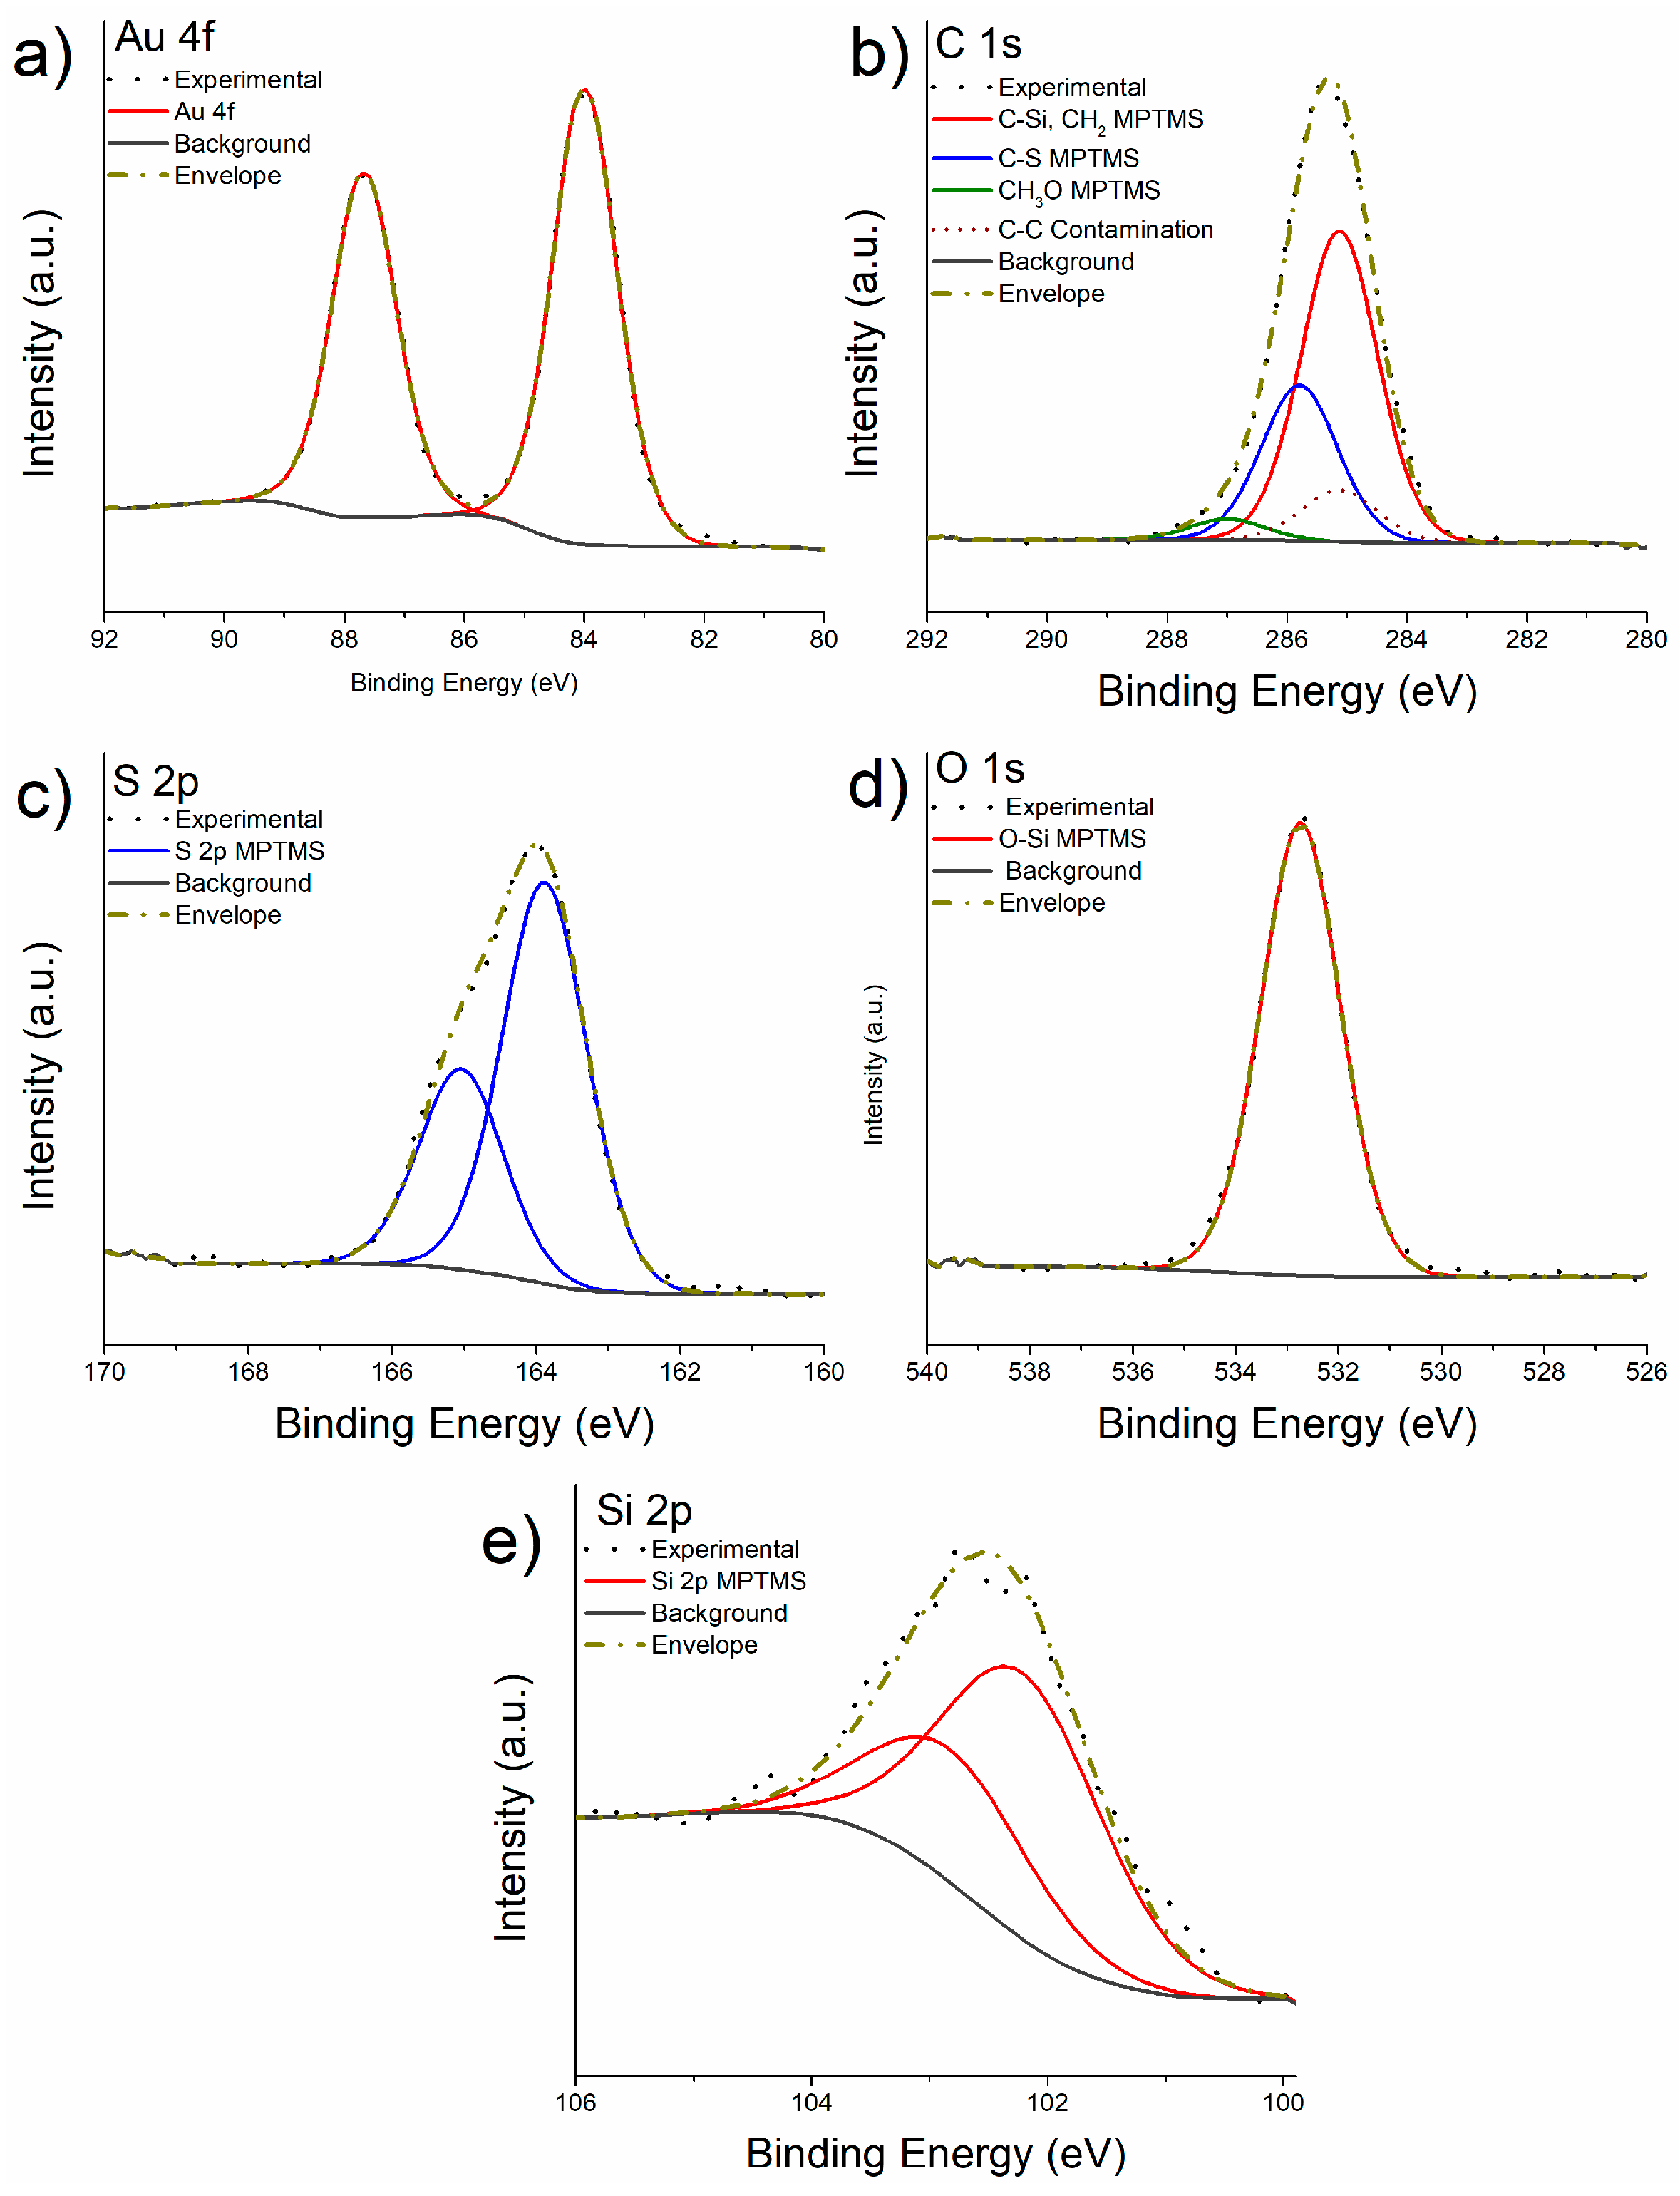
Representative high-resolution C 1s, S 2p, Si 2p, O 1s and Au 4f spectra are shown in Figure 6. The spectra were acquired for investigating the chemical state of the elements and for the quantification. The binding energies of the different components of C 1s, O 1s, S 2p and Si 2p signals revealed on the M-Gold samples are listed in Table 2, where the apparent atomic concentration (at%) of each component of the elements present in the MPTMS layer is also reported. The apparent composition was calculated assuming the in depth-homogeneity of the layer.
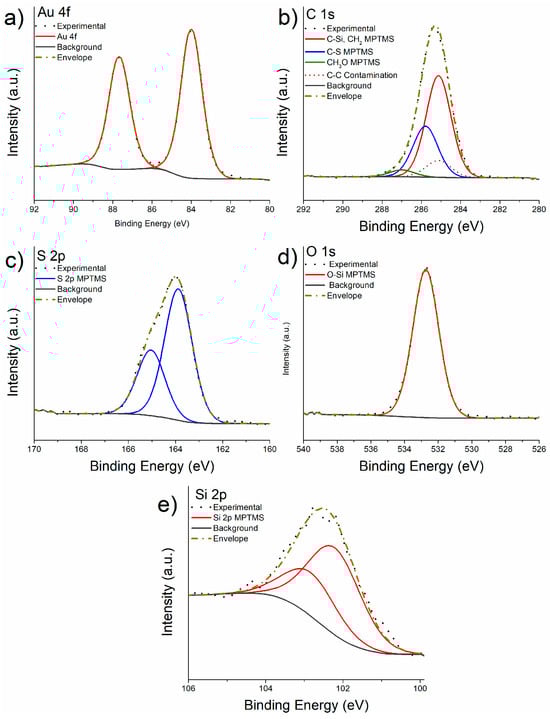
Figure 6.
High-resolution spectra of Au 4f (a), C 1s (b), S 2p (c), O 1s (d), and Si 2p (e) signals of the fresh-cleaved gold after functionalization with MPTMS.
Table 2.
Binding energies values (eV) and composition (at%) for M-Gold samples. Mean values over three independent measurements are reported; the standard deviations are given in parentheses.
Au 4f signal (Figure 6a) was resolved in the spin-orbit components applying the same parameters adopted for the freshly cleaved gold sample.
The curve fitting of the C 1s signal after the reaction (Figure 6b) resulted in four components: a peak at 284.9 eV attributed to carbon in C-Si and CH2 of the MPTMS, two more peaks assigned to the C-S and CH3O at 285.9 eV and 287.0 eV, respectively, and a peak at 285 eV that was attributed to the aliphatic component of the contamination layer (represented by the dotted curve in Figure 6b). The area of the component ascribed to C-Si and CH2 and of the C-S component was constrained to be 2:1 as expected from the stoichiometry of MPTMS (Figure 1 and Figure 2) assuming the formation of a monolayer of MPTMS; the areas of the other components were not constrained. (Table 1).
S 2p peaks were curve-fitted with a doublet due to spin-orbit coupling (Figure 6c). The area ratio between S 2p3/2 and S 2p1/2 was constrained to be equal to 2:1, and the energy separation was 1.16 eV. The binding energy value of the S 2p3/2 component was found to be 163.7 (0.1) eV (Table 2). The O 1s signal (Figure 6d) was fitted with a single component having the peak maximum at 532.6 eV ascribed to the -O-Si in agreement with literature [38].
The Si 2p high-resolution spectrum (Figure 6e) consists of a doublet due to the spin-orbit coupling with an energy separation between the 2p3/2 and 2p1/2 components of 0.6 eV and an area ratio equal to 2:1. (Table 1) The binding energy of Si 2p3/2 component was found to be 102.3 eV (Table 2) and it is in agreement with the value reported in [39] for silicon involved in CH2-Si-O bonds in MPTMS.
The results of the quantitative analysis of the MPTMS functionalized layer (excluding the signal of gold from the substrate) are shown in Table 2. The S:Si ratio of 1:1 confirms the expected stoichiometry of the MPTMS layer.
It is worth noting that only 4% methoxide is detected instead of 12%, this might be due to the hydrolysis of Si−OCH3 bonds to yield silanols, the majority of which couple to form siloxanes forming a three-dimensional cross-linking of the Si-O-Si bond. A comparison with the expected composition of the functionalized layer is discussed in Section 4.3.2.
3.3. X-ray Photoelectron Spectroscopy of MPTMS Functionalized Gold after Grafting with APTES
The samples functionalized with MPTMS (M-Gold samples) were dipped into an APTES solution 7.5 mM in ethanol and ammonia for 1h. A representative survey spectrum following the immersion in APTES solution is shown in Figure 4c; in addition to the signals of carbon, oxygen, sulphur and silicon, the nitrogen, N 1s, signal is detected supporting the presence of APTES grafted to MPTMS on the gold surface sample. Gold signals are still detected but at lower intensity than in M-Gold samples (Figure 4b).
The magnified version of Figure 4a–c is provided in the supplementary material file (Figures S2–S4).
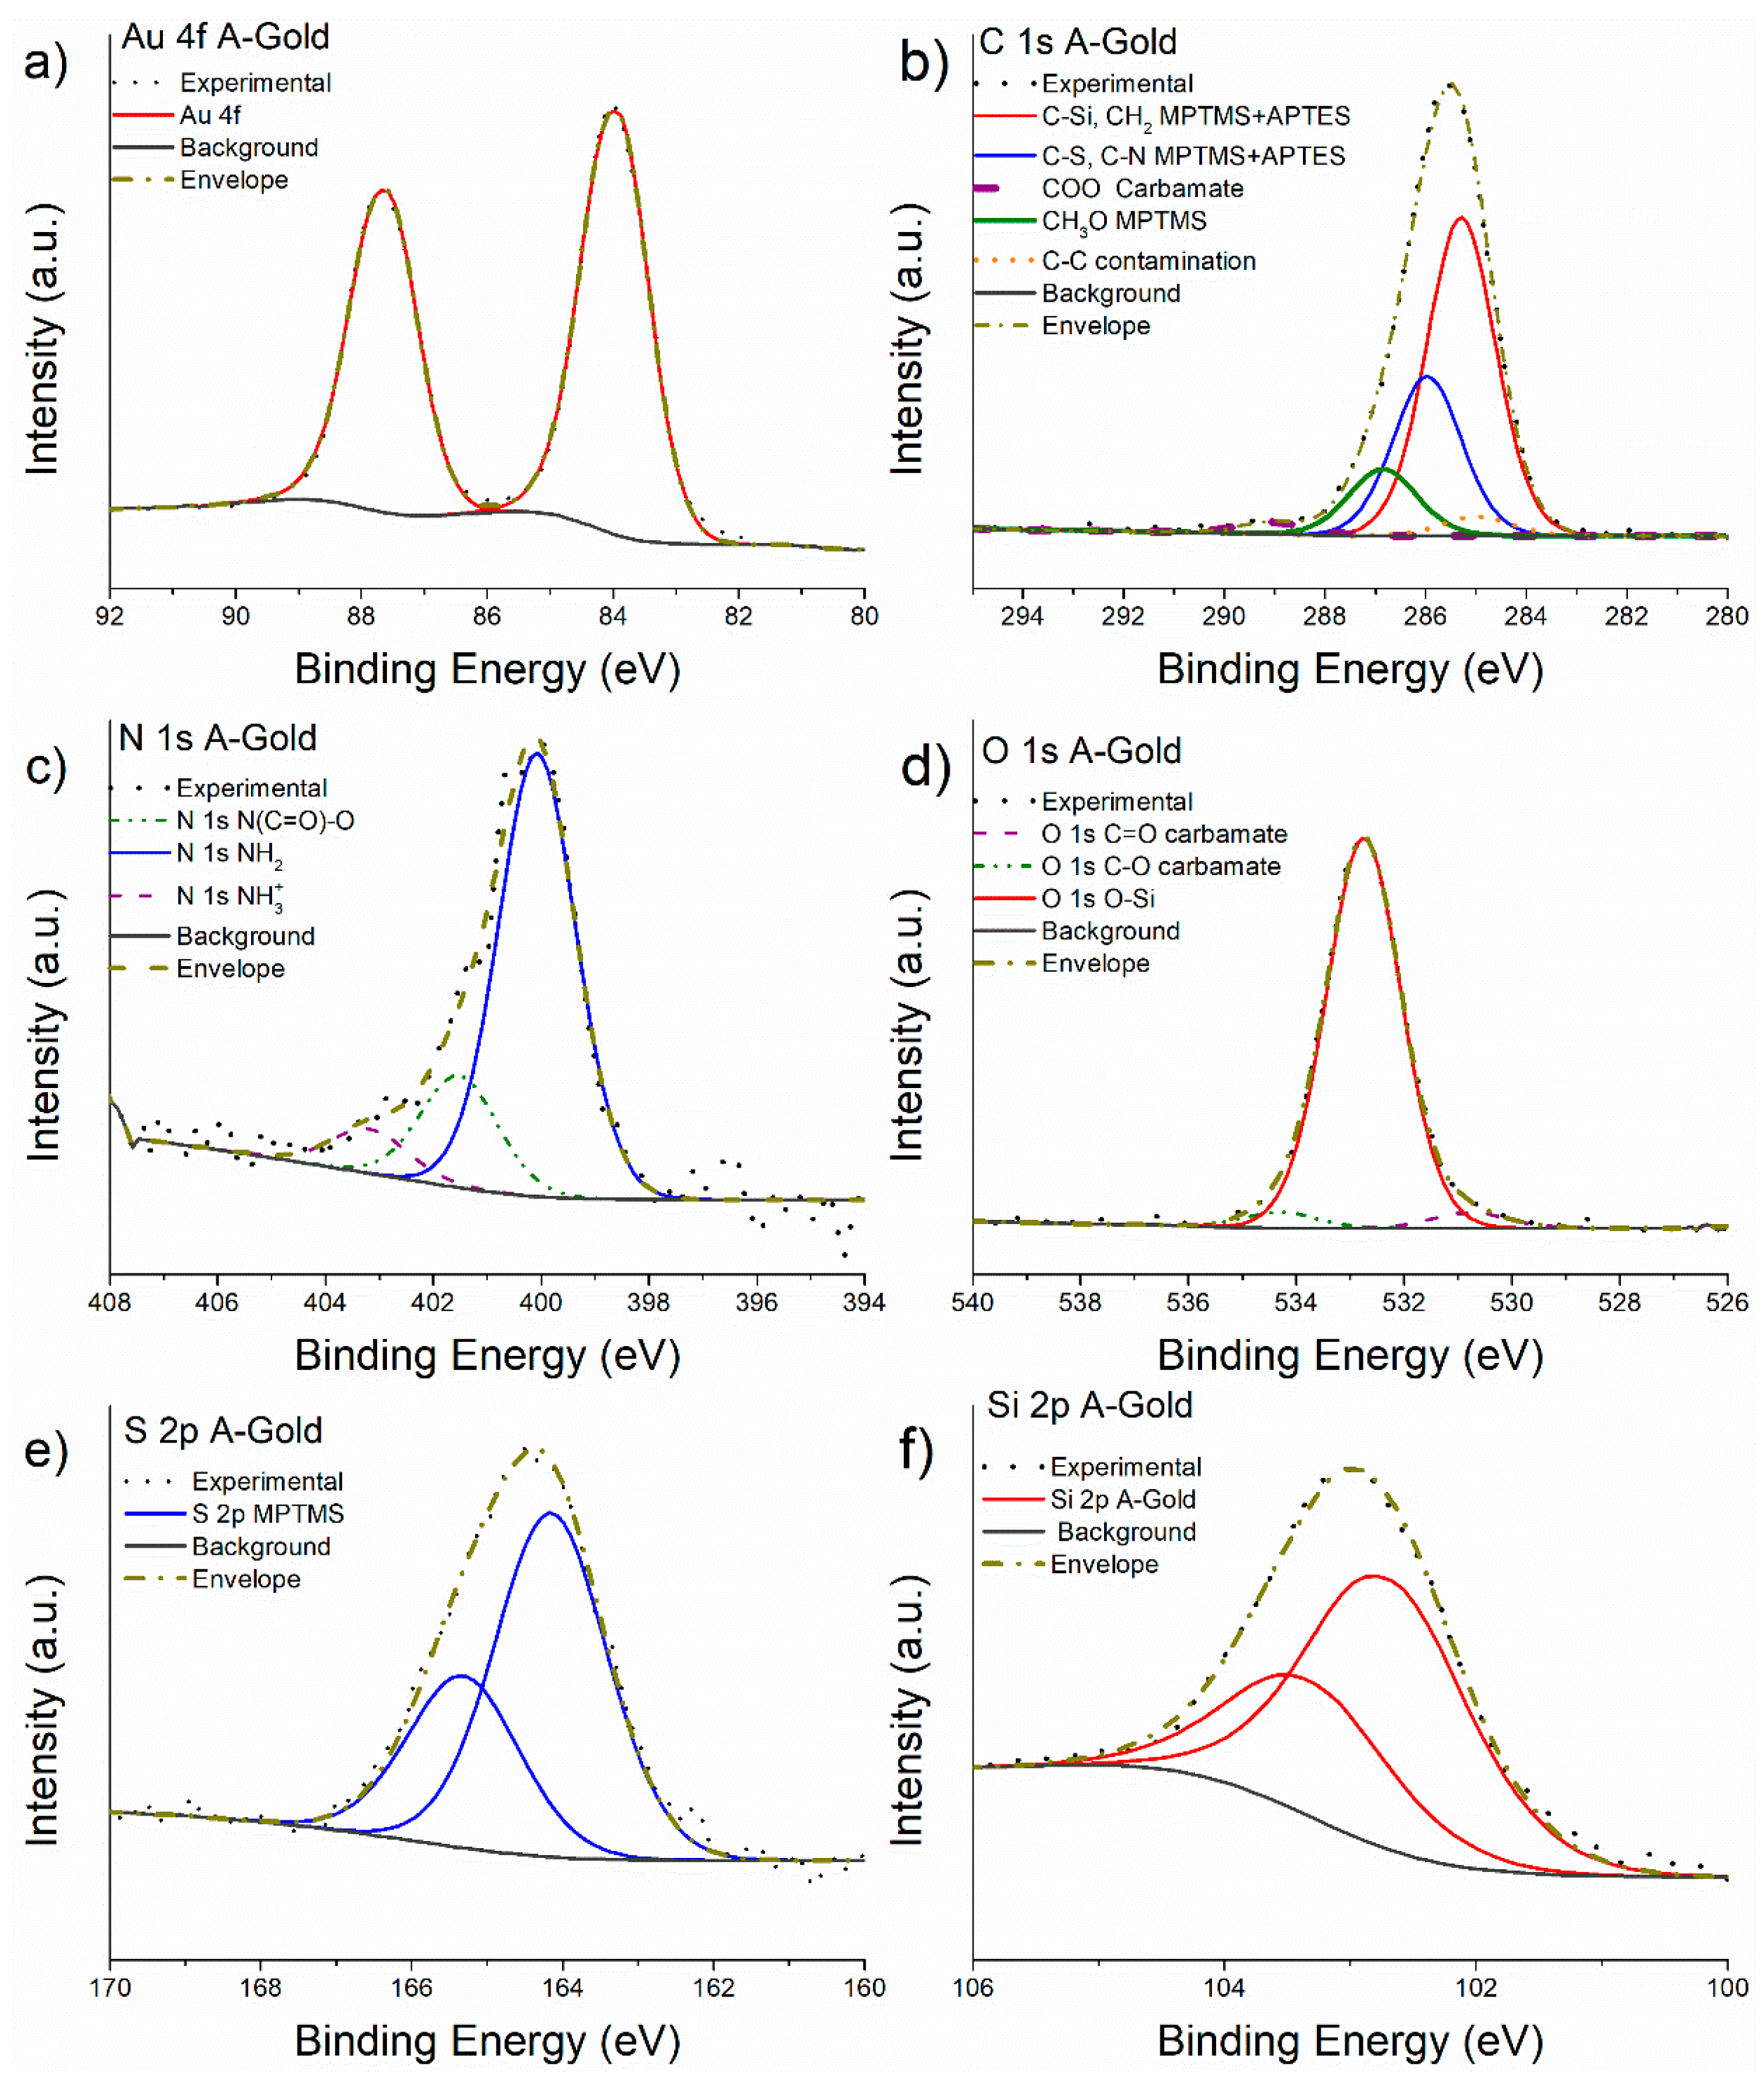
The high-resolution spectra of Au 4f, C 1s, N1s, O 1s, S 2p and Si 2p are shown in Figure 7. The same curve-fitting parameters and constraints used for M-Gold spectra (Table 1) were applied in this case. The binding energy values of the different components of the most intense photoelectron lines and the results of the quantitative analysis are provided in Table 3.
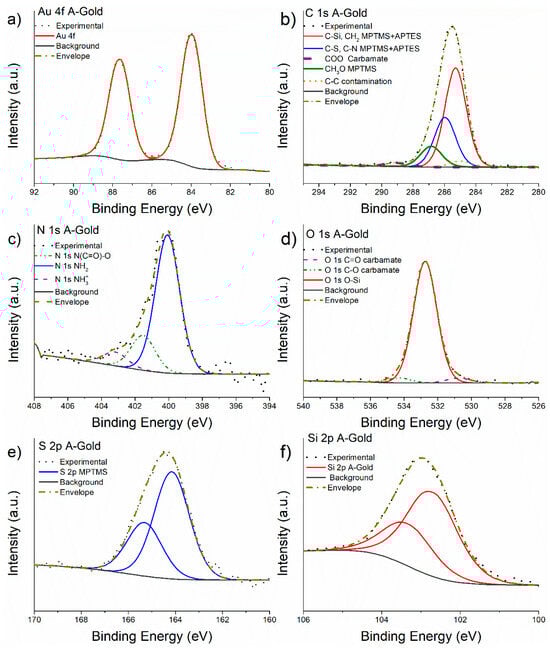
Figure 7.
High-resolution spectra of Au 4f (a), C 1s (b), N 1s (c), O 1s (d), S 2p (e) and Si 2p (f) recorded on A-Gold sample.
Table 3.
Binding energies and quantitative analysis results for A-Gold samples. Mean values over three independent measurements are reported; the standard deviation is given in parentheses.
No difference in the line shape of Au 4f signal was observed after the functionalization of gold with MPTMS and APTES (Figure 7a). The C 1s high-resolution spectrum (Figure 7b) was fitted with five components, four of these are ascribed to the MPTMS-APTES overlayer and one is assigned to aliphatic carbon (contamination). The red curve was attributed to the C-Si, CH2 at 285.3 eV of the MPTMS-APTES chain and it was constrained to be in a 2:1 ratio with the component at 286.0 eV that is ascribed to CH2-S and CH2-NH2 component as expected from the stoichiometry considering the model shown in Figure 3. The C-Si, CH2 signal following the reaction with APTES was shifted by +0.4 eV compared to the same signal observed in M-Gold (Table 2) being the binding energy of the former and the latter 284.9 eV and 285.3 eV, respectively. Carbon atoms bonded to sulphur and nitrogen atoms are found at 286 eV in agreement with the literature [22,23].
N 1s signal (Figure 7c) was multi-component and processed considering three components at 399.8 eV, 400.8 eV and 402.2 eV attributed to the -NH2, NHCOO carbamate, and NH3+, respectively, as the presence of the three functional groups is commonly observed in similar systems [23]. The -NH2 component can be attributed to the free amine groups of the APTES layer, while the NH3+ contribution may be due to weak hydrogen bond interaction between amine groups of two or more APTES chains. Finally, the component at 400.8 eV is attributed to NHCOO carbamate due to the reaction between the CO2 and amine groups of the APTES; this is also substantiated by the presence of the COO signal at 289 eV in the C 1s spectra [23,40], according to the reaction presented in [41].
The O 1s signal shape (Figure 7d) suggests the presence of two additional small components aside the main O-Si contribution observed also in M-Gold. These two new components at 534.2 eV and 531.1 eV can be assigned to the C-O and C=O of the carbamate, their ratios were constrained to be 1:1.
S 2p and Si 2p signals (Figure 7e,f) have been resolved applying the same curve-fitting model used for the M-Gold spectra. The Si 2p and S 2p peak showed a shift of 0.4 eV towards higher binding energy values compared to the binding energy observed for the M-Gold sample (Table 2).
The quantitative analysis of the XPS measurements on the A-Gold surface (functionalized with MPTMS and grafted with APTES) shows that the atomic ratio between Si 2p and S 2p signals is 1.5:1 (Table 3); this might suggest that two molecules of MPTMS on the M-Gold samples react with one molecule of APTES. Moreover, the total concentration of N 1s signal is about 5 at%, thus resulting in an S-to-N ratio equal to 2:1 supporting a reaction between MPTMS and APTES, which is not in a 1-to-1 ratio. A comparison with the expected composition of the functionalized layer is given in the discussion section (Section 4.3.2).
3.4. Angle-Resolved X-ray Photoelectron Spectroscopy on MPTMS Functionalized Gold M-Gold
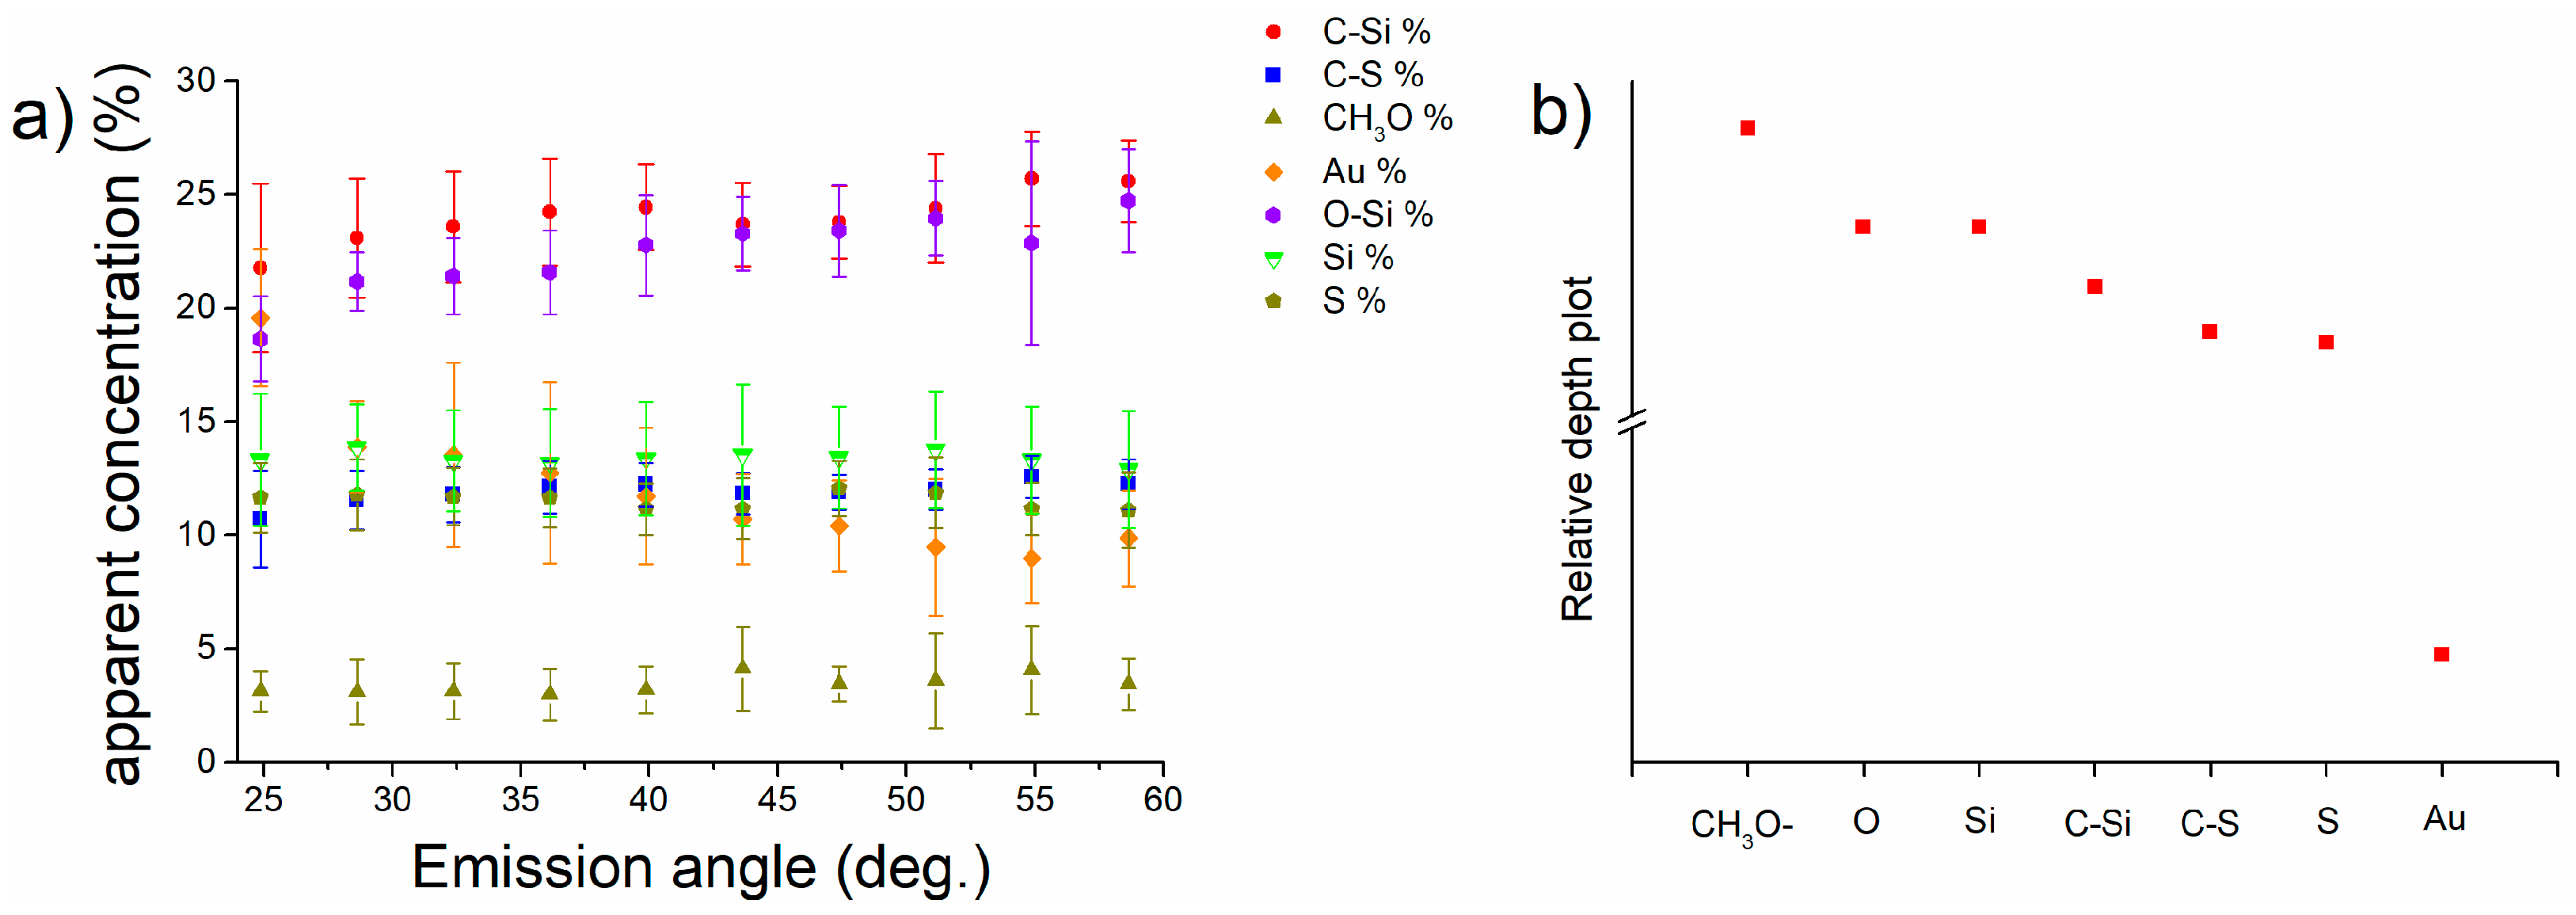
High-resolution spectra (Figure S5) of C 1s, O 1s, Si 2p, Au 4f and S 2p were acquired on the MPTMS functionalized gold samples at different emission angles; with increasing emission angles, the sampling depth decreases. The surface sensitivity is higher at high emission angles. Signals of all the elements were revealed at all emission angles, the intensity of Au 4f signals is the highest at 24.9 degree, that of Si 2p is highest at 58.6 degree. The apparent concentrations in atomic percentage (obtained from the quantitative analysis at each emission angle) plotted versus the emission angle are shown in Figure 8a for M-Gold samples. It can be noted that the apparent concentration of carbon C-Si and of O-Si are the highest and they increase with the emission angle, while the concentration of gold (Au 4f) decreases (Figure S6). The apparent concentrations of sulphur and silicon do not vary (within the standard deviation) with the emission angle.

Figure 8.
Apparent concentration (%) versus emission angle calculated for Au, Si, S, C-Si, O-Si, CH3O and C-S (a) and relative depth plot (b) for M-Gold.
The relative depth plot (calculated by the Avantage software v. 5.932 by Thermo Fisher) that indicates the in-depth distribution of the different elements and functional groups (Figure 8b) is obtained by calculating the logarithm of the area ratio of the peak at near grazing angles (58.6 degrees) to that at near normal emission angle (24.8 degrees). The expected behaviour according to the scheme proposed in Figure 2 is confirmed, suggesting that the MPTMS molecules might be adsorbed on the gold surface via sulphur atoms and that the Si-O functional groups are facing the outer part of the layer.
3.5. Angle-Resolved X-ray Photoelectron Spectroscopy of A-Gold
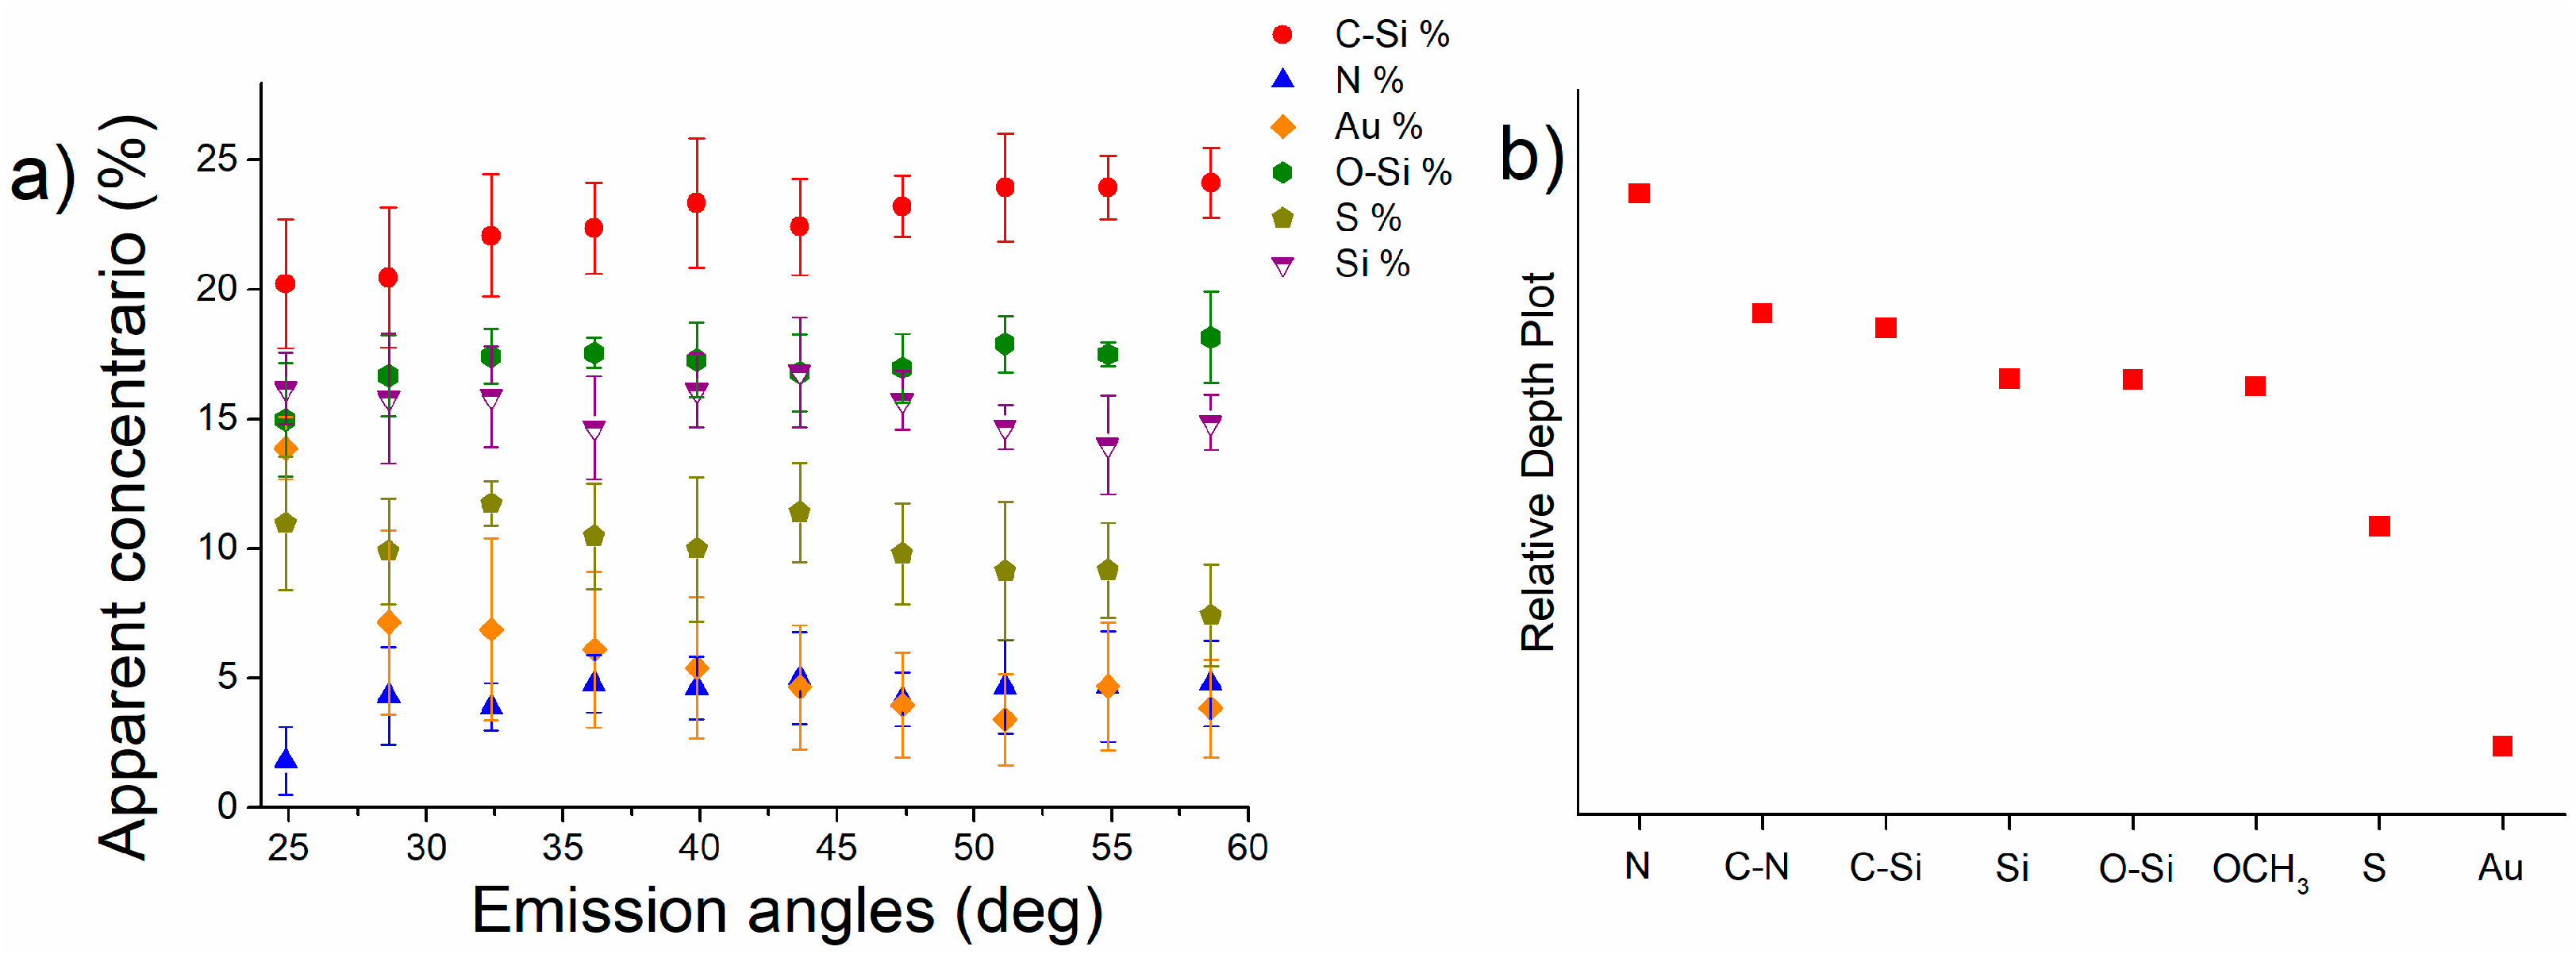
The high-resolution spectra of the ARXPS experiments conducted on A-Gold samples are reported in Figure S7. The A-Gold ARXPS spectra showed the presence of N 1s signal as also revealed in standard lens mode (Section 3.3), and its presence is detected at emission angles greater than 28.6 degrees. This suggests that nitrogen is part of the outermost surface as might be expected from the scheme depicted in Figure 3. Moreover, Figure 9 shows that the apparent concentration of the S 2p signal decreases at high emission angles, indicating its presence in the inner part of the overlayer. (see Section 3.4).
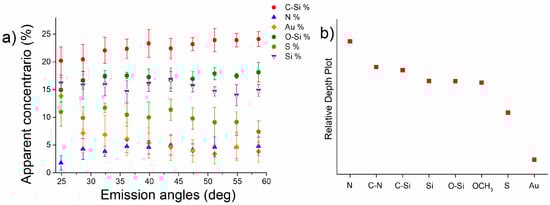
Figure 9.
Apparent concentration vs. emission angles calculated for Au, Si, S, C-Si, O-Si and N of the A-Gold samples (a) and relative depth plot calculated considering the elements: N, Si, O, S and Au of MPTMS and APTES for A-Gold samples (b).
The apparent concentration of carbon bound to silicon, nitrogen, gold, sulphur, silicon, and oxygen bound to silicon for A-Gold at the different emission angle is shown in Figure 9a. Au 4f apparent concentration decreases at higher emission angles as observed in the case of M-Gold samples. In this case, sulphur concentration also decreases at higher emission angles, while the apparent concentrations of C-Si and N increase. Oxygen and silicon apparent atomic concentrations are nearly independent from the angle. The relative depth plot for A-Gold samples based on the ARXPS results (Figure 9b) shows that nitrogen should be located at the outermost surface, while sulphur and gold are in the most internal layer as expected from the reaction scheme of A-Gold (Figure 3).
3.6. Calculation of the Layer Thickness
The determination of the thickness of the functionalized layer is challenging, and various methodologies employing XPS or ARXPS have been proposed in the literature [16,18,24]. In 1970 Hill et al. introduced a method for measuring film thickness of thin films on a substrate, known as Hill’s equation [42]. Hill’s equation, denoted as Equation (1), can be expressed as follows:
In this equation ‘t’ represents the overlayer thickness, and ‘θ’ is the emission angle. It is assumed that the overlayer is homogeneous and has a uniform thickness, and the attenuation length λ of the photoelectrons is considered the same for both the bulk and the overlayer [43].
Since in this work only angles lower than 60 degrees are considered for the thickness estimation by ARXPS data, the elastic scattering effect can be considered negligible and IMFP has been used instead of the attenuation length. Furthermore, this approximation can be made because the thickness of the overlayer is supposed to be lower than the IMFP.
In the case of the system gold/MPTMS/APTES there are no elements in common between the substrate and the functionalization layer, hence Equation (1) cannot be applied. The thickness has been calculated based on ARXPS data considering the attenuation of the intensity IAu of the Au 4f signal measured at two different emission angles, grazing (58.6 degrees) and near vertical (24.8 degrees). The following equation has been used for the thickness calculation:
The same formula was applied using instead of the gold Au 4f signal, the intensity of the sulphur S 2p and of the silicon 2p for M-Gold, and for N 1s for A-Gold to calculate the respective thicknesses. The inelastic mean free path (IMFP) of the elements was calculated according to Seah and Dench [33]. The thickness values calculated on three different analysed areas of three independent samples are shown in Table 4.
Table 4.
Total thickness of the overlayers calculated on M-Gold and A-Gold based on the attenuation of the elements Au, S, Si and N according to Equation (3).
Regarding M-Gold, the total thickness was calculated using the attenuation of the gold signal and it is found to be 1.9 (0.3) nm; this value includes the thickness of the MPTMS layer, that of the contamination layer lc, and the gold substrate. Considering the attenuation of the Si 2p electrons the thickness determined is the sum of the contamination layer lc and of O-CH3 groups and its value is 1.1 (0.2) nm.
The same considerations applied to A-Gold samples, the total thickness is calculated to be 1.8 (0.3) nm, and the layer thickness calculated by considering the attenuation of the N 1s electrons was estimated to be 0.3 (0.1) nm. This might suggest that the thickness of the contamination layer, lc, is much lower than on M-Gold samples with the MPTMS layer (see discussion Section 4.3.1).
4. Discussion
4.1. Understanding APTES Functionalization Mechanisms
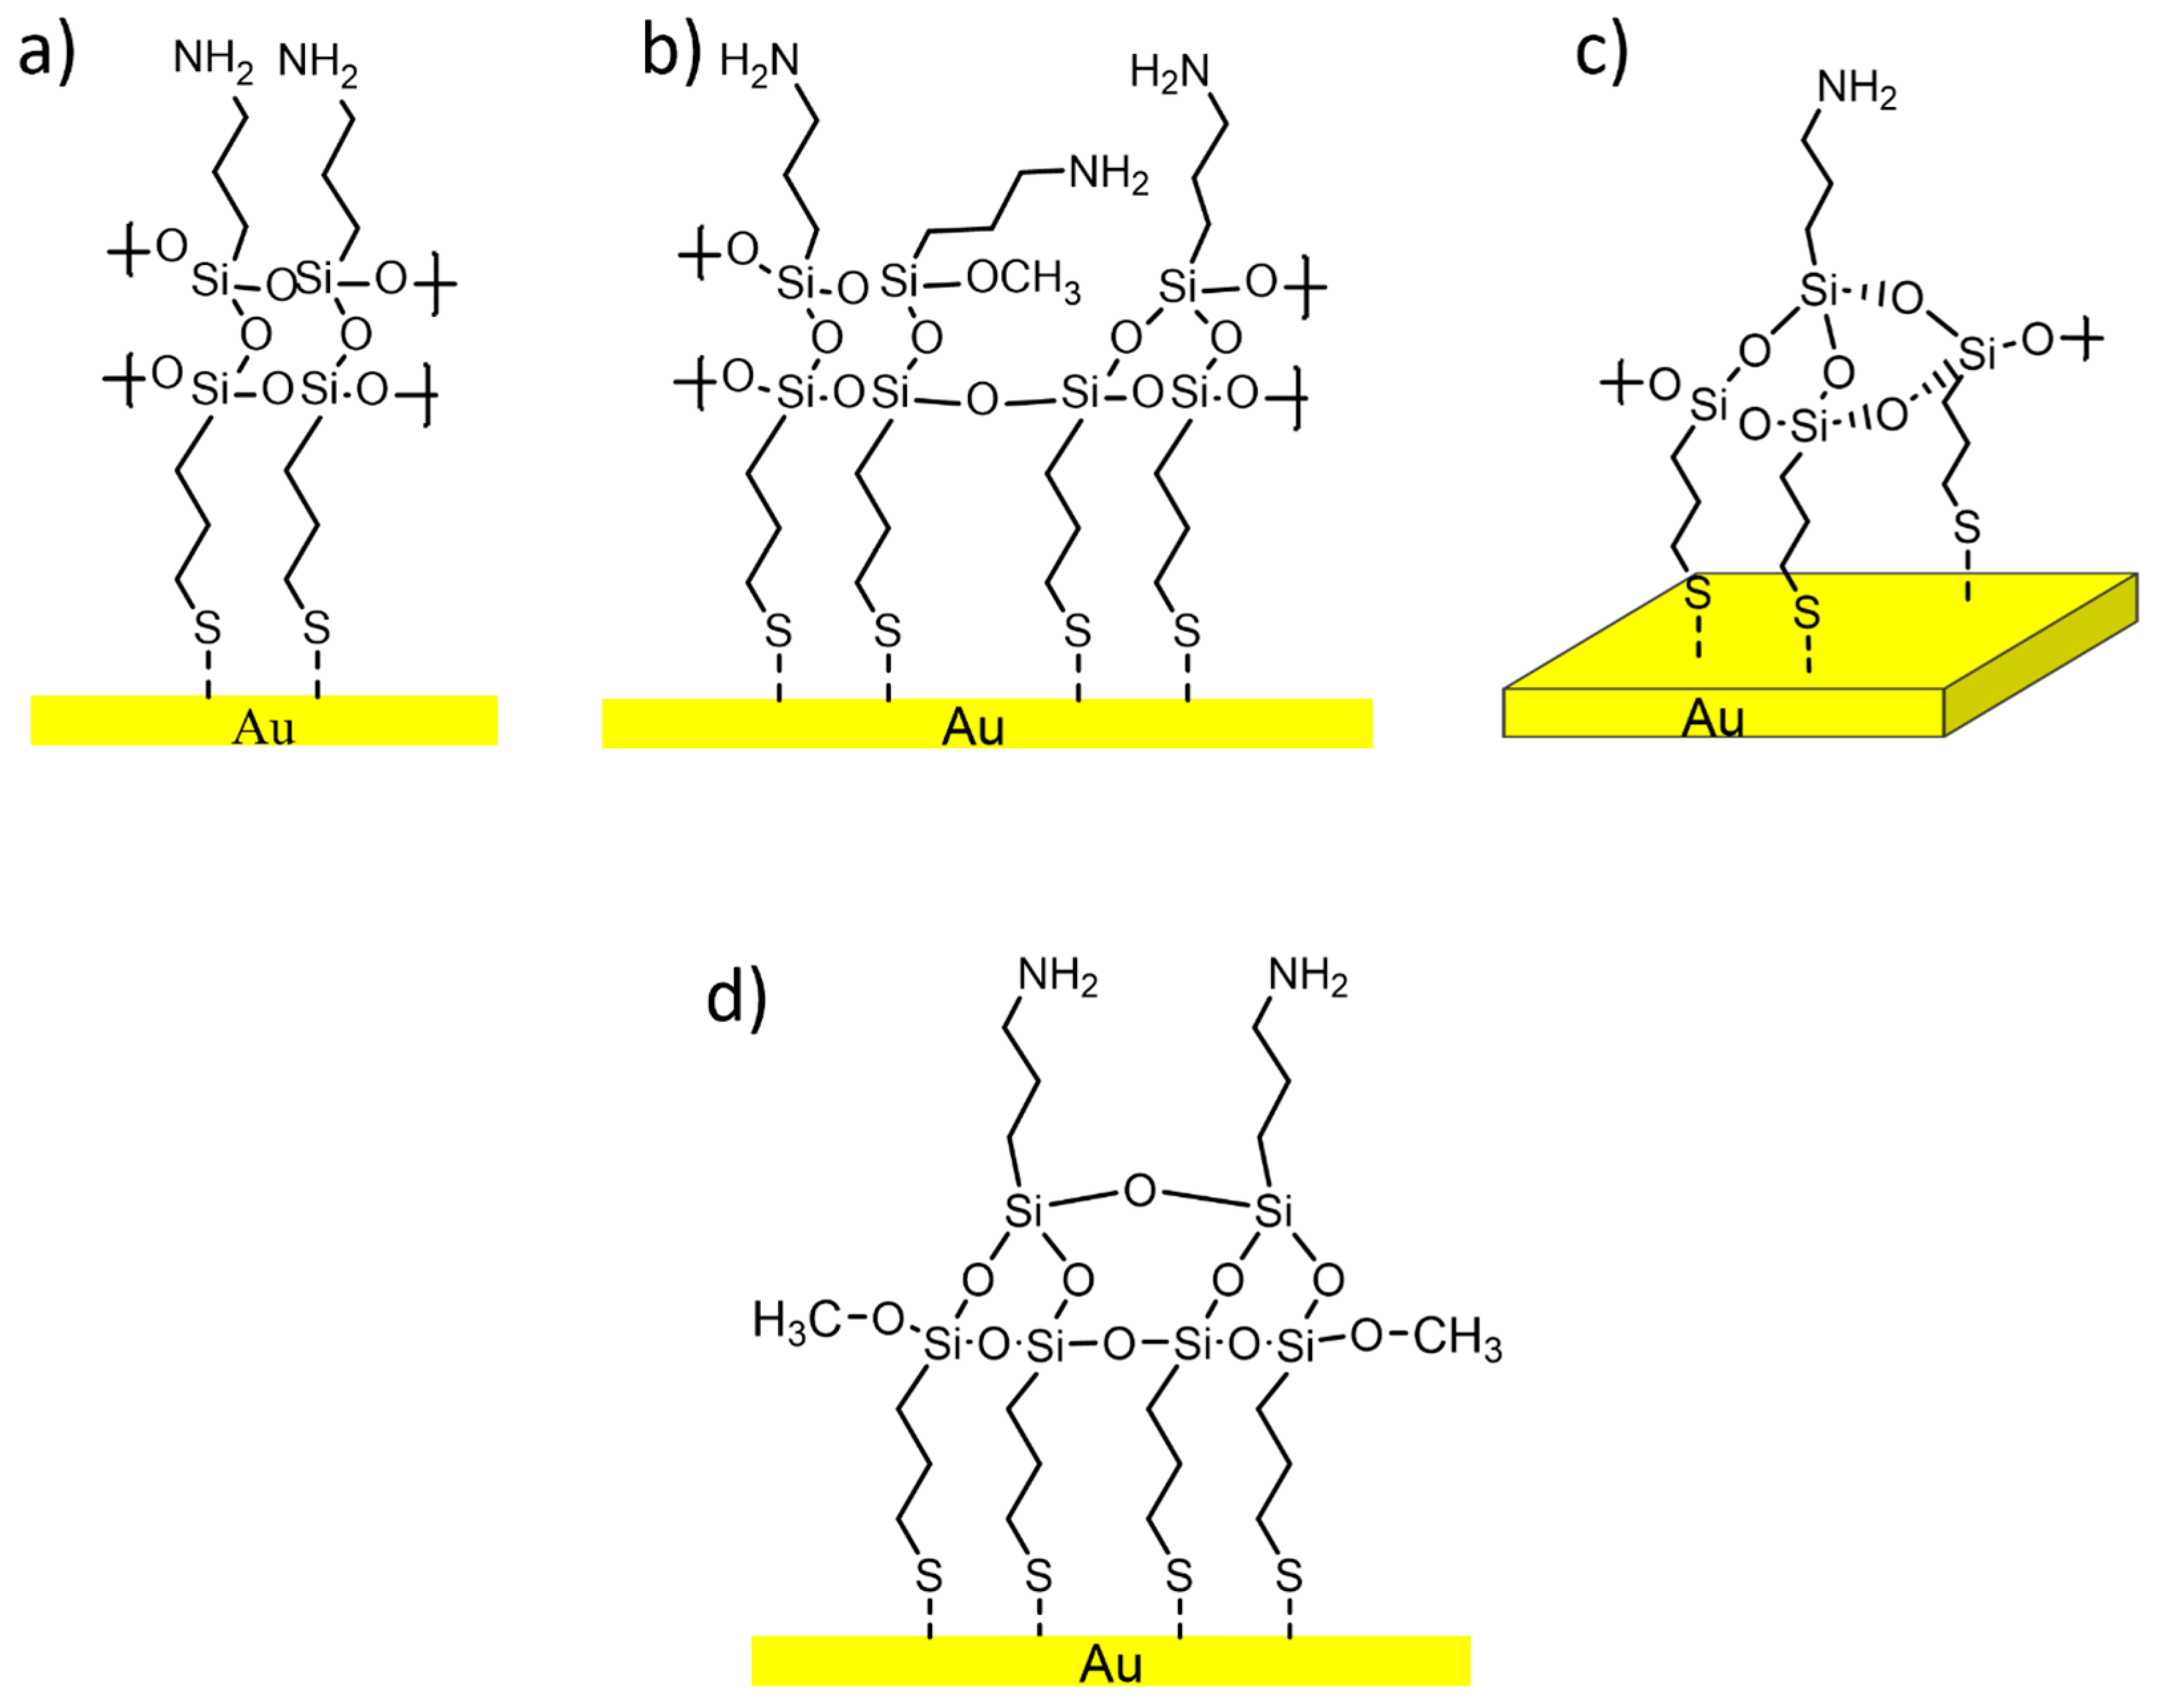
In the literature, the reaction between MPTMS and APTES is reported [4] and, according to the expected stoichiometry, the sulphur-to-nitrogen ratio should be 1:1. However, the results of the quantitative analysis (Table 3) showed a sulphur-to-nitrogen ratio equal to 2:1, suggesting a different reaction mechanism. Indeed, within the literature, numerous examples of SiO2 substrates functionalized with APTES are reported, proposing different potential behaviours of this molecule during the functionalization process [7,23,44,45]. Figure 10a–d show a schematic representation of the various possible arrangements that APTES molecules might adopt for obtaining A-Gold samples, and, in correspondence, different reaction pathways can be suggested.
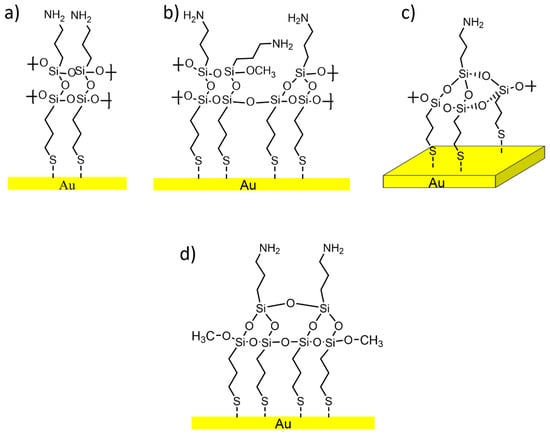
Figure 10.
Possible arrangement of APTES onto MPTMS functionalized gold surface (M-Gold) due to different APTES to MPTMS ratios: (a) APTES:MPTMS = 1:1; (b) APTES:MPTMS = 3:4; (c) APTES:MPTMS = 1:3; (d) APTES:MPTMS = 1:2.
Figure 10a shows the expected result according to [4], but on the basis of the results obtained in this work (Table 3) is not in agreement with this stoichiometry. Additionally, the reaction schemes shown in Figure 10b,c, between three molecules of MPTMS with one of APTES and a ratio of 3:1, can be ruled out on the basis of the experimental results, which lead to a 2-to-1 sulphur-to-nitrogen ratio and 3:1 for a Si:N ratio. Thus, the most probable structure of the APTES in A-Gold samples is shown in Figure 10d (Table 3).
4.2. Models for the Functionalized M-Gold and A-Gold Surfaces
Based on the reaction scheme and the results from ARXPS measurements (relative depth plot in Figure 8b and Figure 9b), the models for the functionalized M-Gold (Figure 11a) and A-Gold (Figure 11b) are proposed. The model of M-Gold consists of three layers: the gold substrate on which the MPTMS is bounded via sulphur and a hydrocarbon contamination layer.
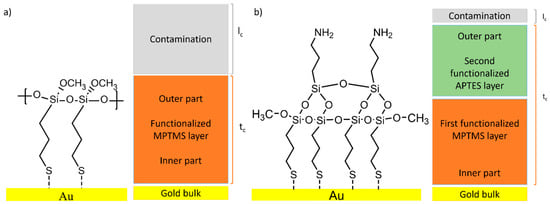
Figure 11.
Idealized model for MPTMS functionalization (M-Gold, a) and MPTMS + ATPES functionalization (A-Gold, b).
The proposed model for A-Gold consists of four layers: the gold substrate, a first functionalized layer of MPTMS and second layer of APTES grafted to the MPTMS surface through the polymerization of the Si-O functional groups, with a thin hydrocarbon contamination layer on top (Figure 11b).
4.3. Thickness and Composition of the Functionalized Layers
4.3.1. Layer Thickness
Based on the ARXPS results the total thickness layer calculated on M-Gold samples with Equation (3) is 1.9 ± 0.3 nm (Table 4). The total thickness is the result of the sum of the contamination layer (lc), and the functionalization layer of MPTMS (t) as depicted in Figure 11. Exploiting Equation (3) considering the attenuation of the sulphur signal (Table 4), the total thickness results of 1.4 ± 0.3 nm, thus comprising the MPTMS layer and the contamination layer. Using the same equation and considering silicon, a thickness of 1.1 ± 0.2 nm has been calculated. This value consists of lc summed to the -OCH3 groups located at the outer part of the MPTMS layer. Avogadro software (version 1.2.0) calculations estimate the bond length of -OCH3 groups to be 0.2 nm; thus, the lc contamination layer thickness can be estimated to be 0.9 nm. As shown in Table 5, the thickness calculated of MPTMS layer t can be estimated to be equal to 0.5 nm (thickness calculated from the attenuation of the sulphur (1.4 nm) minus the lc estimated to be 0.9 nm). The chain length of the MPTMS molecule has been calculated by means of Avogadro software, and the distance between sulphur and silicon has been found to be 0.47 nm. The results are summarized in Table 5 and are in good agreement with the experimental data [28].
Table 5.
Summary of the thickness of the functionalized layer and the contamination layer on gold and on PVC (accuracy ± 0.2 nm).
Based on the results found on M-Gold samples, the same considerations have been made for A-Gold samples (Figure 11). Calculating the attenuation of sulphur signal with Equation (3) a layer thickness of 1.2 ± 0.4 nm was estimated (Table 4), including the MPTMS + APTES functionalization layer and the contamination layer. Based on the attenuation of nitrogen photoelectrons (emitted from the outer part of the functionalization layer), a layer thickness of 0.3 ± 0.1 nm was calculated. Thus, the contamination layer thickness lc can be estimated for A-Gold to be about 0.3 nm. Subtracting the contamination layer lc from the total thickness calculated considering sulphur, thus 1.2 nm, (Table 4), an overlayer thickness t of about 0.9–1 nm can be estimated (Table 5). The Avogadro simulation estimates a distance between sulphur of the MPTMS layer and the nitrogen of the APTES layer of 1 nm. The results are summarized in Table 5 and are in good agreement with the experimental data. In both cases of the functionalized gold surface and of MPTMS on PVC [28], the experimental results agree with the Avogadro simulations.
We note here a much lower thickness of the contamination layer lc on A-Gold (Table 5). This result might be attributed to the nitrogen atoms at the outermost surface of the functionalized A-Gold (Figure 11b) that can partially react with the atmospheric CO2, resulting in the formation of NHCOO carbamate as revealed by a small signal in the nitrogen N 1s spectrum (Figure 7c, Table 3) and in C 1s signal (Figure 7b, Table 3). The polar group of carbamate hinders the formation of a thick contamination layer, as has been found for the APTES monolayer on silicon substrate [23], where the thickness of the contamination layer is reported to range between 0.1 and 0.5 nm.
The thickness calculated with Au, S and Si for A-Gold samples are lower than the one calculated on M-Gold samples, these results can be explained considering the Avogadro calculation. In fact, the distance between silicon and nitrogen after the formation of the second layer with APTES measured by Avogadro is 0.44 nm, the attenuation of the N 1s electrons was estimated to be 0.3 nm, thus suggesting that assuming the formation of a second layer with a no-tilt angle, the total thickness of the APTES layer (APTES + lc) is around 0.74 nm, while a contamination layer of 0.9 nm was found on M-Gold. Moreover, the distance between sulphur atoms and silicon atoms measured on Avogadro after the addition of the APTES layer slightly decreases, and it is estimated by the software to be 0.41 nm and not 0.47 nm as estimated in the simulation of the MPTMS samples on gold.
4.3.2. Composition of the Functionalized Layers
Based on the models proposed for the functionalized surfaces M-Gold and A-Gold (Figure 11) the expected composition of the functionalized MPTMS and MPTMS + APTES surfaces can be calculated and compared with the data determined by XPS (Table 6). A very good agreement between the expected and the experimental values is found, thus substantiating the models proposed in Figure 11.
Table 6.
Experimental (mean value and standard deviation calculated over results obtained on three different areas of three independent samples) and calculated composition of the functionalized layers M-Gold and A-Gold.
In the M-Gold sample, the binding energy of the S 2p3/2 component was found to be 163.7 (0.1) eV (Table 2). In the literature, the Au-S bond for long-chain thiolate is reported to range between 162–163 eV [46]; the discrepancy between the literature and the experimental results may be related to the functionalization conditions adopted in this work and especially to the short immersion time of the gold substrate in the MPTMS solutions to mimic the conditions adopted in the case of food-grade PVC.
In the literature, the S 2p3/2 component at binding energy higher than the one ascribed to alkyl thiolate has been assigned to unbound thiolates [46] and/or to disulphides [47]. Some papers defined those compounds as physiosorbed molecules [47,48]. According to these authors, the high binding energy component should not be present in the S 2p spectra of “good quality SAM” and the physiosorbed molecules should be located at the SAM-ambient interface [48,49]. In this work, the presence of the component at 162 eV was not detected, but angle-resolved XPS data (Figure 8 and Figure 9) clearly indicate that the in-depth distribution of the functional groups follows the expected reaction schemes shown in Figure 1 and Figure 2. Recently, it was demonstrated that, in SAM obtained by solution deposition, the gold–sulfur bond has not a chemisorbed character and that hydrogen in -SH is retained [50]. On the other hand the presence of the electronegative O-Si-O functional group of MPTMS can also play a role in the observed chemical shift; in fact, similar binding energy (163.8 eV) has been reported for gold nanoparticles modified with MPTMS [51].
Tri-dimensional networking should also be taking into account because of the presence of water.
Changes in the molecular structure (Figure 11) might induce also changes in the binding energy of the different elements. After the grafting of APTES on M-Gold surface, the binding energy of the C-Si, CH2 as well as the Si 2p and S 2p signal slightly increased by 0.4 eV (Table 3, A-Gold) compared to M-Gold samples (Table 2). This chemical shift can be explained considering the cross-linking between the Si-O groups of MPTMS and APTES; in fact similar chemical shift for the silicon have been observed in the case of APTES monolayer on silicon oxide surface [52]. As mentioned in Section 4.3.1 Avogadro simulation suggest that after the formation of the APTES layer, the distance between sulphur atoms and the Si-O-Si groups decreases from 0.47 nm to 0.41 nm; thus, this can also justify the chemical shift in the S 2p signal. In fact, its BE can be affected by the proximity of the oxygen atoms of the Si-O-Si groups.
4.4. Parameter Identification for Developing a Transferable Analytical Strategy in Polymeric Systems
XPS and ARXPS characterization of functionalized surface layers on realistic substrates such as polymers or carbon-based materials modified with MPTMS and APTES is challenging due to the simultaneous presence of signals both from the substrate and the functionalized layers. The use of a freshly cleaved gold as carbon-free model substrate with an ideally flat surface is pivotal for the determination of the curve-fitting parameters, especially for the C 1s spectrum. Avoiding the interference of signals from carbon atoms present in the substrate (such as, e.g., PVC), the signals in the C1s spectrum can be assigned to the MPTMS/APTES functionalized layer only.
Processing XPS and ARXPS high-resolution spectra starts with background subtraction. In this work, the U 3 Tougaard background was selected to better simulate the required conditions for the polymer surface characterization [30]. Parameters for the subsequent curve-fitting procedure, especially signal shape (G/L ratio), FWHM and area ratios, were determined for all signals in the C 1s, O 1s, Si 2p, S 2p and N 1s high-resolution spectra. This allowed the identification of the components that can be assigned to the functionalization layer. The mechanism when grafting MPTMS with APTES was found to be a 2 MPTMS:1 APTES reaction as confirmed by the quantitative analysis. This analytical strategy has been successfully employed in characterizing an MPTMS monolayer on a food-grade PVC surface as described in a recent work [28]; more generally, it can be a powerful tool for characterizing the functionalized surface of more complex systems.
5. Conclusions
Based on these findings, the following conclusions can be drawn:
The detailed analysis of the XPS high-resolution spectra allowed for understanding of the overlayer formation of first MPTMS and then MPTMS + APTES onto freshly cleaved gold surfaces. The quantitative analysis suggests the functionalization of the gold surface with MPTMS was successful and homogeneous. The at% of the CH3O was found to be 4% instead of 12% expected from the stoichiometry, suggesting a three-dimensional cross-linking of the Si-O-Si bond. After the grafting of APTES onto the M-Gold surface, quantitative analysis was in good agreement with the stoichiometry considering an MPTMS:APTES ratio of 2:1.
Angle-resolved XPS allowed us to understand the in-depth distribution of the overlayer functional groups after the two functionalization steps. Based on these results a model of the functionalized surface was proposed and consists of a first layer of MPTMS (after the first step) with the Si-O groups facing the outer part of the surface. Following the grafting of the APTES onto the M-Gold surface ARXPS results indicate that APTES reacts with MPTMS through Si-O groups facing the amino groups in the outer part of the functionalization layer. Furthermore, through ARXPS it is possible to estimate the thickness of the MPTMS+APTES layer which is equal to 1 nm.
The analytical strategy presented in this work based on XPS and ARXPS by using gold as a carbon-free substrate represents a useful tool for a proper curve fitting of C 1s signal and layer thickness estimation to be adopted for similar systems with carbon-based substrate such as polymer.
Supplementary Materials
The following supporting information can be downloaded at: https://www.mdpi.com/article/10.3390/coatings14030327/s1, Table S1: Parameters used for the calculation of the relative sensitivity factors of the C 1s, Cl 2p, O 1s, S 2p, Si 2p, N 1s signals for M-Gold samples and A-Gold samples. Figure S1: example of angle signature acquired on Ag 3d5/2 peak at 150 eV pass energy; Figure S2: Example of survey spectrum of freshly cleaved gold sample; Figure S3: Example of survey spectrum of M-Gold samples; Figure S4: Example of survey spectrum of A-Gold sample; Figure S5: Angle-resolved high-resolution spectra of the Au 4f, C 1s, O 1s, S 2p and Si 2p of M-Gold samples; Figure S6: Apparent concentration (%) versus emission angle for M-Gold; Figure S7: Angle-resolved high-resolution spectra of the Au 4f, C 1s, O 1s, S 2p and Si 2p of A-Gold samples.
Author Contributions
G.C.: Writing—original draft, Validation, Investigation, Formal analysis, Data curation. M.F.: Writing—review and editing, Methodology, Conceptualization. B.E.: Writing—review and editing, Methodology, Conceptualization. A.R.: Writing—review and editing, Supervision, Project administration, Methodology, Funding acquisition, Conceptualization. All authors have read and agreed to the published version of the manuscript.
Funding
This research was funded by MIUR-Fondo per lo Sviluppo e la Coesione FSC-Piano Stralcio 2015/2017 for the Ph.D. grant assigned to Giulio Casula (Consortium UniCa and UniSS); —Project number CUP J89J20000930001 (2021): “Functionalization of Food Packaging with active antimicrobial agent” and to the University of Cagliari (UniCA) and Fondazione di Sardegna (FdS) for the financial support UNICA-FdS (Fondazione di Sardegna) 2019—Project number CUP J89J20000930001.
Institutional Review Board Statement
Not applicable.
Informed Consent Statement
Not applicable.
Data Availability Statement
Data will be made available on request.
Acknowledgments
The authors are grateful to Cristiana Passiu for the preparation of the gold surfaces used in this work.
Conflicts of Interest
The authors declare no conflicts of interest. The funders had no role in the design of the study; in the collection, analyses, or interpretation of data; in the writing of the manuscript; or in the decision to publish the results.
References
- Vericat, C.; Vela, M.E.; Benitez, G.; Carro, P.; Salvarezza, R.C. Self-Assembled Monolayers of Thiols and Dithiols on Gold: New Challenges for a Well-Known System. Chem. Soc. Rev. 2010, 39, 1805–1834. [Google Scholar] [CrossRef]
- Spencer, N.D. Tailoring Surfaces: Modifying Surface Composition and Structure for Applications in Tribology, Biology and Catalysis; Co-Published with Indian Institute of Science (IISc): Bangalore, India, 2011; ISBN 978-981-4289-42-9. [Google Scholar]
- Xia, Y.; Zhao, X.-M.; Whitesides, G.M. Pattern Transfer: Self-Assembled Monolayers as Ultrathin Resists. Microelectron. Eng. 1996, 32, 255–268. [Google Scholar] [CrossRef]
- Villanueva, M.E.; González, J.A.; Rodríguez-Castellón, E.; Teves, S.; Copello, G.J. Antimicrobial Surface Functionalization of PVC by a Guanidine Based Antimicrobial Polymer. Mater. Sci. Eng. C 2016, 67, 214–220. [Google Scholar] [CrossRef] [PubMed]
- Love, J.C.; Estroff, L.A.; Kriebel, J.K.; Nuzzo, R.G.; Whitesides, G.M. Self-Assembled Monolayers of Thiolates on Metals as a Form of Nanotechnology. Chem. Rev. 2005, 105, 1103–1170. [Google Scholar] [CrossRef] [PubMed]
- Gothe, P.K.; Gaur, D.; Achanta, V.G. MPTMS Self-Assembled Monolayer Deposition for Ultra-Thin Gold Films for Plasmonics. J. Phys. Commun. 2018, 2, 035005. [Google Scholar] [CrossRef]
- Piwoński, I.; Grobelny, J.; Cichomski, M.; Celichowski, G.; Rogowski, J. Investigation of 3-Mercaptopropyltrimethoxysilane Self-Assembled Monolayers on Au(111) Surface. Appl. Surf. Sci. 2005, 242, 147–153. [Google Scholar] [CrossRef]
- Kumar, S.; Soni, S.; Danowski, W.; van Beek, C.L.F.; Feringa, B.L.; Rudolf, P.; Chiechi, R.C. Correlating the Influence of Disulfides in Monolayers across Photoelectron Spectroscopy Wettability and Tunneling Charge-Transport. J. Am. Chem. Soc. 2020, 142, 15075–15083. [Google Scholar] [CrossRef]
- Lees, W.J.; Whitesides, G.M. Equilibrium Constants for Thiol-Disulfide Interchange Reactions: A Coherent, Corrected Set. J. Org. Chem. 1993, 58, 642–647. [Google Scholar] [CrossRef]
- Azzam, W.; Bashir, A.; Biedermann, P.U.; Rohwerder, M. Formation of Highly Ordered and Orientated Gold Islands: Effect of Immersion Time on the Molecular Adlayer Structure of Pentafluorobenzenethiols (PFBT) SAMs on Au(111). Langmuir 2012, 28, 10192–10208. [Google Scholar] [CrossRef]
- Cortés, E.; Rubert, A.A.; Benitez, G.; Carro, P.; Vela, M.E.; Salvarezza, R.C. Enhanced Stability of Thiolate Self-Assembled Monolayers (SAMs) on Nanostructured Gold Substrates. Available online: https://pubs.acs.org/doi/full/10.1021/la804251a (accessed on 12 February 2024).
- Yang, Y.; Qing, Y.; Hao, X.; Fang, C.; Ouyang, P.; Li, H.; Wang, Z.; Liao, Y.; Fang, H.; Du, J. APTES-Modified Remote Self-Assembled DNA-Based Electrochemical Biosensor for Human Papillomavirus DNA Detection. Biosensors 2022, 12, 449. [Google Scholar] [CrossRef]
- Villanueva, M.E.; Salinas, A.; González, J.A.; Teves, S.; Copello, G.J. Dual Antibacterial Effect of Immobilized Quaternary Ammonium and Aliphatic Groups on PVC. New J. Chem. 2015, 39, 9200–9206. [Google Scholar] [CrossRef]
- Krishna, D.N.G.; Philip, J. Review on Surface-Characterization Applications of X-ray Photoelectron Spectroscopy (XPS): Recent Developments and Challenges. Appl. Surf. Sci. Adv. 2022, 12, 100332. [Google Scholar] [CrossRef]
- Watts, J.F.; Wolstenholme, J. An Introduction to Surface Analysis by XPS and AES; John Wiley & Sons: Chichester, UK, 2019; ISBN 978-1-119-41758-3. [Google Scholar]
- Briggs, D. Surface Analysis of Polymers by XPS and Static SIMS; Cambridge Solid State Science Series; Cambridge University Press: Cambridge, UK, 1998; ISBN 978-0-521-35222-2. [Google Scholar]
- Afanas’ev, V.P.; Selyakov, D.N.; Ridzel, O.Y.; Semenov-Shefov, M.A.; Strukov, A.N. Investigation of Monolayer and Submonolayer Films Using X-ray Photoelectron Spectroscopy. J. Phys. Conf. Ser. 2020, 1713, 012002. [Google Scholar] [CrossRef]
- Parry, K.L.; Shard, A.G.; Short, R.D.; White, R.G.; Whittle, J.D.; Wright, A. ARXPS Characterisation of Plasma Polymerised Surface Chemical Gradients. Surf. Interface Anal. 2006, 38, 1497–1504. [Google Scholar] [CrossRef]
- Spori, D.M.; Venkataraman, N.V.; Tosatti, S.G.P.; Durmaz, F.; Spencer, N.D.; Zürcher, S. Influence of Alkyl Chain Length on Phosphate Self-Assembled Monolayers. Langmuir 2007, 23, 8053–8060. [Google Scholar] [CrossRef]
- Chen, H.; Heng, C.K.; Puiu, P.D.; Zhou, X.D.; Lee, A.C.; Lim, T.M.; Tan, S.N. Detection of Saccharomyces Cerevisiae Immobilized on Self-Assembled Monolayer (SAM) of Alkanethiolate Using Electrochemical Impedance Spectroscopy. Anal. Chim. Acta 2005, 554, 52–59. [Google Scholar] [CrossRef]
- Gates, B.D.; Xu, Q.; Stewart, M.; Ryan, D.; Willson, C.G.; Whitesides, G.M. New Approaches to Nanofabrication: Molding, Printing, and Other Techniques. Chem. Rev. 2005, 105, 1171–1196. [Google Scholar] [CrossRef] [PubMed]
- Penna, A.; Careri, M.; Spencer, N.D.; Rossi, A. Effects of Tailored Surface Chemistry on Desorption Electrospray Ionization Mass Spectrometry: A Surface-Analytical Study by XPS and AFM. J. Am. Soc. Mass Spectrom. 2015, 26, 1311–1319. [Google Scholar] [CrossRef] [PubMed]
- Graf, N.; Yegen, E.; Gross, T.; Lippitz, A.; Weigel, W.; Krakert, S.; Terfort, A.; Unger, W.E.S. XPS and NEXAFS Studies of Aliphatic and Aromatic Amine Species on Functionalized Surfaces. Surf. Sci. 2009, 603, 2849–2860. [Google Scholar] [CrossRef]
- Walton, J.; Alexander, M.R.; Fairley, N.; Roach, P.; Shard, A.G. Film Thickness Measurement and Contamination Layer Correction for Quantitative XPS. Surf. Interface Anal. 2016, 48, 164–172. [Google Scholar] [CrossRef]
- Naik, V.V.; Crobu, M.; Venkataraman, N.V.; Spencer, N.D. Multiple Transmission-Reflection IR Spectroscopy Shows That Surface Hydroxyls Play Only a Minor Role in Alkylsilane Monolayer Formation on Silica. J. Phys. Chem. Lett. 2013, 4, 2745–2751. [Google Scholar] [CrossRef]
- Passiu, C.; Rossi, A.; Bernard, L.; Paul, D.; Hammond, J.; Unger, W.E.S.; Venkataraman, N.V.; Spencer, N.D. Fabrication and 634 Microscopic and Spectroscopic Characterization of Planar, Bimetallic, Micro- and Nanopatterned Surfaces. Langmuir 2017, 33, 5657–5665. [Google Scholar] [CrossRef]
- Passiu, C.; Rossi, A.; Weinert, M.; Tysoe, W.; Spencer, N.D. Probing the Outermost Layer of Thin Gold Films by XPS and Density Functional Theory. Appl. Surf. Sci. 2020, 507, 145084. [Google Scholar] [CrossRef]
- Casula, G.; Fantauzzi, M.; Elsener, B.; Rossi, A. Surface Modification of Food-Grade PVC Monitored by Angle-Resolved XPS. Vacuum 2024, 222, 113010. [Google Scholar] [CrossRef]
- ISO 15472:2010; Surface Chemical Analysis X-ray Photoelectron Spectrometers Calibration of Energy Scales. ISO: Geneve, Switzerland, 2010.
- Tougaard, S. Practical Guide to the Use of Backgrounds in Quantitative XPS. J. Vac. Sci. Technol. A 2021, 39, 011201. [Google Scholar] [CrossRef]
- Scofield, J.H. Hartree-Slater Subshell Photoionization Cross-Sections at 1254 and 1487 eV. J. Electron Spectrosc. Relat. Phenom. 1976, 8, 129–137. [Google Scholar] [CrossRef]
- Zommer, L. Determination of the Spectrometer Transmission Function for XPS Quantitative Analysis. Vacuum 1995, 46, 617–620. [Google Scholar] [CrossRef]
- Seah, M.P.; Dench, W.A. Quantitative Electron Spectroscopy of Surfaces: A Standard Data Base for Electron Inelastic Mean Free Paths in Solids. Surf. Interface Anal. 1979, 1, 2–11. [Google Scholar] [CrossRef]
- Gunter, P.L.J.; Gijzeman, O.L.J.; Niemantsverdriet, J.W. Surface Roughness Effects in Quantitative XPS: Magic Angle for Determining Overlayer Thickness. Appl. Surf. Sci. 1997, 115, 342–346. [Google Scholar] [CrossRef]
- Engelhard, M.H.; Baer, D.R.; Herrera-Gomez, A.; Sherwood, P.M.A. Introductory Guide to Backgrounds in XPS Spectra and Their Impact on Determining Peak Intensities. J. Vac. Sci. Technol. A 2020, 38, 063203. [Google Scholar] [CrossRef]
- Fairley, N.; Fernandez, V.; Richard-Plouet, M.; Guillot-Deudon, C.; Walton, J.; Smith, E.; Flahaut, D.; Greiner, M.; Biesinger, M.; Tougaard, S.; et al. Systematic and Collaborative Approach to Problem Solving Using X-Ray Photoelectron Spectroscopy. Appl. Surf. Sci. Adv. 2021, 5, 100112. [Google Scholar] [CrossRef]
- Fracassi, A.; Ray, A.; Nakatsuka, N.; Passiu, C.; Tanriver, M.; Schauenburg, D.; Scherrer, S.; Ouald Chaib, A.; Mandal, J.; Ramakrishna, S.N.; et al. KAT Ligation for Rapid and Facile Covalent Attachment of Biomolecules to Surfaces. ACS Appl. Mater. Interfaces 2021, 13, 29113–29121. [Google Scholar] [CrossRef]
- Li, Y.-S.; Lu, W.; Wang, Y.; Tran, T. Studies of (3-Mercaptopropyl)Trimethoxylsilane and Bis(Trimethoxysilyl)Ethane Sol–Gel Coating on Copper and Aluminum. Spectrochim. Acta Part A Mol. Biomol. Spectrosc. 2009, 73, 922–928. [Google Scholar] [CrossRef]
- da Silva, F.S.; de Melo, H.G.; Benedetti, A.V.; Suegama, P.H. Influence of Ce(IV) Ions Amount on the Electrochemical Behavior of Organic-Inorganic Hybrid Coatings in 0.1 Mol L-1 NaCl Solution. Eclética Química 2019, 44, 27–56. [Google Scholar]
- Ederer, J.; Janoš, P.; Ecorchard, P.; Tolasz, J.; Štengl, V.; Beneš, H.; Perchacz, M.; Pop-Georgievski, O. Determination of Amino Groups on Functionalized Graphene Oxide for Polyurethane Nanomaterials: XPS Quantitation vs. Functional Speciation. RSC Adv. 2017, 7, 12464–12473. [Google Scholar] [CrossRef]
- Stegmeier, S.; Fleischer, M.; Tawil, A.; Hauptmann, P.; Egly, K.; Rose, K. Mechanism of the Interaction of CO2 and Humidity with Primary Amino Group Systems for Room Temperature CO2 Sensors. Procedia Chem. 2009, 1, 236–239. [Google Scholar] [CrossRef]
- Hill, J.M.; Royce, D.G.; Fadley, C.S.; Wagner, L.F.; Grunthaner, F.J. Properties of Oxidized Silicon as Determined by Angular-Dependent X-Ray Photoelectron Spectroscopy. Chem. Phys. Lett. 1976, 44, 225–231. [Google Scholar] [CrossRef]
- Brundle, C.R.; Conti, G.; Mack, P. XPS and Angle Resolved XPS, in the Semiconductor Industry: Characterization and Metrology Control of Ultra-Thin Films. J. Electron Spectrosc. Relat. Phenom. 2010, 178–179, 433–448. [Google Scholar] [CrossRef]
- Sui, W.; Zhao, W.; Zhang, X.; Peng, S.; Zeng, Z.; Xue, Q. Comparative Anti-Corrosion Properties of Alkylthiols SAMs and Mercapto Functional Silica Sol–Gel Coatings on Copper Surface in Sodium Chloride Solution. J. Sol-Gel Sci. Technol. 2016, 80, 567–578. [Google Scholar] [CrossRef]
- Sypabekova, M.; Hagemann, A.; Rho, D.; Kim, S. Review: 3-Aminopropyltriethoxysilane (APTES) Deposition Methods on Oxide Surfaces in Solution and Vapor Phases for Biosensing Applications. Biosensors 2023, 13, 36. [Google Scholar] [CrossRef]
- Castner, D.G.; Hinds, K.; Grainger, D.W. X-Ray Photoelectron Spectroscopy Sulfur 2p Study of Organic Thiol and Bisulfide Binding Interactions with Gold Surfaces. Langmuir 1996, 12, 5083–5086. [Google Scholar] [CrossRef]
- Cristina, L.J.; Ruano, G.; Salvarezza, R.; Ferrón, J. Thermal Stability of Self-Assembled Monolayers of n-Hexanethiol on Au(111)-(1 × 1) and Au(001)-(1 × 1). J. Phys. Chem. C 2017, 121, 27894–27904. [Google Scholar] [CrossRef]
- Watcharinyanon, S.; Nilsson, D.; Moons, E.; Shaporenko, A.; Zharnikov, M.; Albinsson, B.; Mårtensson, J.; Johansson, L.S.O. A Spectroscopic Study of Self-Assembled Monolayer of Porphyrin-Functionalized Oligo(Phenyleneethynylene)s on Gold: The Influence of the Anchor Moiety. Phys. Chem. Chem. Phys. 2008, 10, 5264–5275. [Google Scholar] [CrossRef] [PubMed]
- Jia, J.; Kara, A.; Pasquali, L.; Bendounan, A.; Sirotti, F.; Esaulov, V.A. On Sulfur Core Level Binding Energies in Thiol Self-Assembly and Alternative Adsorption Sites: An Experimental and Theoretical Study. J. Chem. Phys. 2015, 143, 104702. [Google Scholar] [CrossRef] [PubMed]
- Inkpen, M.S.; Liu, Z.-F.; Li, H.; Campos, L.M.; Neaton, J.B.; Venkataraman, L. Non-Chemisorbed Gold–Sulfur Binding Prevails in Self-Assembled Monolayers. Nat. Chem. 2019, 11, 351–358. [Google Scholar] [CrossRef]
- Wu, P.; Peng, B.; Yan, Z.; Zhao, X. Gold Nanoparticles Supported on Mesoporous Silica: Origin of High Activity and Role of Au NPs in Selective Oxidation of Cyclohexane. Sci. Rep. 2016, 6, 18817. [Google Scholar] [CrossRef]
- Dietrich, P.M.; Glamsch, S.; Ehlert, C.; Lippitz, A.; Kulak, N.; Unger, W.E.S. Synchrotron-Radiation XPS Analysis of Ultra-Thin Silane Films: Specifying the Organic Silicon. Appl. Surf. Sci. 2016, 363, 406–411. [Google Scholar] [CrossRef]

Disclaimer/Publisher’s Note: The statements, opinions and data contained in all publications are solely those of the individual author(s) and contributor(s) and not of MDPI and/or the editor(s). MDPI and/or the editor(s) disclaim responsibility for any injury to people or property resulting from any ideas, methods, instructions or products referred to in the content. |
© 2024 by the authors. Licensee MDPI, Basel, Switzerland. This article is an open access article distributed under the terms and conditions of the Creative Commons Attribution (CC BY) license (https://creativecommons.org/licenses/by/4.0/).