Article

A CFD-DEM Simulation of Droplets in an Airless Spray Coating Process of a Square Duct

1
China Construction Power and Environment Engineering Co., Ltd., Nanjing 210012, China
2
China Construction Eco-Environmental Protection Technology Co., Ltd., Suzhou 215124, China
*
Author to whom correspondence should be addressed.
Coatings 2024, 14(3), 282; https://doi.org/10.3390/coatings14030282
Submission received: 22 January 2024 / Revised: 16 February 2024 / Accepted: 19 February 2024 / Published: 26 February 2024
(This article belongs to the Section Corrosion, Wear and Erosion)

Abstract

:
The purpose of this paper is to provide a numerical simulation, taking into account the collisional interactions of droplets in an airless rotary spray coating process. The hydrodynamics of gas and droplets are simulated using the CFD-discrete element method (DEM) with the JKR contact model in an airless rotary spray coating process of a horizontal square duct. The surface energy parameter used in the JKR model is calibrated using a virtual accumulation angle test in the funnel device. Based on the distribution of accumulation angles, a suitable surface energy for wall droplets is proposed. A rational gas RNG k-ε model is suggested in accordance with the comparisons of velocities, standard deviations, and the skewness of droplet number fractions from three turbulence models. The simulations of droplet film thicknesses agree with measurements from the literature regarding the film thickness along a vertical panel. The correlations of the exit gas and droplet velocities of sprayer holes are proposed with a discharge coefficient of 0.85 for gas and 5.87 for droplets. A number index of droplets is introduced in order to measure the uniformity of droplet distributions. A low droplet number index is found at low rotational speeds, representing a more uniform distribution of droplets as the rotation speeds reduce within the square duct. The normal force between the droplet and the wall is approximately an order of magnitude larger than the droplet–wall tangential force of collisions.

Graphical Abstract

1. Introduction

Paint spray coating processes with excellent material anticorrosion properties are widely used in different processes of industrial painting, including the corrosion protections of fluid transport pipelines, such as drainage pipes [1,2,3]. The objective of anticorrosion spray coating is to adhere a paint film to a metallic surface in order to protect it from possible corrosion. In paint droplet coating, several methods exist, including air and airless spray processes [4,5,6,7]. In the air spray process, compressed air and paint enter a gun, and paint droplets are ejected through air nozzles towards a target surface to form a film of paint. In the airless spray process, paint fluid is released via a pump at a high pressure, causing paint droplets to be ejected onto a target surface where they spread into a paint film. In both droplet spray coating processes, the formation of paint film relates to the dynamics of paint droplets leaving the sprayer nozzles, with the aim of protecting the metal surface from corrosion.
In this project, we investigate the dynamics of paint droplets using computational fluid dynamics (CFD) in an airless spray coating process of a horizontal square duct. An airless spray coating system, as shown in Figure 1a,b, has three main parts: an electric motor, a paint droplet supplier, and an airless rotary sprayer. The motor transmits torque to the rotary sprayer, causing it to rotate. The paint supplier is a hydraulic atomization device. The paint fluid is forced by a high-pressure paint pump to coerce the generation of paint droplets as the fluid passes through the cylindrical nozzle of the hydraulic atomizer [8,9]. Hydraulic atomization is applied due to its geometrical simplicity compared to mechanical atomization devices [10]. The rotary sprayer is a hollow cone with a number of holes, as shown in Figure 1b,c. The inner and outer spaces of the rotary sprayer are named chamber I and chamber II. As paint droplets enter chamber I from the supplier, they accumulate at the inner wall of this chamber due to the centrifugal force originating from the rotating sprayer. As a result of the high-speed rotation of the sprayer, paint droplets are ejected through the holes. These paint droplets penetrate through chamber II, impacting the inner wall of the square duct. Finally, a paint film is formed as the paint droplets are deposited onto the duct wall. Therefore, the rotary sprayer serves to accelerate the speed of the paint droplets to enable them to be capable of overcoming flow resistance and energy dissipation, thus allowing effective droplet collisions. This suggests that the paint droplet spray coating process relates to the collisional interaction of paint droplets and the hydrodynamic interactions of gas and paint droplets within chamber I and II, which are influenced by the changing rotation of the rotary sprayer.
With increasing computational power, simulations for fluid–droplet mixture flows are becoming more and more realistic and relevant. Using a flat jet gun, the hydrodynamics of droplets were simulated using the CFD Fluent code [11]. The air phase was modeled according to the conservation equations of mass and momentum, and the trajectories of the droplets were modeled by means of the Lagrangian tracking method. The realizable k-ε model was used to model the transport of turbulent gas. By using a high-speed rotary bell sprayer, the droplet breakup in the spray painting process was modeled by the Euler–Lagrange method [12]. The Fluent code utilized the volume of fluid method to model the gas–droplet interface. Both the film formation on the sprayer surface and the air flow around the rotary bell sprayer were predicted using the Lagrange method. Using a paint gun, the spray deposition of droplets from a coaxial jet arrangement was modeled in the paint gun spraying process [13]. The droplet motion as it exited the gun was tracked using the Lagrange method of the Fluent code. The droplet film was predicted with different wall inclinations. The droplet transfer efficiency was simulated using a multiscale method alongside the gas phase standard k-ε turbulence model [14]. The droplet collisions were simulated using a statistical approach. The coating thickness and droplet trajectories were predicted using an air-assisted spray gun [15]. The droplet trajectories were modeled using a discrete phase model in the Fluent code. The thickness of the coating film was simulated using the Euler–Lagrange method with a Rosin–Rammbler atomization model in an airless spraying process [16]. The effect of the mixer blade orientations on the spray–wall interaction was simulated using the Euler–Lagrange method in a channel [17]. The gas standard k-ω model was used to simulate swirling airflow characteristics, while discrete particle modeling was employed to track the spray droplets. The wall film model was adopted to model droplet wall-film formation. The effect of momentum ratios of the liquid–gas pintle injector on spray characteristics was studied using the Euler–Lagrangian particle tracking method [18]. The predicted droplet diameter distribution using OpenFOAM code was compared to experimental data in the spray atomization. The formation of coating film was modeled using the Euler–Euler approach in the static spraying and dynamic spraying processes [19]. The film formation and thickness distribution were predicted in a V-shaped surface with an air cap of a spray gun. The simulated film thicknesses were in agreement with experimental measurements. The film formation and thickness were simulated by the Euler–Euler method in the airless spraying process [20]. The simulated characteristics and coating film of the spray flow field were compared to experimental measurements. Wu et al. [21] provided a comprehensive review of CFD simulations of atomization characteristics and film formation mechanisms using Euler–Lagrange and Euler–Euler methods in air and airless spraying processes. As mentioned above, the interactions of droplet–droplet and wall–droplet collisions did not account for simulations of droplet deposition of the walls during coating processes. Recently, the discrete element method (DEM) was applied to model the motion of droplets since the interaction of collisions has a major effect on droplet trajectories in the coating processes [22,23,24,25]. In DEM, the motion of individual droplets is tracked in space and time according to the sum of normal and tangential contact forces acting on droplets, using a set of force–displacement expressions combined with friction laws [26]. To simulate the effect of cohesion force on motion of droplets, the capillary force induced by a liquid bridge is taken into account in CFD-DEM simulations. The capillary force relates to the separation distance and surface tension of droplets. The coating mass distributions were predicted using CFD-DEM with the coarse-grained parcel method in a top-spray fluidized bed coater [27]. The abovementioned simulations indicate that CFD-DEM simulation is a suitable tool to analyze interactions of droplet–droplet and droplet–wall collisions in droplet spray coating processes.
The purpose of the present study is to model the effect of rotation speed of a rotary sprayer on droplet collision interactions in a droplet spray coating process using the CFD-DEM approach. We focus on the collisional interactions between the droplets and wall since this contact behavior of droplets has not been previously examined in the droplet spray coating processes. The Hertz–Mindlin with JKR cohesion contact model is used to model collisions of droplets, and the RNG k-ε model is applied to model gas turbulent transport. The droplet velocities and droplet–wall collisional forces are predicted with changing rotary sprayer rotation speeds. It is expected that the knowledge of the contact interactions of droplet–droplet and wall–droplet collisions is very valuable for the improvement of airless droplet spray coating processes.

2. Governing Equations

2.1. Gas Phase Equations

For an airless rotary spray process, air flow is induced by high-speed rotation of the sprayer. The gas phase governing equations are expressed according to mass and momentum conservations. The gas phase mass and momentum equations can be written as follows:
ρ f t + x i ( ρ f u i ) = 0
t ( ρ f u i ) + x j ( ρ f u j u i ) = p x i + τ i j x j + i = 1 n π d 2 8 C d ρ f u i v i ( u i v i ) V i + ρ f g i
where t is the time. ρf and p are the gas density and pressure. u is the volume-averaged gas velocity. v and d are the droplet velocity and diameter. g is the gravitational acceleration. V is the cell volume. Cd is the drag coefficient between the gas phase and droplet, and is expressed as a function of Reynolds number.
C d = 24 / Re     Re < 1.0 24 Re ( 1 + 0.1 Re 0.75 ) 1.0 Re 1000
The effective gas shear stress tensor τ relates to gas kinematic viscosity μf and turbulent viscosity μt. The RNG k-ε model is applied to model gas turbulent viscosity using the renormalization group method as the function of turbulent kinetic energy k and turbulent dissipation ε [28,29]. The transport equations for k and ε can be written as follows:
t ( ρ f k ) + x j ( ρ f k u j ) = x j [ ( μ f + μ t σ k ) k x j ] + G k ρ f ε
t ( ρ f ε ) + x j ( ρ f ε u j ) = x j [ ( μ f + μ t σ ε ) ε x j ] + ρ f C 1 2 S i j S i j ε k ρ f C 2 ε 2 k
where Gk represents the generation of gas turbulence kinetic energy due to the mean velocity gradients. σk and σε are the turbulent Prandtl numbers for the kinetic energy k and dissipation ε. S is the gas mean rate-of-strain tensor. C1 and C2 are constants, and they are 1.42 and 1.68.

2.2. Motion Equation of Droplets

It is assumed that the mono-sized droplets are spherical with mass m. The collision forces include contact forces of droplet–droplet and droplet–wall surface. The trajectory of individual droplets is resolved using the Newtonian equations of motion. The equations for determining droplet linear velocity v and angular velocity ω are as follows [30,31,32,33]:
m i d v j , i d t = k = 1 , i k N f c , i k + π d 2 8 C d ρ f u j v j , i ( u j v j , i ) + m i g j
I p , i d ω j , i d t = k = 1 , i k N T i k
where fc and T denote the droplet contact force and torque. Ip is the inertia moment of droplets.
For contact forces of droplets, the Hertz–Mindlin with JKR cohesion contact model [34] is used to model the contact interactions of droplets in this study. In this model, the effect of van der Waals and capillary forces on contact interaction is taken into account in the contact zone. From Johnson–Kendall–Roberts theory [35,36], both normal and tangential contact forces relate to droplet overlap δ and surface energy γ in the following forms:
f n , J K R = [ 4 π γ E * a 3 / 2 + 4 E * 3 R * a 3 ] 2 5 6 β 2 m * E * ( R * δ n ) 0.5 ν n , r e l
f t , J K R = min [ μ s f n , J K R , 8 E * R * δ n δ t 2 5 6 β 8 E * m * ( R * δ n ) 0.5 ν t , r e l ]
a 2 R * = δ + 4 π γ a E *
β = ln e ln 2 e + π 2
where e and µs represent the coefficients of restitution and static friction, respectively. a denotes the contact radius. The equivalent droplet radius R*, mass m*, and E* are expressed in terms of droplet radius R and mass m, Young modulus E, and Poisson ratio υ.
R * = [ 1 R i + 1 R k ] 1
m * = [ 1 m i + 1 m k ] 1
E * = [ ( 1 υ i 2 ) E i + ( 1 υ k 2 ) E k ] 1
The relative velocity between colliding droplets is calculated from the liner velocity v and angular velocity ω at the contact point:
v n , r e l = ( ν i k n i k ) n i k
v t , r e l = n i k × ( n i k × ν i k )
ν i k = v i v k + ( R i ω i + R k ω k ) × n i k
where nik is the normal unit vector.

2.3. Motion of Rotary Sprayer

The main function of the rotary sprayer is to blast droplets through centrifugal force. Shown in Figure 1a,b, droplets pass from chamber I to chamber II through holes located at the sprayer wall. According to the sprayer rotation speed Ω, the local linear velocity components at the sprayer wall (x, y, z) are expressed as
u w , x = Ω z , u w , y = 0 , u w , z = Ω x
This indicates that the local sprayer wall velocity components vary with sprayer rotation. The local contact forces of droplets touching the sprayer wall are calculated according to instantaneous position (x, y, z) and relative velocities between the droplet and the rotary sprayer wall.

2.4. Boundary and Calculation Conditions

Simulated performance of the droplet spray coating process is shown in Figure 1a,b in a horizontal square duct. The smaller and larger outer diameters of the cone rotary sprayer are 7.5 mm and 12.5 mm, with length and wall thickness of 12.0 mm and 1.0 mm. The hole diameter is 2.0 mm. The total number of holes is 16 for sprayer I and 32 for sprayer II from ring I to ring IV, as shown in Figure 1c. The height and width of the square duct are 40.5 mm and 40.5 mm with the length of 32.0 mm. The no-slip boundary condition of gas phase is used at the duct wall, and the moving boundary condition is used to specify the rotational speed of the sprayer wall. The inlet gas velocity of the square duct is zero, and the inlet droplet mass flow of the sprayer is specified as the inlet boundary condition. The initial droplets are randomly positioned at the sprayer inlet. The exit gas pressure of 101.330 kPa is used as the pressure exit boundary condition of the square duct. Table 1 lists the parameters used in numerical simulations.
The gas velocities and droplet trajectories are solved using a Fluent–EDEM coupled code [37,38]. In the Fluent–EDEM method, the gas flow induced by rotation of rotary sprayer is resolved using the governing equations of gas phase mass and momentum using Fluent code. For motion of droplets, the trajectories are resolved, and the dynamics of droplets account for collisional interactions between droplet–droplet, droplet–sprayer wall, and droplet–duct wall using EDEM code. EDEM complements the Fluent solid phase by adding momentum transfer term to the gas phase model. The coupling allows Fluent and EDEM to run in co-simulation environments. For gas phase, the time step Δt is 1.0 × 10⁻⁵ s in Fluent. The time step Δtd of droplets is selected according to the droplet mass and spring stiffness in EDEM [38,39]. In this study, the time step Δtd is 1.0 × 10⁻⁷ s, and the CPU time required for one case is about 2–3 days on a PC computer with 500 GB hard disk and 3.3 GHz CPU.

3. Selections of Discrete Element Parameter and Gas Turbulence Model

For simulations of flow of gas and droplets mixture, the Fluent–EDEM method involves gas turbulence model and discrete element parameters. Hence, the choice of gas turbulent model and discrete element parameters is the first step in the numerical simulations of the spray coating process using the Fluent–EDEM method.

3.1. Virtual Calibration Test of Surface Energy

Two types of discrete element parameters are involved in the Hertz–Mindlin with JKR contact model [40]. One is the contact parameters, including modulus, Poisson ratio, restitution coefficient, and static friction coefficient. These parameters are related to the properties of the contact materials, and can be measured by experiments or calibrated by employing computational simulations. The other is the model parameters, which includes the wall–paint droplet surface energy. This can be calibrated by means of virtual simulations in the absence of experimental measurements.
In present study, the wall–paint droplet surface energy parameters in the Hertz–Mindlin with JKR contact model are calibrated using a virtual simulation test. Generally speaking, the virtual simulations include plate sinkage (PS) test [41], direct shear (DS) test [42,43], and angle of repose (AoR) test [44,45]. The PS test is modeled using compaction behavior as a function of spring coefficients, whereas the DS test is modeled by shear strength as a function of different friction coefficients. The repose angle relates closely to surface energy, and can characterize flow properties. Therefore, the virtual AoR test is chosen to calibrate the wall–paint droplet surface energy of paint droplet spray coating process.
Using EDEM code, a series of the virtual AoR test is performed using a funnel device, as shown in Figure 2. The funnel device consists of a horizontal flat plate located at the bottom, and a storage bin located at the top. The storage bin is a discharge port for paint droplets with small and large diameters of 3.0 mm and 5.0 mm, and height of 0.5 mm. The flat plate diameter is 30 mm. The distance between the flat plate and the storage bin is 15.0 mm.
The virtual AoR test of droplets is separated into two phases. The first phase is the creation of paint droplets packing during the dropping process. The droplets are generated randomly in the storage bin. Then, they fall toward the horizontal flat plate due to gravity. The second phase is the accumulation of paint droplets during the collection process. Here, droplets pile gradually on the flat plate until an accumulation of droplets is formed. The accumulation angles of the paint droplet pile are calculated from the left and right directions. The average repose angle θ is calculated from four virtual calibration tests, corresponding to specified wall–paint droplet surface energy.
Figure 2 shows the creation and repose of accumulation of droplets in the funnel device. The restitution coefficient e is 0.7, and the coefficients of static frictions μsf and rolling frictions μrf are 0.3 and 0.1 for both paint droplet and flat plate. The wall–droplet surface energy is 100 J/m2. At t = 0.09 and 0.18 s, droplets fall downwards from the storage bin to the flat plate at the initial velocity of 0.01 m/s. Droplets move along a horizontal direction after they touch the flat plate. On the other hand, droplets pile as a form of accumulation because of the kinetic energy loss during contact between the flat plate and the droplets. Finally, a droplet pile appears with a stagnant zone at t = 0.35 s. The averaged accumulation angle θ is 16.5 degrees with the standard deviation of 7.2 degrees from four virtual simulation tests.
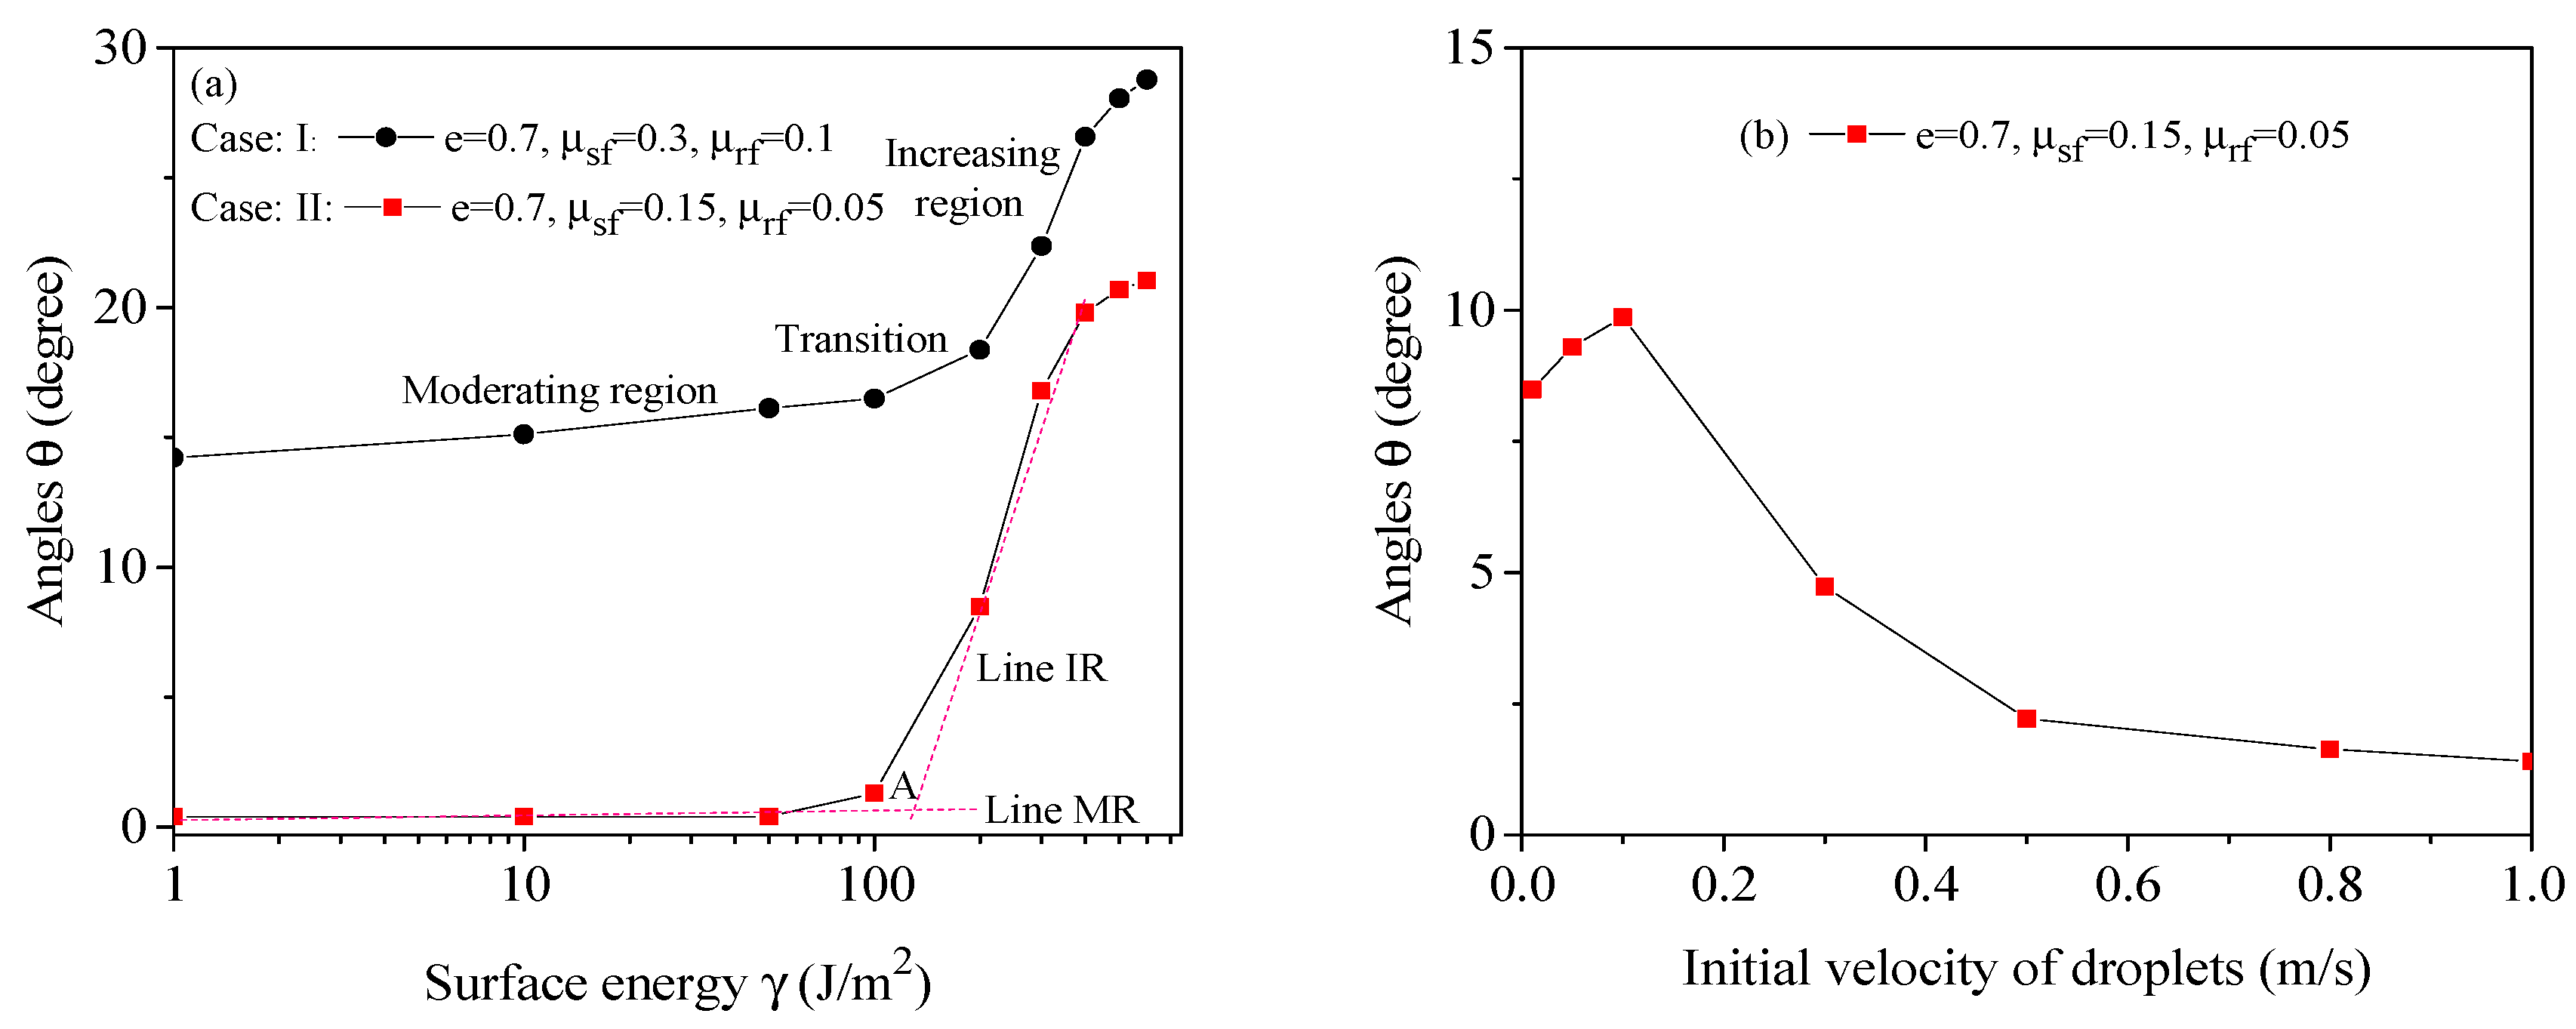
Figure 3a shows the profile of accumulation angles of droplets as a function of wall–droplet surface energies. The paint droplet accumulation angle increases with increasing surface energies. In the Hertz–Mindlin with JKR contact model, the surface energy is introduced to measure energy dissipation during paint droplet contact. The higher the surface energy is, the larger the accumulation angle is, resulting in a high height of the paint droplet pile. On the other hand, the accumulation angle is low at the surface energy range of 1.0 to 50 J/m2. In case I, the droplet accumulation angles change from a moderating region, transitioning to an increasing region. Finally, it gradually increases with increase in surface energy from 400 to 600 J/m2. In the moderating region, the average AoR is about 15.2 degrees, indicating a paint droplet pile on the flat plate.
In case II, the AoR trends to zero with decreasing wall–paint droplet surface energy in the moderating region. A droplet layer is formed, representing a droplet film on the flat plate. On the other hand, the AoR becomes larger and larger with increasing surface energies, representing a paint droplet accumulation with multiple layers in the increasing region. Finally, the rate of change of AoR (i.e., Δθγ) reduces at high surface energy, representing the approximate upper limit of the accumulation angle at the surface energy range of 500 to 600 J/m2. The results produce a straight line in the increasing region using regression analysis. The relationship can be expressed approximately as
θ = 100.24 + 20.52 ln γ
The AoR trends to zero at point A, the intersection of two straight lines of line MR from the moderating region and line IR from the increasing region. Two regimes exist from the surface energy γA at point A (γA = 132.3 J/m2). One regime represents the formation of the paint droplet layer at γ < γA. The paint film is generated along the flat plate. The other regime represents paint droplet accumulation at γ > γA. This, therefore, suggests that the wall–paint droplet surface energy of 100.0 J/m2 used in the present work, which is less than the surface energy at point A, is acceptable for simulations of the paint droplet spray coating process.
Figure 3b shows the distributions of droplet accumulation angles as a function of droplet initial velocities from the storage bin. With increasing initial velocities of droplets, the AoR increases at first, and then declines. A multilayer of droplets is observed along the horizontal flat plate. This tendency, resulting from the change in velocity, originates from droplet mode of impact in the dropping process. The different impact modes of droplets as they hit the wall were reviewed [46], including adhesion, spread, and splash modes. These modes mainly relate to velocity of droplets perpendicular to the wall surface. The droplets spread on the wall surface at low impact velocities. On the other hand, they splash at high impact velocities as they collide with the wall surface. At low droplet initial velocity, the AoR is not sensitive to droplet velocities. However, an increase in the initial velocity affects the AoR of droplets. Hence, the effect of simulation parameters used in the virtual simulation test on droplet AoR is further investigated in the funnel device.
A summary of the literature of AoR data from virtual simulation tests using the discrete element method with JKR contact model is listed in Table 2. These virtual simulation tests are undertaken according to the change of particle-to-particle contact parameters used as input data in the JKR model. These indicate that the values of AoR depend on contact parameters used in the JKR model. Shi et al. [47] pointed out that the surface energy not only affected the simulated macroscopic AoR, but also had an impact on agglomeration of particles. From virtual simulations of optimal parameter combination, Xia et al. [48] found that the contact parameters of coal, surface energy and friction coefficient, had significant influence on repose angle, while the restitution coefficient had no influence on it. The calibrations using virtual simulation tests show that both particle–particle and particle–wall contact parameters have an influence on AoR of particles. These indicate that the droplet–droplet and droplet–wall friction coefficient and surface energy affect the deposition of droplets on the wall. Hence, further virtual simulation tests are required in this area to calibrate the effect of contact parameters used in the JKR model on AoRs of droplets in spray coating processes.

3.2. Selection of Gas Turbulent Model

In the Fluent–EDEM used, three different gas turbulence models, including realizable k-ε model [51], RNG k-ε model [52], and shear-stress transport (SST) k-ω model [53], are applied to simulate velocities of gas and droplets using the rotary sprayer I in the square duct. Figure 4a shows the distributions of gas velocity magnitude along the X line of the square duct at the rotation speed of 17,500 rpm. The gas flow is induced due to the high rotation speed of the airless rotary sprayer I. All gas turbulence models show that gas velocities are minimum at the center of X = 0 m, and increase towards the sprayer wall in chamber I. Gas penetrates through ring I–IV holes. In chamber II, three different regimes appear according to velocity variations, as shown in Figure 4b at the ring III plane using the RNG k-ε model. In the first regime near the sprayer wall at δ1, gas velocities are largest at the sprayer wall due to sprayer rotation, but decrease rapidly away from the sprayer wall. In the second regime at δ0, gas velocities are low, and remain almost constant. In the third regime near the duct wall at δ2, gas velocities increase, reach the maximum, and then decrease towards the duct wall along X line. All gas turbulence models predict that gas velocity magnitude is lowest at ring I and largest at ring IV. However, gas velocities using the RNG k-ε model and the SST k-ω model decrease at first, reach the minimum, and then increase along holes. Gas velocities at δ2 are larger than those at δ0, and can be referred to as the transition from low velocity at δ0 to high velocity at δ2, whereas gas velocities using the realizable k-ε model decrease along holes. These indicate that a difference exists when the three gas turbulence models are used along the X line.
Figure 5a shows the instantaneous exit droplet velocity magnitude of holes using three different gas turbulence models. Three different stages of droplet velocities exist at different times. At the first stage at time t0, the exit droplet velocities of holes start to vary from zero at the beginning of sprayer rotation. In the second stage of t1, the exit droplet velocities increase gradually, and then become stable at the third stage of t2. The exit droplet velocities oscillate due to the interaction between gas and droplets as they pass through the holes. The three gas turbulence models show that the instantaneous exit droplet velocities of holes are low at ring I and large at ring IV.
The time-averaged exit droplet velocities of holes are calculated, and are shown in Figure 5b. The exit droplet velocity magnitudes u from the three gas turbulence models are close to each other. However, some differences exist among them. The existing droplet velocity magnitude from the realizable k-ε model is lowest, while it is largest for the SST k-ω model. That of the RNG k-ε model falls in between them. The exit droplet velocity components ux and uz obtained from the realizable k-ε model are negative, but are positive from both the RNG k-ε model and the SST k-ω model. Contrastingly, the exit droplet velocity component uy from the realizable k-ε model is positive, and negative from both the RNG k-ε and SST k-ω models.
When droplets pass through chamber II, they stick to the square duct walls. The wall is divided into nine segments along its length. The droplet number Ni is determined in these segments. The droplet number fraction is defined as ni = Ni/N0, where N0 is the total droplet number in the wall. Figure 6a shows the distributions of droplet number fraction along the wall length using three different gas turbulence models. All models show that the droplet number fraction is low at the beginning and the end, and high at the middle along length of the bottom and top walls and height of the left and right walls.
The standard deviation and skewness of droplet number fractions are calculated using the following expressions.
σ = 1 m i = 1 m ( n i n m ) 2
S = ( m 1 ) ( m 2 ) m i = 1 m ( n i n m ) 3 σ 3
where nm is the mean value of droplet number fraction. Figure 6b shows the distributions of standard deviation and skewness of walls. In addition to the top wall, the standard deviation of droplet number fraction is largest using the realizable k-ε model, and lowest from the SST k-ω model. Its value from the RNG k-ε model falls in between them. Except for the left wall, the skewness using the RNG k-ε model falls in between those obtained from the realizable k-ε and SST k-ω models in the right, bottom, and top walls.
In summary, all these gas turbulence models allow the representation of gas turbulent transport in the airless spray coating process. A summary of simulations performed with three different gas turbulence models is presented in Table 3. According to the gas and droplet velocities, as well as standard deviation and skewness of droplet number fractions from these models, the gas turbulence RNG k-ε model is acceptable for the present work of airless droplet spray coating process modeling.

4. Comparison with Experimental Data in a Panel Using an Airless Sprayer

The paint droplet film thickness distributions were measured by Ye et al. [54] using an airless sprayer gun along a vertical panel. The effective orifice diameter of the airless sprayer gun ranges from 0.48 to 0.53 mm with a spray angle of 45 degrees. The measured mean diameter of droplets d50 was 81.0 μm, where d50 refers to the droplet size corresponding to the cumulative frequency of 50%. The flat plate panel length and width sizes were 800 and 200 mm. The distance from the sprayer gun to the vertical plate target was 300 mm. The paint mass flow rate was 0.02733 kg/s. The measured droplet velocities were 110 and 80 m/s at the distance of 50 and 100 mm from the sprayer gun along the axial direction.
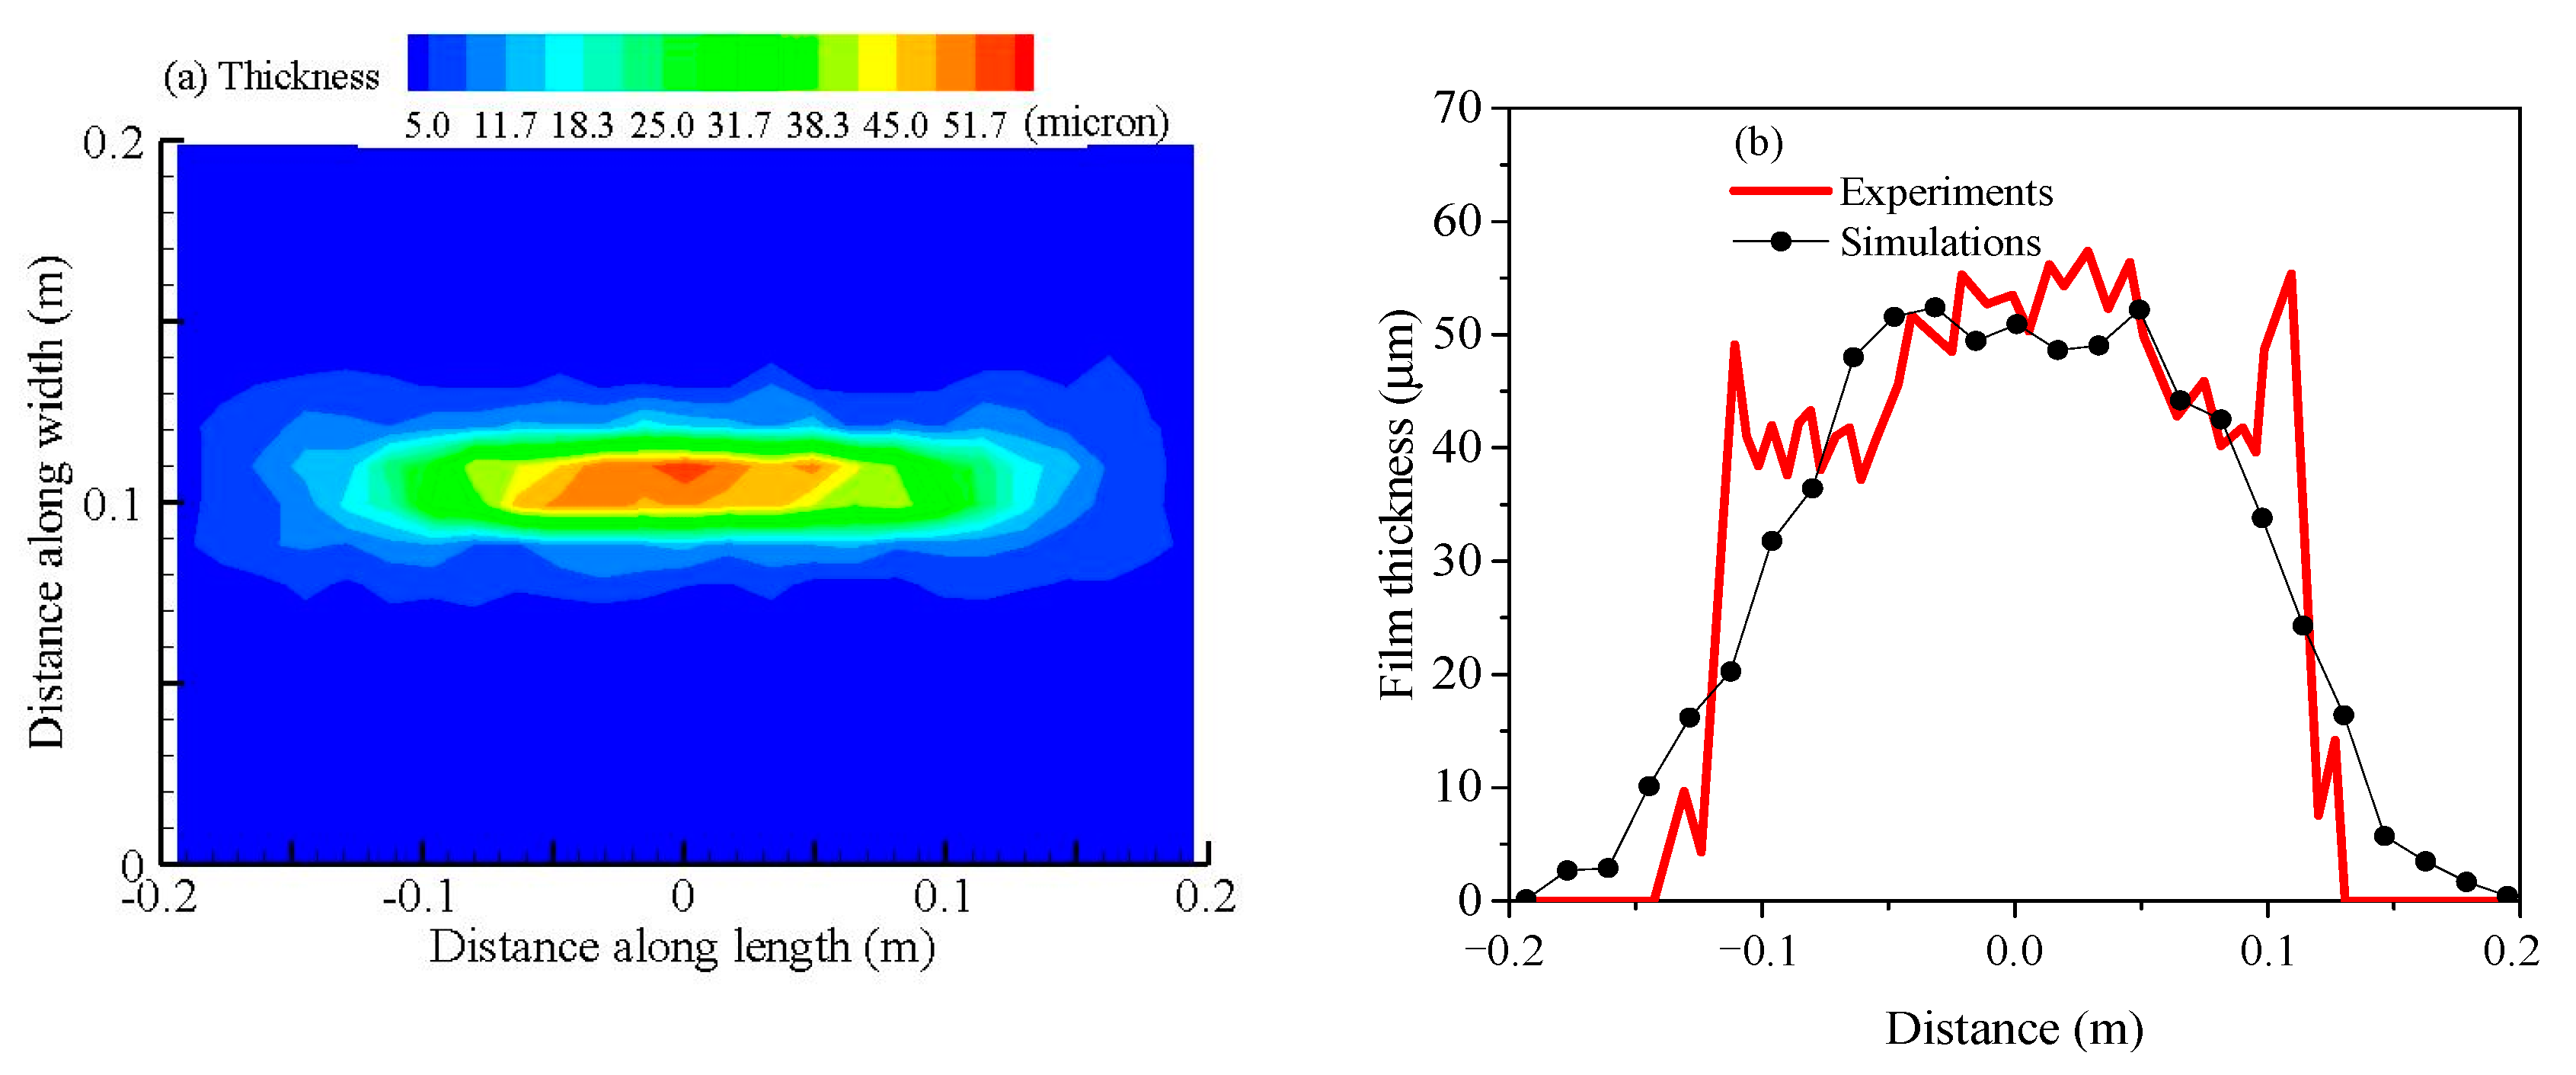
Spraying film thickness simulation was performed under the experimental conditions listed in Table 4. Figure 7 shows the comparisons of the plate-paint droplet film thicknesses obtained from calculations and experimental measurements using an airless sprayer gun. From the mass balance of liquid film, the film thickness hi is calculated according to droplet number Ni in the segment i.
h i = π d 3 N i 6 L i B i
where Bi and Li represent the segment length and width. The droplet data were collected from a small rectangular segment along the vertical plate wall. The plate wall is evenly divided into segments with the length and width of 8 mm and 2 mm, which is similar to the nozzle size of the airless sprayer gun [11]. The numerical simulations show an agreement with the experimental data. The mean film thicknesses from experiment and simulation are 42.4 and 38.7 µm, respectively. The simulated and measured transfer efficiency of droplets are 95.6 and 94.0% on the target panel.
Discrepancy between the experimental data and simulated results can be observed. The simulated film thicknesses are lower than the experimental data at the distance of −0.1 and 0.1 m. There are several explanations for this discrepancy between the simulations and experiments. First of all, the measured droplet size distribution is replaced by a mean diameter of droplets used in numerical simulations. The experimental measurements showed that an accumulation of large droplets appeared at the edges of the droplet sprayer. Fine droplets were deposited mainly at the spray pattern center. The droplet Sauter mean diameter was 68.5 µm from the integral droplet size distribution [54]. The larger the droplet diameter is, the higher the droplet velocities are as droplets impact on the target plate. Another factor is that the initial droplet velocities are estimated from measured droplet velocities at the axial distance of 50 mm and 100 mm. Ye et al. [6] found that the appropriate initial droplet velocity conditions were very necessary for the determination of droplet trajectories. The spraying injection data obtained at the gun exit positions were suggested as input conditions for numerical simulations of the droplet spraying coating processes. These indicate that the simulation of the droplet spraying process relies on measured inlet parameters of droplet velocities and diameters. From the numerical simulation point of view, these inlet conditions should be measured as close to the airless sprayer as possible to avoid the interaction calculation of complex gun geometries. Therefore, simulation improvements should focus on the prediction of collisional interactions of droplets with respect to the detailed inlet droplet velocities and diameter measurements in the spray coating processes.

5. Discussions and Analyses

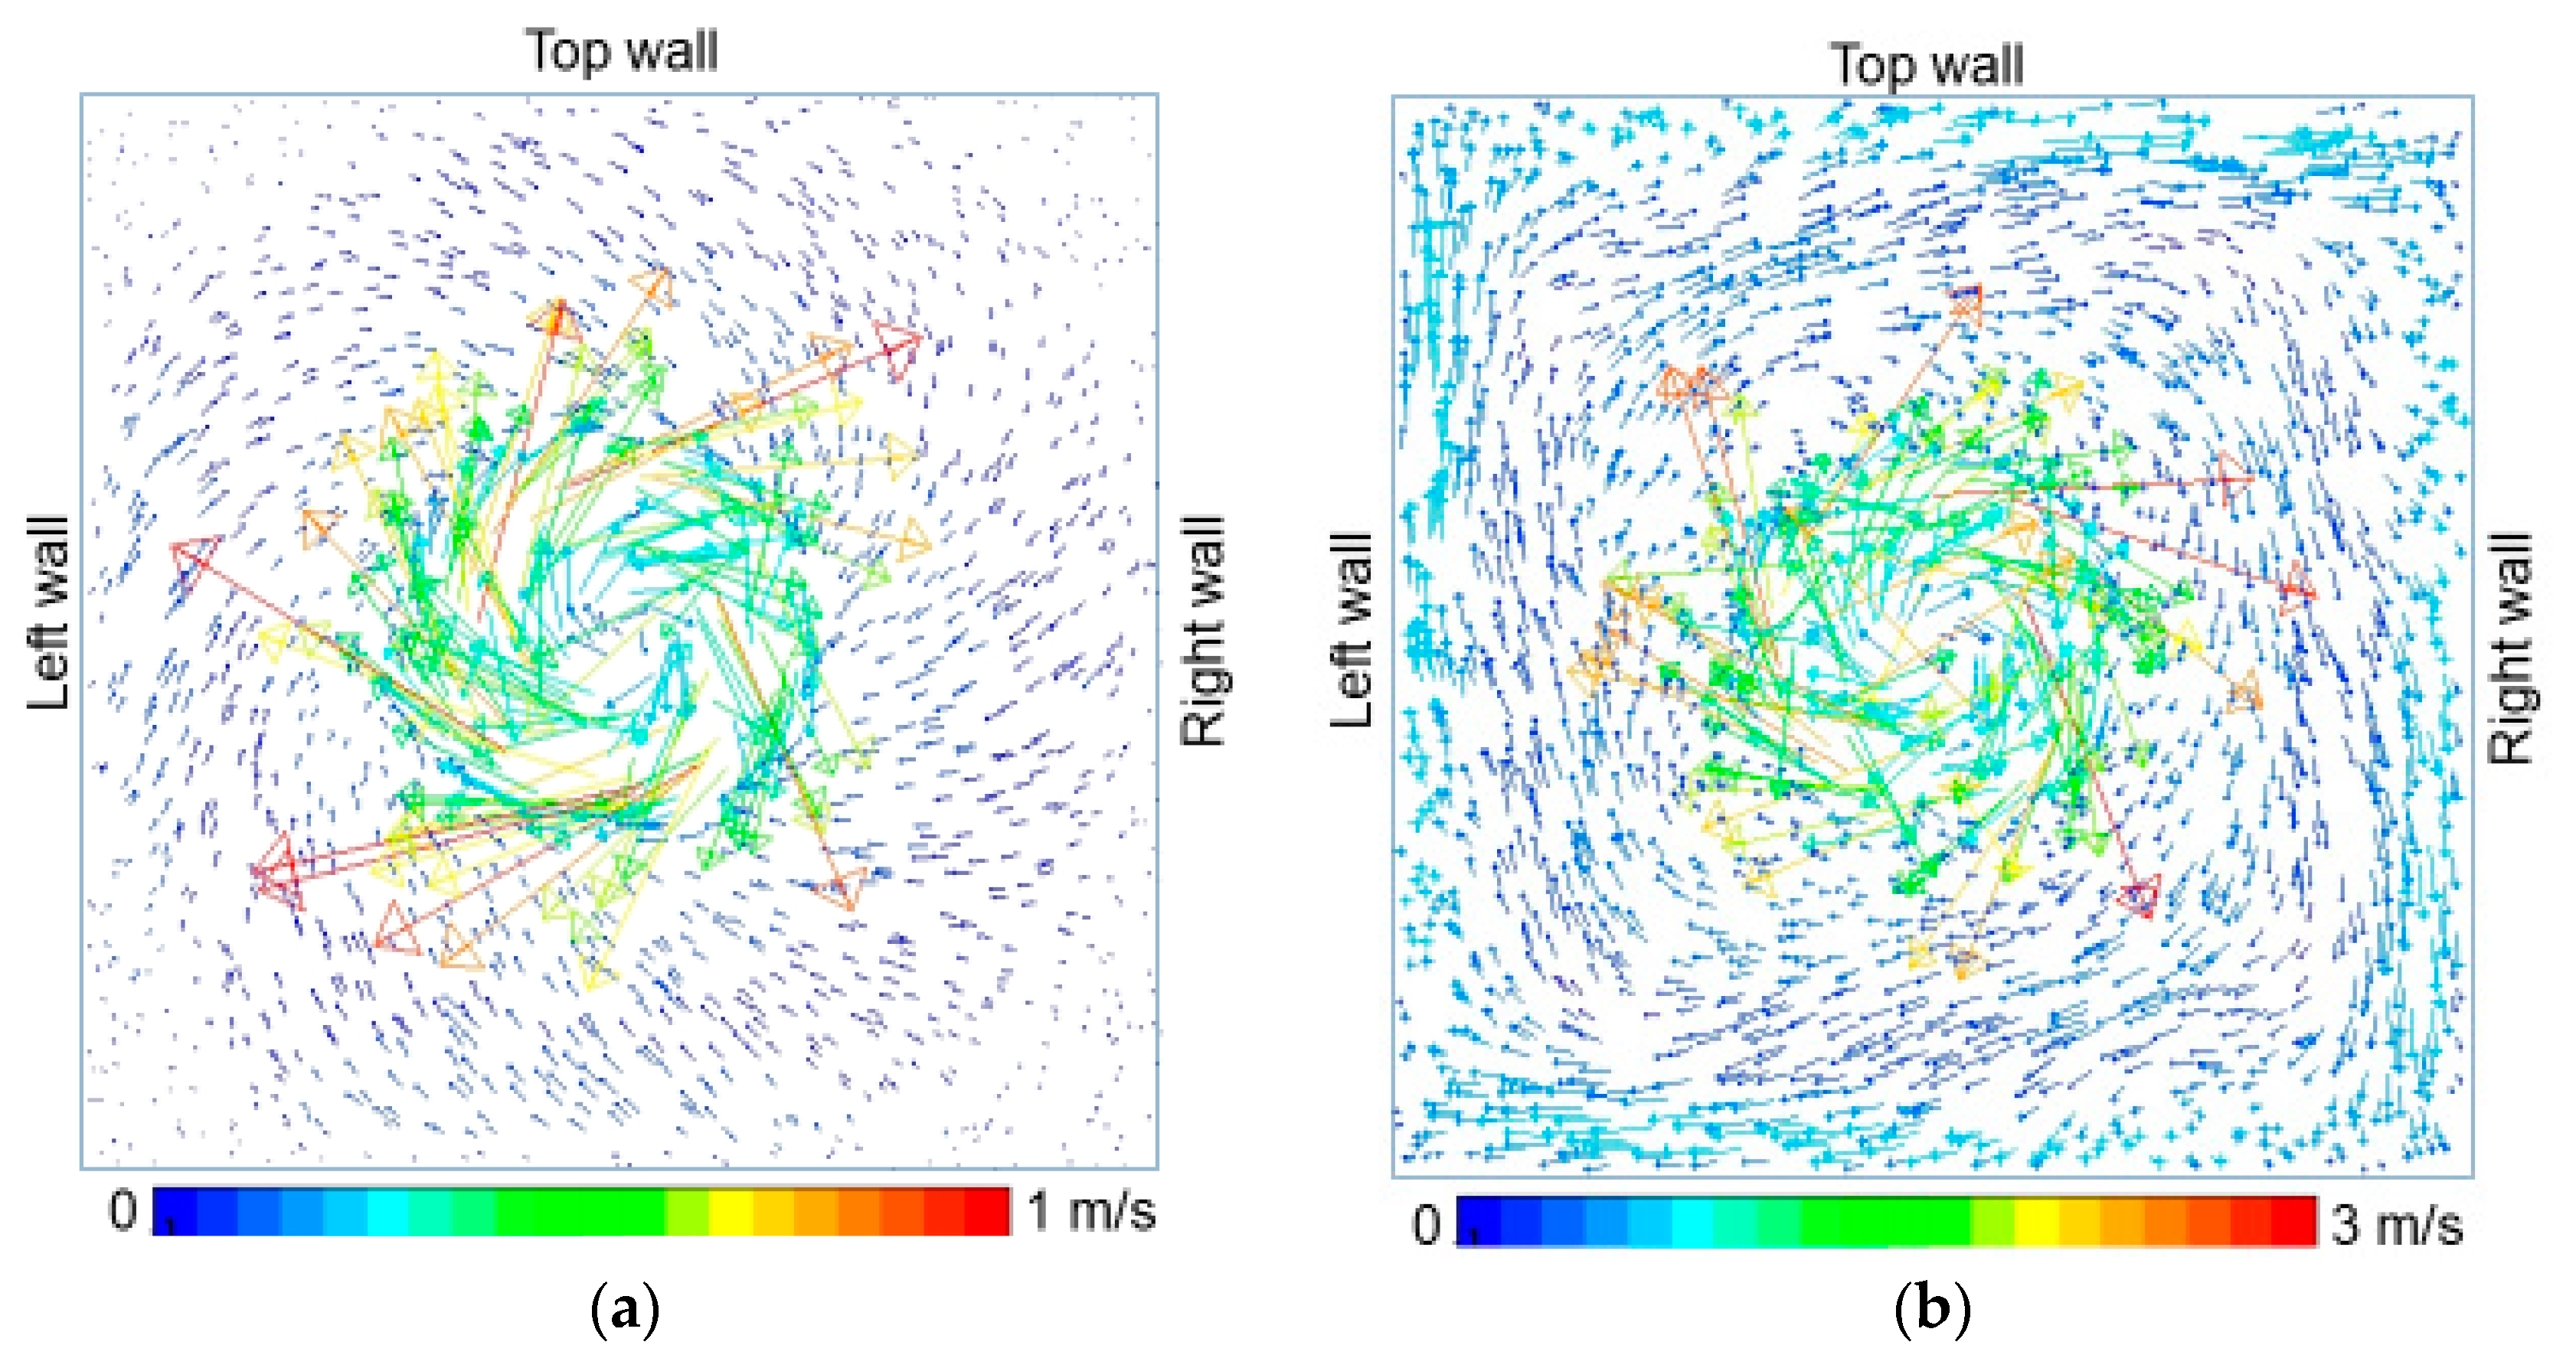
Using the rotary sprayer II, the instantaneous gas velocity vectors are shown in Figure 8 at ring III plane at the sprayer rotations of 4000 and 22,500 rpm in the airless droplet spray coating process. In the rotary sprayer II, there are eight holes on each ring. Generally, a circulation of gas is clearly observed, indicating that the flow of gas is induced by the rotation of the rotary sprayer. These patterns of gas flow are quite complex at the corners of the square duct, depending on sprayer rotation speed.
Figure 9 shows the distributions of gas velocity magnitudes at two rotation speeds. Both cases show that these trends of gas velocities are similar along the x and diagonal lines. A difference between them exists in chamber I and II. In general, the gas velocity magnitude is low at X = 0 m in the center of chamber I. It increases toward the holes. Three regimes exist in chamber II. In the first regime at δ1, gas velocity decreases from exit gas velocity ua at the hole exit. Then, gas velocity magnitude remains almost constant in the second regime at δ0. Near the duct wall in the third regime at δ2, gas velocity increases, and then trends to zero at the duct wall. For both sprayer rotations, the distributions of gas velocity are similar. On the other hand, the exit gas velocities ua of the holes are larger at the rotation speed of 22,500 rpm than they are at the rotation speed of 4000 rpm, resulting in high gas velocity in chamber II with increase in sprayer rotation speed.
Figure 10 shows the typical trajectories of sampling droplets in the square duct. It clearly shows that the droplets move from chamber I to chamber II through the holes. Finally, droplets adhere to the square duct walls. These indicate that droplets gain kinetic energy by means of centrifugal force as they penetrate through the holes. The sampling time interval (t2t1) is 0.0005 s. These lines represent the distance traveled by the droplets in a given time interval. The larger the distances are, the higher the droplets velocities are in the square duct. The tangential velocity component appears as droplets impact the duct walls, leading to a decline in the normal component.
Figure 11a shows the distributions of exit droplet velocity magnitudes of holes in the rings at two rotation speeds. In the first stage at time t0, the droplet velocity increases from zero. In this stage, droplets pass through the sprayer inlet to the hole exit. In the second stage at t1, droplet velocity decreases gradually with time at the rotation speed of 4000 rpm. The oscillations of droplet velocity are caused by hydrodynamic interaction between gas and droplets as well as collisional interactions of droplets. The droplet velocities are at a steady condition in the third stage at time ts. The exit droplet velocities of holes are large at high rotation speed. They are largest at ring IV and lowest at ring I, indicating that exit droplet velocities depend on rotation speed and ring size.
Figure 11b shows the distributions of exit gas and droplet velocity magnitudes of holes as a function of dimensionless Fr numbers. The dimensionless Fr number is defined according to rotation speed Ω and radius R of the rotary sprayer as follows:
F r = Ω 2 R g
The dimensionless Fr number represents a measure of centrifugal and gravitational forces. Both exit gas and droplet velocities of holes increase with increasing Fr number. It can be seen that the exit gas and droplet velocities are large in ring IV and low in ring I.
As the fluid is subjected to a centrifugal force with a radius R and angular velocity ω, the rotating fluid is discharged from a hole with a free surface at r0 in the rotating cylinder [55,56]. Bernoulli’s equation would have the form
ω 2 2 ( R 2 r 0 2 ) + p 0 ρ + v 0 2 2 = ω 2 2 ( R 2 r 1 2 ) + p 1 ρ + v 1 2 2 + Δ h
where Δh is the energy loss. Assuming fluid pressure p1 approximates to p0, and fluid velocity v0 is negligible, Equation (24) reduces to the following form at r1 = R without energy loss:
ω 2 2 ( R 2 r 0 2 ) = v 1 2 2
The discharge fluid velocity from the hole at R is
v 1 = ω ( R 2 r 0 2 )
This indicates that the discharge fluid velocity is proportional to the angular velocity of the rotating fluid, and also increases with increasing radius R. From Figure 11, the exit droplet velocity increases with increasing rotation speed. Furthermore, the exit droplet velocity of holes is lowest at the smallest ring size (i.e., ring I) and highest at the largest ring size of ring IV. The equation can explain the trend of exit droplet velocity of holes observed in simulations.
Considering the frictional energy loss during the passage through the hole, the exit droplet velocity is expressed as a function of discharge coefficient Ch according to Equation (26) [57]:
v = C h Ω ( R 2 r 0 2 )
Assuming r0 = Rd based on droplet diameter, the result from Equation (26) gives exit droplet velocity.
v d = C h Ω 2 R d d 2
This expression is also suitable for the exit gas velocity of holes. The value of discharge coefficient is calculated according to exit gas velocity and droplet velocity. The mean discharge coefficients of gas and droplets of holes of rotary sprayer II are 0.85 and 5.87 in the droplet spray coating process.
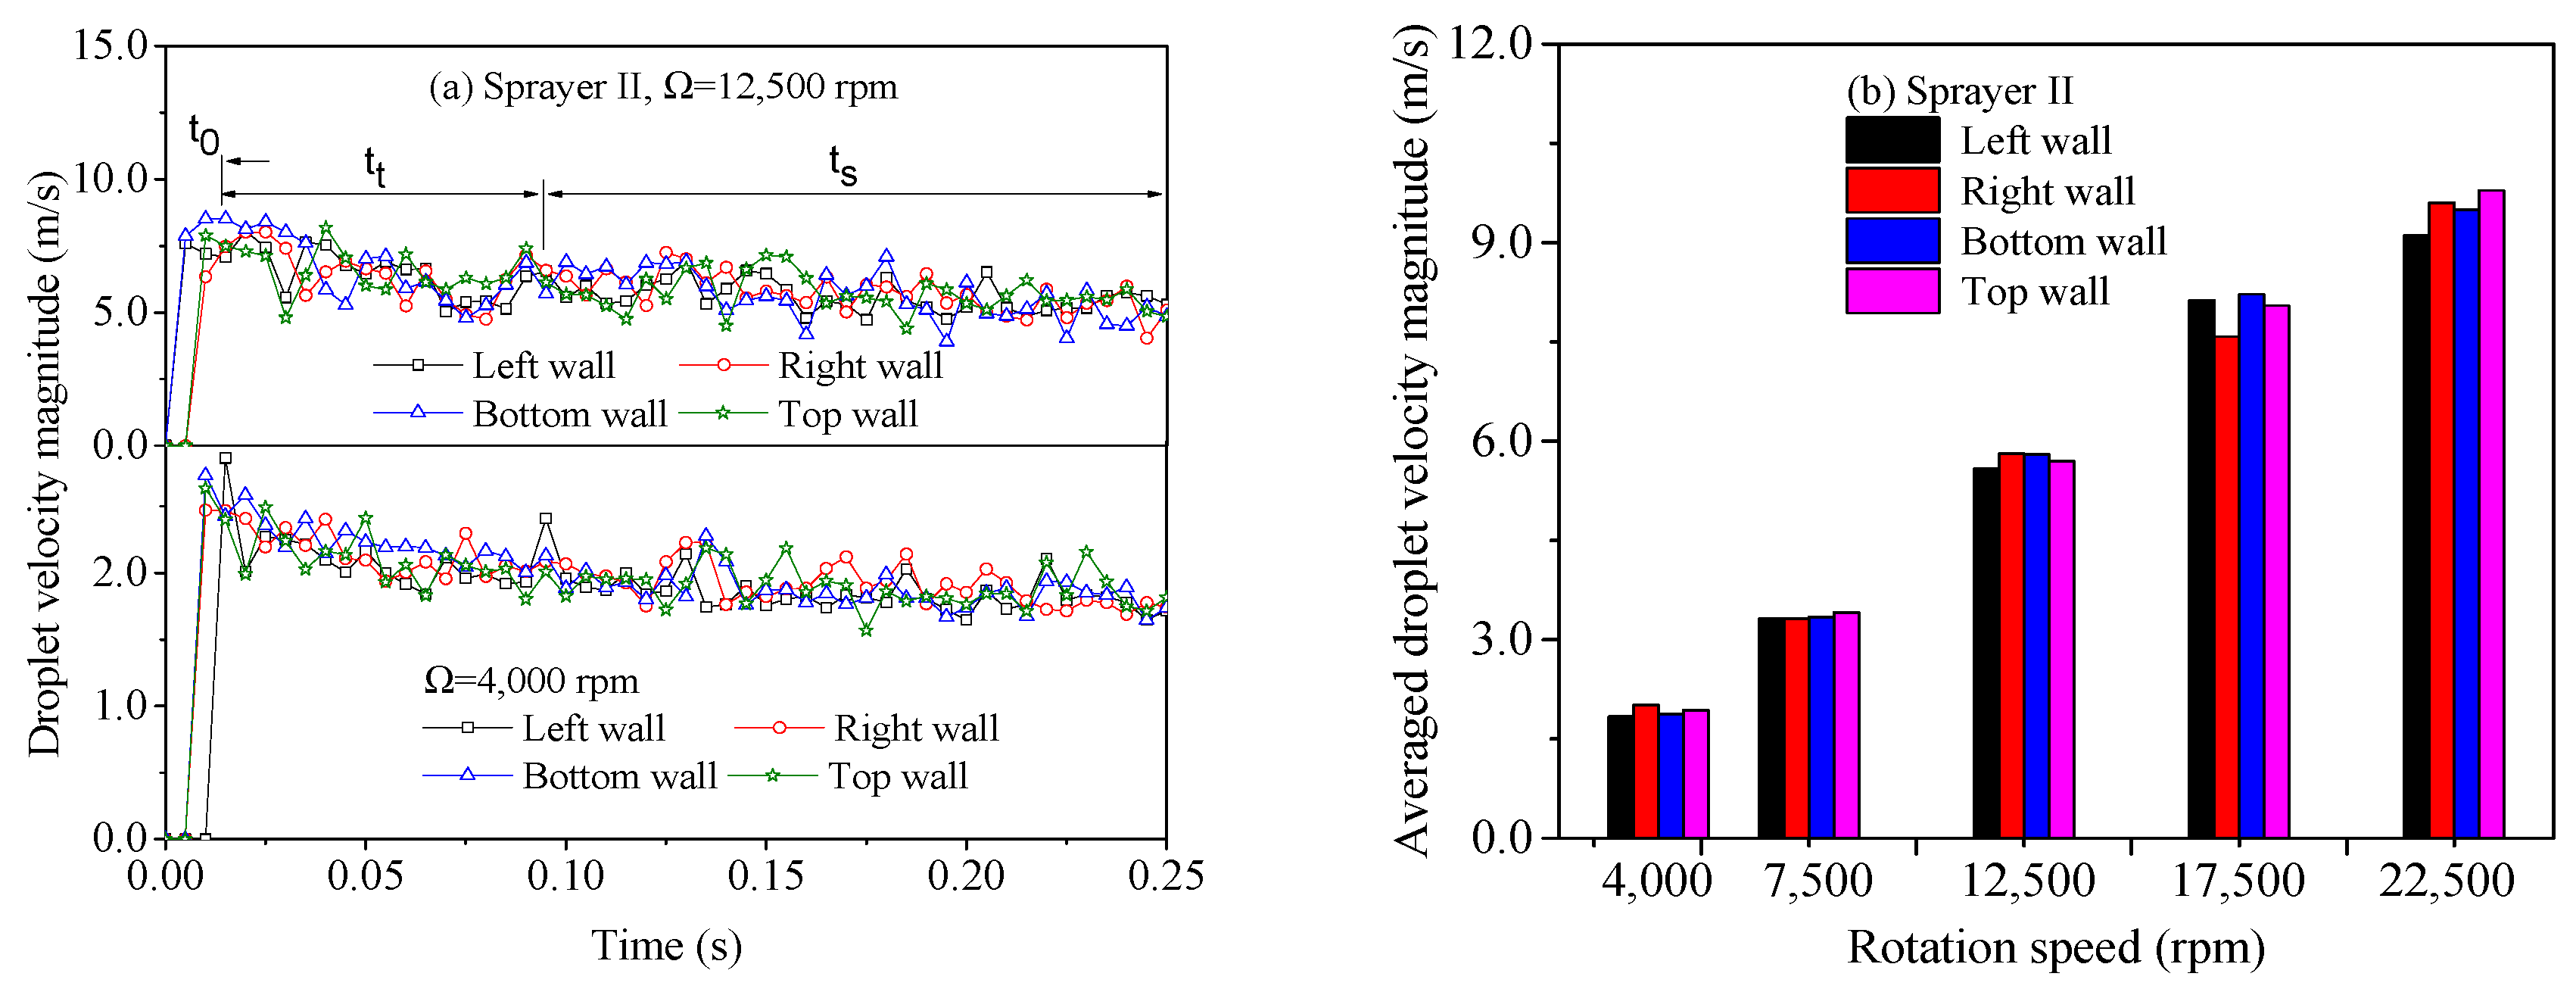
Figure 12a shows the instantaneous droplet velocity magnitude at the left, right, bottom, and top walls of the square duct at two different rotation speeds. The evolution of wall droplet velocity is divided into three stages. During the time t0, at the first stage, the wall droplet velocities start to change from zero. In this stage, droplets travel from the sprayer inlet, chamber I, holes, and chamber II to the duct walls. During the time tt, at the second stage, the wall droplet velocities decrease gradually from the maximum. In the last stage at ts, the wall droplet velocity oscillates with a mean value, representing a steady condition of droplet painting.
The time-averaged wall droplet velocity is calculated at time ts, and is shown in Figure 12b as a function of rotation speed. The wall droplet velocities are similar at the left, right, bottom, and top walls. Furthermore, the averaged wall droplet velocities are larger with increase in sprayer rotation speed.
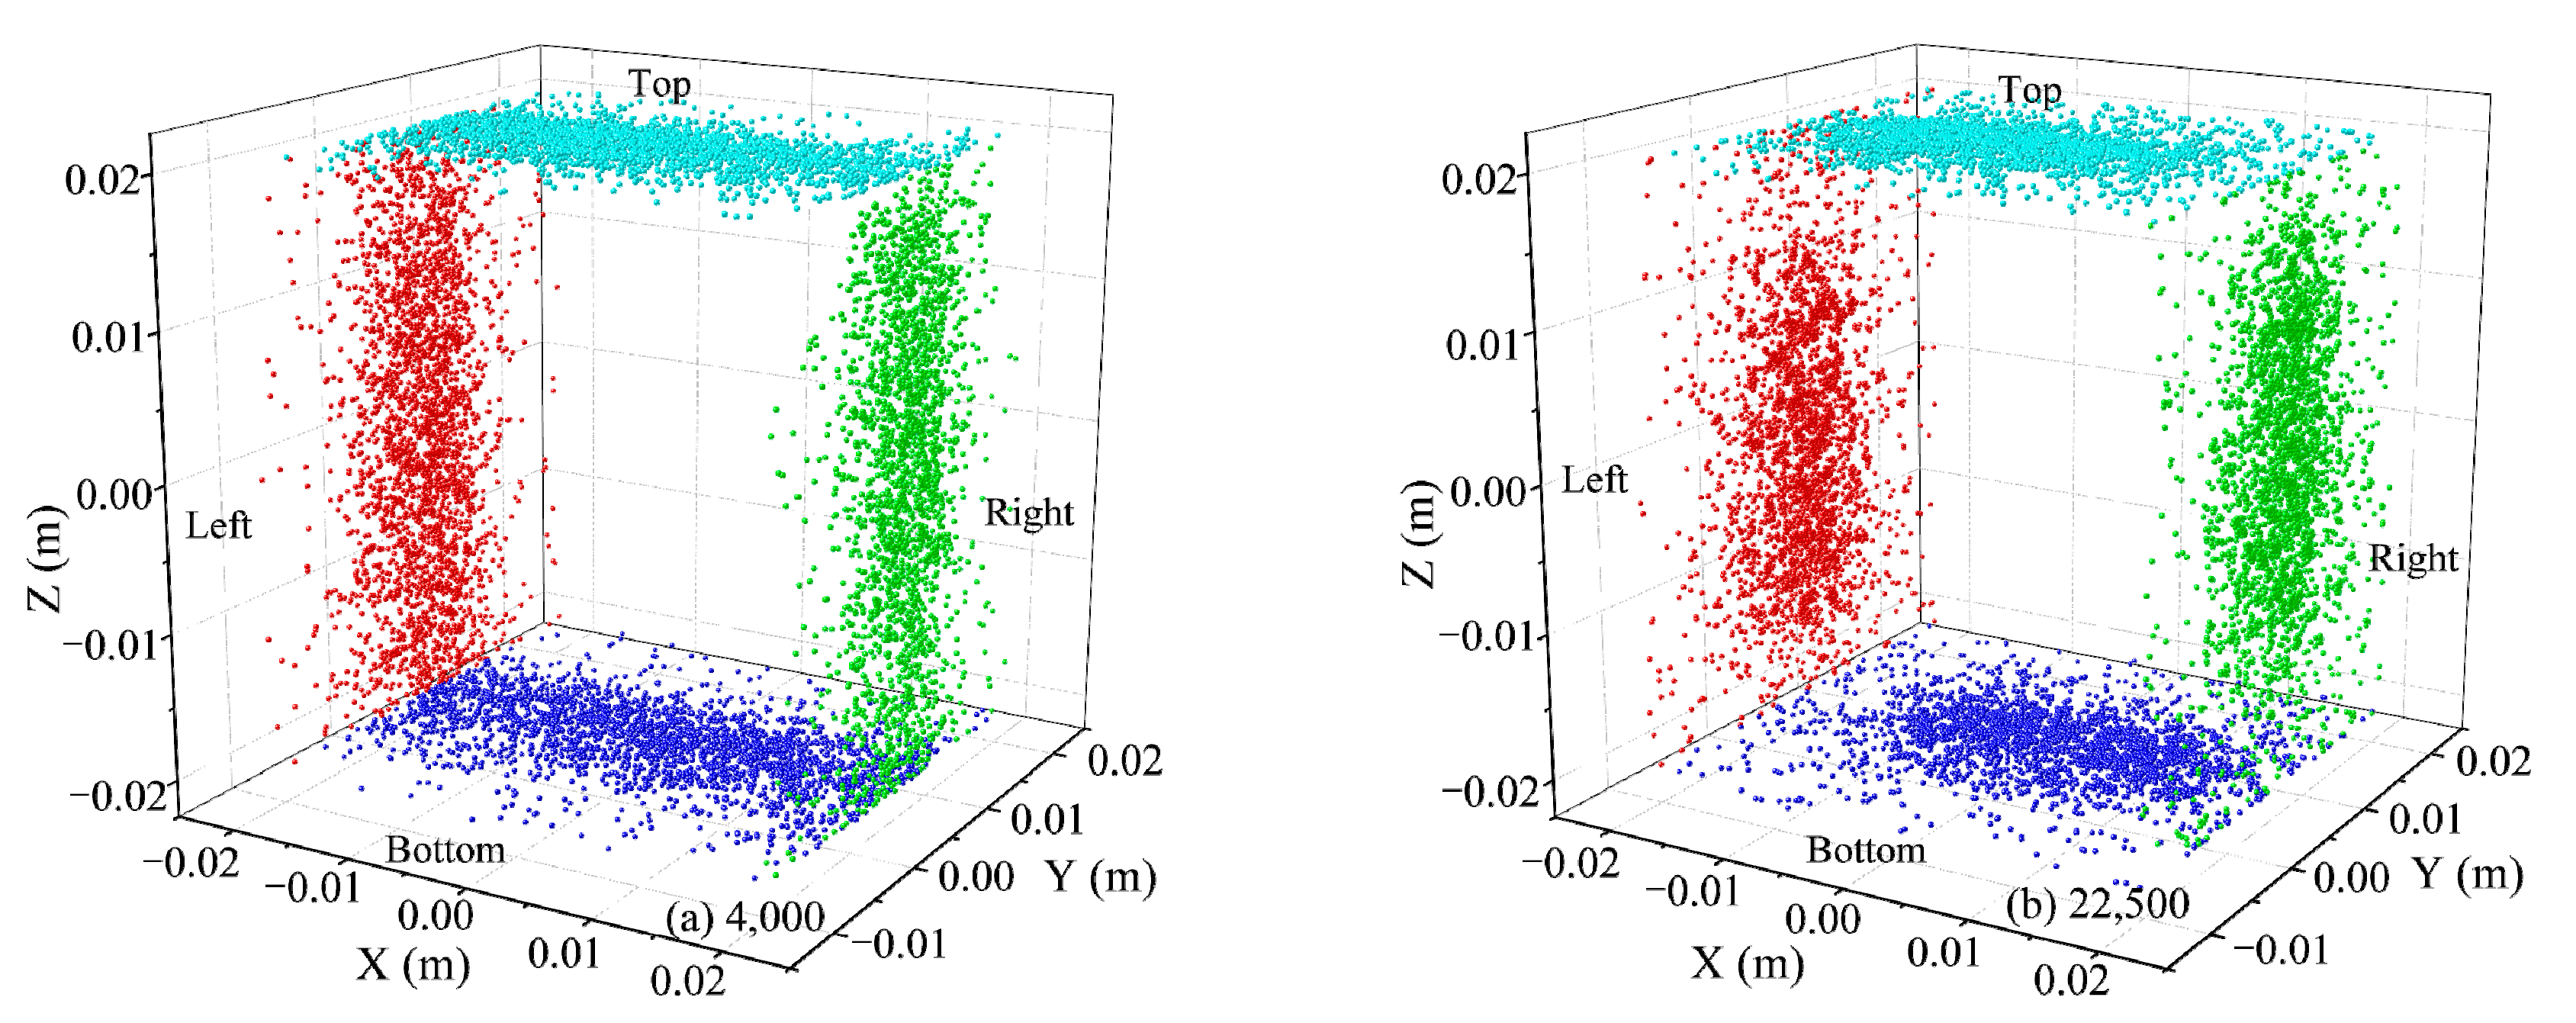
Figure 13 shows the distributions of droplets sticking on the left, right, bottom, and top walls of the square duct at two rotation speeds. Both simulations indicate that droplets adhere to the vertical left and right walls and horizontal bottom and top walls. Droplets impact the duct walls as they are released from the holes due to centrifugal force. The number of droplets is reduced at the corners at the rotation speed of 22,500 rpm compared to the rotation speed of 4000 rpm at the square duct walls.
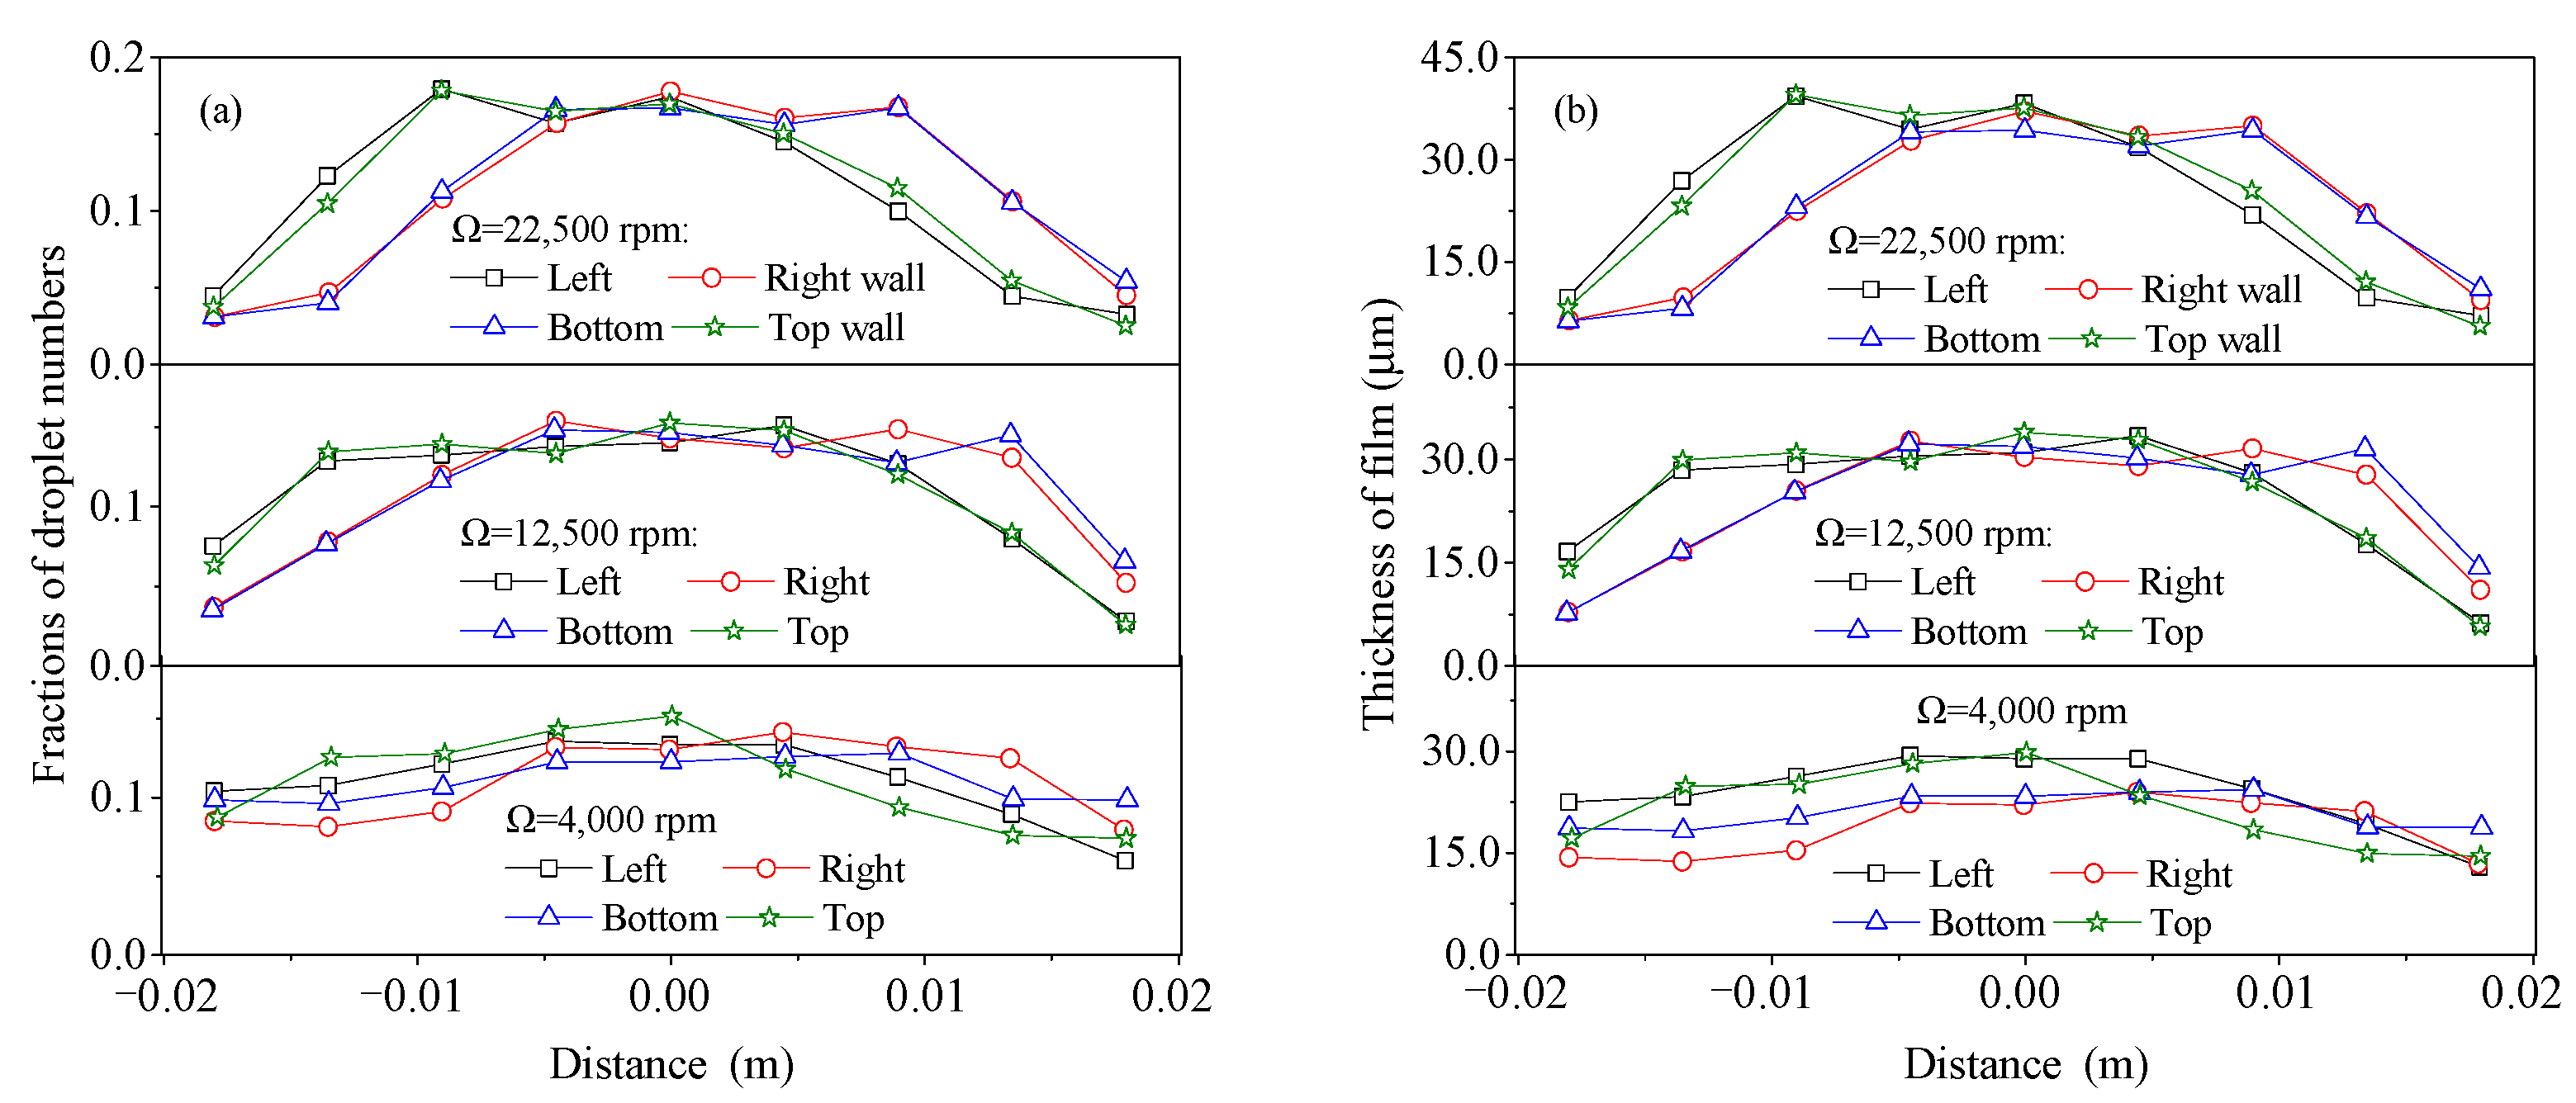
The duct wall is evenly divided into nine segments along the wall length, and the number fractions of droplets Ni/N0 is calculated for each segment. Figure 14a shows the distributions of droplet number fractions along the wall length at three rotation speeds. All cases show that the droplet number fractions increase from the beginning side. They are high at the middle, and decrease at the end side along the wall length. The droplet number fractions are low at the beginning and end sides as the rotation speed is changed from 12,500 to 22,500 rpm, exhibiting nonuniform distribution of droplets along the duct wall length.
The distributions of film thickness are shown in Figure 14b with changing rotation speeds. All cases show that the film thickness is low at the beginning and end sides, and high at the middle along the wall length. The film thickness reduces at the beginning and end sides, and increases at the middle with increasing rotation speed. The nonuniform film thickness is due to the corner effect in the square duct. It is also found that the film thickness of the left and top walls is large in the beginning side and low in the end side compared to the right and bottom walls at the rotation speeds of 12,500 and 22,500 rpm. These means that the film thickness may be affected by the effect of rotating direction of the rotary sprayer in the square duct.
The variance of the paint droplet number in the wall can be expressed as
σ d = 1 m i = 1 m ( N i N m ) 2
where Nm is the mean droplet number of the wall.
The number index of droplets is defined according to droplet number variance as
I N = σ d σ n
where σn is the variance showing that the total droplets are located at one segment of the wall, and represents a complete nonuniform distribution of droplets in the wall. From definition, we see that the droplet number index varies from 0.0 to 1.0. When the droplet number index IN is zero, the segment paint droplet number is equal to the mean droplet number, representing a complete uniform distribution of droplets along the wall length. If the droplet number index IN is equal to 1.0, droplets are concentrated in one segment, representing a complete nonuniform distribution of droplets along the wall length. A uniform distribution of droplets would have the droplet number index at a zero value. Therefore, the closer to 0.0 the droplet number index is, the better the uniformity of paint droplet distribution would be in the square duct.
Figure 15 shows the distributions of number index of droplets along left, right, bottom, and top walls at five different rotation speeds. All cases indicate that the droplet number indexes are not very different at the rotation speeds of 17,500 and 22,500 rpm. The droplet number index of the bottom wall is lowest compared to the left, right, and top walls. The mean value of the square duct is 0.072, 0.069, 0.13, 0.16, and 0.18, respectively. These show that the values of droplet number index are less than 0.1 at the rotation speeds of 4000 and 7500 rpm. With increase in the rotation speed to a range of 12,500 to 22,500 rpm, the droplet number index changes within the range of 0.13–0.18. These indicate that nonuniform distribution of droplets exists at high rotation speed. Reducing the rotation speed will improve the uniformity of droplets of the square duct walls.
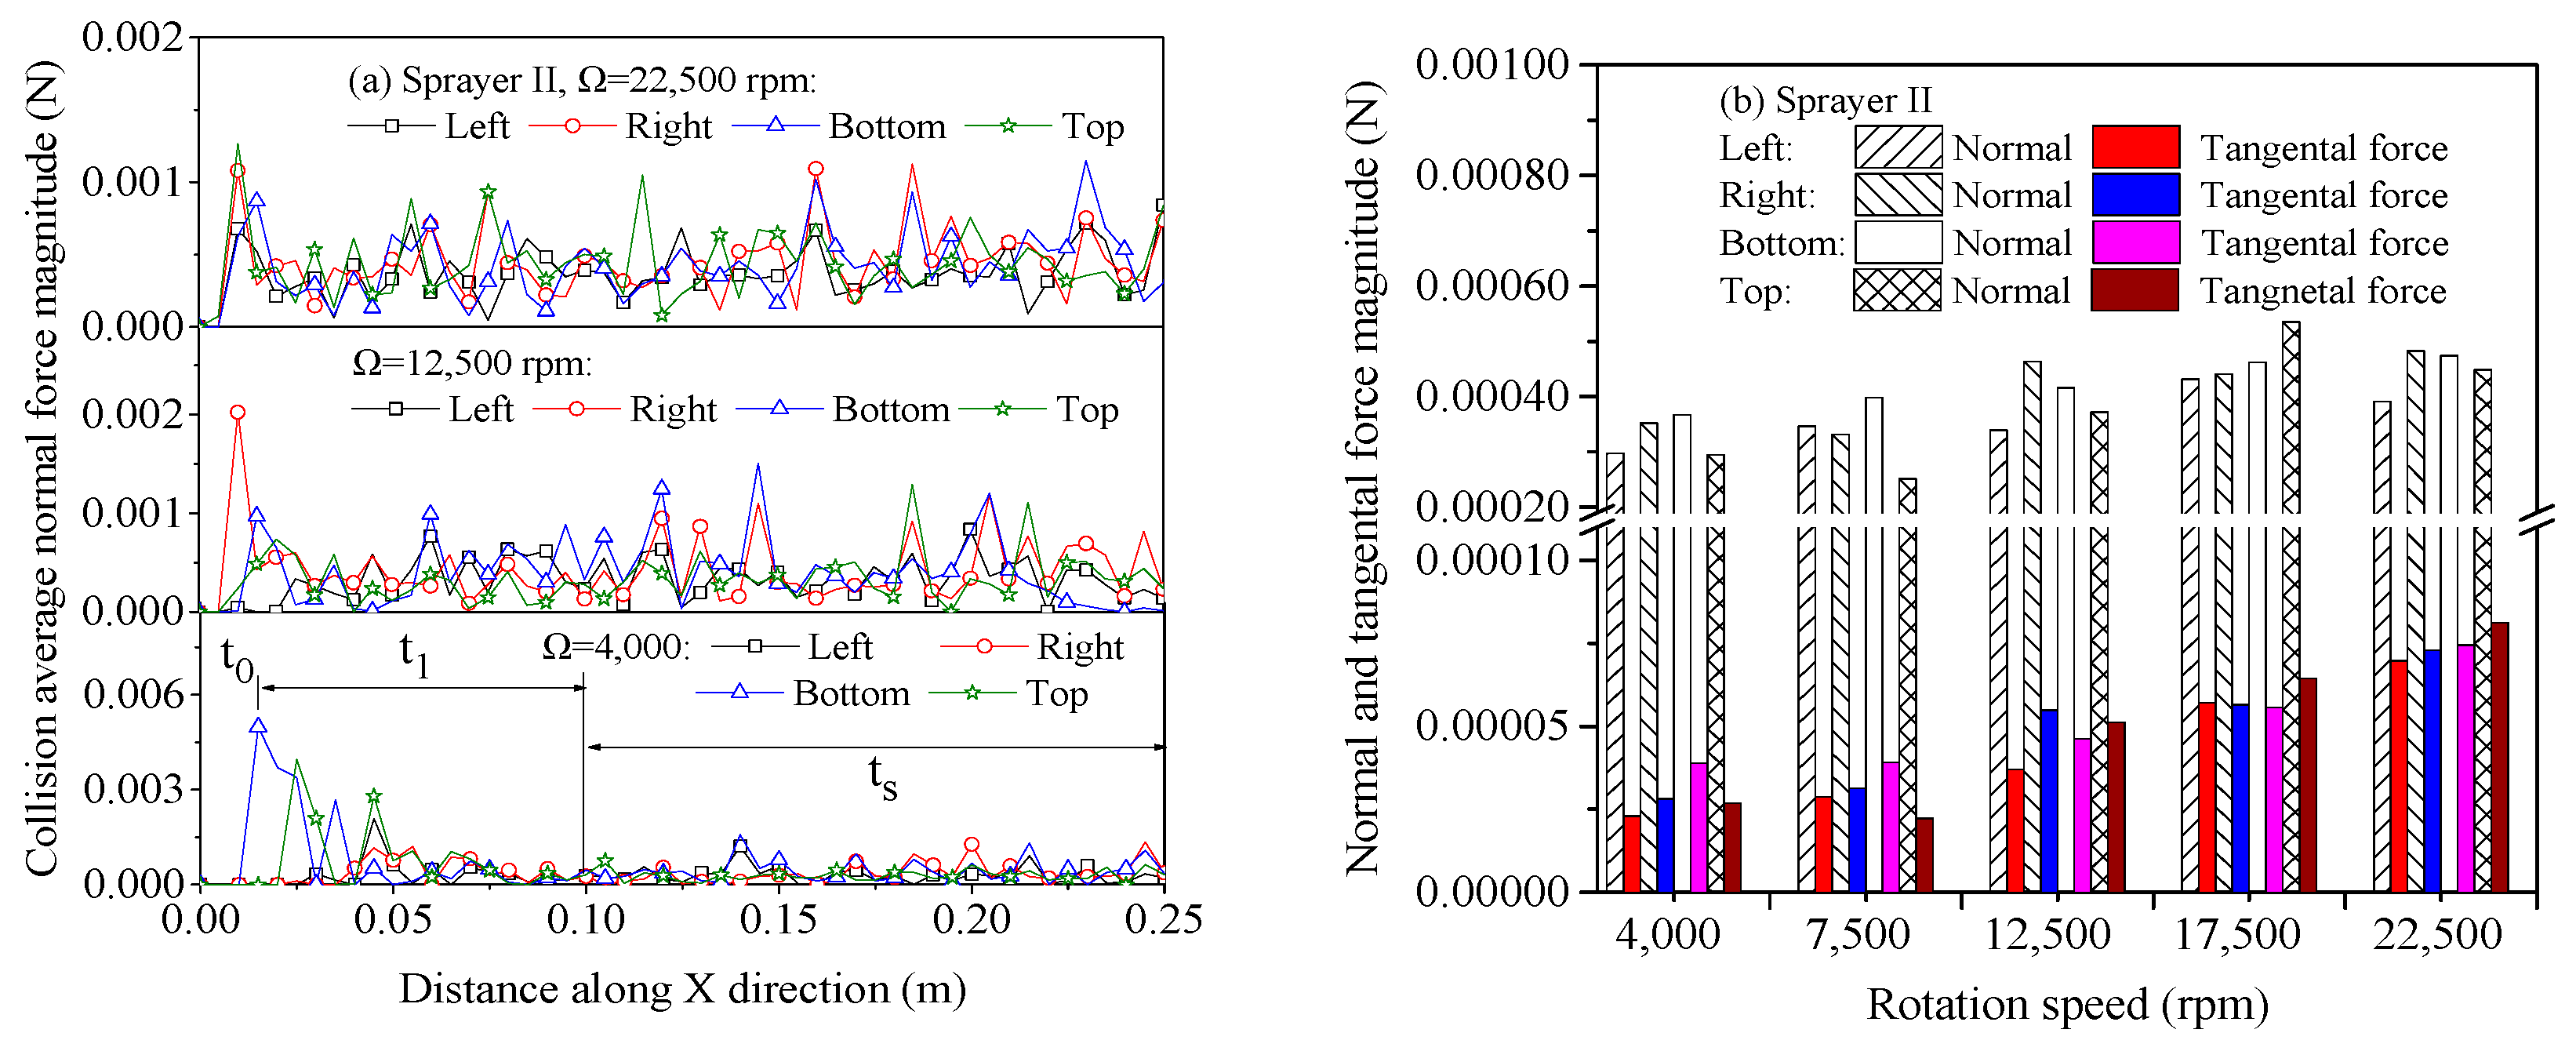
Figure 16a shows the instantaneous droplet–wall collision normal force magnitude of the left, right, bottom, and top walls at three different rotation speeds. The instantaneous droplet–wall collision normal forces increase from zero to maximum at time t0. After that, they reduce, and enter a steady condition at time t1. The droplet–wall collision normal forces oscillate with mean values due to hydrodynamic interaction between gas and droplets at time ts. It can be seen that large oscillations of droplet–wall collision normal forces appear with increase in rotation speed.
The calculated mean values of droplet–wall collision normal and tangential forces are shown in Figure 16b with changing rotation speeds. Generally, both mean droplet–wall normal and tangential forces increase as the rotation speed varies from 4000 to 17,500 rpm. On the other hand, the mean droplet–wall tangential forces increase, and the normal forces of the left and top walls reduce at the rotation speed of 22,500 rpm. The average droplet–wall collision forces are calculated from the left, right, bottom, and top walls. The average droplet–wall collision normal forces are 3.28 × 10⁻⁴, 3.47 × 10⁻⁴, 3.98 × 10⁻⁴, 3.28 × 10⁻⁴, 4.67 × 10⁻⁴, and 4.49 × 10⁻⁴ (N), and the average droplet–wall collision tangential forces are 2.92 × 10⁻⁵, 3.04 × 10⁻⁵, 4.73 × 10⁻⁵, 5.84 × 10⁻⁵, and 7.45 × 10⁻⁵ (N) at rotation speeds from 4000 to 22,500 rpm. The ratio of the normal force to the tangential force is 11.22, 11.41, 8.39, 8.01, and 6.02 at five rotation speeds in the square duct. These indicate that the droplet–wall collision normal force is almost an order of magnitude larger than the droplet–wall collision tangential force. These further suggest that the droplet–wall collision normal forces control adhesion of droplets at low rotation speed, and the droplet–wall collision tangential forces significantly influence the adhesion of droplets at high rotation speed in the square duct.
Figure 17 shows the distributions of droplet–wall collision normal and tangential energy losses at the left, right, bottom, and top walls at different rotation speeds of sprayer II. The normal and tangential energy loss represent energy lost during droplet–wall collisions due to the normal and tangential contact interactions. Generally, both collision normal and tangential energy losses increase with increasing rotation speeds. The mean energy loss is calculated at the left, right, bottom, and top walls. The mean normal energy losses are 2.97 × 10⁻⁸, 3.42 × 10⁻⁸, 5.12 × 10⁻⁸, 6.69 × 10⁻⁸, and 7.52 × 10⁻⁸ (J) for sprayer rotation speeds of 4000 to 22,500 rpm. The ratio of the mean normal energy loss to the mean tangential energy loss is 30.09, 30.81, 25.45, 19.66, and 15.11, respectively. These indicate that the droplet–wall collision normal energy loss is at least one order of magnitude larger than the droplet–wall tangential energy loss. The effect of tangential energy loss is more pronounced at high rotary sprayer rotation speeds.

6. Conclusions

For the airless droplet spray coating process, the distributions of gas and droplets velocities, film thickness, and collision forces were predicted using the CFD-DEM approach with the JKR contact model at different rotary sprayer rotation speeds. The simulation assessment was performed by comparing simulated results with film thickness distribution data measured in a panel using an airless gun obtained from the literature.
This paper shows how a virtual accumulation angle test can be applied for the calibration of the wall–paint droplet surface energy parameter. A series of virtual tests were performed using a funnel device. A reasonable estimate of wall–paint droplet surface energy value was suggested according to the relation of accumulation angles.
For our study, the test for the selection of gas turbulence model was performed using the realizable k-ε, RNG k-ε, and SST k-ω models by means of the rotary sprayer I. The selection of gas turbulence model was dependent on how the gas and droplet velocities and standard deviation and skewness of droplet number fractions are distributed at the square duct walls. A rational gas RNG k-ε model was suggested and employed in an airless droplet spray coating process of the square duct.
The exit gas and droplet velocities of holes increased from ring I to ring IV of rotary sprayer II. The expression was correlated with sprayer rotation speed and discharge coefficient, with 0.85 for gas phase and 5.87 for droplets in the droplet spray coating process.
The distributions of droplet film thickness and droplet–wall collision normal force were predicted at different rotation speeds. A droplet number index was proposed to measure droplet distributions at the square duct walls. The droplet number index was less than 0.1 at the rotation speed of 4000 and 7500 rpm, and ranged from 0.13 to 0.18 at the rotation speeds from 12,500 to 22,500 rpm. The droplet–wall collision normal force was approximately an order of magnitude higher than the droplet–wall tangential force of collisions in the airless rotary spray coating processes of the square duct.

Author Contributions

Methodology, simulations, and writing, X.L.; data curation, X.C. and N.H.; writing—original draft preparation, Q.L.; writing—review and editing, Z.X., M.S. and R.W. All authors have read and agreed to the published version of the manuscript.

Funding

This research is funded by Key R&D Program of China Construction Second Engineering Bureau Co., Ltd. (Grant No. 2021ZX180001).

Institutional Review Board Statement

Not applicable.

Informed Consent Statement

Not applicable.

Data Availability Statement

Datasets are available from the corresponding author upon reasonable request.

Acknowledgments

The authors are grateful to the anonymous reviewers for their constructive comments and suggestions to improve this manuscript. We also express our gratitude to the Enterprise Expert Studio of CCPEE and CCEPT.

Conflicts of Interest

The authors have no relevant financial or nonfinancial interests to disclose. Authors Xiang Li, Niancheng Hong, Qianzheng Li and Ming Sheng were employed by the company China Construction Power and Environment Engineering Co., Ltd. Authors Xing Chen, Zenghui Xu and Rui Wang were employed by the company China Construction Eco-Environmental Protection Technology Co., Ltd.

Nomenclature

acontact radius, m
Cddrag coefficient
Chdischarge coefficient
ddroplet diameter, m
ecoefficient of restitution
Emodulus, Pa
fc,nnormal contact force, N
fc,ttangential contact force, N
FrFr number
Iimoment of inertia of droplet i, kg·m2
ggravitational acceleration, m/s2
Gkgeneration of kinetic energy, kg/m·s3
mmass of droplet, kg
nnumber fraction
nikunit vector between the droplet i and k
nmmean number fraction
Ndroplet number
Nmmean droplet number
pffluid pressure, Pa
Rradius, m
ReRe number
Ttorque, N·m
uvelocity, m/s
vddischarge velocity, m/s
vidroplet velocity, m/s
vn,iknormal relative velocity between droplet i and k, m/s
vt,iktangential relative velocity between droplet i and k, m/s
Greek symbols
ωangular velocity, rad/s
δnnormal displacement, m
δttangential displacement, m
ρfgas density, kg/m3
μfgas viscosity, kg/s·m
μsfriction coefficient
μtturbulent viscosity, kg/s·m
σPrandtl number
σnvariance
τgas phase stress, Pa
Ωrotation speed, rpm
νPoisson ratio
γsurface energy, J/m2
ΓAsurface energy at the intersection A, J/m2
θaccumulation angle, degree

References

  1. Lambourne, R.; Strivens, T.A. Paint and Surface Coatings: Theory and Practice; Woodhead Publishing: Sawston, UK, 1999. [Google Scholar]
  2. Mohamed, M.G.; Ahmed, N.M.; M. El-Gawad, A.W. Corrosion protection performance of reinforced steel coated with paints based on waste materials. Anti-Corros. Methods Mater. 2018, 65, 368–374. [Google Scholar] [CrossRef]
  3. Sathiyanarayanan, S.; Muthukrishnan, S.; Venkatachari, G.; Trivedi, D.C. Corrosion protection of steel by polyaniline (PANI) pigmented paint coating. Prog. Org. Coat. 2005, 53, 297–301. [Google Scholar] [CrossRef]
  4. Plesniak, M.W.; Sojka, P.E.; Singh, A.K. Transfer efficiency for airless painting systems. J. Coat. Technol. Res. 2004, 1, 137–145. [Google Scholar] [CrossRef]
  5. Gad, H.M.; Baraya, E.A.; Farag, T.M.; Ibrahim, I.A. Effect of geometric parameters on spray characteristics of air assisted pressure swirl atomizer. Alex. Eng. J. 2022, 61, 5557–5571. [Google Scholar] [CrossRef]
  6. Ye, Q.; Domnick, J. Analysis of droplet impingement of different atomizers used in spray coating processes. J. Coat. Technol. Res. 2017, 14, 467–476. [Google Scholar] [CrossRef]
  7. Bayrel, L.; Orzechowski, Z. Liquid Atomization; Taylor & Francis: Washington, DC, USA, 1993. [Google Scholar]
  8. Kamoun, O.; Gassoumi, A.; Shkir, M.; Gorji, N.E.; Turki-Kamoun, N. Synthesis and characterization of highly photocatalytic active Ce and Cu co-doped novel spray pyrolysis developed MoO3 films for photocatalytic degradation of eosin-Y dye. Coatings 2022, 12, 823. [Google Scholar] [CrossRef]
  9. Williams, A. Combustion of Liquid Fuel Sprays; Butterworth-Heinemann: London, UK, 1990. [Google Scholar]
  10. Lefebvre, A.H.; McDonell, V.G. Atomization and Sprays; CRC Press: Boca Raton, FL, USA, 2017. [Google Scholar]
  11. Ye, Q.; Shen, B.; Tiedje, O.; Bauernhansl, T.; Domnick, J. Numerical and experimental study of spray coating using air-assisted high pressure atomizers. At. Sprays 2015, 25, 643–656. [Google Scholar] [CrossRef]
  12. Shen, B.; Ye, Q.; Guettler, N.; Tiedje, O.; Domnick, J. Primary breakup of a non-Newtonian liquid using a high-speed rotary bell atomizer for spray-painting processes. J. Coat. Technol. Res. 2019, 16, 1581–1596. [Google Scholar] [CrossRef]
  13. Fogliati, M.; Fontana, D.; Garbero, M.; Vanni, M.; Baldi, G.; Donde, R. CFD simulation of paint deposition in an air spray process. J. Coat. Technol. Res. 2006, 3, 117–125. [Google Scholar] [CrossRef]
  14. Li, J.; Xiao, J.; Huang, Y.; Lou, H.H. Integrated process and product analysis: A multiscale approach to paint spray. AIChE J. 2007, 53, 2841–2857. [Google Scholar] [CrossRef]
  15. Baytok, Y.M.; Erek, A.; Saf, O. Numerical estimation of film thickness with an air-assisted spray gun. Eng. Trans. 2023, 71, 241–263. [Google Scholar]
  16. Yang, G.; Chen, Y.; Chen, S.; Zhang, F. Modeling of film formation in airless spray. J. Phys. Conf. Ser. 2022, 2179, 012024. [Google Scholar] [CrossRef]
  17. Venkatachalam, P.; Sahu, S.; Anupindi, K. Numerical investigation on the role of a mixer on spray impingement and mixing in channel cross-stream airflow. Phys. Fluids 2022, 34, 033316. [Google Scholar] [CrossRef]
  18. Zhou, W.; Xu, X.; Yang, Q.; Zhao, R.; Jin, Y. Experimental and numerical investigations on the spray characteristics of liquid-gas pintle injector. Aerosp. Sci. Technol. 2022, 121, 107354. [Google Scholar] [CrossRef]
  19. Chen, S.M.; Chen, W.Z.; Chen, Y.; Jiang, J.Z.; Wu, Z.J.; Zhou, S. Research on film-forming characteristics and mechanism of painting V-shaped surfaces. Coatings 2022, 12, 658. [Google Scholar] [CrossRef]
  20. Yang, G.; Wu, Z.; Chen, Y.; Chen, S.; Jiang, J. Modeling and characteristics of airless spray film formation. Coatings 2022, 12, 949. [Google Scholar] [CrossRef]
  21. Wu, Z.; Chen, Y.; Liu, H.; Hua, W.; Duan, J.; Kong, L. A review of the developments of the characteristics and mechanisms of airless spraying on complex surfaces. Coatings 2023, 13, 2095. [Google Scholar] [CrossRef]
  22. Fries, L.; Antonyuk, S.; Heinrich, S.; Palzer, S. DEM-CFD modeling of a fluidized bed spray granulator. Chem. Eng. Sci. 2011, 66, 2340–2355. [Google Scholar] [CrossRef]
  23. Heine, M.; Antonyuk, S.; Fries, L.; Niederreiter, G.; Heinrich, S.; Palzer, S. Modeling of the spray zone for particle wetting in a fluidized bed. Chem. Ing. Tech. 2013, 85, 280–289. [Google Scholar] [CrossRef]
  24. Darabi, P.; Pougatch, K.; Salcudean, M.; Grecov, D. DEM investigations of fluidized beds in the presence of liquid coating. Powder Technol. 2011, 215, 365–374. [Google Scholar] [CrossRef]
  25. Pasternak, L.; Sommerfeld, M.; Muramulla, P.; Yuan, F.L.; Gopireddy, S.; Urbanetz, N.; Profitlich, T. Tablet coating in lab-scale drum coaters: Combining DEM simulations and spray experiments to predict tablet coating. Powder Technol. 2023, 427, 118683. [Google Scholar] [CrossRef]
  26. Cundall, P.A.; Strack, O.D.L. A discrete numerical model for granular assemblies. Geotechnique 1979, 29, 47–65. [Google Scholar] [CrossRef]
  27. Madlmeir, S.; Radl, S. A coarse-grained parcel method for heat and mass transfer simulations of spray coating processes. Adv. Powder Technol. 2022, 33, 103590. [Google Scholar] [CrossRef]
  28. Yakhot, V.; Orszag, S.A.; Thangam, S.; Gatski, T.B.; Speziale, C.G. Development of turbulence models for shear flows by a double expansion technique. Phys. Fluids A 1992, 4, 1510–1520. [Google Scholar] [CrossRef]
  29. Wilcox, D.C. Turbulence Modeling for CFD; DCW Industries, Inc.: La Canada, CA, USA, 2004. [Google Scholar]
  30. Crowe, C.T.; Schwarzkopf, J.D.; Sommerfeld, M.; Tsuji, Y. Multiphase Flows with Droplets and Particles; Taylor & Francis: Boca Raton, FL, USA, 2011. [Google Scholar]
  31. Hamid, R.N.; Reza, Z.; Rahmat, S.G.; Navid, M. Coupled CFD-DEM Modeling: Formulation, Implementation and Application to Multiphase Flows; John Wiley & Sons, Ltd.: Hoboken, NJ, USA, 2016. [Google Scholar]
  32. Mikami, T.; Kamiya, H.; Horio, M. Numerical simulation of cohesive powder behavior in a fluidized bed. Chem. Eng. Sci. 1998, 53, 1927–1940. [Google Scholar] [CrossRef]
  33. Feng, Y.Q.; Xu, B.H.; Zhang, S.J.; Yu, A.B.; Zulli, P. Discrete particle simulation of gas fluidization of particle mixtures. AIChE J. 2004, 50, 1713–1728. [Google Scholar] [CrossRef]
  34. Johnson, K.L. Contact Mechanics; Cambridge University Press: New York, NY, USA, 1985. [Google Scholar]
  35. Johnson, K.L.; Kendall, K.; Roberts, A.D. Surface energy and the contact of elastic solids. Proc. R. Soc. A Math. Phys. Eng. Sci. 1971, 324, 301–321. [Google Scholar]
  36. Gilabert, F.; Roux, J.N.; Antonio, C. Computer simulation of model cohesive powders: Influence of assembling procedure and contact laws on low consolidation states. Phys. Rev. E 2007, 75, 011303. [Google Scholar] [CrossRef]
  37. Fluent. FLUENT User’s Guide; Fluent Inc.: Lebanon, NH, USA, 2019. [Google Scholar]
  38. EDEM. EDEM Theory Guide; Altair Engineering Inc.: Troy, MI, USA, 2020. [Google Scholar]
  39. Zhou, Z.Y.; Pinson, D.; Zou, R.P.; Yu, A.B. Discrete particle simulation of gas fluidization of ellipsoidal particles. Chem. Eng. Sci. 2011, 66, 6128–6145. [Google Scholar] [CrossRef]
  40. Grima, A.P.; Wypych, P.W. Development and validation of calibration methods for discrete element modelling. Granul. Matter 2011, 13, 127–132. [Google Scholar] [CrossRef]
  41. Asaf, Z.; Rubinstein, D.; Shmulevich, I. Determination of discrete element model parameters required for soil tillage. Soil Tillage Res. 2007, 92, 227–242. [Google Scholar] [CrossRef]
  42. Ucgul, M.; Fielke, J.M.; Saunders, C. Three-dimensional discrete element modelling (DEM) of tillage: Accounting for soil cohesion and adhesion. Biosyst. Eng. 2015, 129, 298–306. [Google Scholar] [CrossRef]
  43. Keppler, I.; Hudoba, Z.; Oldal, I.; Csatar, A.; Fenyvesi, L. Discrete element modeling of vibrating tillage tools. Eng. Comput. 2015, 32, 308–328. [Google Scholar] [CrossRef]
  44. Barr, J.B.; Ucgul, M.; Desbiolles, J.M.A.; Fielke, J.M. Simulating the effect of rake angle on narrow opener performance with the discrete element method. Biosyst. Eng. 2018, 171, 1–15. [Google Scholar] [CrossRef]
  45. Hoshishima, C.; Ohsaki, S.; Nakamura, H.; Watano, S. Parameter calibration of discrete element method modelling for cohesive and non-spherical particles of powder. Powder Technol. 2021, 386, 199–208. [Google Scholar] [CrossRef]
  46. Yarin, A.L. Drop impact dynamics: Splashing, spreading, receding, bouncing. Annu. Rev. Fluid Mech. 2006, 38, 159–192. [Google Scholar] [CrossRef]
  47. Shi, Q.; Wang, B.; Mao, H.; Liu, Y. Calibration and measurement of micrometre-scale pollen particles for discrete element method parameters based on the Johnson-Kendal-Roberts model. Biosyst. Eng. 2024, 237, 83–91. [Google Scholar] [CrossRef]
  48. Xia, R.; Li, B.; Wang, X.; Li, T.; Yang, Z. Measurement and calibration of the discrete element parameters of wet bulk coal. Measurement 2019, 142, 84–95. [Google Scholar] [CrossRef]
  49. Ajmal, M.; Roessler, T.; Richter, C.; Katterfeld, A. Calibration of cohesive DEM parameters under rapid flow conditions and low consolidation stresses. Powder Technol. 2020, 374, 22–32. [Google Scholar] [CrossRef]
  50. Zhu, J.; Zou, M.; Liu, Y.; Gao, K.; Su, B.; Qi, Y. Measurement and calibration of DEM parameters of lunar soil simulant. Acta Astronaut. 2022, 191, 169–177. [Google Scholar] [CrossRef]
  51. Shih, T.H.; Liou, W.W.; Shabbir, A.; Yang, Z.; Zhu, J. A new k-ε eddy-viscosity model for high Reynolds number turbulent flows-Model development and validation. Comput. Fluids 1995, 24, 227–238. [Google Scholar] [CrossRef]
  52. Orszag, S.A.; Yakhot, V.; Flannery, W.S.; Boysan, F.; Choudhury, D.; Maruzewski, J.; Patel, B. Renormalization group modeling and turbulence simulations. In Proceedings of the International Conference on Near-Wall Turbulent Flows, Tempe, AZ, USA, 15–17 March 1993. [Google Scholar]
  53. Menter, F.R. Two-equation eddy-viscosity turbulence models for engineering applications. AIAA J. 1994, 32, 1598–1605. [Google Scholar] [CrossRef]
  54. Ye, Q.; Shen, B.; Tiedje, O.; Domnick, J. Investigations of spray painting processes using an airless spray gun. In Proceedings of the 24th European Conference on Liquid Atomization and Spray Systems, Estoril, Portugal, 5–7 September 2011. [Google Scholar]
  55. Landau, L.D.; Lifshitz, E.M. Fluid Mechanics; Butterworth-Heinemann: Oxford, UK, 1998. [Google Scholar]
  56. Greenspan, H.P. The Theory of Rotating Fluid; Cambridge University Press: New York, NY, USA, 1968. [Google Scholar]
  57. Teoman, B.; Potanin, A.; Armenante, P.M. The discharge of complex fluids through an orifice: A review. Chem. Eng. Res. Des. 2022, 179, 346–364. [Google Scholar] [CrossRef]
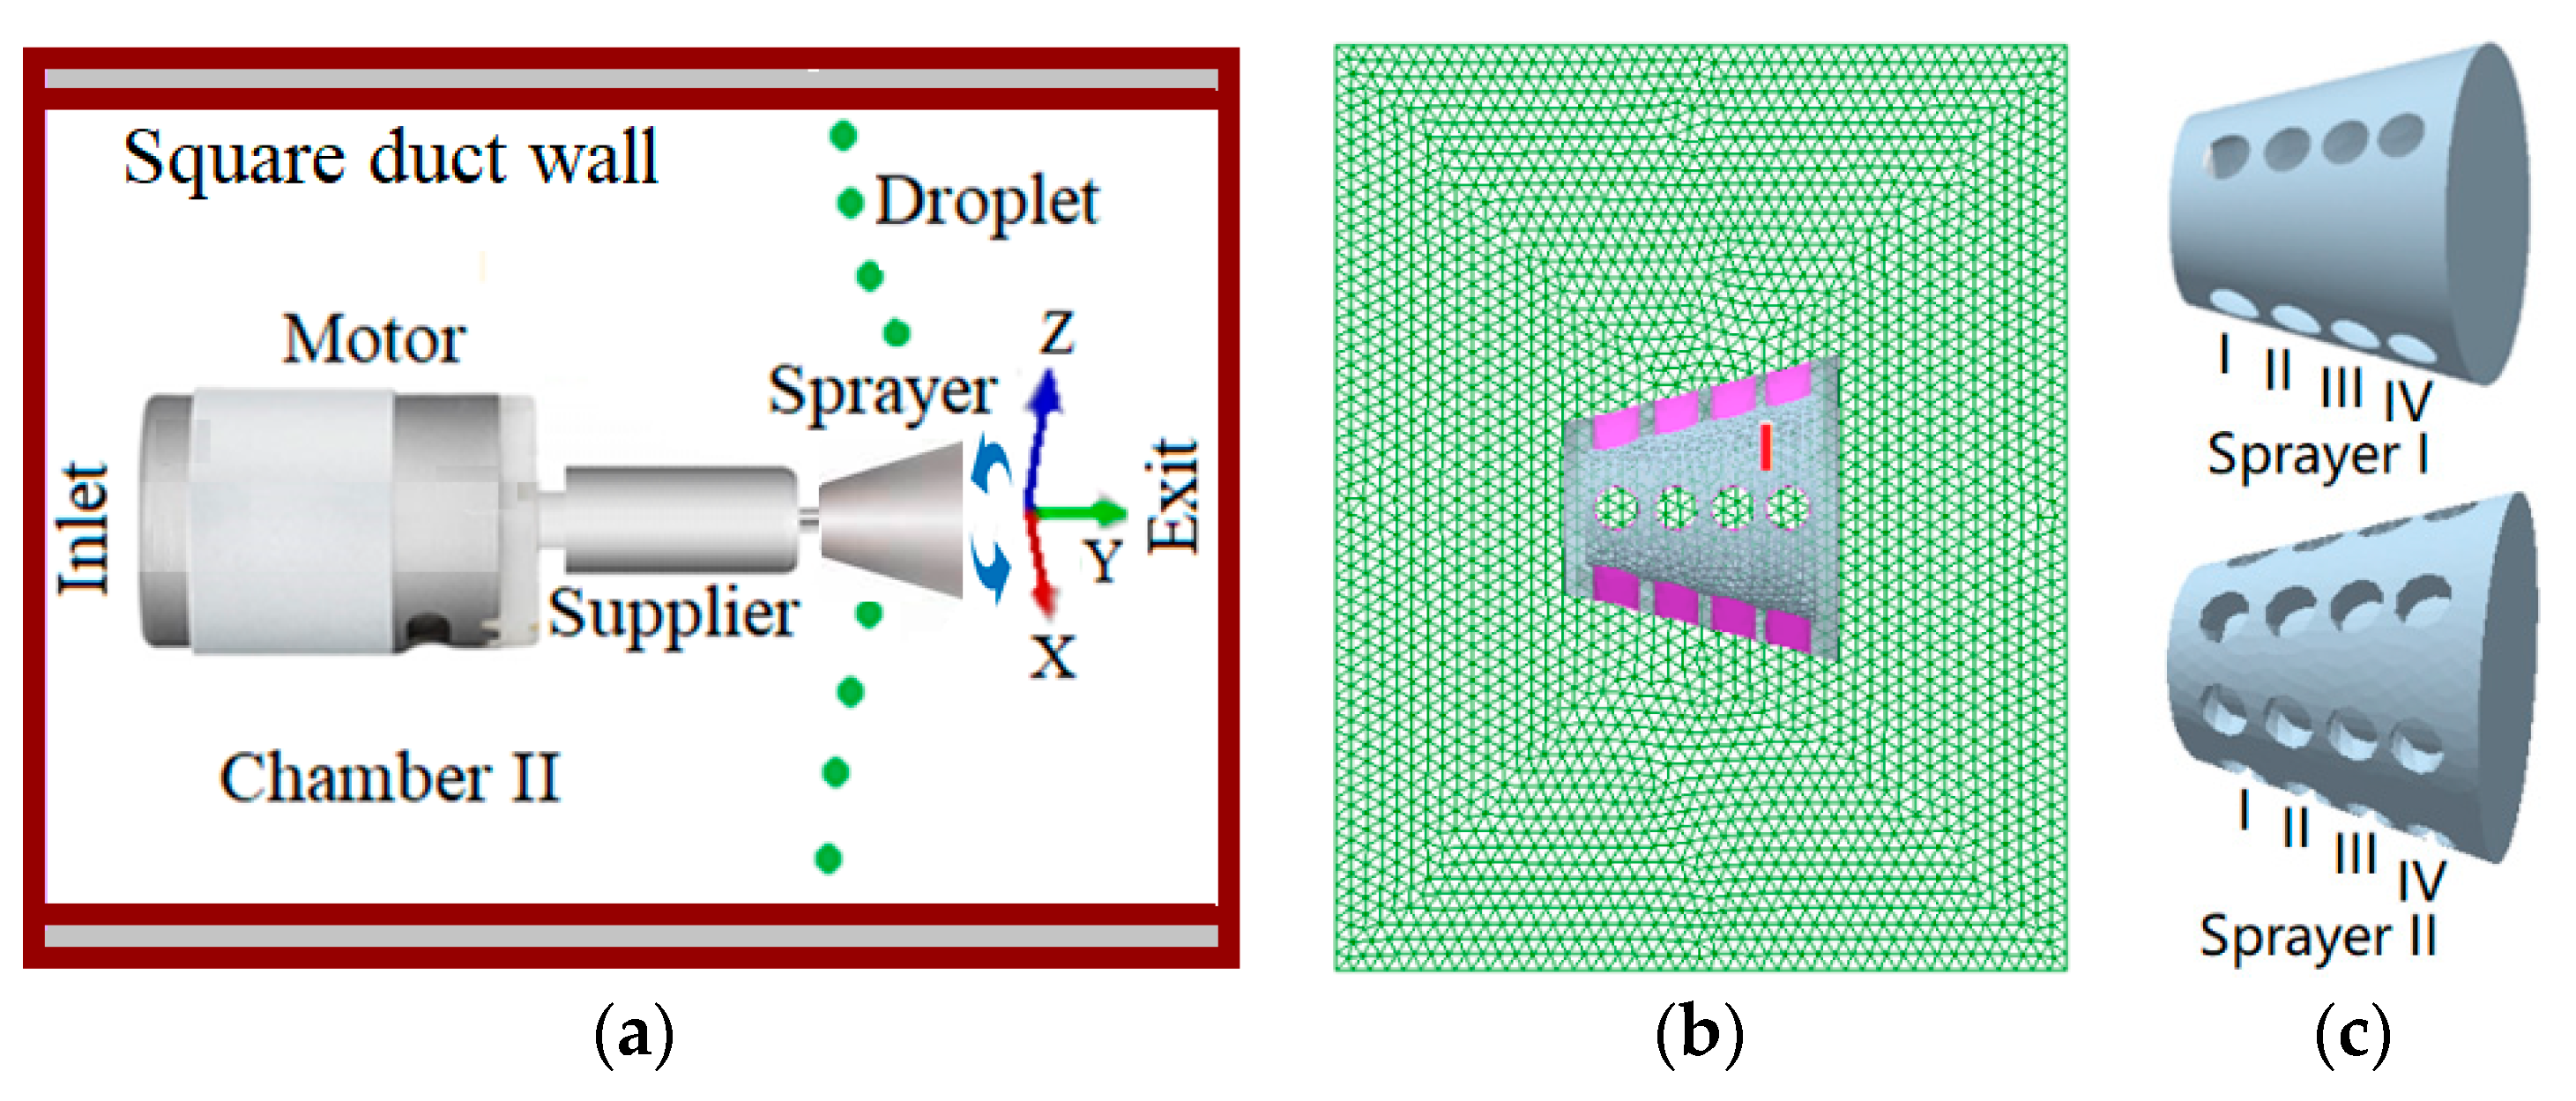
Figure 1. Schematic representation of an airless spray coating process of a square duct. (a) An airless spray coating system. (b) Rotary sprayer with grid cells. (c) Sprayer model.
Coatings 14 00282 g001
Figure 2. Creation and repose of paint droplet accumulation in the funnel device.
Coatings 14 00282 g002
Figure 3. Profiles of accumulation angles. (a) AoRs at different surface energies. (b) AoRs at different initial velocities.
Coatings 14 00282 g003
Figure 4. Profile of gas velocity magnitude using different gas turbulence models. (a) Velocity distribution. (b) Gas velocity contour.
Coatings 14 00282 g004
Figure 5. Exit droplet velocities of holes using three turbulence models. (a) Instantaneous velocities. (b) Time-averaged velocities.
Coatings 14 00282 g005
Figure 6. Simulations along walls using three turbulence models. (a) Droplet number fractions. (b) Skewness and standard deviation.
Coatings 14 00282 g006
Figure 7. Comparisons between simulations and experiments of film thickness. (a) Thickness contour. (b) Thickness distributions of simulations and experiments [54].
Coatings 14 00282 g007
Figure 8. Profiles of gas velocity vectors at the ring III. Different arrow color and length represent gas velocity magnitude. (a) Rotation speed of 4000 rpm. (b) Rotation speed of 22,500 rpm.
Coatings 14 00282 g008
Figure 9. Profiles of gas velocity magnitudes. (a) Velocities along X line. (b) Velocities along diagonal line.
Coatings 14 00282 g009
Figure 10. Typical trajectories of droplets in the square duct.
Coatings 14 00282 g010
Figure 11. Hole exit velocity magnitudes and discharge coefficients of gas and droplets. (a) Instantaneous exit gas velocities. (b) Time-averaged exit velocities and discharge coefficients.
Coatings 14 00282 g011
Figure 12. Profile of droplet velocity magnitudes of square duct walls. (a) Instantaneous droplet velocities. (b) Averaged droplet velocities.
Coatings 14 00282 g012
Figure 13. Droplets sticking on square duct walls. Four different colors represent droplets at four walls. (a) Rotation speed of 4000 rpm. (b) Rotation speed of 22,500 rpm.
Coatings 14 00282 g013
Figure 14. Profiles of droplet number fractions and film thickness along the wall length. (a) Droplet number. (b) Film thickness.
Coatings 14 00282 g014
Figure 15. Profiles of number index of droplets in the square duct.
Coatings 14 00282 g015
Figure 16. Profiles of droplet–wall collision normal and tangential force magnitudes of duct walls. (a) Instantaneous normal forces. (b) Averaged normal and tangential forces.
Coatings 14 00282 g016
Figure 17. Profiles of droplet–wall collision normal and tangential energy losses.
Coatings 14 00282 g017
Table 1. Parameters used in numerical simulations.
ParameterValueParameterValue
Horizontal duct size40.5 × 40.5 mmLarge diameter of sprayer12.5 mm
Small diameter of sprayer7.5 mmLength of rotary sprayer12.0 mm
Gas density1.2 kg/m3Gas viscosity1.8 × 10−5 Pa s
Droplet diameter0.2 mmDroplet density1060 kg/m3
Diameter of holes2.0 mmHole number of sprayer I and II16, 32
Mass flux of droplets0.0044 kg/sNumber of droplets100,000 1/s
Wall Young modulus 2.5 × 10⁸ PaYoung modulus of droplets1.2 × 107 Pa
Wall Poisson ratio0.23Droplet Poisson ratio0.25
Restitution coefficient of wall0.7Restitution coefficient of droplets0.7
Wall static friction coefficient0.5Droplet static friction coefficient 0.15
Wall rolling friction coefficient0.05Droplet rolling friction coefficient0.05
Sprayer restitution coefficient 0.7Sprayer static friction coefficient0.5
Poisson ratio of sprayer0.23Surface energy of wall–droplet100.0 J/m2
Surface energy of droplets0.03 J/m2Surface energy of wall0.04 J/m2
Table 2. Summary of some typical AoR and contact parameters in the published literature.
SourceParticlesSize, μmDensity, kg/m3Poisson’s RatioElastic Modulus, PaFriction CoefficientRestitution CoefficientSurface Energy, J/m2AoR, Degree
Shi et al. [47]Pollen19.561259.76 0.1–0.55.25 × 1060.4660.145.06 × 10−456.6
Hoshishima et al. [45]Lactose21017000.2510 × 1060.50.350.0946.1
Xia et al. [48]Wet coal6–8 mm15000.32 × 1080.1980.540.00827.82–39.94
Ajmal et al. [49]Wet sand2.8 mm20830.31 × 1080.410.35.011.25–40.35
Zhu et al. [50]Lunar soil simulant4013600.2–0.3(2.5–7.2) × 1070.1–0.90.3–0.70.02–0.0623.2–49.2
Present studyDroplets20010600.231.2 × 1070.150.70.030.42–28.78
Table 3. Summary of simulations using three gas turbulence models.
Realizable k-ε ModelRNG k-ε ModelSST k-ω Model
Gas velocity magnitudeUnlike RNG and SST modelsLike SST modelLike RNG model
Droplet velocity magnitudeLowMediumHigh
Standard deviation of niHighMediumLow
Skewness of niSmallMediumLarge
Table 4. Simulation and experimental parameters.
ParametersExperimental ValuesSimulation Values
Droplet diameter81.0 µm81.0 µm
Droplet density1317 kg/m31317 kg/m3
Inlet droplet mass flux0.02733 kg/s at p = 200 bar0.02733 kg/s
Inlet droplet velocity110–80 m/s at z = 50 and 100 mm140 m/s
Effective orifice diameter0.48–0.53 mmA rectangular inlet of 8 × 2 mm
Spray angle45 degree45 degree
Sprayer-to-target distance300 mm300 mm
Robot velocity900 mm/s900 mm/s
Disclaimer/Publisher’s Note: The statements, opinions and data contained in all publications are solely those of the individual author(s) and contributor(s) and not of MDPI and/or the editor(s). MDPI and/or the editor(s) disclaim responsibility for any injury to people or property resulting from any ideas, methods, instructions or products referred to in the content.