Article

Deposition of Polymers on Titanium Nitride Electrodes

by
Yulia Efremenko
1,
Arwa Laroussi
1,
Akant Sengül
2,
Agnieszka Anna Corley-Wiciak
3,
Inga Anita Fischer
2 and
Vladimir M. Mirsky
1,*
1
Department of Nanobiotechnology, Brandenburg University of Technology Cottbus-Senftenberg, 01968 Senftenberg, Germany
2
Department of Experimental Physics and Functional Materials, Brandenburg University of Technology Cottbus-Senftenberg, 03046 Cottbus, Germany
3
IHP—Leibniz Institut für Innovative Mikroelektronik, 15236 Frankfurt (Oder), Germany
*
Author to whom correspondence should be addressed.
Coatings 2024, 14(2), 215; https://doi.org/10.3390/coatings14020215
Submission received: 12 January 2024 / Revised: 27 January 2024 / Accepted: 28 January 2024 / Published: 8 February 2024
(This article belongs to the Section Functional Polymer Coatings and Films)

Abstract

:
The application of titanium nitride (TiN) as an electrode for electrochemical deposition or characterization requires the removal of an insulating layer from its surface. This process was studied and optimized, and the conditions for the complete removal of this layer through treatment with oxalic acid were formulated. The obtained TiN surfaces were used for the deposition of various conducting and non-conducting polymers. Two different approaches were applied: (i) in situ electrochemical synthesis of the main classes of conducting polymers, including polyaniline, polypyrrole, polythiophene, and selected derivatives thereof, and (ii) electrostatically driven layer-by-layer (LbL) deposition of multilayers of oppositely charged polyelectrolytes. The deposited polymers were characterized by electrochemical methods. The electrochemical properties of the deposited conducting polymers and their deposition on the TiN surface were comparable to those of the metallic electrodes. The films produced via LbL deposition exhibited a pronounced influence of the charge of the last deposited polymer on the redox reaction of ferri/ferrocyanide, validating the charge alteration with each successive polymer layer deposition. The studied deposition technologies can be used for the modification of TiN surfaces required in applications of this material in chemical sensors and other devices.

Graphical Abstract

1. Introduction

Titanium nitride (TiN) was introduced to the global market in the 1970s as a super-hard material (2000 kg/mm2) for protective coatings [1,2,3,4,5]. Furthermore, TiN has a high melting temperature (3000 °C), corrosion resistance, exceptional mechanical strength, and durability, as well as biological compatibility. Thanks to its electronic properties and high electrical conductivity (4000–55,500 S·cm−1 [6,7]), TiN is considered one of the most promising engineering materials for applications in various devices [8,9]. As a transition-metal nitride with a low cost, high molar density, and superior chemical resistance, TiN is used in supercapacitors [10,11]. It provides efficient charge collection [12,13] and fast charge transfer at the interface and therefore is promising for applications in electrochemical devices requiring a high power density [14] and high mechanical stability [15]. It was demonstrated that a TiN coating acts as a mechanical buffering layer that helps to prevent structural deformations during repeated charge–discharge cycling [14]. It facilitates electron transfer at the electrode/electrolyte interface, while its ability to be oxidized on the surface contributes to pseudocapacitance [16]. Examples of TiN applications in microelectronic devices include its uses as diffusion barriers [17,18], decorative coatings [19,20], ohmic contacts for semiconductors [21,22,23], and Schottky contacts [24,25]. It can also be applied in photoelectrochemical cells [26,27] and in electrocatalysis [28]. The novel field of possible TiN applications includes chemical sensors [29,30,31] and biosensors [32,33]. TiN is appealing not only because of its electrical and electrochemical properties but also because of its plasmonic properties, which are comparable to those of metallic gold or silver. An application of TiN as a resonator in refractometric surface plasmon resonance (SPR) sensors with different configurations was previously reported [34].
Many applications of TiN, for example, in electrochemical chemo- and biosensors, require surface modification of this material. Such protocols have been well developed for gold [35,36], silicium oxide [37,38], and a few other surfaces [39]. However, the deposition of designed organic layers on the surface of TiN has not been studied so far. Herein, we describe two approaches to the surface modification of TiN: in situ electrochemical polymerization of the main types of conducting polymers and electrostatically driven layer-by-layer (LbL) deposition of multilayers of oppositely charged polymers.
Conducting polymers belong to organic materials that can switch between insulating and conducting forms. This transition results from the formation of charge carriers in the polymer-conjugated backbone upon oxidation/reduction or protonation/deprotonation. The changes induced by the injection or removal of charge carriers in the polymeric matrix lead to conformational transformation and changes in the electronic structure of the conjugated backbone. This conversion provides the unique electrical, electrochemical, and optical properties of conducting polymers. Such switching is also influenced by the binding of some analytes to the backbone of the polymer or to the receptor connected to the polymer chain, which makes them useful for applications in various chemical sensors [40]. Due to the changes that can be detected by in situ resistance, UV-vis, and NIR or fluorescence, conducting polymers have acquired great potential for the implementation of various intelligent devices. Conducting polymers can be deposited onto various substrates using diverse techniques. The most popular method for the deposition of conducting polymers onto conducting supports is their electrochemical synthesis in situ. This allows one a direct electrical control of the thickness of the deposited polymer. Herein, we describe the first electrochemical synthesis of conducting polymers on the surface of TiN.
Layer-by-layer (LbL) deposition, first suggested by Decher in the 1990s [41], is another general approach to the deposition of thin organic layers of controllable thickness and structure. In thousands of publications, the deposition of various polymers or polymer/nanoparticle and even polymer/cell combinations on diverse surfaces has been described [42,43]. However, according to our knowledge, there are currently no data on the application of these techniques for deposition onto the surface of TiN.
Electrochemical polymerization on the surface of TiN requires the removal of an insulating layer that is formed spontaneously on the TiN surface. For LbL deposition, the removal of this layer is not essential, but it is also important for the application of electrochemical characterization techniques (i.e., cyclic voltammetry (CV) or electrochemical impedance spectroscopy (EIS)) to characterize the deposited organic layers. This is why the initial part of our study was focused on the optimization of the treatment procedure to remove this insulating layer from the TiN surface. This layer, formed by the oxidation of titanium nitride because of its exposure to air, was the subject of an in-depth study by Achour et al. [44]; using high-resolution XPS spectra for Ti 2p and N 1s showed the presence of such chemical species as TiN, TiO2, Ti2O3, and β–N, as well as some poorly defined chemical structures that were indicated to be oxynitride (TiNxOy) and nitrogen–oxygen (NOx, NO, or NO2). A treatment with oxalic acid was suggested to remove this layer [45].
In this work, we investigated the dissolution of this oxynitride layer on the TiN surface in detail and found the experimental conditions required to remove it completely without damage to the TiN. Then, the pretreated TiN surfaces were used for the deposition of various types of polymers using electrochemical polymerization or layer-by-layer deposition.

2. Materials and Methods

2.1. Materials and Instrumentation

Oxalic acid (98%), aniline, N-methylaniline, pyrrol, thiophene, 3-thienylboronic acid, boron trifluoride diethyletherate (BFEE), 2,6-di-tert-butylpyridine (DTBP), tetrabutylammonium hexafluorophosphate, 20% aqueous solutions of poly(diallydimethylammonium chloride) (PDDA) with a molecular weight of ~200–350 kDa and poly(allylamine hydrochloride) (PAH) with a molecular weight of 15 kDa, potassium chloride (≥99%), potassium hexacyanoferrate II trihydrate (≥99%), and potassium hexacyanoferrate III (99%) were purchased from Sigma-Aldrich (St. Louis, MO, USA); 50% aqueous solution of poly(acrylic acid) (PAA) with a molecular weight of ~3–5 kDa was from Thermo Scientific (Waltham, MA, USA), and acetonitrile (can) was from Honeywell (Charlotte, NC, USA). All chemicals were used without further purification. All solutions were prepared with deionized water additionally purified by the ELGA-Classic system.
TiN electrodes fabricated by sputtering in argon plasma on silicon plates with dimensions of 30 mm × 8 mm were generously provided by IHP GmbH (Frankfurt (Oder), Germany). The thickness of the TiN film is ~100 nm; according to [46], the deposition technology used leads to the film growing as a columnar structure.
A conventional three-electrode glass cell was used for the electrochemical experiments. The characterization of the LbL films was performed using a platinum wire 0.25 mm in diameter as the auxiliary electrode, an Ag/AgCl (sat. KCl) electrode with a double salt bridge (Metrohm, Herisau, Switzerland) as the reference electrode, and a PC-controlled Autolab PGstat12 equipped with a FRA32 impedance module and controlled by NOVA 2.1.5 software (Metrohm). The electrochemical polymerization of conducting polymers was performed using the Palm Sens Em Stat3 electrochemical interface, a carbon counter electrode, and a silver chloride reference electrode (Ag/AgCl, sat. KCl in water for aqueous solutions or Ag/AgCl 2M LiCl in ethanol for non-aqueous solutions). All the experiments were performed at room temperature. The potential values are indicated relative to the corresponding reference electrodes.
Optical characterization was performed by spectroscopic ellipsometry using SENresearch 4.0 (SER 850-NIRE, spectral range 190–3500 nm) from SENTECH Instruments GmbH (Berlin, Germany) at three different angles of incidence (60°, 65°, and 70°) for the wavelength range 400 nm ≤ λ ≤ 1700 nm. The values of the complex refractive index were extracted using the software jreftran_rt.m, version 2.1 (Photonics Group ETH Zürich, Zürich, Switzerland) to fit the raw data [47]. For this fit, the optical properties of the TiN layer were taken from previous measurements of the sputtered material [34,48].

2.2. Procedures

Prior to modification, the electrodes were cleaned to remove the insulating layer on the TiN surface by treatment with a freshly prepared solution of 8% oxalic acid. Pyrrol, polyaniline, and thiophene, as well as the derivatives of the latter two, were selected as examples of conducting polymers. The electrochemical synthesis of the conducting polymers was performed by potential cycling at a scan rate of 100 mV/s from either aqueous (polyaniline and its derivative) or organic (polypyrrole, polythiophene, and its derivative) solutions. The scan rate used corresponds to the optimal one for PANI deposition on complex substrates [49] and has been used in many publications for various polymers and electrodes. The solutions used and the potential range are summarized in Table 1. The electrode potentials in this table are indicated relative to the Ag/AgCl reference electrodes described above.
LbL deposition was performed by successive immersions of the oxalic acid-treated TiN electrode in solutions of 1 g/L of cationic (either PDDA or PAH) or anionic (PAA) polymers at pH 7.0 (adjusted with either 1 M HCl or 1 M NaOH) for 5 min with continuous stirring. Between immersions in the polymer solutions, the electrode was washed by three immersions in a large volume of pure water. The total number of individual polymer layers varied from 1 to 15. The electrochemical characterization of the synthesized films of conducting polymers was performed by cyclic voltammetry in the same electrolyte that was used for polymerization, but without monomers. Electrochemical characterization of LbL films was performed by cyclic voltammetry or impedance spectroscopy in the presence of 1 mM K3[Fe(CN)6]/K4[Fe(CN)6] using 1 M KCl as a supporting electrolyte. Three successive scans were performed for each CV experiment. EIS measurements were performed in the frequency range from 10 kHz to 100 mHz.

3. Results and Discussion

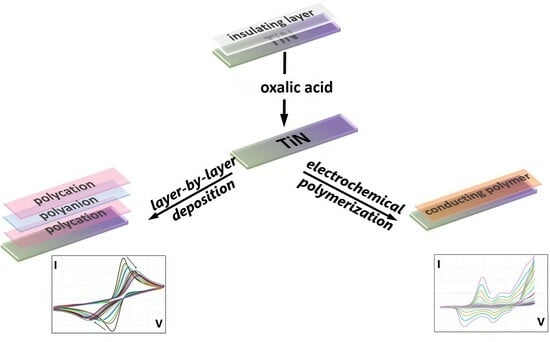
3.1. The Removal of the Insulating Layer from the TiN Surface

Electrochemical deposition on the TiN surface requires the pretreatment of this surface to remove the insulating layer. Electrical access to the surface is also required for the electrochemical characterization of polymer layers that are deposited by non-electrochemical techniques. Therefore, the first part of the current study was the removal of the oxide layer. Several approaches have been proposed for this purpose [50,51]. Iniesta et al. [45] proposed the use of sandblasting, etching in boiling 15% oxalic acid (OA) (for 60 min), and subsequent immersion in concentrated (96%) sulfuric acid before a final rinse with deionized water. After a brief comparative test of different techniques, this approach was selected for further investigation and subsequent implementation in our work. The goal was to find the conditions to remove the oxide layer while keeping the 100 nm TiN film intact. Since sandblasting can cause some scratches on the TiN film, and concentrated sulfuric acid may react with titanium, these two steps were excluded from our procedure. Therefore, the TiN surface treatment was performed using an aqueous solution of 8% OA. The treatment time was extended and optimized. The process was studied at temperatures of 308, 328, 348, and 373 K.
CV monitoring of the OA treatment (the first scan) is shown in Figure 1 and in Figures S1–S3 in the Supplementary Information (SI). In comparison with such measurements using bare gold or platinum electrodes, the CVs before treatment (Figure 1 and Figures S1–S3, black curves) also showed the oxidation and reduction peaks of ferri/ferrocyanide, but these signals were not well pronounced: the peak magnitudes were low, while the potential gap between these peaks was relatively wide. This indicates some hindrances in the electron transfer, which can be attributed to the presence of the insulating layer on the TiN surface. Oxalic acid treatment resulted in dramatic changes in CV (Figure 1 and Figures S1–S3). As the treatment progressed, the currents of the oxidation and reduction peaks increased, while the potential gap between these peaks decreased. According to [52,53], this can be considered a measure of the resistance of the insulating layer. Therefore, the decrease in the gap indicates the gradual removal of the insulating layer, which provides a better availability of TiN for electrochemical reactions with dissolved species.
The evolution of the electrochemical parameters (oxidation current (Iox), reduction current (Ired), and potential gap (ΔE)) extracted from the CV curves for different treatment times is shown in Figure 2. Such data obtained at other treatment temperatures are shown in Figures S4–S6 in the SI. In all curves, we observed an increase in the absolute values of the peak currents and a simultaneous decrease in ΔE over some characteristic time, after which these values did not change. This characteristic time (t0) characterizes the time required for oxide removal. To estimate t0, the curves were fitted by the exponential function A 0 + A e t / t 0 for ΔE(t) or by A 0 + A 1 e t / t 0 for Iox(t) and −Ired(t), where the values A and A0 are some constants, while A characterizes the maximal magnitude of the parameter changes. The value 1/t0 characterizes the reaction rate of oxide removal at a given temperature. At 373 K, fitting was performed only for the first minute because t0 was estimated to be very low (Figure 2). At 348 and 328 K, fitting was performed for the first 10 min (Figures S4 and S5). At 308 K, fitting was performed for the whole treatment time (Figure S6). The results show that the temperature increase leads to a faster removal of the oxide layer. However, too long a treatment leads to the partial or complete removal of the TiN layer. This can be detected as an increase in the gap caused by an increase in the ohmic drop. Further treatment resulted in the complete loss of electrochemical activity.
The obtained values of the reaction rate (1/t0) are shown in Figure 3 in the Arrhenius plot. The slope corresponds to the activation of energy of 62 ± 8 kJ/mol (Figure 3). This value is similar to that obtained for the dissolution of various oxides in acidic media, such as the dissolution of CuO in citric acid (69.9 kJ/mol) [54], cobalt oxides in sulfuric acid (70 kJ/mol) and EDTA (60 kJ/mol) [55], and cerium oxides in nitric acid (60–85 kJ/mol) [56].
The kinetics of the removal of the oxide layer from the TiN surface were also obtained from impedance spectroscopy. The measurements were performed in 1 M KCl in the frequency range of 100 mHz–10 kHz before treatment and after treatment in 8% oxalic acid at 373 K for 1 min, 1 h, and 4 h (Figure 4 and Figure S7). The obtained Bode plots of the impedance spectra were fitted by an equivalent circuit (Figure 4, inset) consisting of a series-connected resistor R and capacitor C. The results indicate a monotonous increase in capacitance during the treatment. However, a quantitative analysis of these data was complicated by some slow processwith characteristic time of tens of minutes. According to cyclic voltammetry, the characteristic time of the oxide removal at 373 K is on the time scale of seconds; therefore, one can expect complete removal within 1 min of treatment. At the same time, during the first minute, the specific capacitance (calculated under the assumption that the electrode surface area is equal to its geometrical area) was increased from 32 ± 2 to 49 ± 2 µF/cm2. The measured capacitance includes the serially connected capacitance of the insulating oxide layer Col and the electrical double layer (Cdl). Considering that 1 C = 1 C d l + 1 C o l and assuming that the oxide layer was completely removed after 1 min of treatment, the value of 49 ± 2 µF/cm2 can be considered the capacitance of the electrical double layer, while the capacitance of the oxide layer can be estimated to be 92 ± 2 µF/cm2. The values of the dielectric permittivity of the oxide layer are expected to be close to those of titanium oxide or titanium oxynitride. In the literature, values of 95 [57], 50 [58], and 80–100 [59] have been reported for titanium oxide, while values of 30 [60] and 28–80 [61] have been reported for titanium oxynitride. Assuming that the dielectric permittivity of the studied oxide layer on the TiN surface is ~50, we find that the thickness of this layer is ~0.5 nm.

3.2. Layer-by-Layer Deposition of Polyelectrolytes

LbL deposition is an electrostatically driven adsorption process, and the selection of the first polymer (either cationic or anionic) depends on the sign of the surface charge. To determine the sign of the surface charge, the effect of polymer adsorption on cyclic voltammetry in the presence of potassium ferri/ferrocyanide was studied. The results are shown in Figure S8. The cyclic voltammogram recorded on the TiN electrode after incubation in PDDA solution showed no change in the signal corresponding to the oxidation/reduction of ferri/ferrocyanide. However, a decrease in the oxidation and reduction peak currents and an increase in the potential gap between these peaks are observed for the TiN electrode after incubation in PAA solution, which proves that PAA was adsorbed on the TiN surface. Considering that the redox-active compound is present in the anionic form, these data indicate that the TiN surface is positively charged. This conclusion contradicts the polarity of the ζ-potential of TiN nanoparticles reported in [14,62,63], but the discrepancy can be explained by the influence of the oxide layer on the surface charge of these nanoparticles: hydrated surface oxides can be deprotonated, forming a negative surface charge. Therefore, the first polymer layer to be electrostatically deposited on the positively charged surface of the OA-treated TiN should be negatively charged, and in our case, it is PAA.
The process of LbL deposition of polymers was monitored electrochemically by CV and EIS analysis after each deposited polymer layer. Figure 5 shows the evolution of cyclic voltammograms and impedance spectra during the deposition of PAA and PDDA.
Consider the dependence of the values of Iox, Ired, Eox, Ered, and ΔE on the number of polymer layers deposited (Figure 6 and Figure S11, red curves). A decrease in the magnitudes of the oxidation and reduction peak currents and an increase in the potential gap between these peaks can be observed with each deposited bilayer of PAA and PDDA (Figure 6 and Figure S11, red curves). However, a consideration of the changes between each deposited polymer layer demonstrates systematic fluctuations in all these values. These fluctuations show the influence of the outer layer on the electrochemical reaction. When the outer layer is formed by the positively charged polymer (PDDA), the surface concentration of the negatively charged redox-active species ([Fe(CN)6]3−/4−) increases due to electrostatic attraction, leading to an increase in the electrochemical reaction rate. Conversely, when the outer layer is formed by the negatively charged polymer (PAA), the surface concentration of the negatively charged redox-active species decreases due to electrostatic repulsion, resulting in a decrease in the electrochemical reaction rate.
The same effect of systematic fluctuations in the dependence on the number of polymer layers deposited, as well as the monotonic increase with the number of polymer bilayers deposited, is observed for the resistance of charge transfer (RCT) extracted from the impedance spectra (Figure 6, right panel, red curve). These values were estimated by fitting the spectra in Figure 5B using a Randles equivalent circuit.
A very similar dependence of Iox, Ired, Eox, Ered, ΔE, and RCT is observed for the deposition of PAA and PAH (Figure 6 and Figure S11, blue curves). The data were extracted from the CV and impedance spectra shown in Figure S10. Also, for this polymer film, it is possible to observe systematic fluctuations in these parameters indicating the alteration of the surface charge, but the monotonic changes with each deposited bilayer are lower.
One can also try to attribute the observed systematic increase in the studied values characterizing the blocking of the electrochemical reaction to the formation of the polymer layer, but such an explanation attempt requires the exclusion of the possible reformation of the oxide layer during the experiment. For this purpose, both CVs and impedance spectra were measured on the OA-treated TiN electrodes during the typical deposition time of 15 polymer layers (~6 h) with an interval of 30 min between the measurements (Figure S9). The evolution of the electrochemical characteristics (Figure 6 and Figure S11, black curve) was found to be very similar to that of the PAA/PDDA films (red curve). This may indicate the significant contribution of TiN oxidation during the experiment. This conclusion allows one to suggest that the PAA/PAH polymer film can prevent such oxidation of TiN, and this may lead to lower monotonic changes in the studied electrochemical values with each deposited polymer bilayer (Figure 6 and Figure S11).
Finally, although the systematic increase in the blocking of the electrochemical reaction of ferri/ferrocyanide oxidation/reduction does not allow a definite conclusion on the polymer deposition, the systematic fluctuations in these parameters clearly indicate the alternations of the surface charge, thus proving the polymer deposition.
After several months of storage at room temperature in ambient air, the samples prepared by LbL deposition exhibited no signs of damage or detachment of the polymer layer.
Being motivated by the possible application of the PAA/PAH bilayers as surface functionalization for optical biosensors using TiN-based plasmonic structures [34,48], we also performed measurements of the complex refractive index of the material in the wavelength range of 400 nm ≤ λ ≤ 1700 nm (Figure 7).
The thickness of the polymer layer extracted from the fit is 10 nm. The real part of the refractive index is approximately constant at wavelengths above 950 nm but shows a wavelength dependence at wavelengths between 400 and 600 nm, indicating the presence of resonant absorption processes. A possible explanation for the oscillations in the real part of the permittivity at wavelengths between 800 and 950 nm is increased noise resulting from scattering off the micropores in the film at these wavelengths. Furthermore, as can be seen from the imaginary part of the complex refractive index, the absorption in the material is very low above 950 nm, making the PAA/PAH bilayer suitable as dielectric surface functionalization for possible application in SPR sensing. Finally, we note that the real part of the refractive index is within the range reported in [64]. While higher values have also been reported for selected wavelengths [65,66], on the one hand, we report on the complex refractive index over a wavelength range rather than at a constant wavelength. On the other hand, the real part of the refractive index has been shown to depend on the pH conditions during deposition [64].

3.3. In Situ Electrochemical Synthesis of Conducting Polymers

The electrochemical synthesis of several polymers belonging to different classes of conducting polymers and their derivatives was investigated on the TiN surface: polyaniline and N-methylaniline, polypyrrole, polythiophene, and poly-3-thienylboronic acid. Some polymers require the deposition of an adhesive layer for the adsorption of the synthesized polymer on the surface. For example, the deposition of a sublayer of 4-aminothiolphenol was important for the strong binding of poly-N-methylaniline to a gold electrode [67]. However, the study of the formation of all the aforementioned conducting polymers on the surface of the oxalic acid-treated surface of TiN has shown that the adhesion of all the polymers is rather strong, and no adhesive layer is required. The process of electrochemical polymerization on the TiN surface and the subsequent electrochemical activity of the deposited polymers confirm an effective charge transfer through the oxalic acid-treated TiN surface.
Figure 8A shows cyclic voltammograms obtained during the electrochemical polymerization of aniline. The curves are very similar to the cyclic voltammetric curves obtained for the polymerization of aniline on gold [68] and platinum [69] electrodes. It is possible to observe permanently growing characteristic peaks corresponding to the electrochemical activity of the formed polymer, as well as a peak in the anodic region related to the formation of cation radicals of aniline. The origin of these peaks has been discussed in detail previously [70]. Cyclic voltammetry in the same electrolyte without aniline (Figure 8B) shows the same curve but without this anodic peak. The shape of this curve and the good reversibility of oxidation/reduction (the ratio of oxidation to reduction charge is 1.02) are also typical for polyaniline electrochemically synthesized on gold or platinum surfaces [71,72]. The polymer film can be observed visually; increasing the number of cycles to 15 leads to the formation of films with the typical green color of polyaniline. Similar results were obtained by potentiostatic polymerization of aniline at +0.9 V.
Similar results for the electrochemical polymerization of N-methylaniline are shown in Figure 9A. In our work [67], mostly homogeneous films of this polymer on a gold surface were formed when perchlorate was used as the counter ion; therefore, the deposition of poly-N-methylaniline on the TiN surface was performed from perchlorate. Again, the shape of the cyclic voltammetric curve during electrochemical polymerization was very similar to that obtained on the metallic surfaces [73]. The cyclic voltammograms of the electrodes with deposited polymers measured in the same electrolyte without N-methylaniline showed good reversibility of oxidation/reduction: the ratio of the oxidation to the reduction charge was 0.84. The shape of the curve after polymer deposition was similar to that during the process of electrochemical polymerization, except for the absence of the anodic peak corresponding to the formation of the radical cation [74]. Qualitatively similar results have been reported for platinum and glassy carbon disk electrodes [73,75,76]. Some differences in the gap between oxidation and reduction peaks and the exact peak potentials can be attributed to the partial reformation of the oxide layer on the TiN surface and the influence of anions.
Polypyrrole belongs to another widely used class of conducting polymers. It has been reported that the use of aprotic solvents is preferable for electrochemical pyrrole polymerization [77]. In our work, electropolymerization was performed from a 0.1 M pyrrole solution in acetonitrile containing 100 mM of NBu4PF6 as an organic salt, dissociating into hydrophobic ions and 1% (v/v) water [78]. Potential cycling between −0.6 and +1.2 V leads to the formation of dark films on the electrode. One can also observe a permanent increase in the current during polymer growth (Figure 10A). However, its electrochemical activity is more pronounced in the cyclic voltammetry of deposited films, which was performed in the same electrolyte but without pyrrole (Figure 10B). The shape of the curve is similar to the literature data obtained for electrochemical polymerization on metallic electrodes [78]. The potentiostatic electrochemical polymerization of pyrrole on the TiN surface was performed from the same solution at +1.1 V.
According to the literature, high-quality polythiophene (PTh) films can be formed by electropolymerization in an organic electrolyte containing 90% BFEE and 10% ACN [79]. ACN is required to increase the solubility of the thiophene monomers. Recently, we optimized the polymer deposition by introducing 0.05 M DTBP into the polymerization mixture [80]; this compound acts as a dehydrating agent. Figure 11A shows cyclic voltammograms during the formation of the PTh film on the TiN electrode. The curves correspond to the literature data obtained for the electrochemical formation of PTh on gold [79] and platinum [81] electrodes. Cyclic voltammetry measured after polymerization in the same solution but without monomers shows the same broad peaks of oxidation (+1.3 V) and reduction (+0.3 V), but without the anodic peak related to the formation of cation radicals during electropolymerization (Figure 11B). A comparison of the polymerization charge and the charge of the oxidation or reduction peaks gives an electrochemical yield of the film deposition of 70%.
Poly-3-thienylboronic acid is a new conducting polymer; its synthesis and preliminary characterization were reported in [80]. This polymer has the same backbone as polythiophene, but it is functionalized by the incorporation of a chemosensitive group—boronic acid. This group has an affinity to saccharides and other diol-containing compounds [82]. The chemosensitive properties of its monomer are described in [83]. According to [80], the best films of this polymer on ITO and gold were formed using an electrolyte consisting of a mixture of 90% BFEE and 10% ACN containing 0.05 M DTBP; the same electrolyte was used in the present work. The voltammetric curves obtained during electrochemical polymerization (Figure 12A) and cyclic voltammetry after polymer deposition (Figure 12B) are very similar to those for polythiophene (Figure 11B); therefore, the presence of the boronic acid moiety has only a minor influence on the electrochemical activity of the monomer and polymer. A strong electrochromic effect was observed during potential cycling: the polymer color was changed at potentials above +0.7 V, where the red polymer film became blue. The electropolymerization of PTBA in the potentiostatic mode was performed in the same solution at +1.5 V.
The electrochemical synthesis of conducting polymers in the potentiodynamic mode usually results in more homogeneous polymer films than in the potentiostatic mode [84]. However, the use of the potentiostatic mode provides a direct possibility to measure the polymerization charge. By comparing this value with the electrochemical activity of the deposited polymers and assuming that the entire deposited polymer is electrochemically active, one can obtain the yield of the electrochemical reaction. The charge consumed during polymerization Qpolym consists of two parts: the oxidation of the polymer and the formation of cation radicals. The first part depends on the initial and final states of the polymer and is less than 0.5 electrons per monomer (doping level) for a highly conductive polymer state. The second part is 2 electrons per monomer. The oxidation charge after polymerization Qox can be assumed to be close to the first component. Therefore, the deposition efficiency (the part of the formed polymer that is adsorbed on the electrode surface) can be estimated as 5*Qox/Qpolym for the doping level of the oxidized state of 0.5 or 9*Qox/Qpolym for the doping level of 0.25. The values of the obtained deposition efficiency are shown in Table 2. These values are close to the literature data on the electrochemical deposition of different conducting polymers, which vary from 15% [85,86] to more than 50% [87].
The samples synthesized by electrochemical polymerization also showed no signs of damage after several months of storage at room temperature in ambient air.

4. Conclusions

We have demonstrated the ability to deposit various polymeric films on the surface of TiN, which is considered important for different applications. The films of conducting polymers can be deposited by in situ electrochemical polymerization. This process requires an efficient electron transfer through the interface, so it is necessary to remove the insulating layer spontaneously formed on the TiN surface due to exposure to air. The removal can be performed by treatment with oxalic acid. The treatment conditions were optimized to achieve the complete removal of the insulating layer from the TiN surface without dissolving the TiN. The efficiency of the electrochemical deposition of all types of conducting polymers studied was close to that of the deposition on metallic electrodes. The second approach for coating the TiN surface with polymers is based on the electrostatically driven LbL deposition of oppositely charged polyelectrolytes. Both deposition methods allow one to control the thickness of the polymer layer: in electrochemical deposition, it is performed by varying the polymerization charge, while in LbL deposition, it is controlled only by the number of deposition rounds. The LbL process can be easily automated to perform the deposition of tens of hundreds of monomolecular layers [88]. High adhesion of polymers to the TiN surface was observed, which makes it possible to achieve the formation of stable polymer films without the use of anchor sublayers. The obtained polymer films can be used as receptors or receptor-carried layers for the development of chemical sensors or in other technical applications.

Supplementary Materials

The supporting information can be downloaded at https://www.mdpi.com/article/10.3390/coatings14020215/s1.

Author Contributions

Conceptualization: V.M.M.; methodology: V.M.M. and I.A.F.; investigation, Y.E., A.L., A.S. and A.A.C.-W.; writing—original draft preparation: Y.E., A.L., V.M.M. and I.A.F.; writing—review and editing: V.M.M.; supervision: I.A.F. and V.M.M.; project administration: V.M.M. and I.A.F.; funding acquisition: I.A.F. All authors have read and agreed to the published version of the manuscript.

Funding

This work was supported by BMBF-Project “AgriNose” 03WIR3013A.

Institutional Review Board Statement

Not applicable.

Informed Consent Statement

Not applicable.

Data Availability Statement

The research data are available from the authors by request.

Acknowledgments

The authors are grateful to Christian Wegner and Shavkat Nizamov for fruitful discussions. Veronika Laurinavichyute is acknowledged for her participation in the optimization of the surface treatment and the electrochemical analysis of LbL assembly.

Conflicts of Interest

The authors declare no conflicts of interest.

References

  1. Toth, L.E. Transition Metal Carbides and Nitrides, 1st ed.; Academic Press: Cambridge, MA, USA, 1971; p. 296. [Google Scholar]
  2. Sproul, W.D.; Rudnik, P.J.; Gogol, C.A. The effect of target power on the nitrogen partial pressure level and hardness of reactively sputtered titanium nitride coatings. Thin Solid Films 1989, 171, 171–181. [Google Scholar] [CrossRef]
  3. Perry, A.J. A contribution to the study of poisons’ ratios and elastic constants of TiN, ZrN, and HfN. Thin Solid Films 1990, 193–194, 463–471. [Google Scholar] [CrossRef]
  4. Kužel, R.; Černý, R., Jr.; Valvoda, V.; Blomberg, M.; Merisalo, M. Complex XRD microstructural studies of hard coatings applied to PVD-deposited TiN films. Part I. Problems and methods. Thin Solid Films 1994, 247, 64–78. [Google Scholar] [CrossRef]
  5. Rao, A.U.; Tiwari, S.K.; Goyat, M.S.; Chawla, A.K. Recent developments in magnetron-sputtered silicon nitride coatings of improved mechanical and tribological properties for extreme situations. J. Mater. Sci. 2023, 58, 9755–9804. [Google Scholar] [CrossRef]
  6. Avasarala, B.; Haldar, P. Electrochemical oxidation behavior of titanium nitride based electrocatalysts under PEM fuel cell conditions. Elechtrochimica Acta 2010, 55, 9024–9034. [Google Scholar] [CrossRef]
  7. Wei, B.; Ming, F.; Liang, H.; Qi, Z.; Hu, W.; Wang, Z. All nitride asymmetric supercapacitors of niobium titanium nitride-vanadium nitride. J. Power Sources 2021, 481, 228842. [Google Scholar] [CrossRef]
  8. Patsalas, P.; Kalfagiannis, N.; Kassavetis, S. Optical properties and plasmonic performance of titanium nitride. Materials 2015, 8, 3128–3154. [Google Scholar] [CrossRef]
  9. Ghanashyam Krishna, M.; Padmanabhan, K.A. Titanium nitride based multi-functional thin films. In IOP Conference Series: Materials Science and Engineering; IOP Publishing: Bristol, UK, 2022. [Google Scholar] [CrossRef]
  10. Zhou, X.; Shang, C.; Gu, L.; Dong, S.; Chen, X.; Han, P.; Li, L.; Yao, J.; Liu, Z.; Xu, H.; et al. Mesoporous coaxial titanium nitride fibers of core-shell structures for high-performance supercapacitors. ACS Appl. Mater. Interfaces 2011, 3, 3058–3063. [Google Scholar] [CrossRef] [PubMed]
  11. Yao, B.; Li, M.; Zhang, J.; Zhang, L.; Song, Y.; Xiao, W.; Cruz, A.; Tong, Y.; Li, Y. TiN paper for ultrafast-charging supercapacitors. Nano-Micro Lett. 2020, 12, 3. [Google Scholar] [CrossRef] [PubMed]
  12. Shi, J.; Jiang, B.; Liu, Z.; Li, C.; Yan, F.; Liu, X.; Li, H.; Yang, C.; Dong, D.; Hao, J. Sputtered titanium nitride films on nanowires Si substrate as pseudocapacitive electrode for supercapacitors. Ceram. Int. 2021, 47, 26758–26767. [Google Scholar] [CrossRef]
  13. Yoo, B.; Kim, K.-J.; Kim, Y.H.; Ko, M.J.; Kim, W.M.; Park, N.G. Titanium nitride thin film as a novel charge collector in TCO-less dye-sensitized solar cell. J. Mater. Chem. 2011, 21, 3077–3084. [Google Scholar] [CrossRef]
  14. Gonzalez, Z.; Yus, J.; Moratalla, R.; Ferrari, B. Electrophoretic deposition of binder-free TiN nanoparticles to design 3D microstructures. The role of sintering in the microstructural robustness of supercapacitor electrodes. Elechtrochim. Acta 2021, 369, 137654. [Google Scholar] [CrossRef]
  15. Wang, R.; Xia, C.; Wei, N.; Alshareef, H.N. NiCo2O4@TiN core-shell electrodes trought conformal atomatic layer deposition for all-solid-state supercapacitors. Electrochim. Acta 2016, 196, 611–621. [Google Scholar] [CrossRef]
  16. Hasegawa, G.; Kitada, A.; Kawasaki, S.; Kanamori, K.; Nakanishi, K.; Kobayashi, Y.; Kageyama, H.; Abe, T. Impact of electrolyte on pseudocapacitance and stability of porous titanium nitride (TiN) monolithic electrode. J. Electrochem. Soc. 2015, 162, A77–A85. [Google Scholar] [CrossRef]
  17. Östling, M.; Nygren, S.; Petersson, C.S.; Norström, H.; Buchta, R.; Blom, H.O.; Berg, S. A comparative study of the diffusion barrier properties of TiN and ZrN. Thin Solid Films 1986, 145, 81–88. [Google Scholar] [CrossRef]
  18. Zeng, Y.; Russell, S.W.; Mckerrow, A.J.; Chen, L.; Alford, T.L. Effectiveness of TiN, Ta, TaN, and W2N as barriers for the integration of low-k dielectric hydrogen silsesquioxane. J. Vac. Sci. Technol. 2000, 18, 221–230. [Google Scholar] [CrossRef]
  19. Randhawa, H. Hard coatings for decorative applications. Surf. Coat. Technol. 1988, 36, 829–836. [Google Scholar] [CrossRef]
  20. Niyomsoan, S.; Grant, W.; Olson, D.L.; Mishra, B. Variation of color in titanium and zirconium nitride decorative thin films. Thin Solid Films 2002, 415, 187–194. [Google Scholar] [CrossRef]
  21. Ruterana, P.; Nouet, C.; Kehagias, T.; Komninou, P.; Karakostas, T.; di Forte Poisson, M.A.; Huet, F.; Morkoc, H. The microstructure of Ti/Al and TiN ohmic contacts to gallium nitride. Phys. Stat. Sol. 1999, 176, 767–771. [Google Scholar] [CrossRef]
  22. Matenoglou, G.M.; Koutsokeras, L.E.; Patsalas, P. Plasma energy and work function of conducting transition metal nitrides for electronic applications. Appl. Phys. Lett. 2009, 94, 152108. [Google Scholar] [CrossRef]
  23. Patsalas, P.; Charitidis, C.; Logothetidis, S.; Dimitriadis, C.A.; Valassiades, O. Combined electrical and mechanical properties of titanium nitride thin films as metallization materials. J. Appl. Phys. 1999, 86, 5296–5298. [Google Scholar] [CrossRef]
  24. Hultman, L.; Ljungcrantz, H.; Hallin, C.; Janzén, E.; Sundgren, J.E.; Pécz, B.; Wallenberg, L.R. Growth and electronic properties of epitaxial TiN thin films on 3C-SiC(001) and 6H-SiC(0001) substrates by reactive magnetron sputtering. J. Mater. Res. 1996, 11, 2458–2462. [Google Scholar] [CrossRef]
  25. Dimitriadis, C.A.; Lee, J.I.; Patsalas, P.; Logothetidis, S.; Tassis, D.H.; Brini, J.; Kamarinos, G. Characterization of TiNx/n-Si Schottky diodes by reactive magnetron sputtering. J. Appl. Phys. 1999, 85, 4238–4242. [Google Scholar] [CrossRef]
  26. Shiao, M.-H.; Lin, C.-T.; Huang, H.J.; Chen, P.-H.; Liao, B.-H.; Tseng, F.-G.; Lin, Y.-S. Novel gold dendritic nanoflowers deposited on titanium nitride for photoelectrochemical cells. J. Solid State Electrochem. 2018, 22, 3077–3084. [Google Scholar] [CrossRef]
  27. Kuk, S.K.; Ham, Y.; Gopinath, K.; Boonmongkolras, P.; Lee, Y.; Lee, Y.W.; Kondaveeti, S.; Ahn, C.; Shin, B.; Lee, J.-K.; et al. Continuous 3D titanium nitride nanoshell structure for solar-driven unbiased biocatalytic CO2 reduction. Adv. Energy Mater. 2019, 9, 1900029. [Google Scholar] [CrossRef]
  28. Meng, Z.; Zheng, S.; Luo, R.; Tang, H.; Wang, R.; Zhang, R.; Tian, T.; Tang, H. Transition metal nitrides for electrocatalytic application: Progress and rational design. Nanomaterials 2022, 12, 2660. [Google Scholar] [CrossRef]
  29. Khan, R.K.; Farghaly, A.A.; Silva, T.A.; Ye, D.; Collinson, M.M. Gold nanoparticle-decorated titanium nitride electrodes prepared by glancing angle deposition for sensing applications. ACS Appl. Nano Mater. 2019, 2, 1562–1569. [Google Scholar] [CrossRef]
  30. Chin, Y.-L.; Chou, J.-C.; Lei, Z.-C.; Sun, T.-P.; Chung, W.-Y.; Hsiung, S.-K. Titanium nitride membrane application to extended gate field effect transistor pH sensor using VLSI technology. J. Appl. Phys. 2001, 40, 6311–6315. [Google Scholar] [CrossRef]
  31. Stanković, D.M.; Ognjanović, M.; Martin, F.; Švorc, Ľ.; Mariano, J.F.M.L.; Antić, B. Design of titanium nitride- and wolfram carbide-doped RGO/GC electrodes for determination of gallic acid. Anal. Biochem. 2017, 539, 104–112. [Google Scholar] [CrossRef] [PubMed]
  32. Dong, S.; Chen, X.; Gu, L.; Zhang, L.; Zhou, X.; Liu, Z.; Han, P.; Xu, H.; Yao, J.; Zhang, X.; et al. A biocompatible titanium nitride nanorods derived nanostructured electrode for biosensing and bioelectrochemical energy conversion. Biosens. Bioelectron. 2011, 26, 4088–4094. [Google Scholar] [CrossRef] [PubMed]
  33. Haldorai, Y.; Hwang, S.-K.; Gopalan, A.-I.; Huh, Y.S.; Han, Y.-K.; Voit, W. Direct electrochemistry of cytochrome c immobilized on titanium nitride/multi-walled nanotube composite for amperometric nitrite biosensor. Biosens. Bioelectron. 2016, 79, 543–552. [Google Scholar] [CrossRef] [PubMed]
  34. Han, W.; Reiter, S.; Schlipf, J.; Mai, C.; Spirito, D.; Jose, J.; Wenger, C.; Fischer, I.A. Strongly enhanced sensitivities of CMOS compatible plasmonic titanium nitride nanohole arrays for refractive index sensing under oblique incidence. Opt. Express 2023, 31, 17389–17407. [Google Scholar] [CrossRef] [PubMed]
  35. Chen, Y.; Xianyu, Y.; Jiang, X. Surface modification of gold nanoparticles with small molecules for biochemical analysis. Acc. Chem. Res. 2017, 50, 310–319. [Google Scholar] [CrossRef] [PubMed]
  36. Bain, C.D.; Troughton, E.B.; Tao, Y.-T.; Evall, J.; Whitesides, G.M.; Nuzzo, R.G. Formation of monolayer films by the spontaneous assembly of organic thiols from solution onto gold. J. Am. Chem. Soc. 1989, 111, 321–335. [Google Scholar] [CrossRef]
  37. Ulman, A. Formation and structure of self-assembled monolayers. Chem. Rev. 1996, 96, 1533–1554. [Google Scholar] [CrossRef] [PubMed]
  38. Onclin, S.; Ravoo, B.J.; Reinhoudt, D.N. Engineering silicon oxide surfaces using self-assembled monolayers. Angew. Chem. Int. Ed. 2005, 44, 6282–6304. [Google Scholar] [CrossRef] [PubMed]
  39. Pujari, S.P.; Scheres, L.; Marcelis, A.T.M.; Zuilhof, H. Covalent surface modification of oxide surfaces. Angew. Chem. Int. Ed. 2014, 53, 6322–6356. [Google Scholar] [CrossRef] [PubMed]
  40. Lange, U.; Roznyatovskaya, N.V.; Mirsky, V.M. Conducting polymers in chemical sensors and arrays. Anal. Chim. Acta 2008, 614, 1–26. [Google Scholar] [CrossRef]
  41. Decher, G. Fuzzy nanoassemblies: Toward layered polymeric multicomposites. Science 1997, 277, 1232–1237. [Google Scholar] [CrossRef]
  42. Komsthöft, T.; Bovone, G.; Bernhard, S.; Tibbitt, M.W. Polymer functionalization of inorganic nanoparticles for biomedical applications. Curr. Opin. Chem. Eng. 2022, 37, 100849. [Google Scholar] [CrossRef]
  43. Krutty, J.D.; Schmitt, S.K.; Gopalan, P.; Murphy, W.L. Surface functionalization and dynamics of polymeric cell culture substrates. Curr. Opin. Biotech. 2016, 40, 164–169. [Google Scholar] [CrossRef]
  44. Achour, A.; Chaker, M.; Achour, H.; Arman, A.; Islam, M.; Mardani, M.; Boujtita, M.; Brizoual, L.L.; Djouadi, M.A.; Brousse, T. Role of nitrogen doping at the surface of titanium nitride thin films towards capacitive charge storage enhancement. J. Power Sources 2017, 359, 349–354. [Google Scholar] [CrossRef]
  45. Iniesta, J.; González-García, J.; Fernández, J.; Montiel, V.; Aldaz, A. On the voltammetric of a platinized titanium surface with respect to the specific hydrogen and anion adsorption and charge transfer processes. J. Mater. Chem. 1999, 9, 3141–3145. [Google Scholar] [CrossRef]
  46. Mazor, A.; Srolovitz, D.J.; Hagan, P.S.; Bukiet, B.G. Columnar growth in thin films. Phys. Rev. Lett. 1988, 60, 424–427. [Google Scholar] [CrossRef] [PubMed]
  47. Rose, A.H. Emergent Properties of Plasmonic Systems in the Weak to Strong Coupling Regimes. Doctoral Dissertation, Boston College, Boston, MA, USA, 2019. [Google Scholar]
  48. Reiter, S.; Han, W.; Mai, C.; Spirito, D.; Jose, J.; Zöllner, M.; Fursenko, O.; Schubert, M.A.; Stemmler, I.; Wenger, C.; et al. Titanium nitride plasmonic nanohole arrays for CMOS—Compatible integrated refractive index sensing: Influence of layer thickness on optical properties. Plasmonics 2023, 18, 831–843. [Google Scholar] [CrossRef]
  49. Molina, J.; del Río, A.I.; Cases, F. Influence of the scan rate on the morphology of polyaniline grown on conducting fabrics. Centipede-like morphology. Synth. Met. 2010, 160, 99–107. [Google Scholar] [CrossRef]
  50. Farndon, E.E.; Pletcher, D.; Saraby-Reintjes, A. The electrodeposition of platinum onto a conducting ceramic, Ebonex. Electrochimica Acta 1997, 42, 1269–1279. [Google Scholar] [CrossRef]
  51. González-García, J.; Sánchez-Cano, G.; Aldaz, A.; Montiel, V.; Fierro, J.L.G. Surface analysis of titanium electrodes. Appl. Surf. Sci. 1994, 78, 457–466. [Google Scholar] [CrossRef]
  52. Keil, R.G. Resistive electrode effects on cyclic voltammetry. J. Electrochem. Soc. 1986, 133, 1375. [Google Scholar] [CrossRef]
  53. Nicholson, R.S. Theory and application of cyclic voltammetry for measurement of electrode reaction kinetics. Anal. Chem. 1965, 37, 1351–1355. [Google Scholar] [CrossRef]
  54. Habbache, N.; Alane, N.; Djerad, S.; Tifouti, L. Leaching of copper oxide with different acid solutions. J. Chem. Eng. 2009, 152, 503–508. [Google Scholar] [CrossRef]
  55. Yakusheva, E.A.; Gorichev, I.G.; Atanasyan, T.K.; Lainer, Y.A. Kinetics if dissolution of cobalt oxides in acidic media. Russ. Metallurgy 2010, 1, 18–23. [Google Scholar] [CrossRef]
  56. Horlait, D.; Clavier, N.; Szenknect, S.; Dacheux, N.; Dubois, V. Dissolution of Cerium(IV)–Lanthanide(III) Oxides: Comparative Effect of Chemical Composition, Temperature, and Acidity. Inorg. Chem. 2012, 51, 3868–3878. [Google Scholar] [CrossRef]
  57. McPherson, J.; Kim, J.-Y.; Shanware, A.; Mogul, H. Thermochemical description of dielectric breakdown in high dielectric constant materials. Appl. Phys. Lett. 2003, 82, 2121–2123. [Google Scholar] [CrossRef]
  58. Ulrich, R.K.; Brown, W.D.; Ang, S.S.; Barlow, F.D.; Elshabini, A.; Lenihan, T.G.; Naseem, H.A.; Nelms, D.M.; Parkerson, J.; Schaper, L.W.; et al. Getting aggressive with passive devices. IEEE Circuits Devices Mag. 2000, 16, 16–25. [Google Scholar] [CrossRef]
  59. Wu, M.; Alivov, Y.I.; Morkoç, H. High-k dielectrics and advanced channel concepts for Si MOSFET. J. Mater. Sci. Mater. Electron. 2008, 19, 915–951. [Google Scholar] [CrossRef]
  60. Zanchin, V.R.; Cavallari, M.R.; Fonseca, F.J.; Albertin, K.F.; Pereyra, I.; Andrade, A.M. Low voltage organic devices with high-k TiOxNy and PMMA dielectrics for future application on flexible electronics. ECS Trans. 2011, 39, 455–460. [Google Scholar] [CrossRef]
  61. Albertin, K.F.; Pereyra, I. Study of metal-oxide-semiconductor capacitors with r.f. magnetron sputtering TiOxNy films dielectric layer. Phys. Status Solidi 2010, 3–4, 937–940. [Google Scholar] [CrossRef]
  62. Laarz, E.; Carlsson, M.; Vivien, B.; Johnsson, M.; Nygren, M.; Bergström, L.J. Colloidal processing of Al2O3-based composites reinforced with TiN and TiC particulates, whiskers and nanoparticles. Eur. Ceram. Soc. 2001, 21, 1027–1035. [Google Scholar] [CrossRef]
  63. Mortalò, C.; Cannio, M.; Zin, V.; Miorin, E.; Montagner, F.; Pasquali, L.; Montecchi, M.; Boccaccini, D.N.; Fabrizio, M.; Deambrosis, S.M. Surface optimization of commercial porous Ti substrates of titanium nitride. Membranes 2022, 12, 531. [Google Scholar] [CrossRef]
  64. Hiller, J.; Mendelsohn, J.D.; Rubner, M.F. Reversibly erasable nanoporous anti-reflection coatings from polyelectrolyte multilayers. Nature Mater. 2002, 1, 59–63. [Google Scholar] [CrossRef]
  65. Suryajaya, S.; Nabok, A.; Davis, F.; Hassan, A.; Higson, S.P.J.; Evans-Freeman, J. Optical and AFM study of electrostatically assembles films of CdS and ZnS colloid nanoparticles. Appl. Surf. Sci. 2008, 254, 4891–4898. [Google Scholar] [CrossRef]
  66. Kyung, K.-H.; Fujimoto, K.; Shiratori, S. Control of structure and film thickness using spray layer-by-layer method: Application to double anti-reflection film. Jpn. J. Appl. Phys. 2011, 50, 035803. [Google Scholar] [CrossRef]
  67. Hao, Q.; Rahm, M.; Weiss, D.; Mirsky, V.M. Morphology of Electropolymerized poly(N-methylaniline) films. Microchim. Acta 2003, 143, 147–153. [Google Scholar] [CrossRef]
  68. Tsakova, V.; Milchev, A. Electrochemical formation and stability of polyaniline films. Electrochim. Acta 1991, 36, 1579–1583. [Google Scholar] [CrossRef]
  69. Watanabe, A.; Mori, K.; Iwasaki, Y.; Nakamura, Y.; Niizuma, S. Electrochemism of polyaniline film prepared by electrochemical polymerization. Macromolecules 1987, 20, 1739–1796. [Google Scholar] [CrossRef]
  70. Baba, A.; Tian, S.; Stefani, F.; Xia, C.; Wang, Z.; Advincula, R.C.; Johannsmann, D.; Knoll, W. Electropolymerization and doping/dedoping properties of polyaniline thin films as studied by electrochemical-surface plasmon spectroscopy and by the quartz crystal microbalance. J. Electroanal. Chem. 2004, 562, 95–103. [Google Scholar] [CrossRef]
  71. Lindfors, T.; Ivaska, A. pH sensitivity of polyaniline and its substituted derivatives. J. Electroanal. Chem. 2002, 531, 43–52. [Google Scholar] [CrossRef]
  72. Mohilner, D.M.; Adams, R.N.; Argersinger, W.J. Investigation of the kinetics and mechanism of the anodic oxidation of aniline in aqueous sulfuric acid solution at a platinum electrode. J. Am. Chem. Soc. 1962, 84, 3618–3622. [Google Scholar] [CrossRef]
  73. Planes, G.A.; Rodriguez, J.L.; Miras, M.C.; Pastor, E.; Barbero, C.A. Spectroelectrochemical studies of poly(N-methyaniline) formation redox behavior and degradation. A comparison with polyaniline. Electrochim. Acta 2014, 122, 39–49. [Google Scholar] [CrossRef]
  74. Planes, G.A.; Miras, M.C.; Barbero, C. Strong effects of counterions on the electrochemistry of poly(N-methylaniline) thin films. Polym. Int. 2002, 51, 429–433. [Google Scholar] [CrossRef]
  75. Yağan, A. Electrochemical characterization of poly(N-methylaniline) films. Int. J. Electrochem. Sci. 2019, 14, 2925–2932. [Google Scholar] [CrossRef]
  76. Blomquist, M.; Lindfors, T.; Vähäsalo, L.; Pivrikas, A.; Ivaska, A. Electropolymerization and characterization of poly(N-methylaniline) and poly(N-butylaniline) in mixtures of aqueous and organic solvents. Synth. Met. 2006, 156, 549–557. [Google Scholar] [CrossRef]
  77. Sadki, S.; Schottland, P.; Brodie, N.; Sabouraud, G. The mechanism of polypyrrole electropolymerization. Chem. Soc. Rev. 2000, 29, 283–293. [Google Scholar] [CrossRef]
  78. Zhou, M.; Heinze, J. Electropolymerization of pyrrole and electrochemical study of polypyrrole. 3. Nature of “Water effect” in acetonitrile. J. Phys. Chem. 1999, 103, 8451–8457. [Google Scholar] [CrossRef]
  79. Lange, U.; Mirsky, V.M. Polythiophene films on gold electrodes: A comparison of bulk and contact resistances in aqueous and organic media. J. Solid State Electrochem. 2011, 15, 2377–2382. [Google Scholar] [CrossRef]
  80. Efremenko, Y.; Mirsky, V.M. Poly-3-thienylboronic acid: A chemosensitive derivative of polythiophene. J. Solid State Electrochem. 2020, 24, 3105–3111. [Google Scholar] [CrossRef]
  81. Li, X.; Li, Y. Electrochemical preparation of polythiophene in acetonitrile solution with boron fluoride-ethyl ether as the electrolyte. J. Appl. Polym. Sci. 2003, 90, 940–946. [Google Scholar] [CrossRef]
  82. William, L.; Brooks, A.; Sumerlin, B.S. Synthesis and applications of boronic acid-containing polymers: From materials to medicine. Chem. Rev. 2016, 116, 1375–1397. [Google Scholar] [CrossRef]
  83. Efremenko, Y.; Mirsky, V.M. 3-Thienylboronic acid as a receptor for diol-containing compounds: A study by isothermal titration calorimetry. Chemosensors 2022, 10, 251. [Google Scholar] [CrossRef]
  84. Abrantes, L.M.; Correia, J.P.; Savic, M.; Jin, G. Structural modifications during conducting polymer formation—An ellipsometric study. Electrochim. Acta 2001, 46, 3181–3187. [Google Scholar] [CrossRef]
  85. Istakova, O.I.; Konev, D.V.; Medvedeva, T.O.; Zolotukhina, E.V.; Vorotyntsev, M.A. Efficiency of polypyrrole electropolymerization undr various conditions. Russ. J. Electrochem. 2018, 54, 1243–1251. [Google Scholar] [CrossRef]
  86. Wood, G.A.; Iroh, J.O. Efficiency of electropolymerization of pyrrole onto carbon fibers. Synth. Met. 1996, 80, 73–82. [Google Scholar] [CrossRef]
  87. Syed, A.; Dinesan, M.K. Review: Polyaniline—A novel polymeric material. Talanta 1991, 38, 815–837. [Google Scholar] [CrossRef]
  88. Ivanov, S.; Kurniawan, F.; Tsakova, V.; Mirsky, V.M. Automated layer-by-layer deposition of polyelectrolytes in flow mode. Macromol. Mater. Eng. 2009, 294, 441–444. [Google Scholar] [CrossRef]
Figure 1. Cyclic voltammetry of the TiN electrode before and during treatment with 8% oxalic acid at 373 K measured at a scan rate of 50 mV/s in 1 M KCl electrolyte containing 1 mM K4[Fe(CN)6]. The duration of the oxalic acid treatment between measurements was 2 s during the first minute of the treatment, 5 min during the first hour, and 15 min during the second hour. The time indicated on the CVs in the figure corresponds to the duration of OA treatment. The arrows indicate the main direction of the current change in subsequent measurements without consideration of the fluctuations shown in Figure 2.
Coatings 14 00215 g001
Figure 2. Dependencies of Iox (A, red curves), Ired (B, blue curves), and ΔE (C, green curves) extracted from the cyclic voltammetric curves indicated in Figure 1 on the duration of oxalic acid treatment at 373 K for 2 h (left panels) and in the first minute (right panels). Curves in the right panels show exponential fitting performed to obtain the corresponding values of t0.
Coatings 14 00215 g002
Figure 3. Arrhenius plots of the reaction rates estimated as 1/t0 for Iox, Ired, and ΔE measured at different temperatures.
Coatings 14 00215 g003
Figure 4. Impedance spectra of TiN electrodes measured before (left) and after (right) 4 h treatment in 8% oxalic acid at 373 K in 1 M KCl and the fitting of these spectra by a serially connected resistor and capacitor. The data for other treatment times are indicated in Figure S7.
Coatings 14 00215 g004
Figure 5. Cyclic voltammetry (A) and impedance spectra (B) measured in the electrolyte containing 1 M KCl, 1 mM K3[Fe(CN)6], and 1 mM K4[Fe(CN)6] with the untreated TiN electrode (curve i), after 1 min cleaning in 8% oxalic acid at 373 K (curve ii), and after the deposition of each polymer layer (either PAA or PDDA, curves 1–15, where the number indicates the number of polymer layers). The colors of the curves in (B) correspond to those in (A).
Coatings 14 00215 g005
Figure 6. Dependence of ΔE (left) and RCT (right) before, after 1 min cleaning in 8% oxalic acid at 373 K, and after each incubation of the TiN electrode in the polymer solution. Red curves correspond to incubation in PAA and PDDA solutions. Blue curves correspond to incubation in PAA and PAH solutions. Black curves correspond to the control experiment characterizing the evolution of the corresponding electrochemical parameters during the exposure of OA-treated electrodes to air.
Coatings 14 00215 g006
Figure 7. The real and imaginary parts of the complex refractive index of the LbL-fabricated PAA/PAH bilayers on a 100 nm TiN layer.
Coatings 14 00215 g007
Figure 8. Cyclic voltammograms during the electrochemical synthesis of polyaniline from a 50 mM aniline solution in a 0.5M H2SO4 solution (A) and in the same electrolyte without monomers (B). Sweep rate: 100 mV/s; number of polymerization cycles: 15. The arrow indicates the current increase during polymer deposition. Different colors of cyclic voltammograms during polymer deposition in this and subsequent figures were used to separate individual cycles.
Coatings 14 00215 g008
Figure 9. Cyclic voltammograms during the electrochemical synthesis of poly-N-methylaniline from a 100 mM N-methylaniline solution in a 2 M HClO4 solution (A) and of the deposited layer in the same electrolyte without monomers (B). Sweep rate: 100 mV/s; number of polymerization cycles: 10. The arrow indicates a current increase during polymer deposition.
Coatings 14 00215 g009
Figure 10. Cyclic voltammograms during the electrochemical synthesis of polypyrrole from a 0.1 M pyrrole solution in acetonitrile containing 100 mM of NBu4PF6 and 1% (v/v) water (A) and of the deposited layer in the same electrolyte without pyrrole (B). Sweep rate: 100 mV/s; number of polymerization cycles: 7. The arrow indicates a current increase during polymer deposition.
Coatings 14 00215 g010
Figure 11. Cyclic voltammograms during the electrochemical synthesis of polythiophene from a 50 mM thiophene solution in the mixture of 90% BFEE and 10% ACN containing 0.05 M DTBP (A) and of the deposited films in the same electrolyte without monomers (B). Sweep rate: 100 mV/s; number of polymerization cycles: 14. The arrow indicates a current increase during polymer deposition.
Coatings 14 00215 g011
Figure 12. Cyclic voltammograms during the electrochemical synthesis of poly-3-thienylboronic acid from a 50 mM solution of 3-thienylboronic acid in a mixture of 90% BFEE and 10% ACN containing 0.05 M DTBP (A) and for the characterization of the deposited films in the same electrolyte without monomers (B). Sweep rate: 100 mV/s; number of polymerization cycles: 14. The arrow indicates the current increase during polymer deposition.
Coatings 14 00215 g012
Table 1. Conditions for electrochemical synthesis of conducting polymers.
PolymerMonomer ConcentrationElectrolytePotential Range/Number of Cycles
Polyaniline50 mM aniline0.5 M H2SO4−0.3~+1.0 V/15 cycles
Poly-N-methylaniline100 mM N-methylaniline2 M HClO4−0.3~+0.85 V/10 cycles
Poly-pyrrole100 mM pyrroleACN, 100 mM NBu4PF6−0.2~+1.1 V/7 cycles
Polythiophene50 mM thiophene90% BFEE/10% ACN (v/v),
50 mM DTBP
−0.2~+1.8 V/14 cycles
Poly-3-thienylboronic acid50 mM 3-thienylboronic acid90% BFEE/10% ACN (v/v),
50 mM, DTBP
−0.2~+1.8 V/14 cycles
Table 2. The efficiency of electrochemical deposition of various conducting polymers on TiN in the potentiostatic mode. The data in this table were calculated for doping levels (at the highest anodic potential) of 25% and 50%, while the data indicated in the manuscript text correspond to a doping level of 25%.
PolymerQpolym, mCQox, mCDeposition Efficiency, %, Calculated for the Doping Level 0.5Deposition Efficiency, %, Calculated for the Doping Level 0.25
PANI78.52.51629
PNMA41.13.824784
PPy54.75.75294
PTh43.93.413970
PTBA51.34.34275
Disclaimer/Publisher’s Note: The statements, opinions and data contained in all publications are solely those of the individual author(s) and contributor(s) and not of MDPI and/or the editor(s). MDPI and/or the editor(s) disclaim responsibility for any injury to people or property resulting from any ideas, methods, instructions or products referred to in the content.

