Article

3D Porous Sponge/Carbon Nanotube/Polyaniline/Chitosan Capacitive Bioanode Material for Improving the Power Generation and Energy Storage Performance of Microbial Fuel Cells

College of Light Industry, Harbin University of Commerce, Harbin 150028, China
Coatings 2024, 14(2), 152; https://doi.org/10.3390/coatings14020152
Submission received: 22 December 2023 / Revised: 18 January 2024 / Accepted: 22 January 2024 / Published: 23 January 2024

Abstract

:
Anode materials play a crucial role in the performance of microbial fuel cells (MFCs) in terms of power output. In this study, carbon nanotube (CNT)/polyaniline (PANI)/chitosan (CS) composites were prepared on a porous sponge matrix. The high electrical conductivity of CNTs, the capacitive behavior of PANI, and the biocompatibility of CS were leveraged to enhance the electricity generation and energy storage capabilities of MFCs. Experimental results demonstrated that the MFC with the modified anode achieved a maximum power density of 7902.4 mW/m3. Moreover, in the charging–discharging test, the stored electricity of the S/CNT/PANI/CS anode was 16.38 times that of the S/CNT anode when both the charging and discharging times were 30 min. High-throughput sequencing revealed that the modified composite anode exhibited remarkable biocompatibility and selective enrichment of electrogenic bacteria. Overall, this study presents a novel approach for developing composite MFC anode materials with energy storage functionality.

1. Introduction

A microbial fuel cell (MFC) is a novel device that directly converts chemical energy into electrical energy using organic matter as its raw material. It has emerged as a highly promising new energy sources. MFC research involves multiple subject areas such as materials, microbiology, and chemistry. With the continuous development of various disciplines and the continuous improvement of the testing level of instruments and equipment, since the early 1990s, more and more people have gradually devoted themselves to the study of MFCs. Compared with traditional chemical batteries, MFCs offer dual advantages in terms of operation and function. First, MFCs can decompose the substrate and convert it into electrical energy, resulting in a high energy conversion rate. Second, the exhaust gas produced during MFC operation is primarily carbon dioxide, which does not generate environmentally harmful byproducts [1,2,3,4]. However, despite their numerous advantages, MFCs exhibit a relatively low power output and cannot store charge, as is typical of fuel cells. The electricity generated can only be consumed or stored by external devices, and MFCs lack effective charge storage capabilities. Consequently, the instantaneous electrical energy produced by microorganisms cannot provide a substantial output current. This core issue is the primary cause of the low output current observed in MFCs.
In recent years, there has been a significant research focus on capacitive bioanodes, which integrate capacitive electrode materials (such as metal oxides and conductive polymers) with bioanodes. This integration enables the constructed MFC to simultaneously generate electricity and store energy [5,6,7,8,9]. Wang et al. [10] electrodeposited manganese dioxide on a carbon felt substrate as the anode of the MFC and achieved a maximum power density of 16.47 W/m3, which was 3.5 times that of the MFC with a blank carbon felt anode. Furthermore, the MnO2 capacitive anode exhibited a significantly higher average peak current density, which was 36 times that of the CF anode during the discharge test. In another study, Peng et al. [11] constructed an MFC with an Fe3O4-modified anode. During a 10 min discharge test, the cumulative output of the modified anode was 41% higher than the control. Chi et al. [12] observed that an MFC constructed with polypyrrole (PPy) prepared on graphite felt exhibited a 15% higher power density than the unmodified MFC. Additionally, Wang et al. [13] prepared a PPy composite anode material to enhance the power generation and energy storage performance of the MFC. The MFC equipped with the modified anode exhibited a power density that was 4.34 times that of the control. In the charging–discharging test, the modified capacitive anode achieved a stored charge of 333 mC/cm2. However, capacitive materials generally possess a small specific surface area and limited conductive properties, necessitating their combination with carbon materials to enhance their specific surface area and conductivity.
Carbon nanotubes (CNTs) stand out among various carbon materials owing to their unique tubular structure, large specific surface area, excellent electronic conductivity, and chemical stability. Additionally, CNTs can penetrate bacteria, facilitating direct electron transfer between the electrode and the strain [14]. The rough surface of CNTs stimulates strains to produce more fimbriae, enabling them to adhere tightly and providing a bridge for electron transfer [15]. Erbay et al. [16] utilized a one-step vapor deposition method to coat CNTs onto a 3D sponge matrix as an anode material for MFCs. This approach achieved a high power density of 170 W/m3, surpassing the performance of carbon felt. Studies have demonstrated that MFC electrodes modified with both TiO2 nanoparticles and CNTs exhibited a significantly higher output power than electrodes modified with only CNTs or TiO2 [17]. Similarly, when SnO2/CNT-modified MFC anodes were used, SnO2 particles enhanced strain metabolism, while CNTs contributed to biofilm formation, facilitating electron transfer between strains and electrodes [18]. Zou et al. [19] prepared PPy/CNT electrodes through in situ chemical polymerization. The output power of the MFC increased with the density of the active substance. In the MFC, the PPy/CNT-modified anode with a density of 5 mg/m2 exhibited a maximum power output of 228 mW/m2, surpassing the power achieved by MFC electrodes modified with PPy or CNTs alone.
Although combining capacitive materials with carbon materials can enhance the electricity generation and storage performance of MFCs, the charge generation primarily depends on the metabolism of microorganisms. Therefore, the biocompatibility of electrode materials plays a crucial role in the overall output performance of MFCs. Recent studies have focused on improving the biocompatibility of anode materials by incorporating polysaccharide polymers. Wang et al. [20] modified an MFC anode with sodium alginate, resulting in a 1.38-fold increase in power density compared with the control. In the charging test, the modified anode achieved a stored charge of 1984.42 C/m2. Higgins et al. [21] utilized chitosan (CS)-doped CNTs as the primary structure for the MFC anode material, achieving a maximum output power density of 4.75 W/m3. Liu et al. [22] employed a CS/CNT composite material as a bio-cathode to improve the electricity generation performance of MFCs, resulting in a 130% increase in the maximum power density compared with a blank cathode.
In summary, the development of dual-function bioanode materials with high bioelectrocatalytic activity and charge storage capacity is essential to enable MFCs to simultaneously generate electricity and store energy. In this study, a CNT/PANI/CS capacitive composite biological anode material was prepared on a three-dimensional porous sponge matrix. The porous nature of the sponge matrix, combined with the advantages of PANI as a capacitive material for energy storage and the good biocompatibility of CS, endowed the anode with several benefits. These include a large specific capacity, high porosity, significant specific surface area, excellent electron transfer ability, and good biocompatibility. When the power supply and electricity demand are not in sync, the electricity generated by microorganisms is initially stored in the capacitive anode. When electricity is required, a larger current (the sum of the stored and generated portions) can be rapidly released, significantly enhancing the current output. This capability remarkably improves the MFC’s ability to provide power for high-power electrical equipment, effectively addressing the issue of low MFC output power.

2. Materials and Methods

2.1. Sponge Pretreatment

The sponge with a pore size of ~1 mm was cut into slices measuring 2 cm × 2 cm × 3 mm. The cut sponge slices were subjected to ultrasonic cleaning in anhydrous ethanol for 30–50 min. The process was repeated three to five times to remove any surface and internal oil from the electrodes.
The sponge, following ultrasonic cleaning, was rinsed with distilled water and then dried in an air-blast drying oven at 60 °C. The dried sponge was set aside for further use.

2.2. Preparation of Capacitive Anode Materials

The treated CNTs were dissolved in anhydrous ethanol at a concentration of 1 g/L under ultrasonication. The resulting dispersion was evenly deposited onto the sponge matrix, and the system was dried at 60 °C for 10 cycles to obtain the S/CNTs electrodes. CS was dissolved in 20 mL of 2% acetic acid, and the solution was added to the treated S/CNT electrode and stirred for 1 h. Subsequently, 1.86 g of aniline was dissolved in a 20 mL solution of 2 mol/L hydrochloric acid. The aniline solution was gradually added to the above CS mixture under continuous stirring. The resulting mixture was placed in an ice water bath, and the dropwise addition of a 40 mL solution of ammonium persulfate (containing 4.56 g of ammonium persulfate) caused the mixture to gradually turn yellow–green. The pH was adjusted to ~7 by adding NaOH solution, and precipitation occurred. After allowing the mixture to stand for 24 h, the in-situ-grown S/CNT/PANI/CS electrode was removed, washed with distilled water, and dried at 80 °C.

2.3. MFC Construction

The MFC device utilized in this study was a two-compartment MFC with a unilateral volume of 180 mL, manufactured by the Vente Experimental Vessel Factory. The anode was secured using a titanium wire and placed in the anode chamber. A 180 mL nutrient solution was added to the anode chamber. Cathode chamber: The cathode solution consisted of potassium ferricyanide (K3[Fe(CN)6]) solution at a concentration of 10 g/L. Four carbon rods with a diameter of 8 mm and a height of 50 mm were employed as the cathode. The cathode surface was polished with sandpaper before use, cleaned via ultrasound, and then fixed with a titanium wire after drying (a physical image of the MFC is presented in Figure S1). The MFC device was assembled, and the external circuit was connected to a resistor (1000 Ω). Subsequently, the MFC was placed in a constant-temperature oven (WIGGENS, Beijing, China) at 28 °C, and the anode potential and the MFC output voltage were recorded at regular intervals. Sodium acetate weighing 0.45 g (2.5 g/L) was added to the anode solution. Once the MFC output voltage stabilized, the electrochemical test was conducted. Prior to the test, the cathode solution was replaced, and the circuit was left open in advance to achieve stabilization. The composition of the nutrient solution in the anode chamber is provided in Table S1.

2.4. Characterizations and Measurements

Prior to the electrochemical test of the MFC, an open-circuit treatment was conducted, and the test was performed after the open-circuit voltage stabilized. A saturated calomel electrode was used as the reference electrode. The output voltage of the MFC was monitored until it reached a stable level, and then the circuit was then opened for 1 h. The MFC was subjected to linear sweep voltammetry (LSV) using the CHI760E electrochemical workstation (Chenhua, Shanghai, China). The LSV was performed in the second to fifth cycles of the two-electrode system. A linear potential sweep was applied between the biological anode and cathode of the MFC, and the corresponding current intensity was recorded by the workstation. The power of the MFC was calculated using Equation (1).
P = U 2 × 1000 R × V
where: P—power, mW/m3
U—output voltage, V
R—external resistance, Ω
V—anode chamber volume, m3
The AC impedance measurement of the MFC anode can provide insights into the internal resistance and charge transfer impedance of the electrode system. The Z view was employed to simulate the equivalent circuit, and the corresponding impedance values were obtained by fitting the test results. The chronocurrent test was used to determine the amount of electricity generated and stored by the capacitive anodes. This test involved applying a constant voltage to the MFC, specifically charging the MFC anode at a constant potential relative to the reference electrode and obtaining the current–time relationship curve. The discharge test of the MFC was performed under a constant voltage of −0.1 V. The given external voltage remained the same throughout all discharge tests.
The HITACHI SU8020 scanning electron microscope (Hitachi, Tokyo, Japan) was utilized to characterize the structure and surface morphology of the materials by generating backscattered electrons and secondary electrons and imaging them. The test conditions included an acceleration voltage of 15.0 kV, a resolution of 3 nm, and a working distance of 10 mm. The infrared absorption and emission spectra of samples were obtained via Fourier-transform infrared spectroscopy (FTIR; Thermo Nicolet I200, Thermo fisher, Waltham, MA, USA). The sample absorbed energy at specific frequencies in the interferometer optical path, and the corresponding interference intensity curve was generated. This curve was then mathematically Fourier-transformed to convert the specific frequencies into the corresponding infrared spectrum. The genomic DNA extracted was subjected to agarose electrophoresis detection using the standard measurement method provided by the Shanghai Shengong Biological Company (Shanghai, China) to assess its integrity and concentration. High-throughput sequencing technology was employed for this purpose. The protein content of the bioanodes was calibrated through the modified BCA method using the protein concentration determination kit (Shanghai Shengong Biological Company, Shanghai, China), in which BCA and Cu+ formed a blue–purple complex. The protein concentration of the anode was determined by performing three parallel calibrations of samples with different protein contents using an ultraviolet spectrophotometer (Shanghai Fuda Company, Shanghai, China).

3. Results and Discussion

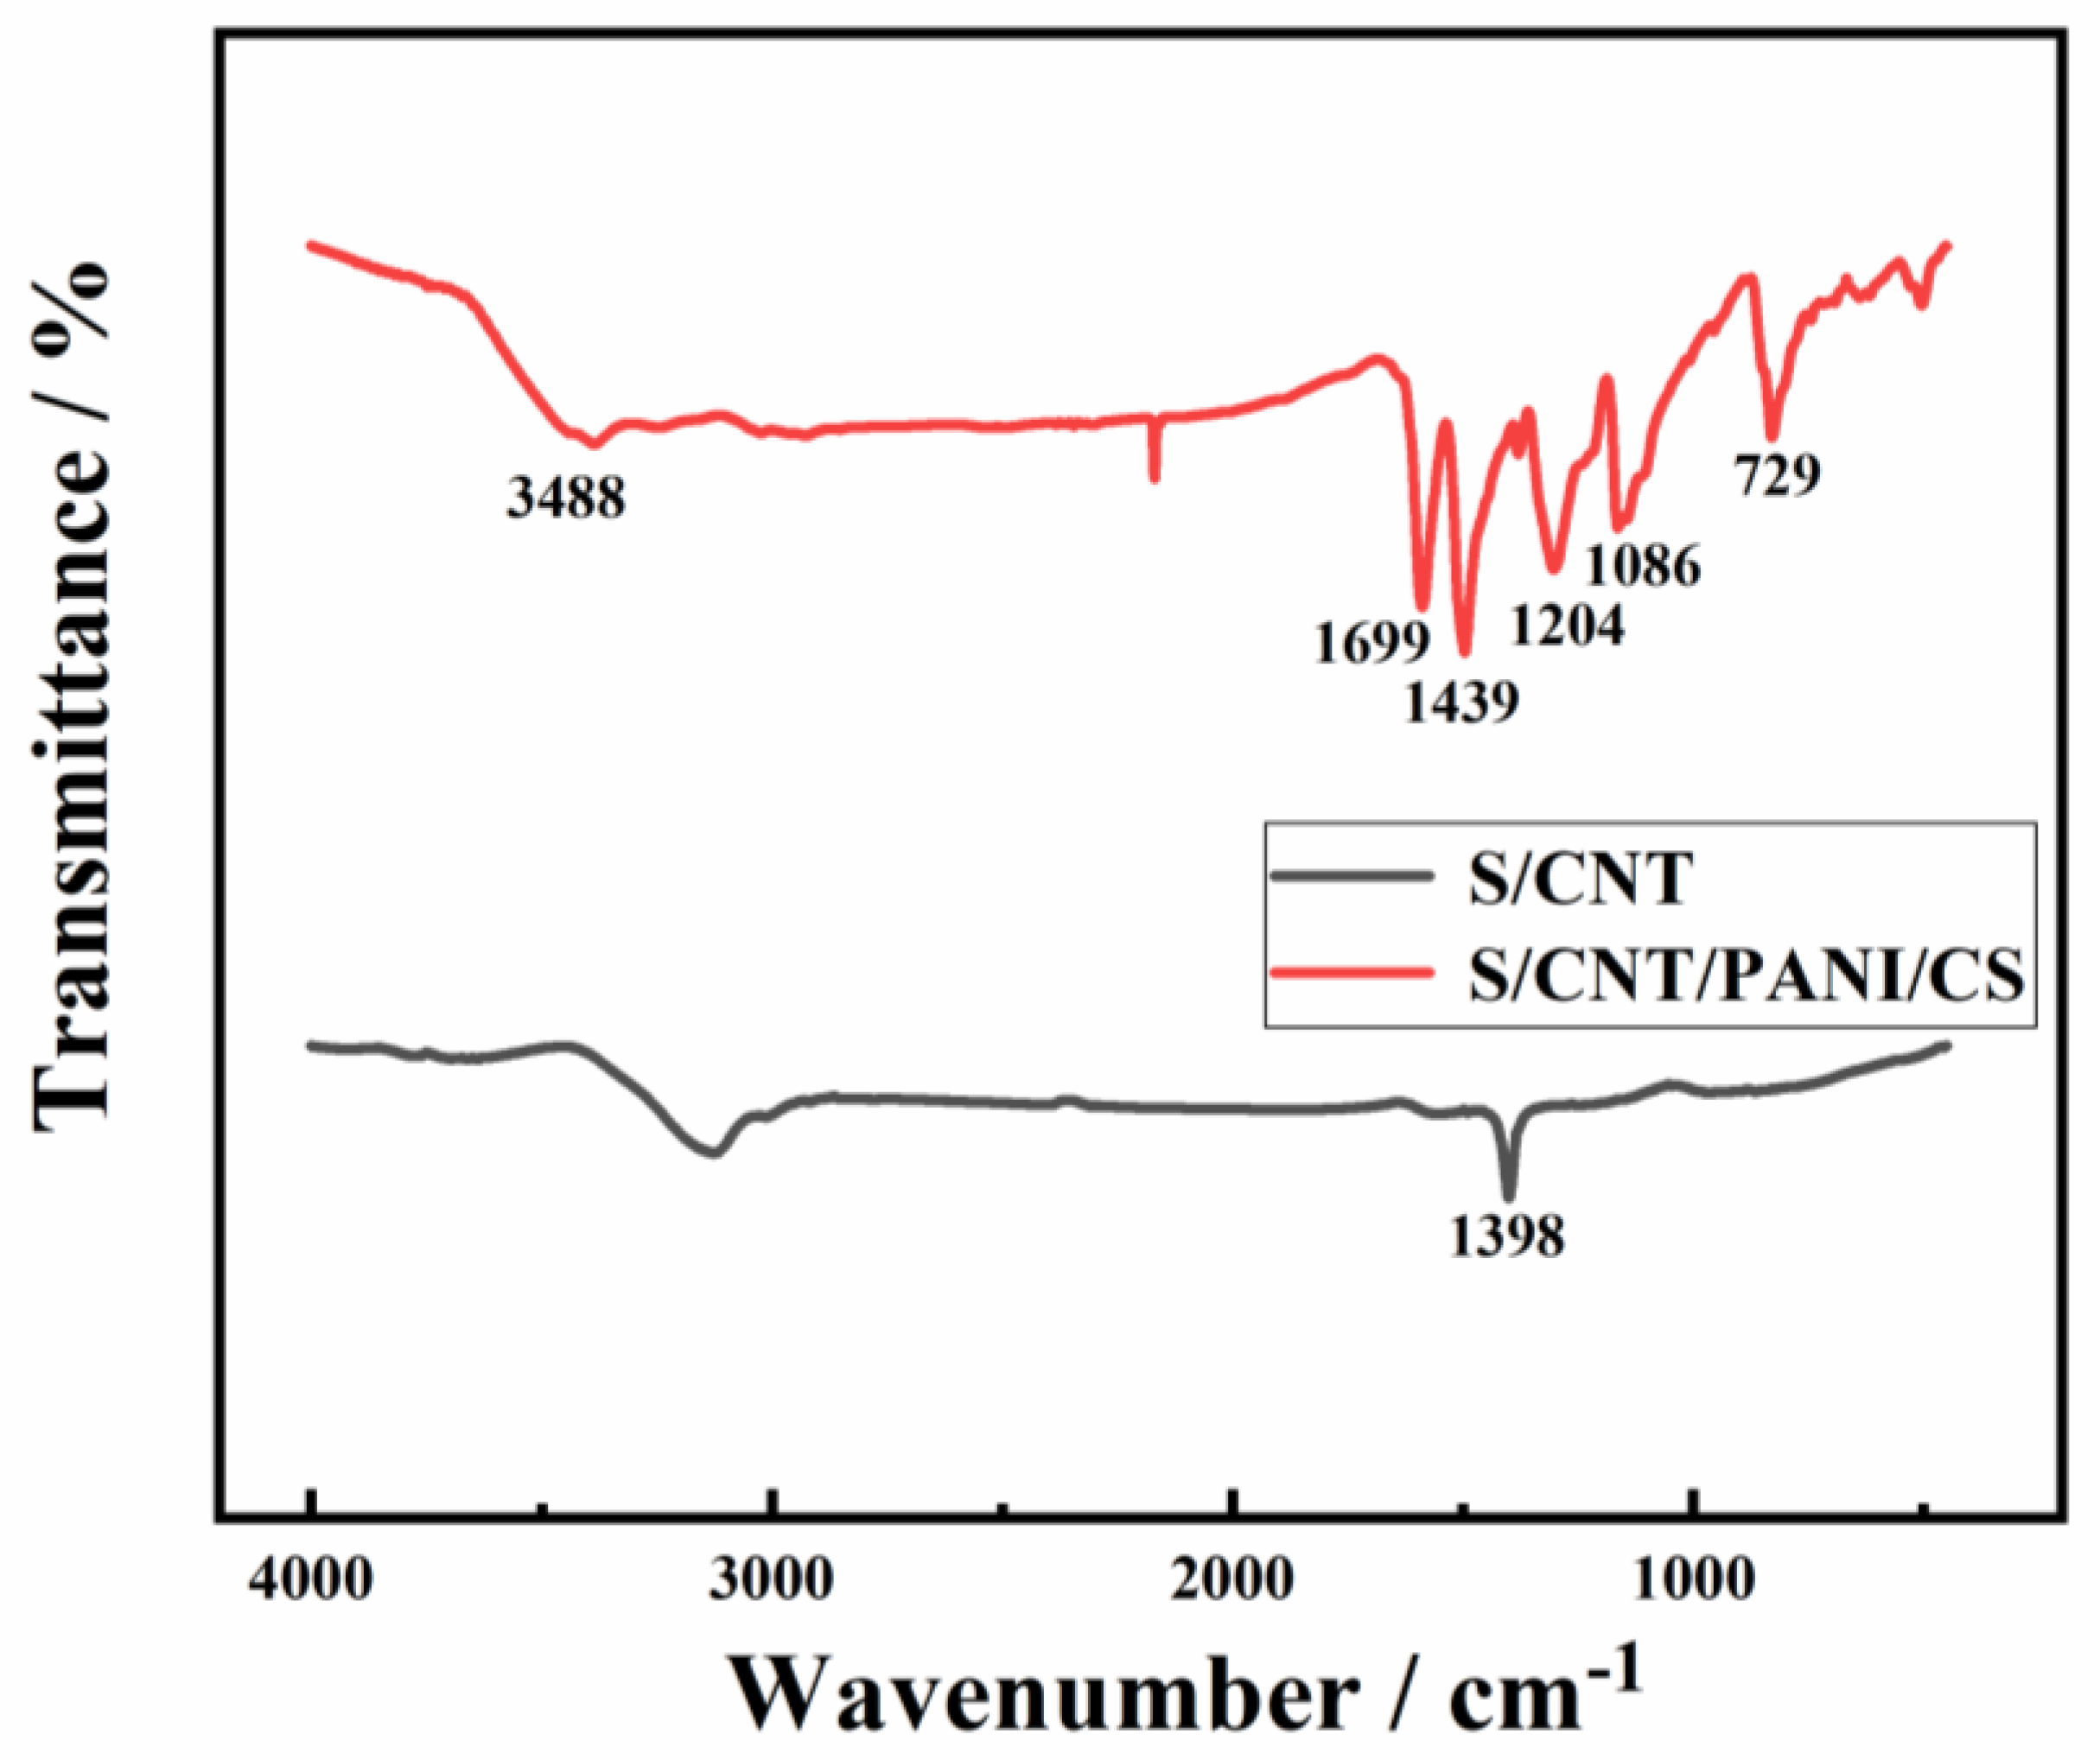
3.1. Physicochemical Characterization of the S/CNT/PANI/CS Electrode

Figure 1 displays the scanning electron microscopy (SEM) images of the different electrodes. Figure 1a,b display the SEM images of S/CNT electrodes at different magnifications, while Figure 1c,d display the SEM images of S/CNT/PANI/CS electrodes at different magnifications. Figure 1a,b show the 3D porous structure of the sponge, with CNTs loaded onto the sponge matrix. Figure 1c,d depict the SEM image of S/CNT/PANI/CS electrodes prepared via the in-situ-growth method at varying magnifications. As is evident from the figures, the active substances on the sponge matrix significantly increased, and the electrode prepared via the in situ growth method contained a higher amount of active material. A higher quantity of active material promotes electron transfer from the microbial surface to the electrode.
Figure 2 depicts the infrared absorption spectra of two materials: S/CNT and S/CNT/PANI/CS electrodes. The top spectrum represents the S/CNT/PANI/CS electrode, while the bottom spectrum corresponds to the S/CNT electrode. In the S/CNT/PANI/CS electrode spectrum, the peak at 1699 cm−1 corresponds to the -C=O vibration of the amide–HNCOCH3 group, which is indicative of partially deacetylated CS. The peak at 3488 cm−1 corresponded to the hydrogen bond between the amino group and water. With the addition of CS molecules, steric hindrance increased, resulting in a broader peak and a redshift. The peak at 1488 cm−1 corresponded to the C=C stretching vibration absorption in the benzene structure, while the absorption peak at 1204 cm−1 was caused by the stretching vibration of the C–N bond in the benzene structure. The peak at 1086 cm−1 corresponded to the C=N stretching vibration in the quinone structure (N=Q=N). Lastly, the absorption peak at 729 cm−1 corresponded to the C–H vibration expansion in the benzene ring structure. These peaks are characteristic of PANI. In the S/CNT electrode spectrum, the characteristic peak at 1398 cm−1 is attributable to the ordered arrangement of graphitized carbon atoms.

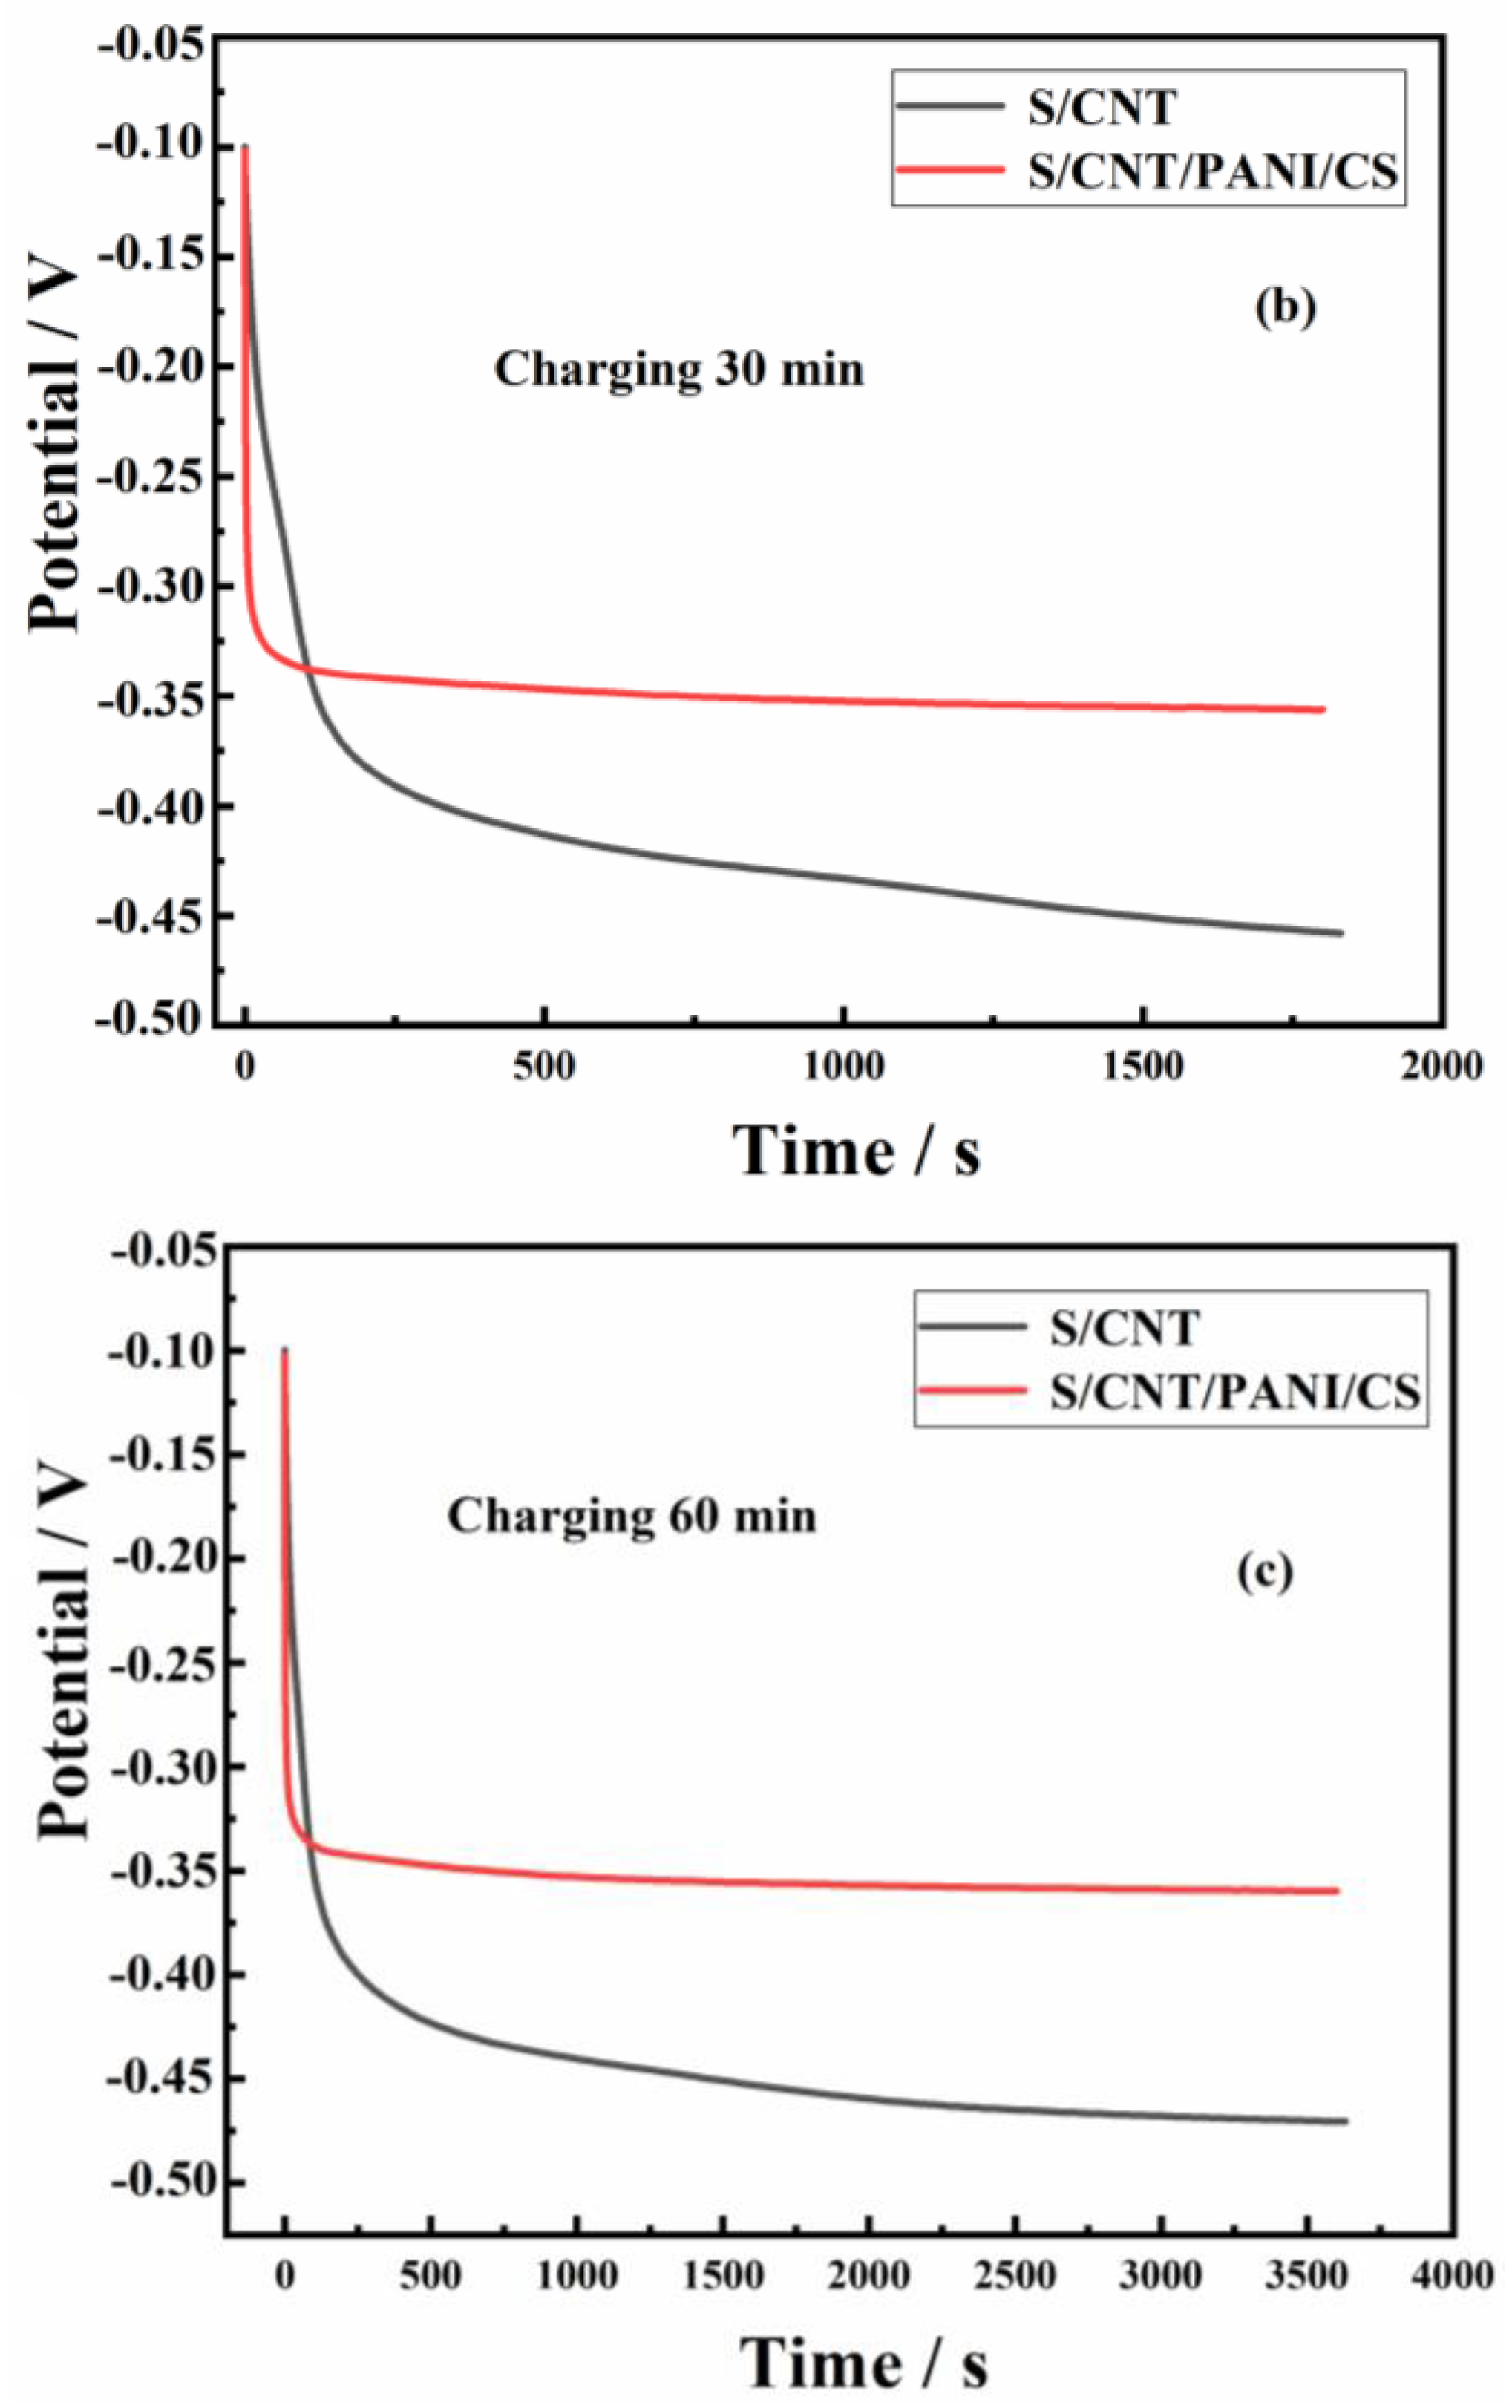
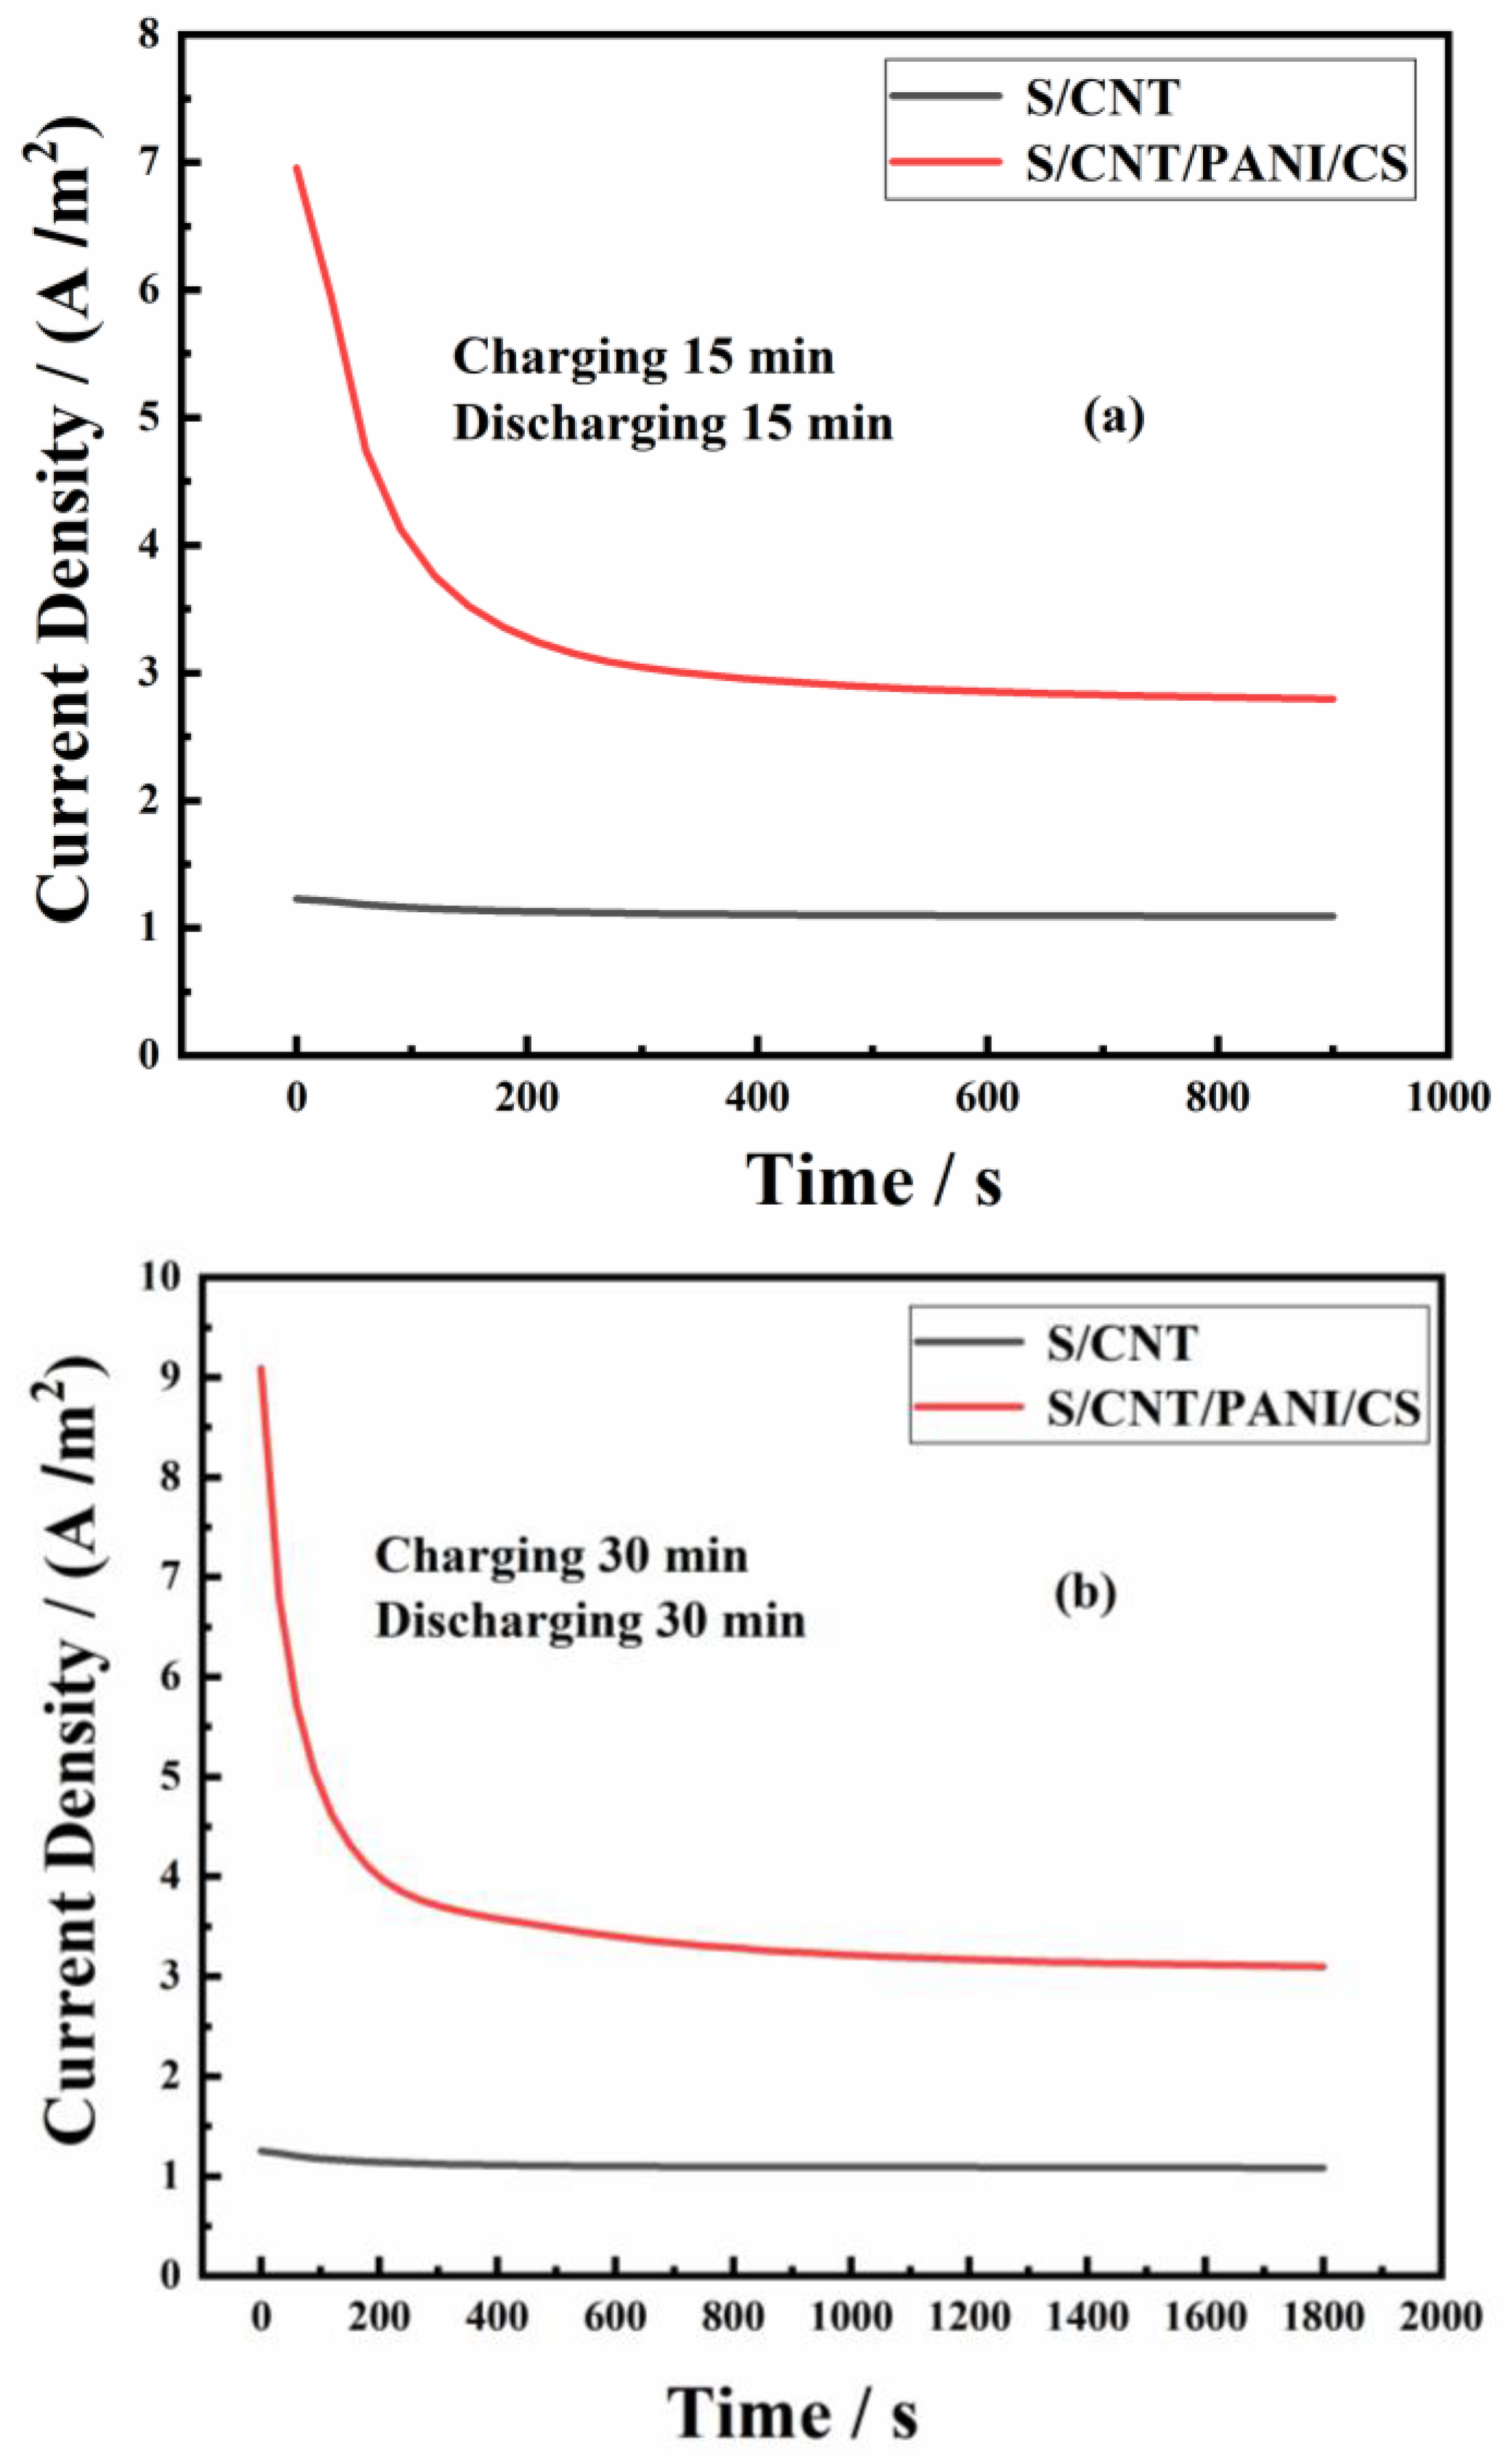
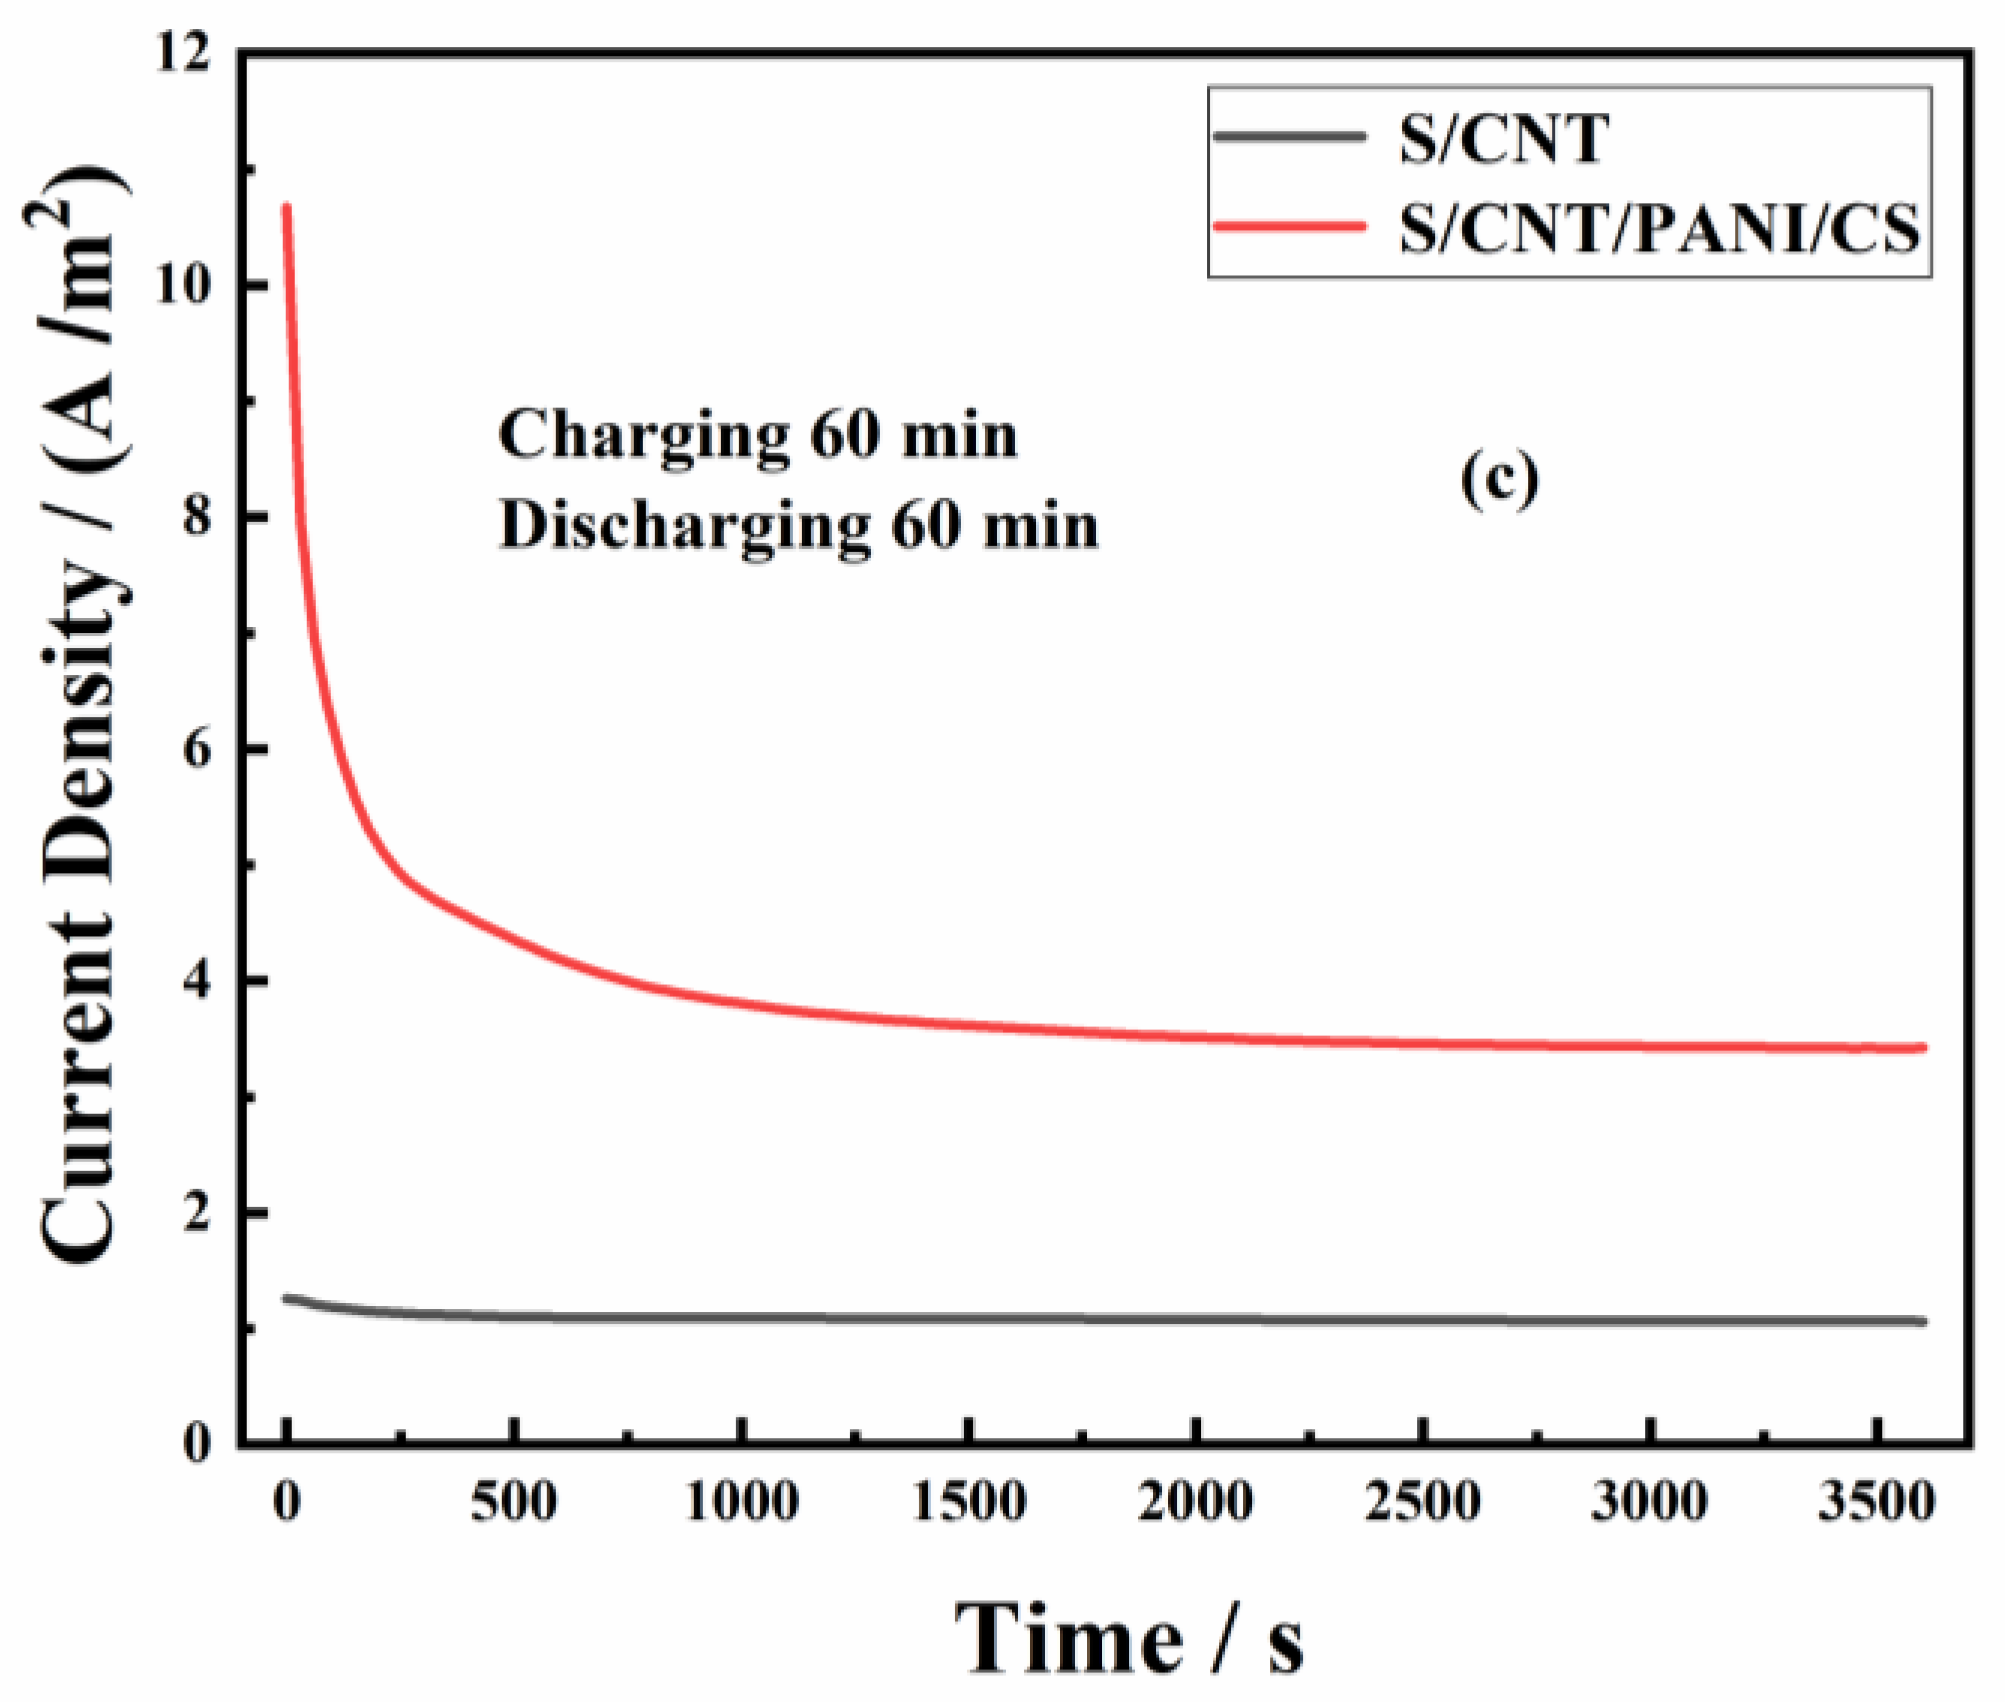
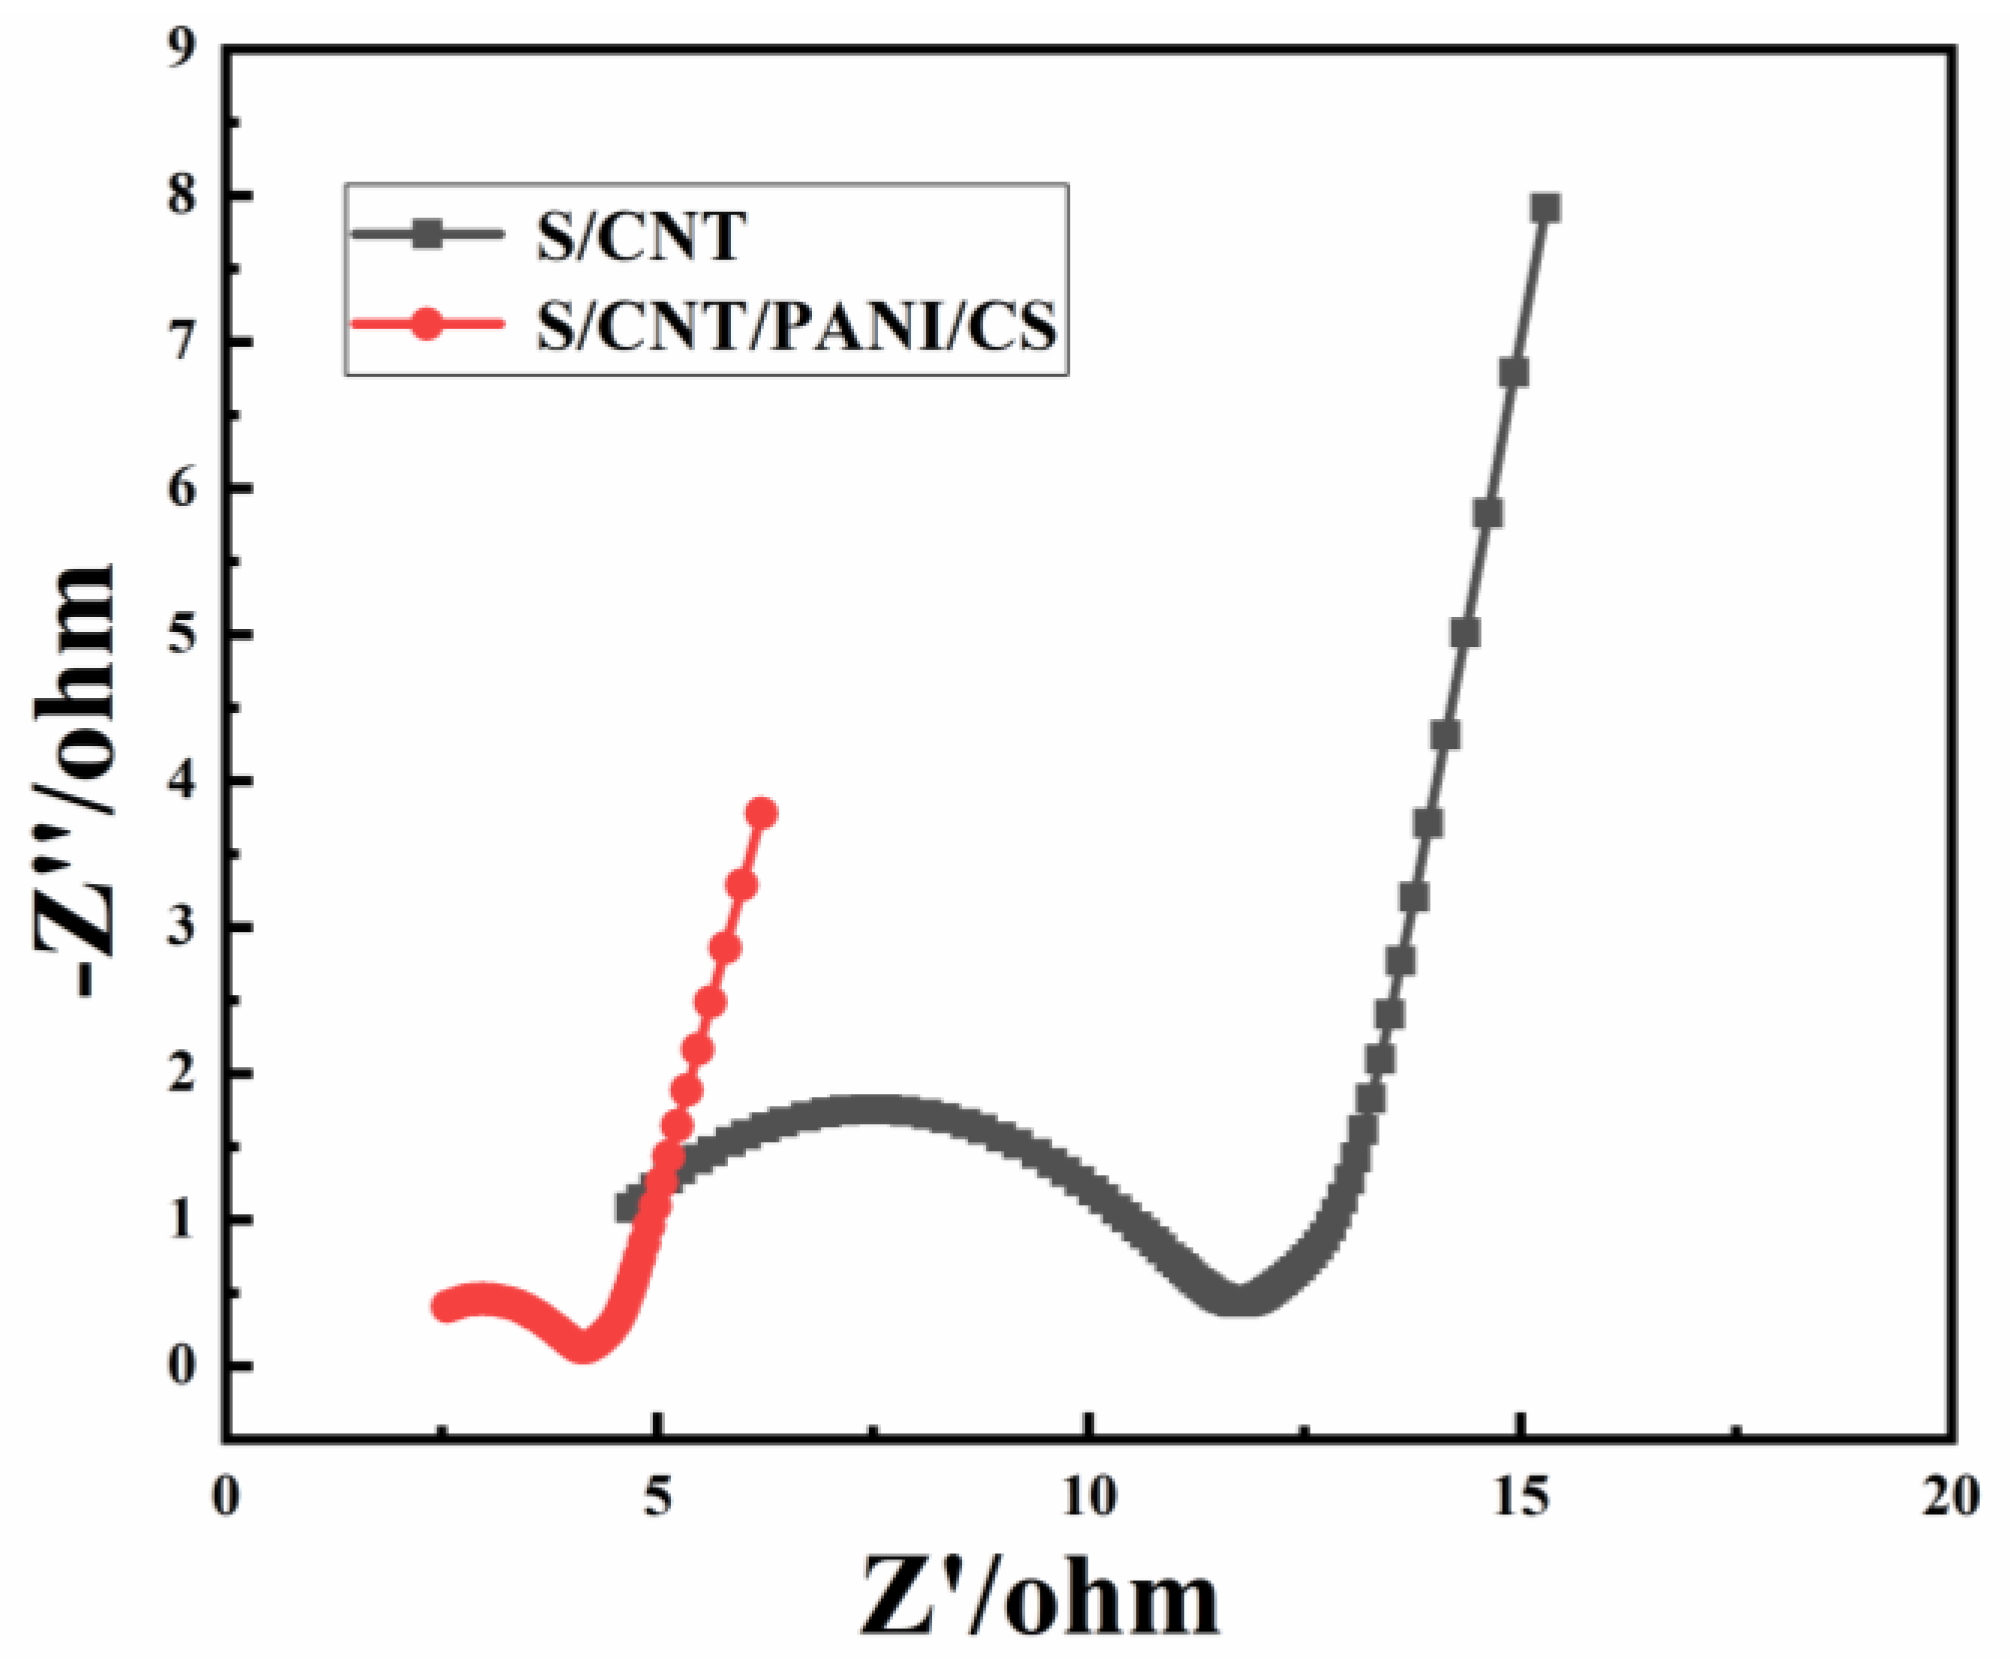
3.2. Performance of MFCs Equipped with S/CNT and S/CNT/PANI/CS Anodes

Figure 3a,b display the power density and polarization curves of the MFCs with S/CNT/PANI/CS and S/CNT anodes, respectively. The maximum power densities (Pmax) of the S/CNT/PANI/CS and S/CNT anodes were 7902.4 and 2298.8 W/m3, respectively (Figure 3a). The MFC with the PANI/CS-modified anode exhibited a Pmax that was 2.43 times that of the S/CNT anode and significantly exceeded that of the control anode. The voltage outputs of the MFC system with the S/CNT/PANI/CS and S/CNT anodes were 745.6 and 709.9 mV, respectively (Figure 3b). When the output voltage was set to 400 mV, the output current of the modified anode was 2.05 A /m2, whereas that of the control anode was 1.12 A/m2. Under the same voltage conditions, a higher output current indicates better anode polarization performance. The enhanced maximum output power and open-circuit voltage of the MFC with the S/CNT/PANI/CS anode is attributable to the PANI film composite, which increased the hydrophilicity of the electrode, promoted charge transfer to the electrode surface, and facilitated electrostatic interaction with the electrons generated by electrogenic bacteria [23,24,25,26]. The PANI-modified anode has a large surface area compared to the bare anode; the large surface area is also a minor factor for increasing the electrode performance. Additionally, the PANI/CS composite not only promoted effective charge transfer to the electrode interface but also facilitated the adhesion of microorganisms, further enhancing the electricity generation performance. Moreover, the conductive material PANI and the ionic conductive biopolymer CS played crucial roles in improving MFC performance. The increased power density of the MFC with the S/CNT/PANI/CS anode demonstrates the effectiveness of PANI/CS as an anode material for enhancing power and current density in MFCs. Furthermore, the continuous stability of the PANI/CS composite material allowed it to maintain its structure and performance throughout the entire microbial culture process. This indicates that CS provides a favorable biocompatible microbial living environment, promoting the participation of proteins and enzymes in the anodic reaction of MFCs [27,28].
Figure 4 depicts the change in anode potential over time during the charging of different anodes for varying durations. Figure 4a–c show three sets of curves representing the charging times of the S/CNT and S/CNT/PANI/CS anodes: 15, 30, and 60 min. The final potential of the unmodified anode was more negative than that of the anode modified with the pseudocapacitive material. After 15 min of charging, the modified electrode and the control anode achieved final potentials of −0.35 and −0.43 V, respectively. After charging for 60 min, the modified electrode and the control anode exhibited final potentials of −0.36 and −0.47 V, respectively. The potential reduction range of the anode modified with pseudocapacitance was significantly smaller than that of the control electrode (Figure 4a–c), because the anode modified with a PANI pseudocapacitor could store charge, and the storage of electrical energy slowed down the reduction in anode potential and increased the specific capacity of the anode.
Figure 5a–c show the discharge curves of the S/CNT and S/CNT/PANI/CS anodes at charge and discharge times of 15, 30, and 60 min. As the charging time increased, the initial current during the discharge stage also increased (Figure 5a–c). This indicates that a higher amount of electricity was stored in the MFC (more charge was stored) when a longer time was applied. The parameters of the discharge curve are summarized in Table 1. The stored charge (Qs) represents the amount of energy stored by the anode, while the total charge (Qt) represents the amount of electricity produced by the anode during the MFC test. The peak current density (ih) represents the highest current density generated in the circuit during the MFC test, and the stored current density (is) represents the current stored by microbial metabolism during charging. As the charge and discharge times increased, both the anode storage capacity and the total discharge capacity increased. For instance, when both the charge and discharge times were 30 min (C30/D30), the S/CNT/PANI/CS anode stored 758.7 C/m2 of electricity, which was 16.38 times that of the S/CNT anode (46.3 C/m2). When both the charge and discharge times were 60 min (C60/D60), the total discharge of the S/CNT/PANI/CS anode reached 13,890.2 C/m2, which was 3.54 times that of the control anode. This improvement is attributable to the inclusion of PANI, which enhanced the catalytic activity of the electrode and facilitated electron transfer from microorganisms to the anode. The electricity generated by microorganisms is stored in the PANI-modified capacitive anode. When electricity is required, a larger current (the sum of the stored and generated portions) can be rapidly released, significantly improving the current output. This type of energy-storage anode material can effectively solve the problem of low output power of MFCs [29,30,31,32,33]. The PANI/CS-modified anode promoted the transfer of electrons from microorganisms to the electrode surface. Moreover, it facilitated the adhesion and growth of microorganisms on the electrode surface, thereby increasing the number of electrons produced through the oxidation of organic matter by microorganisms. This contributed to increased storage capacity. Furthermore, the sponge matrix used in the electrode featured a distinct structure with a continuous network of penetrating macropores, a high porosity, and a large specific surface area. The interconnected macropores allow for the easy flow of materials in all directions, facilitating their rapid transmission. The large specific surface area provides numerous catalytic active sites, enhancing the electrode’s catalytic performance. A comparison is presented in Table S2.
Figure 6 displays the electrochemical impedance diagram of the S/CNT and S/CNT/PANI/CS electrodes as MFC anodes. The electrode transfer impedance RΩ of the S/CNT electrode was 10.5 Ω, which was larger than that of the S/CNT/PANI/CS anode (2.4 Ω), mainly because sponges do not conduct electricity, and the attached CNTs can only improve the electrical conductivity of the electrode. After the introduction of PANI/CS, the effect was more pronounced, and the solution impedance Rct was considerably reduced. The Rct value of the S/CNT/PANI/CS anode (1.6 Ω) was smaller than that of the control anode (4.4 Ω), which indicates that the combination of the three active substances effectively improved the electrode performance and accelerated the electron transfer rate. The fitting circuit diagrams of the electrochemical impedance spectroscopy (EIS) curves are shown in Figure S2.
The EIS test results are attributable to the favorable porous nanostructure of the S/CNT and S/CNT/PANI/CS anodes, which allows for efficient ion transport in the test solution and demonstrates excellent electrochemical properties. One study [34] showed that electrons were transferred between the PANI–CNT composite layers. The authors found that the presence of CNTs significantly enhanced the electron transfer capability of the PANI composite anode, while PANI effectively reduced the impedance of the MFC and improved the electron transfer between electrogenic bacteria and the anode surface.

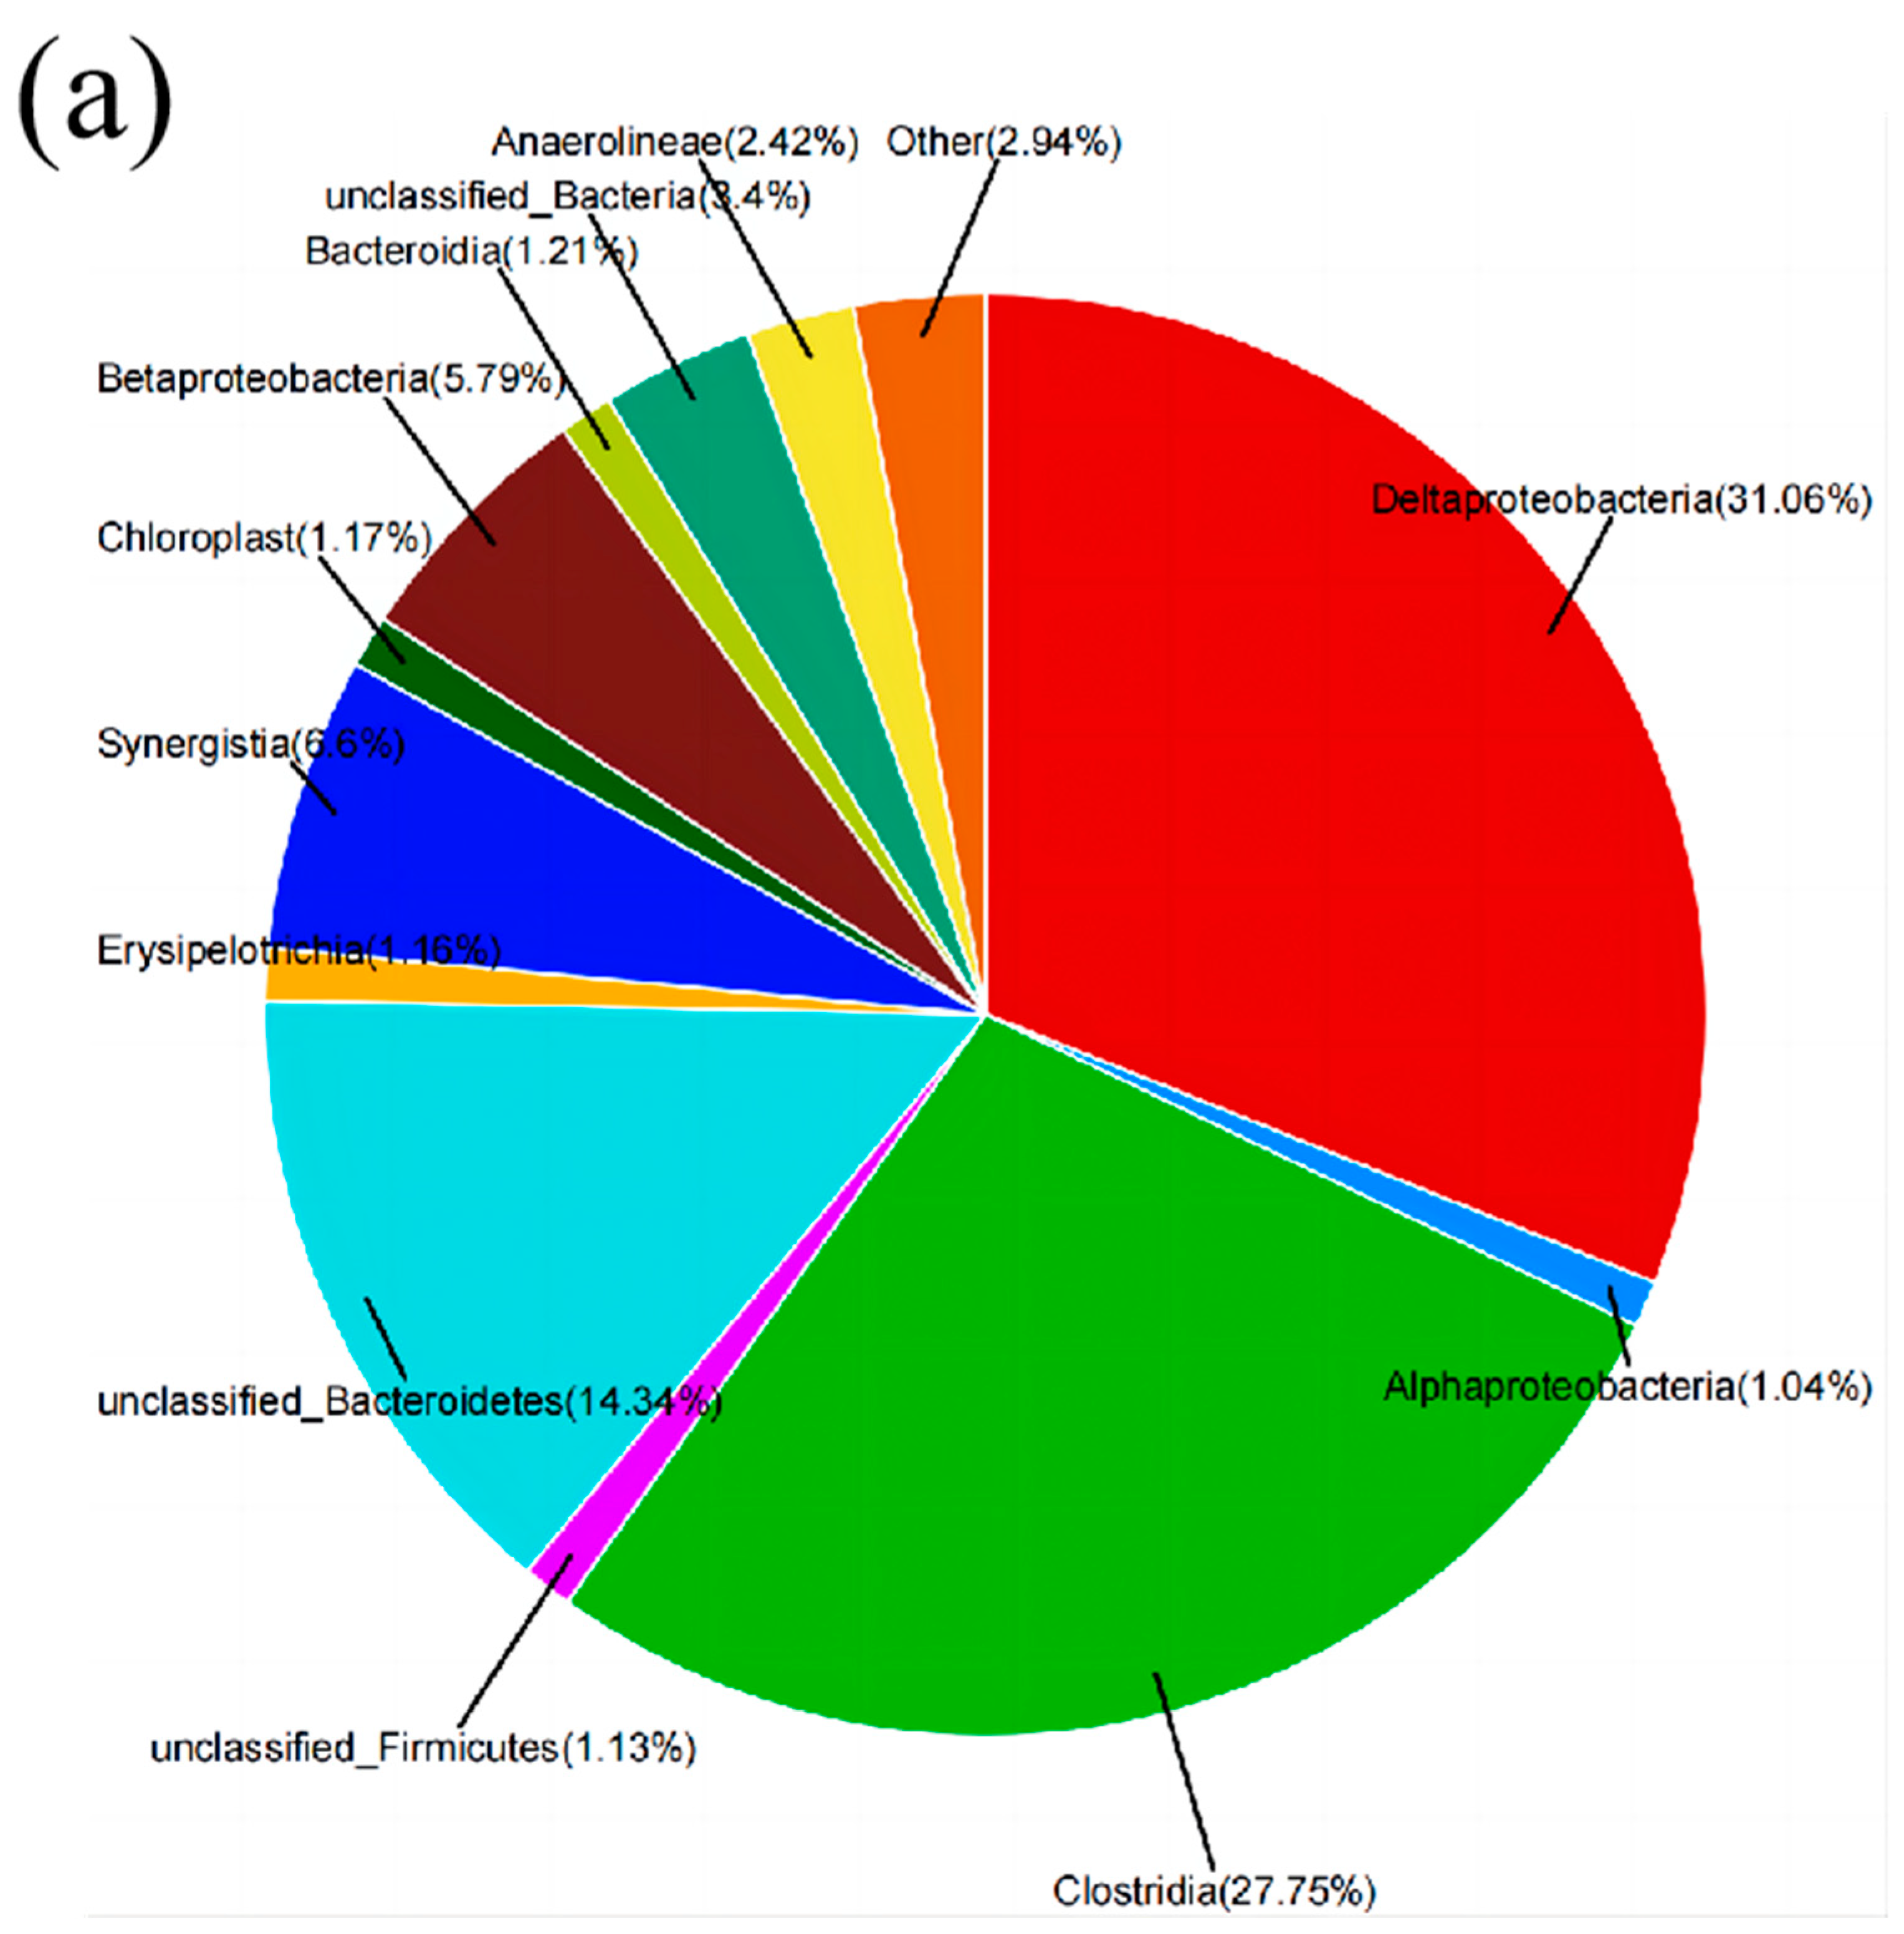
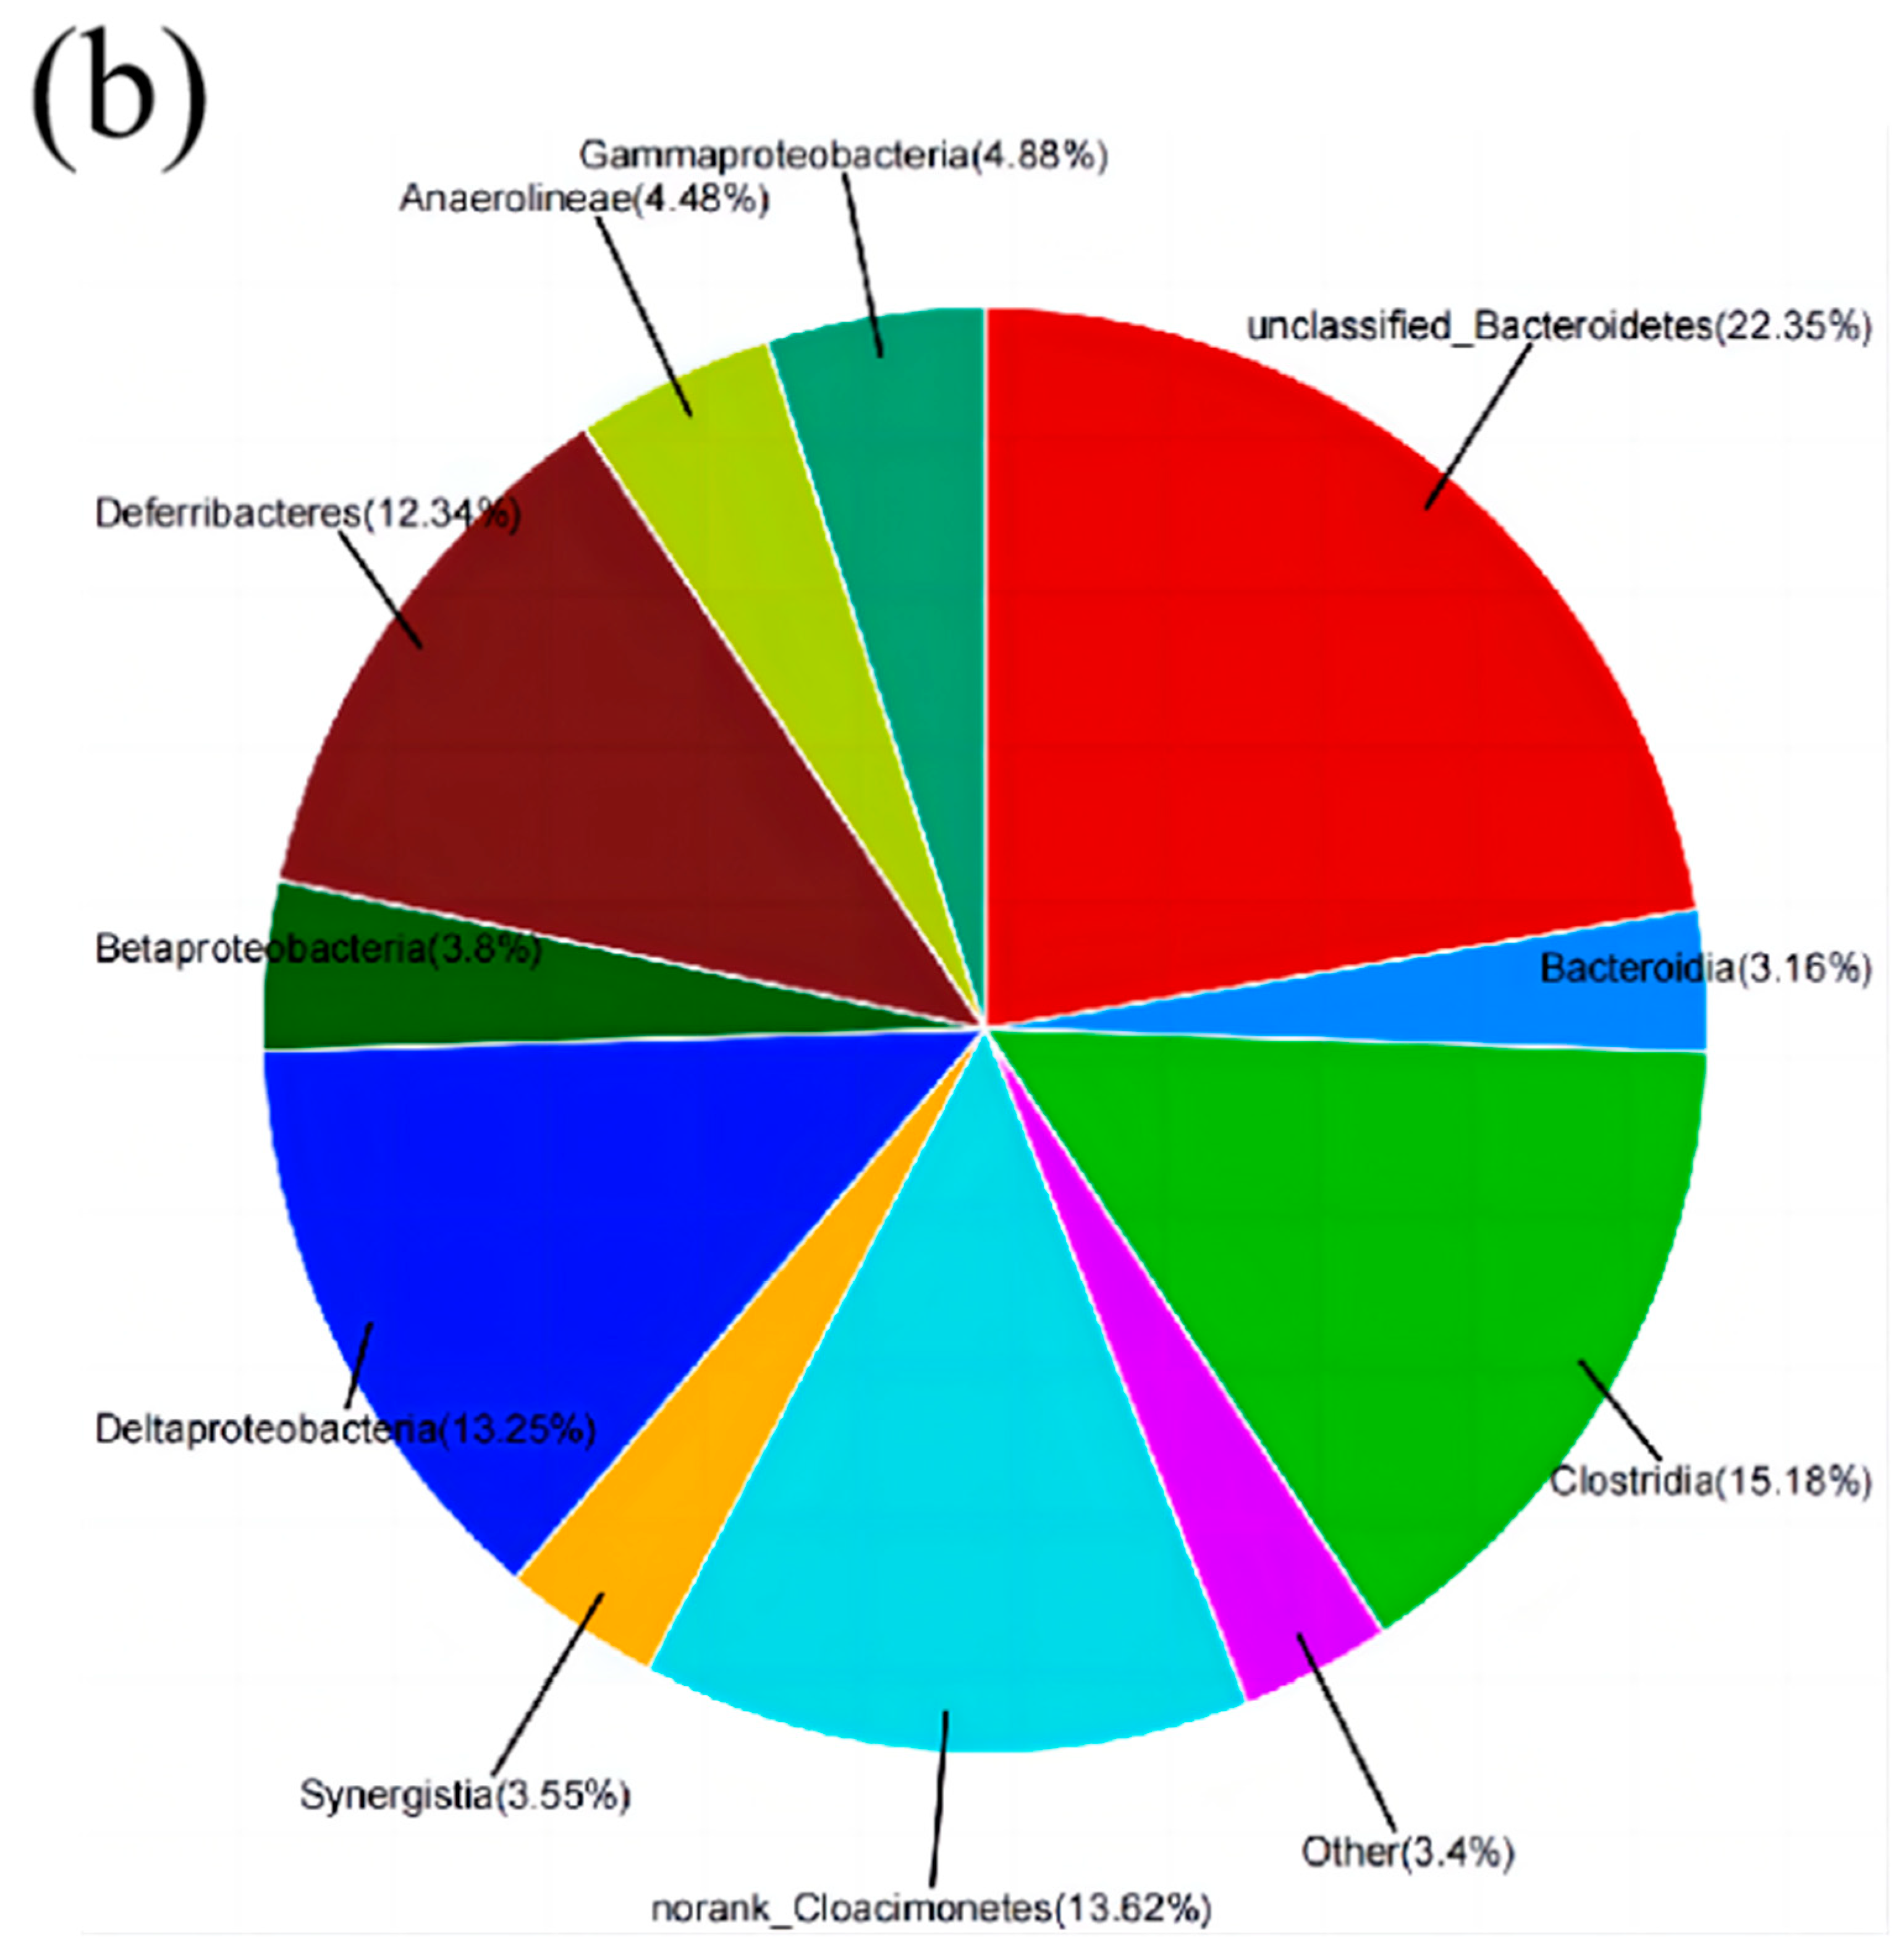
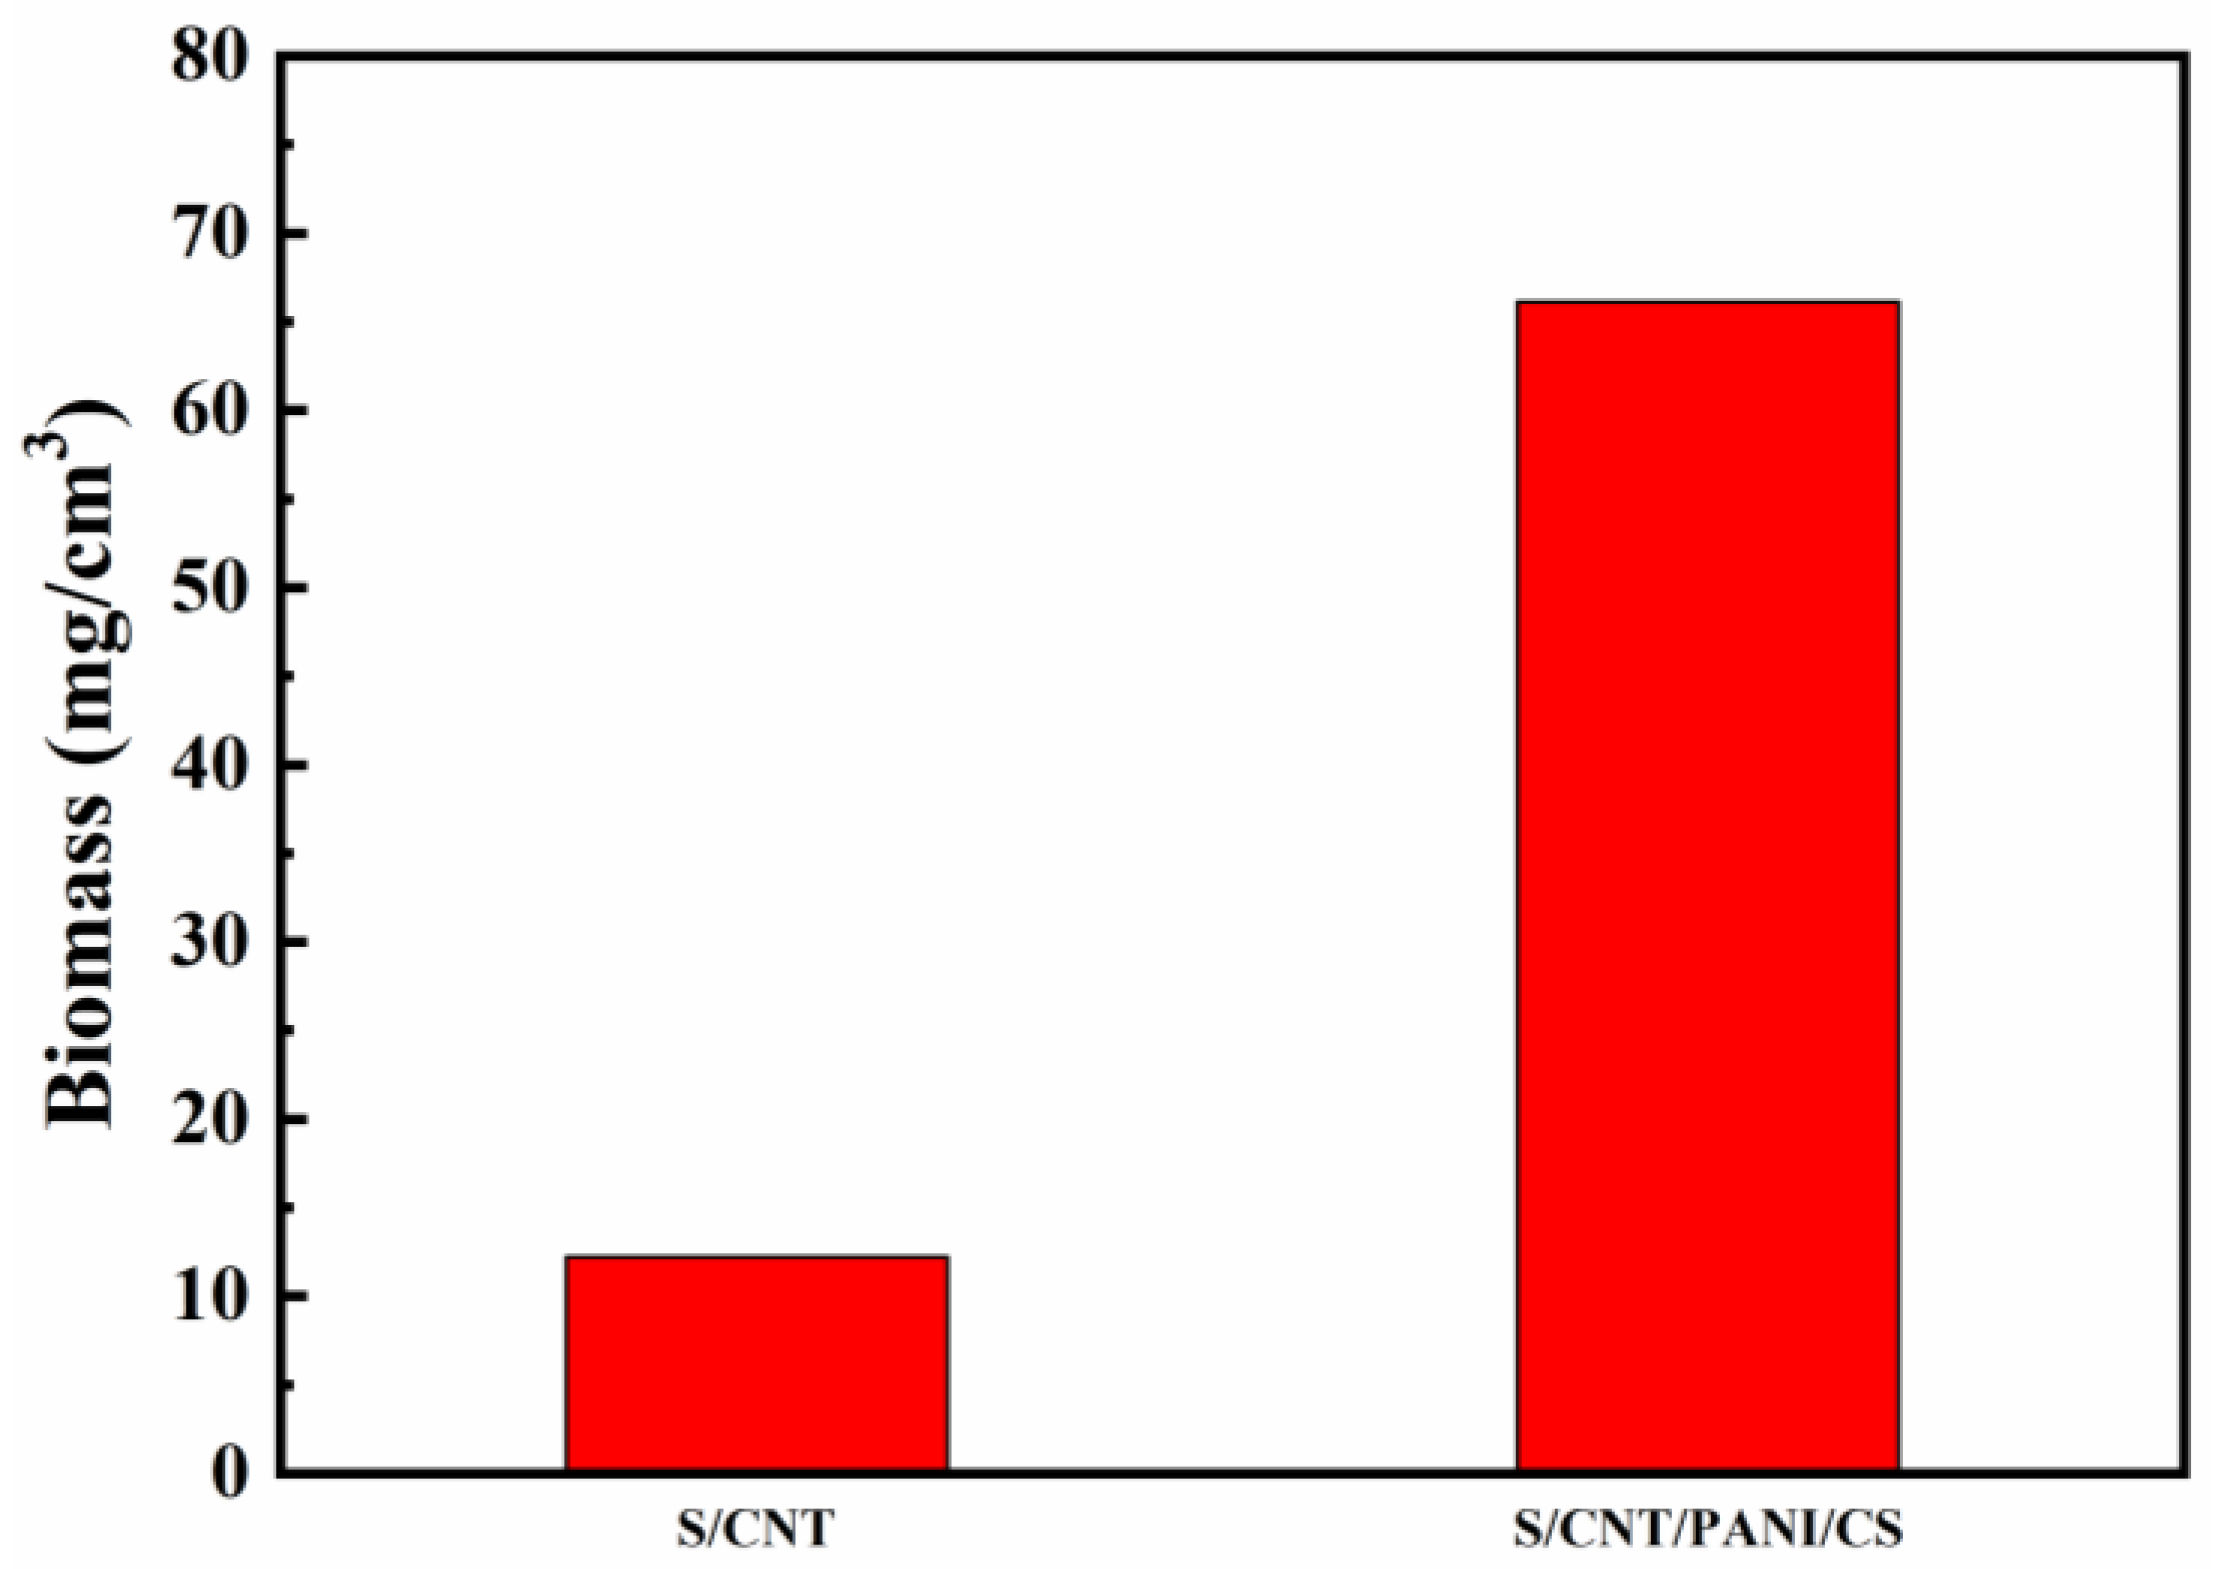
3.3. Biocompatibility Test

To investigate the microorganisms present on the capacitive anode, a high-throughput test was conducted on the microorganisms attached to the S/CNT/PANI/CS anode, which exhibited the best performance. The microbial community composition and the colony count of electrogenic microorganisms were analyzed. Additionally, a high-throughput test was conducted on the microorganisms attached to the S/CNT anode as a control.
As is observed in the Figure 7, numerous microorganisms were attached to the anode surface, with Deltaproteobacteria, Clostridia, and Betaproteobacteria being the predominant groups in the microbial community. Deltaproteobacteria and Clostridia are two of the most prevalent groups of electrogenic bacteria discovered thus far [35,36].
The contents of Deltaproteobacteria and Clostridia attached to the S/CNT/PANI/CS anode accounted for 58.81% of the total microorganism count, representing more than half of the total (Figure 7a,b). In contrast, the contents of Deltaproteobacteria and Clostridia on the S/CNT anode accounted for 28.43% of the total microorganism count. This indicates that the modification of the anode with CNTs, polyphenylaniline, and CS promoted the dominance of Deltaproteobacteria and Clostridia as the main bacteria in the electrode microbial community. The organic matrix present in the nutrient solution was primarily decomposed by electrogenic bacteria, resulting in electric charge generation. The unmodified anode could not promote the dominance of the two main electrogenic bacteria in the electrode microbial community. Most of the organic matrix in the nutrient solution was decomposed by non-electrogenic bacteria, which do not generate electric charge. Only approximately one-third of the organic matrix was decomposed by electrogenic bacteria, leading to electric charge generation. Thus, the anode generated a significantly lower amount of electricity than the CNT/PANI/CS-modified anodes. Consequently, the power density achieved was also much smaller, consistent with the earlier power test results.
Figure 8 presents the protein contents of the S/CNT and S/CNT/PANI/CS anodes. The microbial contents of the S/CNT and S/CNT/PANI/CS anodes were 12.22 and 66.11 mg/cm3, respectively. The results depicted in the figure demonstrate a significant increase in the protein content of the PANI-modified anodes. This increase suggests that PANI provided a greater surface area for microorganism attachment, resulting in a higher microbial population on the S/CNT/PANI/CS anodes. The protein content of the S/CNT/PANI/CS anode surpassed that of the S/CNT anode, which is attributable to the favorable biocompatibility of CS. The enhanced biocompatibility facilitated the metabolic activities of microorganisms, consistent with the superior electricity generation and energy storage performance observed in the previous analyses of the S/CNT/PANI/CS anode.

4. Conclusions

A CNT/PANI/CS composite anode material was prepared on a 3D porous sponge matrix. The unique characteristics of the sponge porosity, high electrical conductivity of CNTs, capacitive behavior of PANI, and biocompatibility of CS endowed the composite anode material with several advantages, including the energy storage capability, a large specific capacity, a high porosity, a substantial specific surface area, an efficient electron transfer ability, and good biocompatibility. Experimental results demonstrated that the MFC with the modified anode achieved a maximum power density of 7902.4 mW/m3. Furthermore, in the charging–discharging test, the S/CNT/PANI/CS anode exhibited significantly higher electricity storage than the S/CNT anode, with a 16.38-times-higher storage capacity under C30/D30 conditions. Additionally, the protein content of the S/CNT/PANI/CS anode (66.11 mg/cm3), representing microbial biomass, was significantly higher than that of the control anode. The synergistic effect of CNTs, PANI, and CS resulted in the formation of a highly active electrochemical biofilm anode, which outperformed the traditional anodes in terms of maximum power density and capacitance.

Supplementary Materials

The following supporting information can be downloaded at: https://www.mdpi.com/article/10.3390/coatings14020152/s1, Figure S1: A physical illustration of a double-chamber microbial fuel cell; Figure S2: Fitting circuit diagram of EIS curves; Table S1: Formula of anode nutrient solution; Table S2: Comparison of the operated potential, peak and stable current density of different anode mate-rials in the MFCs [9,11,30,37].

Funding

The project was supported by the 2023 Harbin University of Commerce youth research and innovation talent training program (2023-KYYWF-1012).

Institutional Review Board Statement

Not applicable.

Informed Consent Statement

Not applicable.

Data Availability Statement

The data are available from the corresponding author on reasonable request.

Conflicts of Interest

The authors declare no conflict of interest.

References

  1. Dewan, A.; Beyenal, H.; Lewandowski, Z. Intermittent Energy Harvesting Improves the Performance of Microbial Fuel Cells. Environ. Sci. Technol. 2009, 43, 4600–4605. [Google Scholar] [CrossRef] [PubMed]
  2. Ci, S.; Wen, Z.; Chen, J.; He, Z. Decorating anode with bamboo-like nitrogen-doped carbon nanotubes for microbial fuel cells. Electrochem. Commun. 2012, 14, 71–74. [Google Scholar] [CrossRef]
  3. Zhang, C.; Liang, P.; Jiang, Y.; Huang, X. Enhanced power generation of microbial fuel cell using manganese dioxide-coated anode in flow-through mode. J. Power Sources 2015, 273, 580–583. [Google Scholar] [CrossRef]
  4. Logan, B.E.; Hamelers, B.; Rozendal, R.; Schroder, U.; Keller, J.; Freguia, S.; Aelterman, P.; Verstraete, W.; Rabaey, K. Microbial Fuel Cells: Methodology and Technology. Environ. Sci. Technol. 2006, 40, 5181–5192. [Google Scholar] [CrossRef] [PubMed]
  5. Lai, B.; Tang, X.; Li, H.; Du, Z.; Liu, X.; Zhang, Q. Power production enhancement with a polyaniline modified anode in microbial fuel cells. Biosens. Bioelectron. 2011, 28, 373–377. [Google Scholar] [CrossRef]
  6. Kang, Y.L.; Ibrahim, S.; Pichiah, S. Synergetic effect of conductive polymer poly (3,4-ethylenedioxythiophene) with different structural configuration of anode for microbial fuel cell application. Bioresour. Technol. 2015, 189, 364–369. [Google Scholar] [CrossRef]
  7. Feng, C.; Ma, L.; Li, F.; Mai, H.; Lang, X.; Fan, S. A polypyrrole/anthraquinone-2,6-disulphonic disodium salt (PPy/AQDS)-modified anode to improve performance of microbial fuel cells. Biosens. Bioelectron. 2010, 25, 1516–1520. [Google Scholar] [CrossRef]
  8. Zheng, J.; Cheng, C.; Zhang, J.; Wu, X. Appropriate mechanical strength of carbon black-decorated loofah sponge as anode material in microbial fuel cells. Int. J. Hydrog. Energy 2016, 41, 23156–23163. [Google Scholar] [CrossRef]
  9. Tang, J.; Yuan, Y.; Liu, T.; Zhou, S. High-capacity carbon-coated titanium dioxide core–shell nanoparticles modified three dimensional anodes for improved energy output in microbial fuel cells. J. Power Sources 2015, 274, 170–176. [Google Scholar] [CrossRef]
  10. Wang, Y.; Wen, Q.; Chen, Y.; Yin, J.; Duan, T. Enhanced Performance of a Microbial Fuel Cell with a Capacitive Bioanode and Removal of Cr (VI) Using the Intermittent Operation. Appl. Biochem. Biotech. 2016, 180, 1372–1385. [Google Scholar] [CrossRef]
  11. Peng, X.; Yu, H.; Wang, X.; Zhou, Q.; Zhang, S.; Geng, L.; Sun, J.; Cai, Z. Enhanced performance and capacitance behavior of anode by rolling Fe3O4 into activated carbon in microbial fuel cells. Bioresour. Technol. 2012, 121, 450–453. [Google Scholar] [CrossRef] [PubMed]
  12. Chi, M.; He, H.; Wang, H.; Zhou, M.; Gu, T. Graphite Felt Anode Modified by Electropolymerization of NanoPolypyrrole to Improve Microbial Fuel Cell (MFC) Production of Bioelectricity. J. Microb. Biochem. Technol. 2013, S12, 004. [Google Scholar]
  13. Wang, Y.; Zhu, L.; An, L. Electricity generation and storage in microbial fuel cells with porous polypyrrole-base composite modifified carbon brush anodes. Renew. Energy 2020, 162, 2220–2226. [Google Scholar] [CrossRef]
  14. Zhao, G.; Yin, Z.; Zhang, L.; Wei, X. Direct electrochemistry of cytochrome c on a multi-walled carbon nanotubes modified electrode and its electrocatalytic activity for the reduction of H2O2. Electrochem. Commun. 2005, 7, 256–260. [Google Scholar] [CrossRef]
  15. Tsai, H.; Wu, C.; Lee, C.; Shih, E.P. Microbial fuel cell performance of multiwall carbon nanotubes on carbon cloth as electrodes. J. Power Sources 2009, 194, 199–205. [Google Scholar] [CrossRef]
  16. Erbay, C.; Yang, G.; Figueiredo, P.; Sadr, R.; Yu, C.; Han, A. Three-dimensional porous carbon nanotube sponges for high-performance anodes of microbial fuel cells. J. Power Sources 2015, 298, 177–183. [Google Scholar] [CrossRef]
  17. Wen, Z.; Ci, S.; Mao, S.; Cui, S.; Lu, G.; Yu, K.; Luo, S.; He, Z.; Chen, J. TiO2 nanoparticles-decorated carbon nanotubes for significantly improved bioelectricity generation in microbial fuel cells. J. Power Sources 2013, 234, 100–106. [Google Scholar] [CrossRef]
  18. Mehdinia, A.; Ziaei, E.; Jabbari, A. Multi-walled carbon nanotube/SnO2 nanocomposite: A novel anode material for microbial fuel cells. Electrochim. Acta 2014, 130, 512–518. [Google Scholar] [CrossRef]
  19. Zou, Y.; Pisciotta, J.; Baskakov, I.V. Nanostructured polypyrrole-coated anode for sun-powered microbial fuel cells. Bioelectrochemistry 2010, 79, 50–56. [Google Scholar] [CrossRef]
  20. Wang, Y.; Wen, Q.; Chen, Y.; Zheng, H.; Wang, S. Enhanced performance of microbial fuel cell with polyaniline/sodium alginate/carbon brush hydrogel bioanode and removal of COD. Energy 2020, 202, 117780. [Google Scholar] [CrossRef]
  21. Higgins, S.R.; Foerster, D.; Cheung, A.; Lau, C.; Bretschger, O.; Minteer, S.D.; Nealson, K.; Atanassov, P.; Cooney, M.J. Fabrication of macroporous chitosan scaffolds doped with carbon nanotubes and their characterization in microbial fuel cell operation. Enzym. Microb. Technol. 2011, 48, 458–465. [Google Scholar] [CrossRef] [PubMed]
  22. Liu, X.; Sun, X.; Huang, Y.; Sheng, G.; Wang, S.; Yu, H. Carbon nanotube/chitosan nanocomposite as a biocompatible biocathode material to enhance the electricity generation of a microbial fuel cell. Energy Environ. Sci. 2011, 4, 1422–1427. [Google Scholar] [CrossRef]
  23. Du, Q.; An, J.; Li, J.; Zhou, L.; Li, N.; Wang, X. Polydopamine as a new modification material to accelerate startup and promote anode performance in microbial fuel cells. J. Power Sources 2017, 343, 477–482. [Google Scholar] [CrossRef]
  24. Hou, J.; Liu, Z.; Zhang, P. A new method for fabrication of graphene/polyaniline nanocomplex modified microbial fuel cell anodes. J. Power Sources 2013, 224, 139–144. [Google Scholar] [CrossRef]
  25. Yuan, Y.; Zhou, S.; Liu, Y.; Tang, J. Nanostructured Macroporous Bioanode Based on Polyaniline-Modified Natural Loofah Sponge for High-Performance Microbial Fuel Cells. Environ. Sci. Technol. 2013, 47, 14525–14532. [Google Scholar] [CrossRef] [PubMed]
  26. Wu, Q.; Xu, Y.; Yao, Z.; Liu, A.; Shi, G. Supercapacitors Based on Flexible Graphene/Polyaniline Nanofiber Composite Films. ACS Nano 2010, 4, 1963–1970. [Google Scholar] [CrossRef] [PubMed]
  27. Cabuk, M.; Yavuz, M.; Unal, H.I.; Alan, Y. Synthesis, characterization, and enhanced antibacterial activity of chitosan-based biodegradable conducting graft copolymers. Polym. Compos. 2014, 36, 497–509. [Google Scholar] [CrossRef]
  28. Choi, C.; Nam, J.P.; Nah, J.W. Application of chitosan and chitosan derivatives as biomaterials. J. Ind. Eng. Chem. 2016, 33, 1–10. [Google Scholar] [CrossRef]
  29. Deeke, A.; Sleutels, T.H.J.A.; Heijne, A.T.; Hamelers, H.V.M.; Buisman, C.J.N. Influence of the thickness of the capacitive layer on the performance of bioanodes in Microbial Fuel Cells. J. Power Sources 2013, 243, 611–616. [Google Scholar] [CrossRef]
  30. Deeke, A.; Sleutels, T.H.J.A.; Hamelers, H.V.M.; Buisman, C.J.N. Capacitive Bioanodes Enable Renewable Energy Storage in Microbial Fuel Cells. Environ. Sci. Technol. 2012, 46, 3554–3560. [Google Scholar] [CrossRef]
  31. Lv, Z.; Xie, D.; Li, F.; Hu, Y.; Wei, C.; Feng, C. Microbial fuel cell as a biocapacitor by using pseudo-capacitive anode materials. J. Power Sources 2014, 246, 642–649. [Google Scholar] [CrossRef]
  32. Lin, Y.; Chen, C.; Xie, W.; Yang, S.; Hsu, C.; Lin, M.; Jian, W. Nano Approach Investigation of the Conduction Mechanism in Polyaniline Nanofibers. ACS Nano 2011, 5, 1541–1548. [Google Scholar] [CrossRef] [PubMed]
  33. Wang, S.; Ma, L.; Gan, M.; Fu, S.; Dai, W.; Zhou, T.; Sun, X.; Wang, H.; Wang, H. Free-standing 3D graphene/polyaniline composite film electrodes for high-performance supercapacitors. J. Power Sources 2015, 299, 347–355. [Google Scholar] [CrossRef]
  34. Qiao, Y.; Li, C.; Bao, S.; Bao, Q. Carbon nanotube/polyaniline composite as anode material for microbial fuel cells. J. Power Sources 2007, 170, 79–84. [Google Scholar] [CrossRef]
  35. Zhang, B.; Zhang, J.; Liu, Y.; Hao, C.; Tian, C.; Feng, C.; Lei, Z.; Huang, W.; Zhang, Z. Identification of removal principles and involed bacteria in microbial fuel cells for sulfide removal and electricity generation. Int. J. Hydrog. Energy 2013, 38, 14348–14355. [Google Scholar] [CrossRef]
  36. Dunaj, S.J.; Vallino, J.J.; Hines, M.E.; Gay, M.; Kobyljanec, C.; Rooney-Varga, J.N. Relationships between soil organic matter nutrients bacterial community structure, and the performance of microbial fuel cells. Environ. Sci. Technol. 2012, 46, 1914–1922. [Google Scholar] [CrossRef]
  37. Li, D.; Deng, L.; Yuan, H.; Dong, G.; Chen, J.; Zhang, X.; Chen, Y.; Yuan, Y. N, P-doped mesoporous carbon from onion as trifunctional metal-free electrode modifier for enhanced power performance and capacitive manner of microbial fuel cells. Electrochim. Acta 2018, 262, 297–305. [Google Scholar] [CrossRef]
Figure 1. SEM images of the S/CNT electrode ((a) 50×; (b) 5000×) and the S/CNT/PANI/CS electrode ((c) 50×; (d) 5000×).
Coatings 14 00152 g001
Figure 2. FTIR spectra of the S/CNT and S/CNT/PANI/CS electrodes.
Coatings 14 00152 g002
Figure 3. Performance of MFCs with S/CNT and S/CNT/PANI/CS anodes: (a) power density and (b) polarization curves of the corresponding MFCs (experimental condition: the MFC was tested at 28 °C and RH: 50%).
Coatings 14 00152 g003
Figure 4. Chronopotentiometry of MFCs with S/CNT and S/CNT/PANI/CS anodes under different charging time conditions ((ac) charging time: 15–60 min; experimental condition: the MFC was tested at 28 °C and RH: 50%).
Coatings 14 00152 g004aCoatings 14 00152 g004b
Figure 5. Discharge test of MFCs with the S/CNT and S/CNT/PANI/CS anodes under different discharge times with −0.1 V voltage in a closed circuit ((ac) discharging time: 15, 30, and 60 min).
Coatings 14 00152 g005aCoatings 14 00152 g005b
Figure 6. EIS curves of the S/CNT and S/CNT/PANI/CS anodes.
Coatings 14 00152 g006
Figure 7. Phylum distributions of the microbial communities on the (a) modified anode and (b) the control anode (the high-throughput test in this paper was tested by Shanghai Shengong Biological Company).
Coatings 14 00152 g007aCoatings 14 00152 g007b
Figure 8. Protein contents of MFC with the S/CNT and S/CNT/PANI/CS anodes.
Coatings 14 00152 g008
Table 1. Parameters of MFCs equipped with the S/CNT and S/CNT/PANI/CS anodes.
AnodesParametersC15/D15C30/D30C60/D60Power Density (W/m3)Rct (Ω)
ip (A/m2)1.231.241.262298.84.4
S/CNTis (A/m2)1.091.081.07
Qs (C/m2)24.346.370.6
Qt (C/m2)1005.31990.33922.6
S/CNT/PANI/CSip (A/m2)6.959.0910.677902.41.6
is (A/m2)2.793.093.42
Qs (C/m2)410.6758.71578.2
Qt (C/m2)2921.66320.713,890.2
Disclaimer/Publisher’s Note: The statements, opinions and data contained in all publications are solely those of the individual author(s) and contributor(s) and not of MDPI and/or the editor(s). MDPI and/or the editor(s) disclaim responsibility for any injury to people or property resulting from any ideas, methods, instructions or products referred to in the content.

