Article

An Experimental Study Based on the Surface Microstructure of Bionic Marine Animals

1
School of Intelligent Manufacturing, Guangzhou Maritime University, Guangzhou 510725, China
2
School of Mechanical and Electrical Engineering, Chengdu University of Technology, Chengdu 610059, China
3
School of Electro-Mechanical Engineering, Guangdong University of Technology, Guangzhou 510006, China
*
Author to whom correspondence should be addressed.
These authors contributed equally to this work.
Coatings 2024, 14(12), 1606; https://doi.org/10.3390/coatings14121606
Submission received: 27 November 2024 / Revised: 17 December 2024 / Accepted: 20 December 2024 / Published: 22 December 2024

Abstract

:
Masked jet electrolytic machining has the advantages of high machining efficiency and good surface morphology, giving it important applications in fields such as bionic marine animal manufacturing. The factors affecting the electrolytic machining speed are deduced; a modeling simulation is carried out by COMSOL software; the electrolyte potential map and current density line map inside the microgroove are analyzed; and measurements of the actual machined microgroove are made by a scanning microscope to carry out the experiments of electrolytic characteristics and morphology of the microgroove under different pulse voltages, machining gaps, and machining times. Experiments show that the pulse voltage plays a dominant role in processing, and when the pulse voltage is increased from 50 V to 125 V, the microgroove width increases by an average of 7.7%, and the depth increases by an average of 28.8%, which significantly improves the surface microstructure of the bionic marine animal.

1. Introduction

The jet electrolytic machining (EJM) technology is based on the electrochemical principle, which achieves material removal for machining purposes through the electrochemical reaction of anions and cations in the electrolyte [1,2,3]. Compared with other electrochemical machining technologies, EJM has the advantages of high machining efficiency, high machining accuracy, and good domain fixity [4,5,6,7,8]. By controlling the cathode nozzle to move along a preset path, combined with diverse mask patterns, complex microstructures can be fabricated on the surface of the workpiece quickly and precisely, capable of reaching the nanometer level [9,10,11,12,13,14]. The construction of microstructures, such as grooves and textures, is essential in the fabrication of bionic marine animal surfaces, and these microstructures are capable of changing the physical properties of the material surface. Given the advantages of EJM in fine machining, the technology shows great potential for application in the fabrication of microstructures on bionic marine animal surfaces [15,16,17,18,19].
Chen et al. [20] demonstrated that an increase in the pulse duty cycle decreases the microgroove undercutting rate and depth growth rate. Cui et al. [21] showed that the quadrilateral crater morphology of the dung beetle-like surface was superior to the hexagonal crater of the desert viper-like surface regarding fatigue crack extension resistance. Weidong Liu et al. [22] used electrolytic jet machining to generate surface textures on aluminum alloys surfaces and investigated the effects of machining parameters, demonstrating that reducing the applied current density or lowering the jet advection speed at higher current densities will lead to an increase in the size and number of pores on the textured surface, thus increasing the surface roughness. Ming Wu [23] proposed a mask-based electrolyte jet machining method to fabricate microcavity array structures with good shape consistency on the surface of metal parts using a duckbill-shaped nozzle, proving that, with the machining-voltage increases, the size and depth-to-width ratio of the microcavities gradually increase. Zhenghui Ge et al. [24] optimized the parameters of the microstructures using a surface field analysis method and obtained a slit microstructure with a size of 500 μm, an area ratio of 40%, and a depth of 5 μm as the optimal parameters. Under this parameter condition, the surface bearing capacity was effectively increased, and the friction coefficient was decreased.
Shen Niu et al. [25] used jet electrochemical micro milling to process the materials and experimentally verified that the use of hybrid electrolyte could significantly increase the trans-passivation potential of the composites and effectively reduce the stray corrosion phenomenon at the edges of the microgrooves as compared to the NaCl electrolyte. Wang et al. [26] designed a self-powered bionic coral wave sensor based on a friction electric nanogenerator to analyze ocean motion accurately. BaoHeimer et al. [27] compared the drag reduction effect of underwater robots under a smooth surface and a bionic shark scale surface and proved that the shear stress on the surface of the bionic shark scale is smaller than that on the soft surface when the water current speed is greater than 6 m/s, and the drag reduction rate can reach up to 2.9% when the flow speed is 8 m/s.
In terms of complex precision surface processing capability, the jet electrolytic processing technology has the characteristics of small residual stress and safe production, making it of great significance to research bionic marine animals. In addition, the surface microstructure of bionic marine animals can be precisely fabricated to the nanometer level using EJM technology, which can enhance the use properties of the workpiece, such as drag reduction and friction resistance. By utilizing this technology, we can effectively reduce the production cost of bionic marine animal artifacts and increase production efficiency.
Based on the electrochemical theory, the key factors affecting the efficiency of electrolytic machining are deduced, and a set of experimental equipment for jet electrolytic machining using a mask to cover the workpiece is constructed. Simulation experiments of the electrolysis process are carried out using COMSOL 6.2 software, and electrolyte potential and current density line graphs are plotted. The dimensional data of microgrooves are obtained by measuring the workpiece, and the influence of jet electrolytic machining parameters on the machining quality and efficiency is analyzed to provide theoretical guidance and process optimization routes for the application of jet electrolytic machining technology in the field of biomimetic marine animal manufacturing.

2. Experimental Design

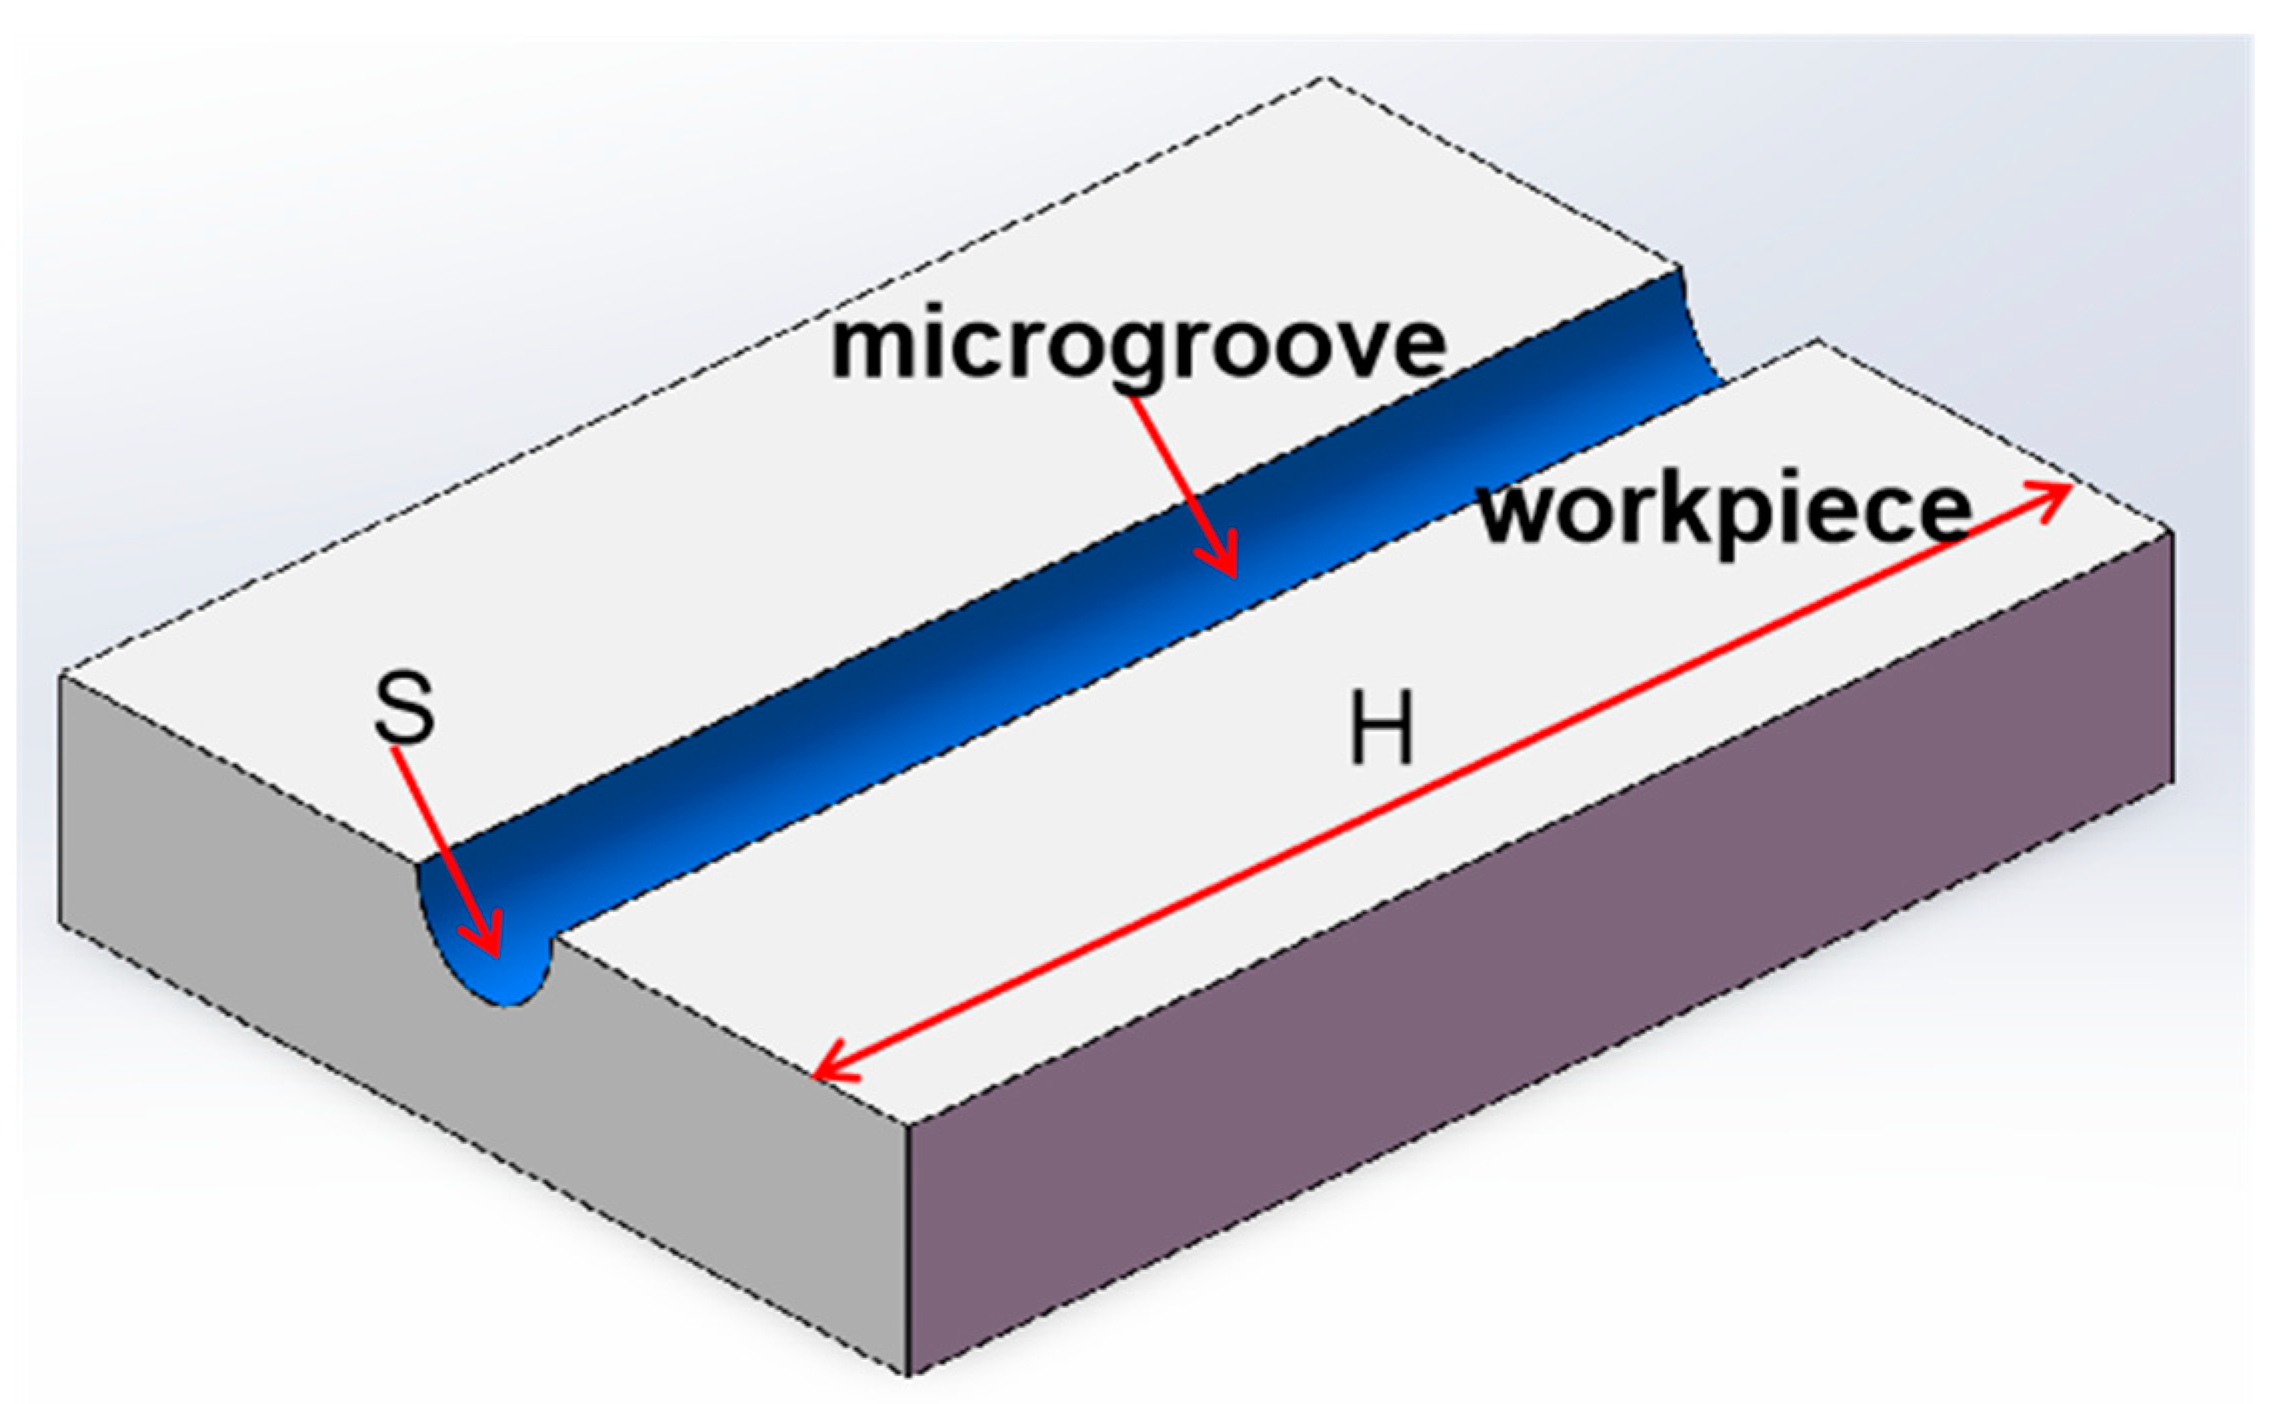
2.1. Theoretical Analysis of Processing Efficiency

The material processing efficiency of jet electrolytic machining is related to the material removal rate, MRR, as shown in Figure 1, and the expression of the volume (Q) of the removed material in the processing time (t) is shown in Equation (1).
Q = S H = S v t
where v is the electrolytic processing speed; and S is the microgroove cross-sectional area.
Therefore, the material removal rate is shown in Equation (2).
M R R = Q t = S v
In practice, the pulse duty cycle has an effect on electrolytic processing, so the effective material removal rate, MRRe, in the effective time, T, is shown in Equation (3).
M R R e = Q T = S v t T = S v a
where a is the electrolytic processing efficiency.
In the actual electrolytic processing, the actual material removal differs from the theoretically calculated value due to the existence of side reactions. Therefore, the factor of current efficiency must be considered in electrolytic processing. The current efficiency can be expressed by the following formula, where MRR represents the actual material removal rate, and MRRa represents the theoretical material removal rate:
η = M R R M R R a
In MRRa is the volumetric electrochemical equivalent of the material, and I is the average current value during processing.
M R R a = Q t = ω I t t = ω I
Combining Equations (4) and (5), the current efficiency in electrolytic processing can be expressed as Equation (6).
η = M R R M R R a = v S ω I
From Equation (6), it can be seen that the current efficiency is not only related to the electrolytic processing speed and microgroove cross-sectional area but also affected by the volumetric electrochemical equivalent and the average current value during processing.

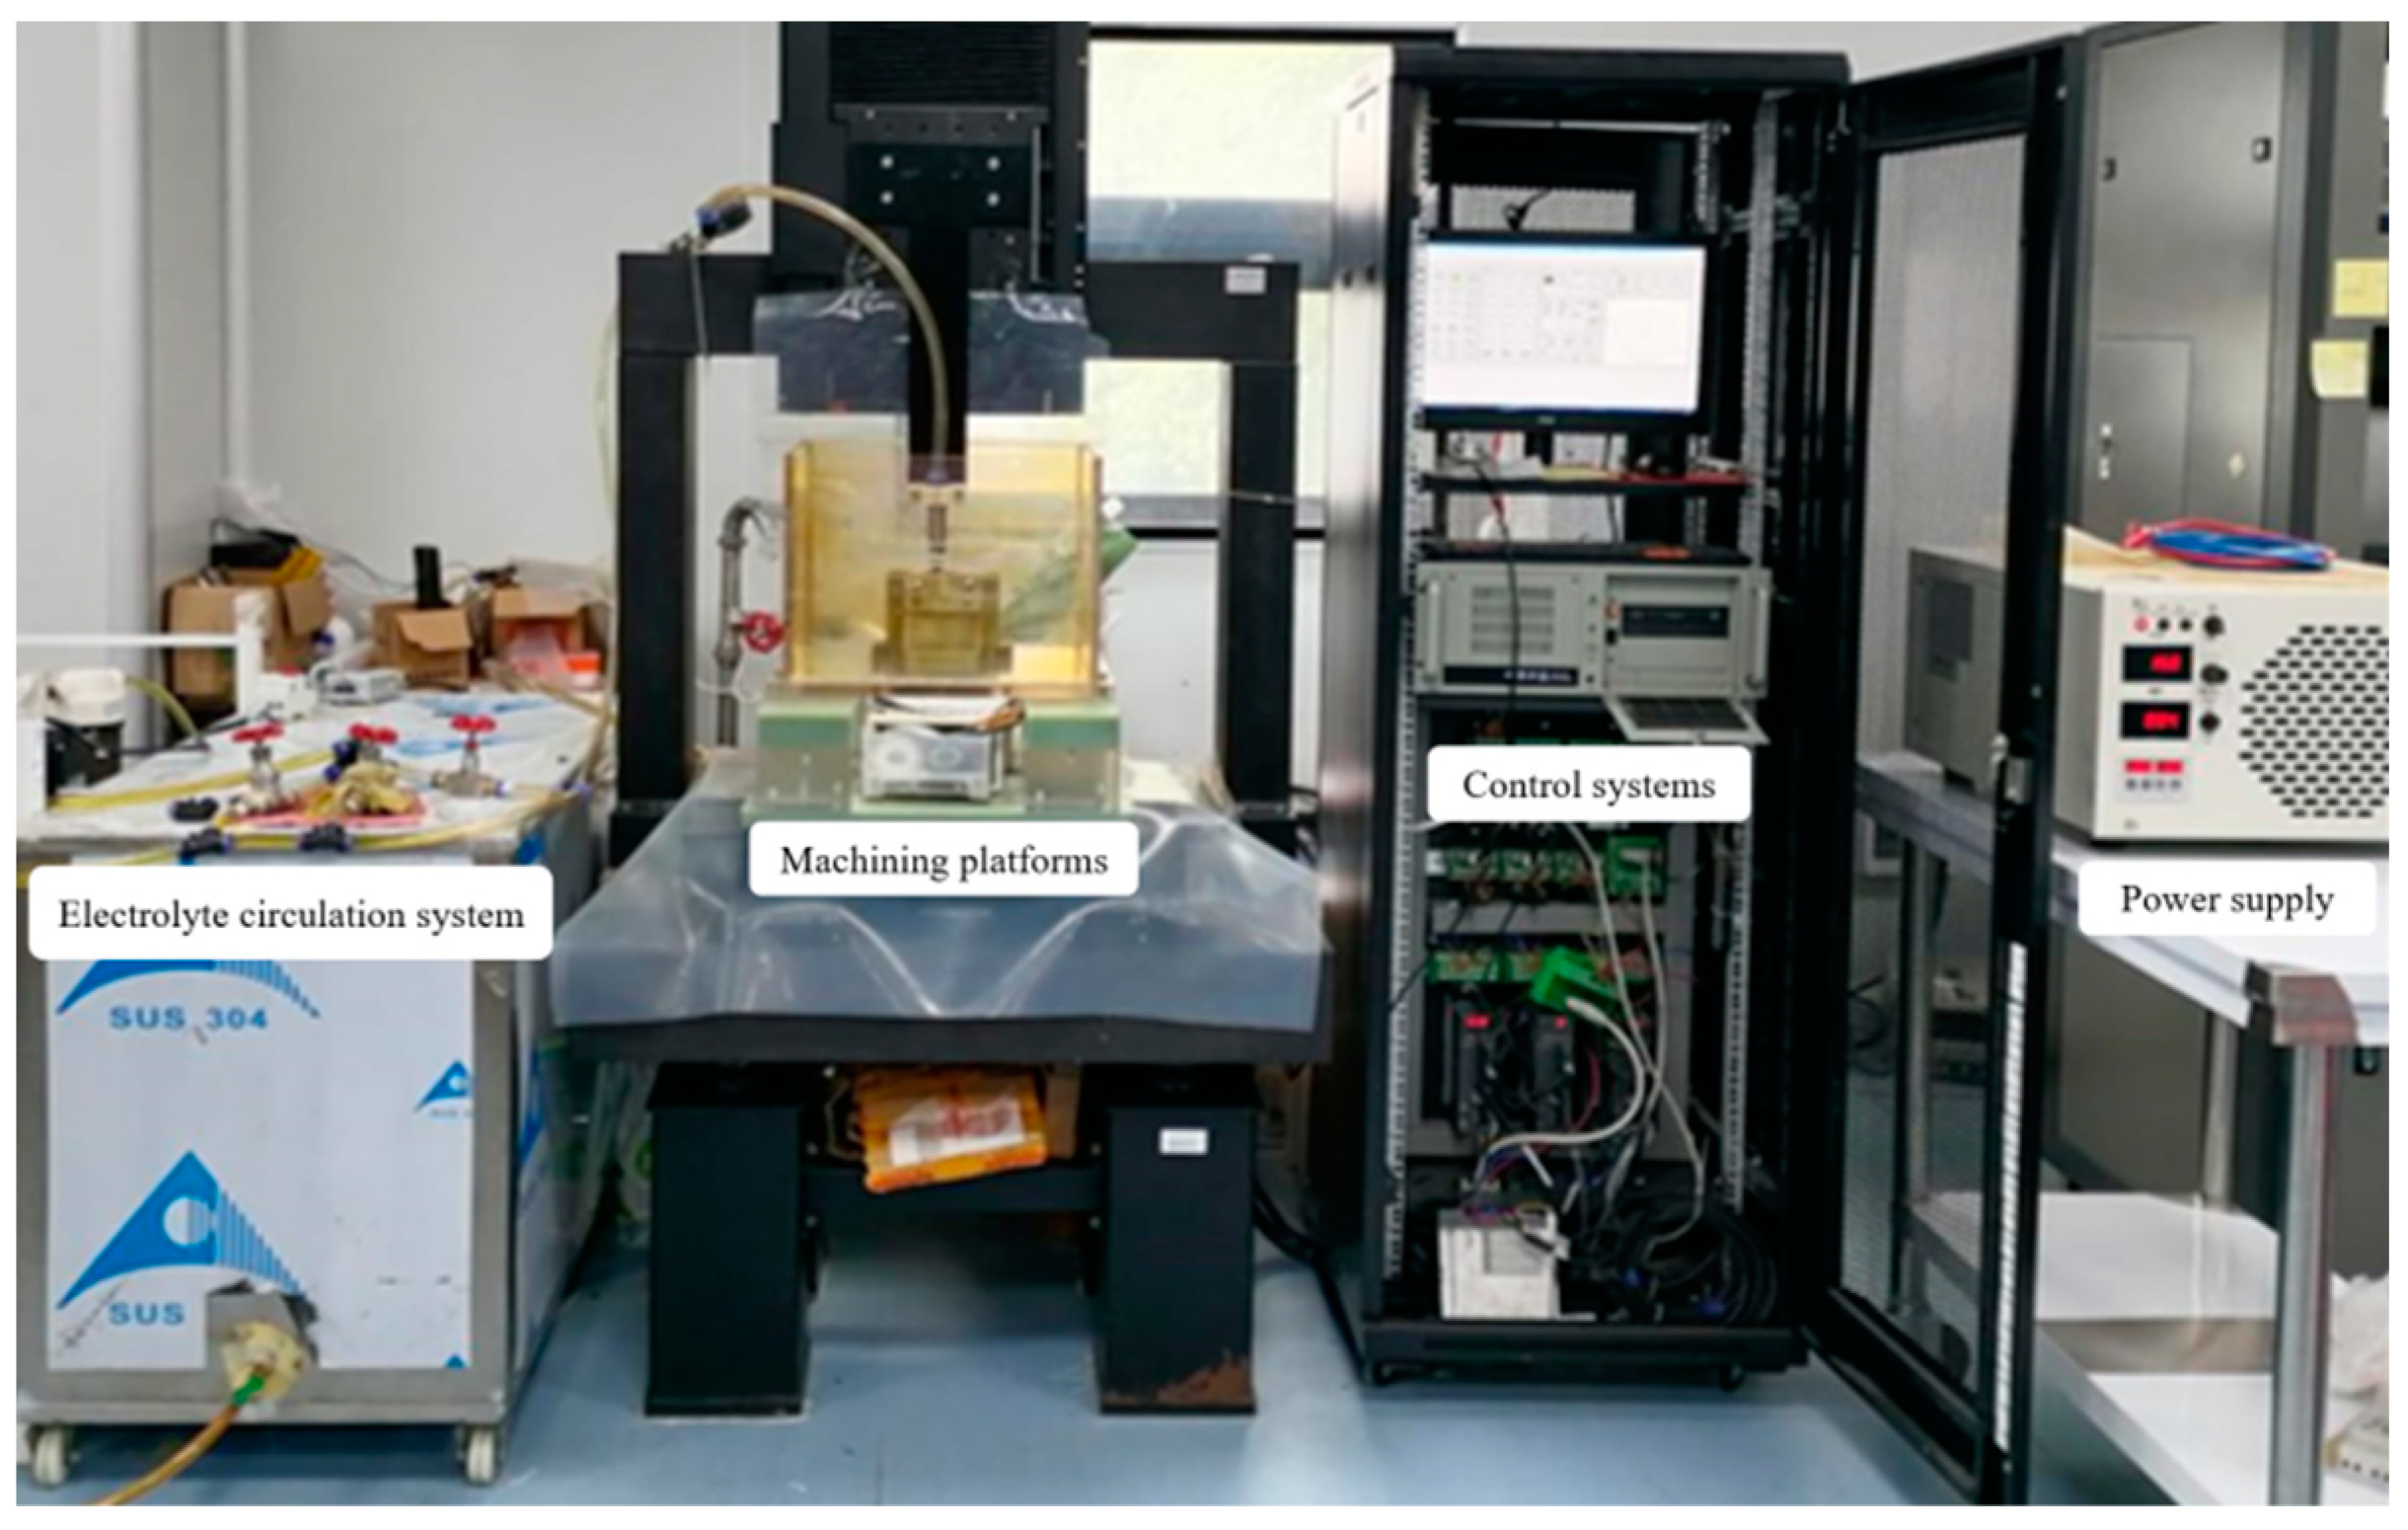
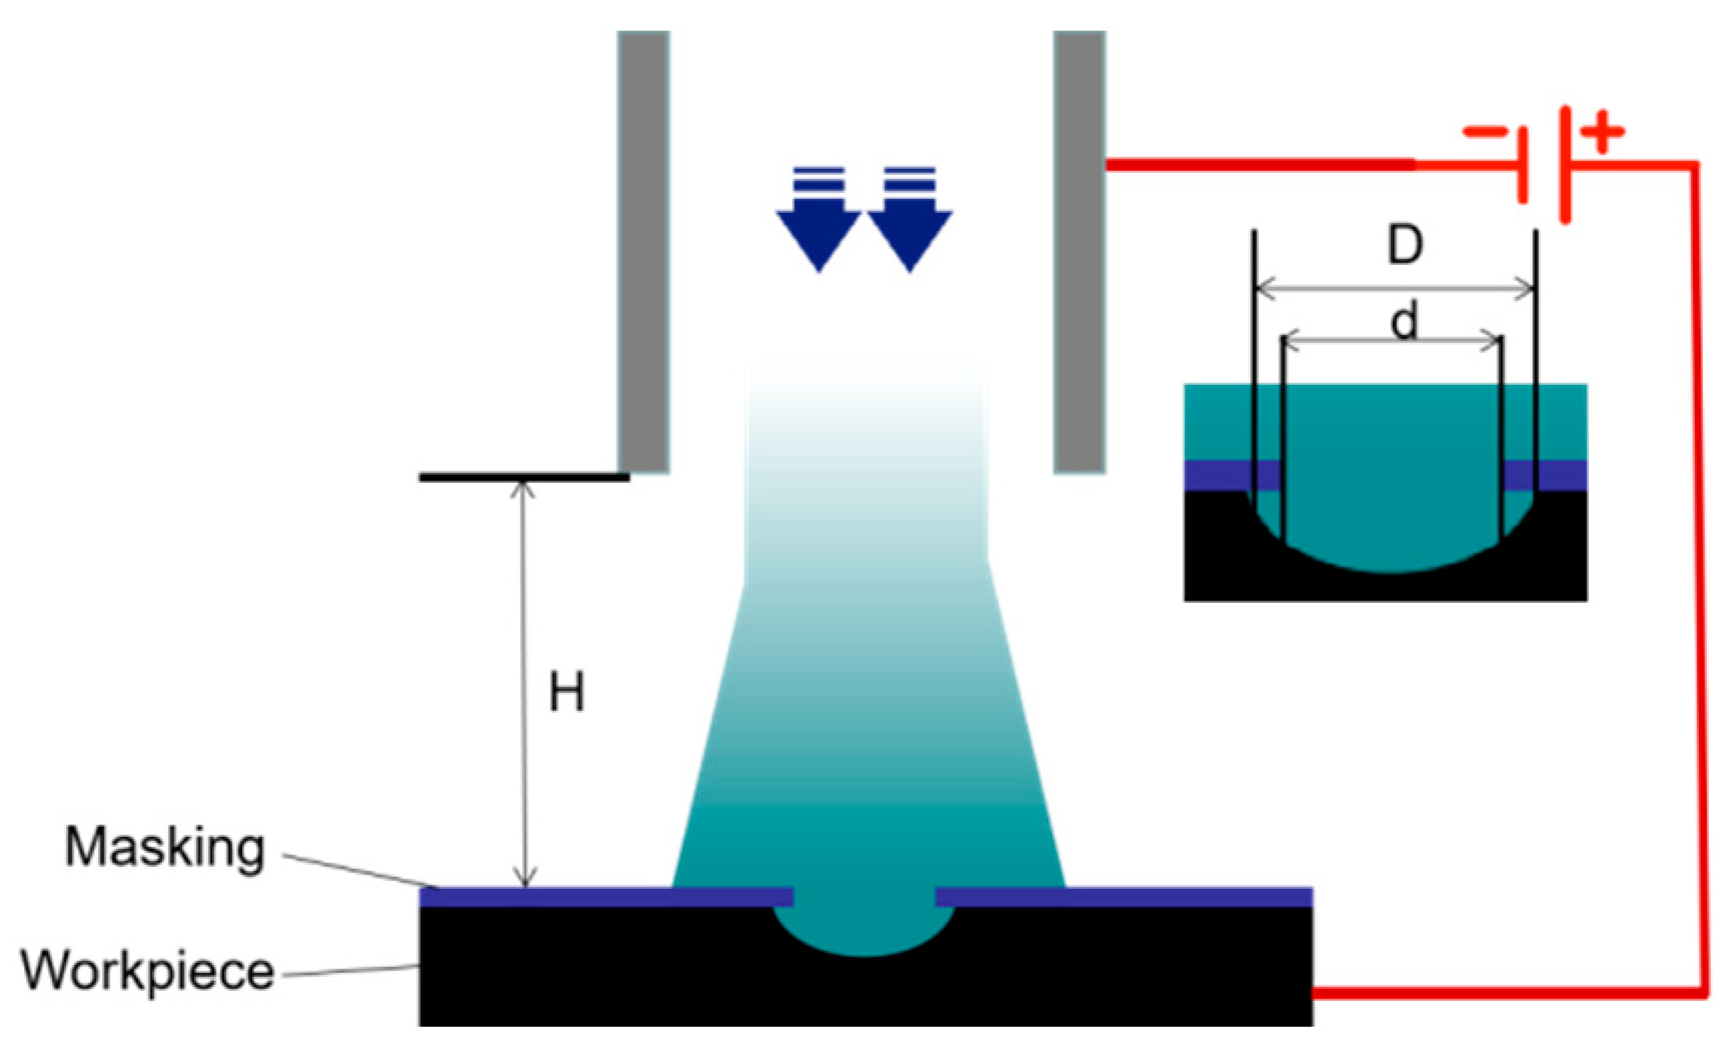
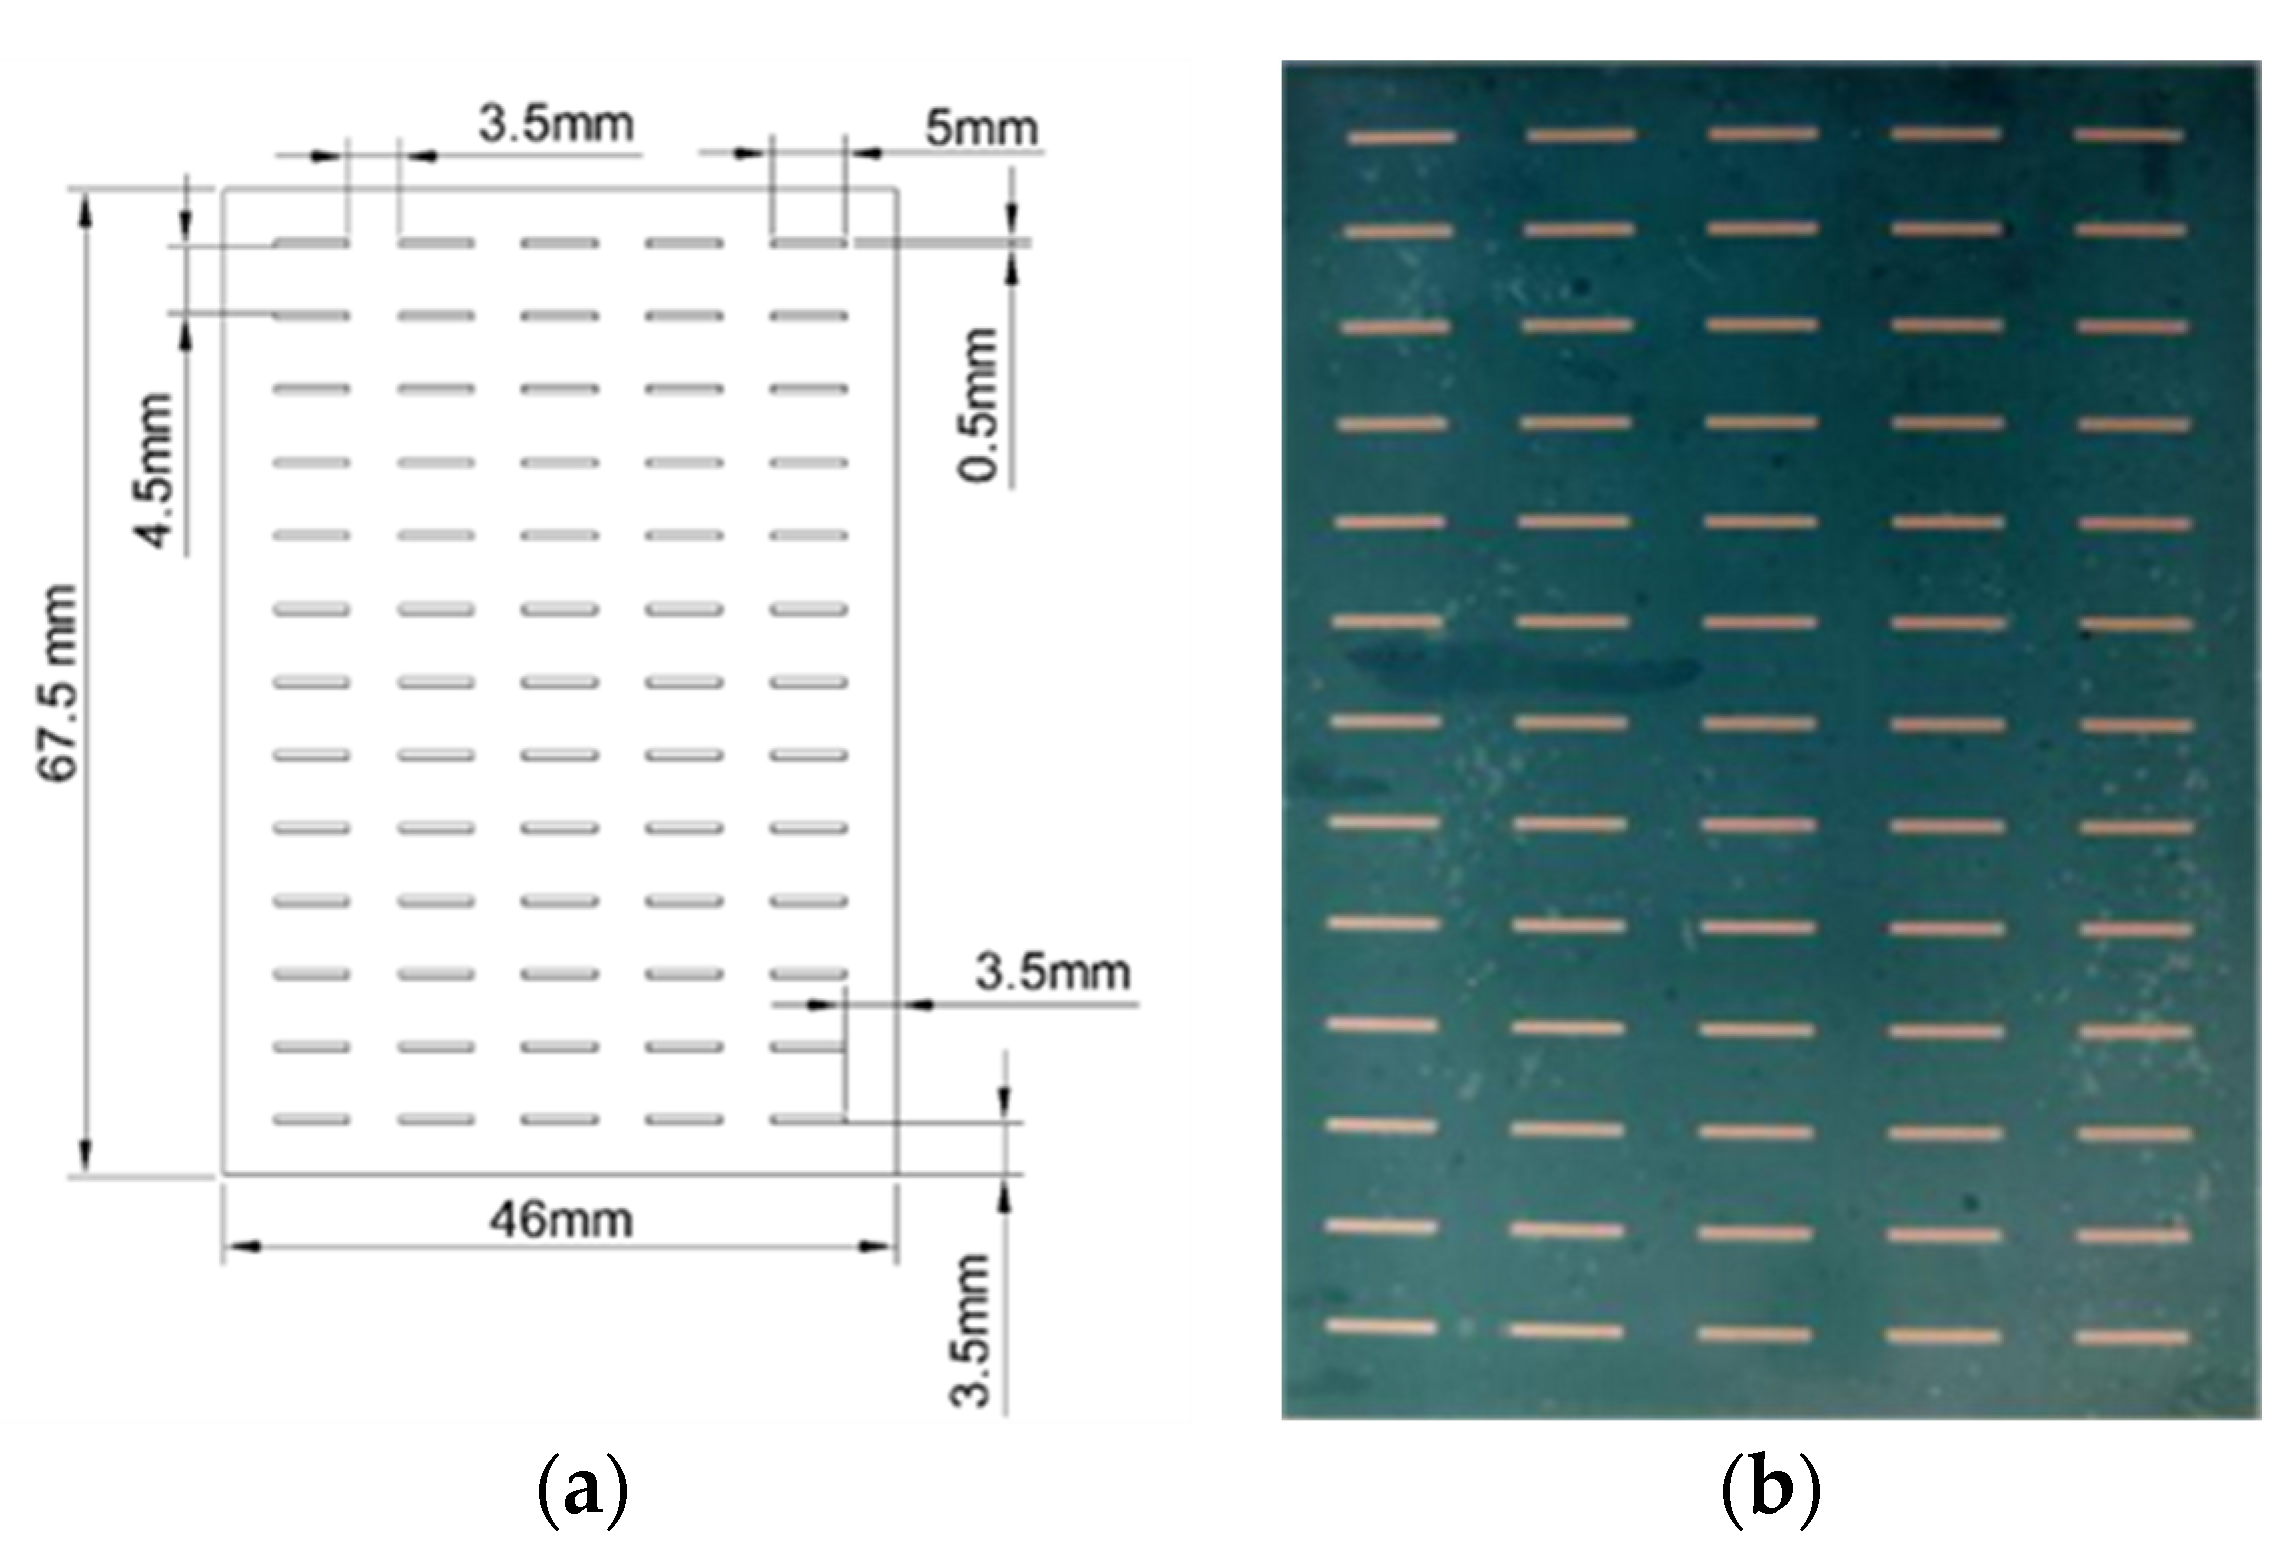
2.2. Experimental Design Scheme

The experimental setup for jet electrolytic machining is shown in Figure 2. The setup mainly consists of a linear module, a servomotor-driven work feeder, and a worktable. The machine is fixed on a rigid marble base, which is designed to be vibration-resistant and has a low thermal conductivity and coefficient of thermal expansion. Adjustable damping pads have been added under the base to isolate the machine from environmental vibrations. The electromechanical control section incorporates Mitsubishi servo motors (Mitsubishi Electric Corporation, Tokyo, Japan), a Renishaw micro-encoder system (Renishaw plc, London, UK), and a motion control card from Shenzhen Raytheon (Leadshine Technology Co., Ltd., Shenzhen, China).
The main parameters of the jet mask electrolytic processing experimental device are shown in Table 1. The X-axis and Y-axis travel range is 200 mm, with a repeatability of 5 μm, while the Z-axis travel range is 300 mm, with a repeatability of 5 μm.
Mask jet electrolytic processing utilizes a NaNO3 electrolyte for processing and high-voltage electrolyte from the cathode nozzle shot. In the mask hollow anode part of the reaction, the mask cover part does not participate in the reaction; As machining proceeds, the machined workpiece moves left and the mask does not move, dissolving the microgrooves in the machined workpiece. Changing the pulse voltage, jet diameter, processing gap, and processing time can change the surface microstructure morphology. The processing-principle diagram is shown in Figure 3.
The experimental object is a 304L stainless steel workpiece. In order to reduce the mutual interference between grooves and grooves during the machining process and to facilitate the measurement, the initial length of the grooves was set to 5 mm, and the width to 0.5 mm, as shown in Figure 4a. For each group of single-factor experiments, five repetitions of experiments were conducted, and the average value was taken after counting the depth and width of microgrooves. Chance was reduced by randomly measuring multiple microgrooves.
The experiment was carried out using the scanning machining method, where the Y-axis and Z-axis of the machining platform were not moving, the X-axis was moving at a constant speed, and the jet was machining the workpiece from left to right. Repeat the experiment independently for each single factor to ensure the reliability of the data. The experimental results were analyzed to summarize the process rules. Using the photolithography process technology, a blue oil mask with a thickness of 50 μm was prepared on the surface of the stainless-steel workpiece, as shown in Figure 4b. The mask can cover the surface of the workpiece well, without deformation bubbles and other undesirable phenomena, laying the foundation for the next process experiment.

3. Modeling and Simulation Analysis

COMSOL 6.2 software is used to establish a simulation model to realize the dynamic process of forming micro-grooves by mask jet electrolytic processing and study the effects of pulse voltage, processing gap, jet diameter, and processing time on the simulation results of micro-grooves in electrolytic processing. We explored the processing law under different experimental conditions to provide a basis for the optimization of experimental parameters.

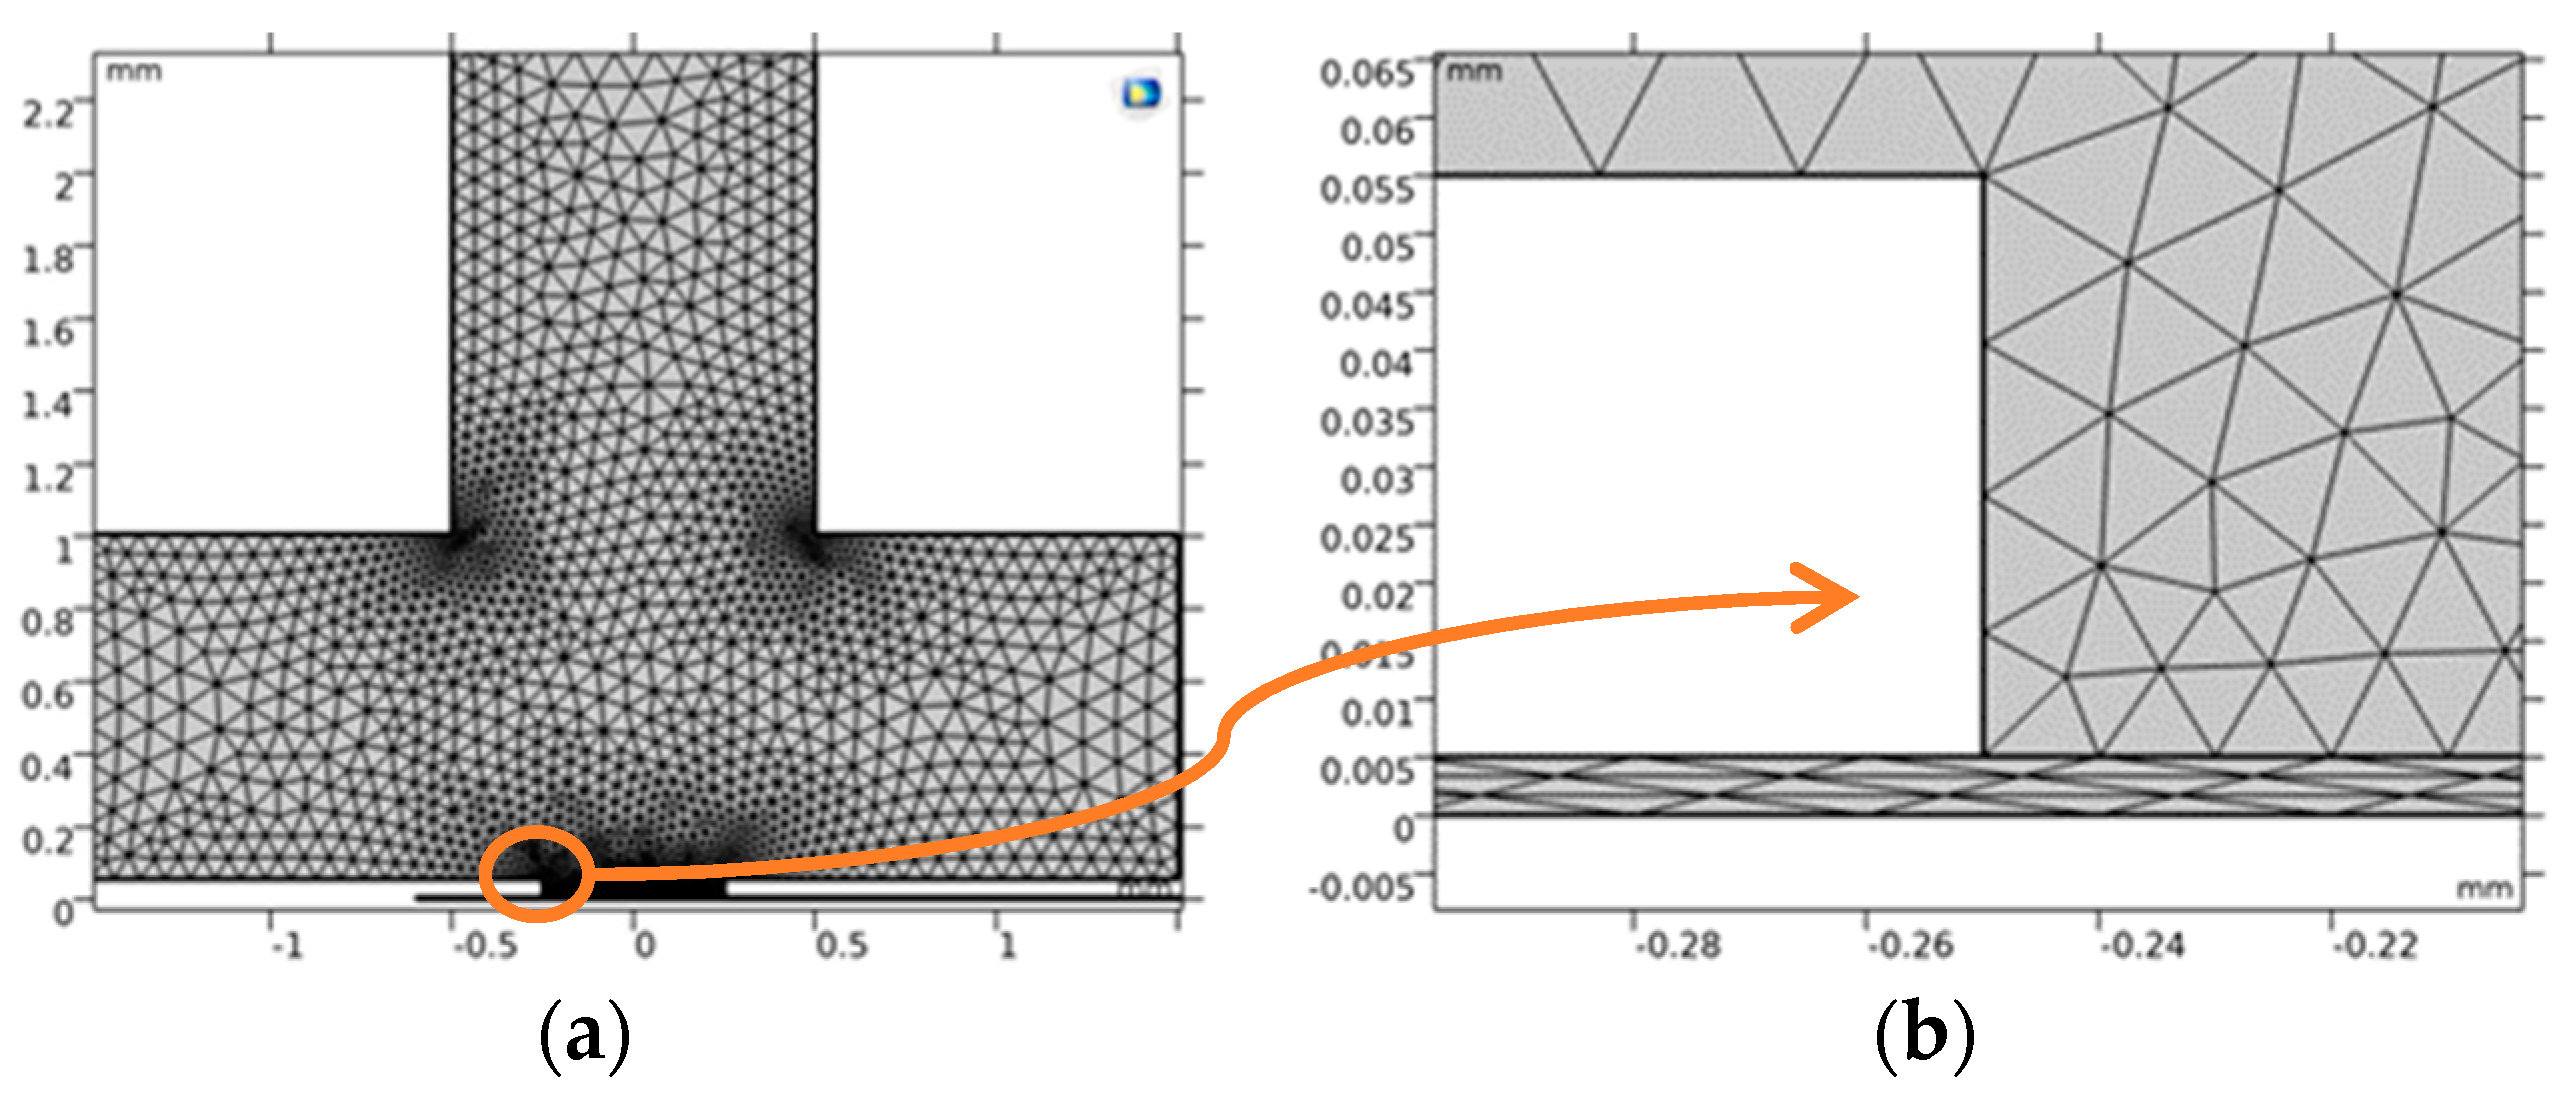
3.1. Multi-Physical Field Coupling

In the simulation analysis using two-dimensional modeling, the simulation model of the jet was achieved with a negative pole, the machining workpiece with a positive level, the mask, and the nozzle inside the insulator. In the processing process, the workpiece moves at a constant speed from right to left, and the electrolyte is shot from the nozzle to the surface of the workpiece for processing and then flows out from the gap on both sides.
After the completion of the model, the initial simulation parameters are set as shown in Table 2. The electrolyte material and deformation interval domain are added to the model, and the primary current distribution and dilute matter transfer function are set. It is assumed that the following parameters do not change during the experiment: temperature, conductivity, concentration of the electrolyte, and the electrolyte is a continuous incompressible fluid.
Based on the above assumptions, the electric field is set to be a constant electric field, and the electric field at any point, I (x,y), in the machining region, h, conforms to the Laplace equation, as shown in Equation (7).
2 φ x 2 + 2 φ y 2 = 0
where φ is the potential at each point of the processed region.
Laplace equation boundary conditions are shown in Equation (8).
φ | Γ a = E φ | Γ b = 0 φ n | Γ c = 0
where E is the anode surface potential, n is the normal phase coordinates, Γ a is the anode boundary, Γ b is the cathode boundary, and Γ c is the insulation boundary.
To improve the simulation efficiency, the model is meshed with a layer mesh to delineate the boundary region and a free triangle mesh for other regions. The surface of the electrolytically machined workpiece is refined to improve the quality of meshing. The average cell mass of the grid was 0.12, and the grid area was 0.03 mm2. The simulation model meshing is shown in Figure 5.
After the simulation calculation is completed, the electrolyte potential map and current density line graph electrolyte map show the distribution of potential in different areas and its change rule, and the current density line graph shows the electrolysis reaction rate of the processed workpiece.

3.2. Microgroove Simulation Analysis

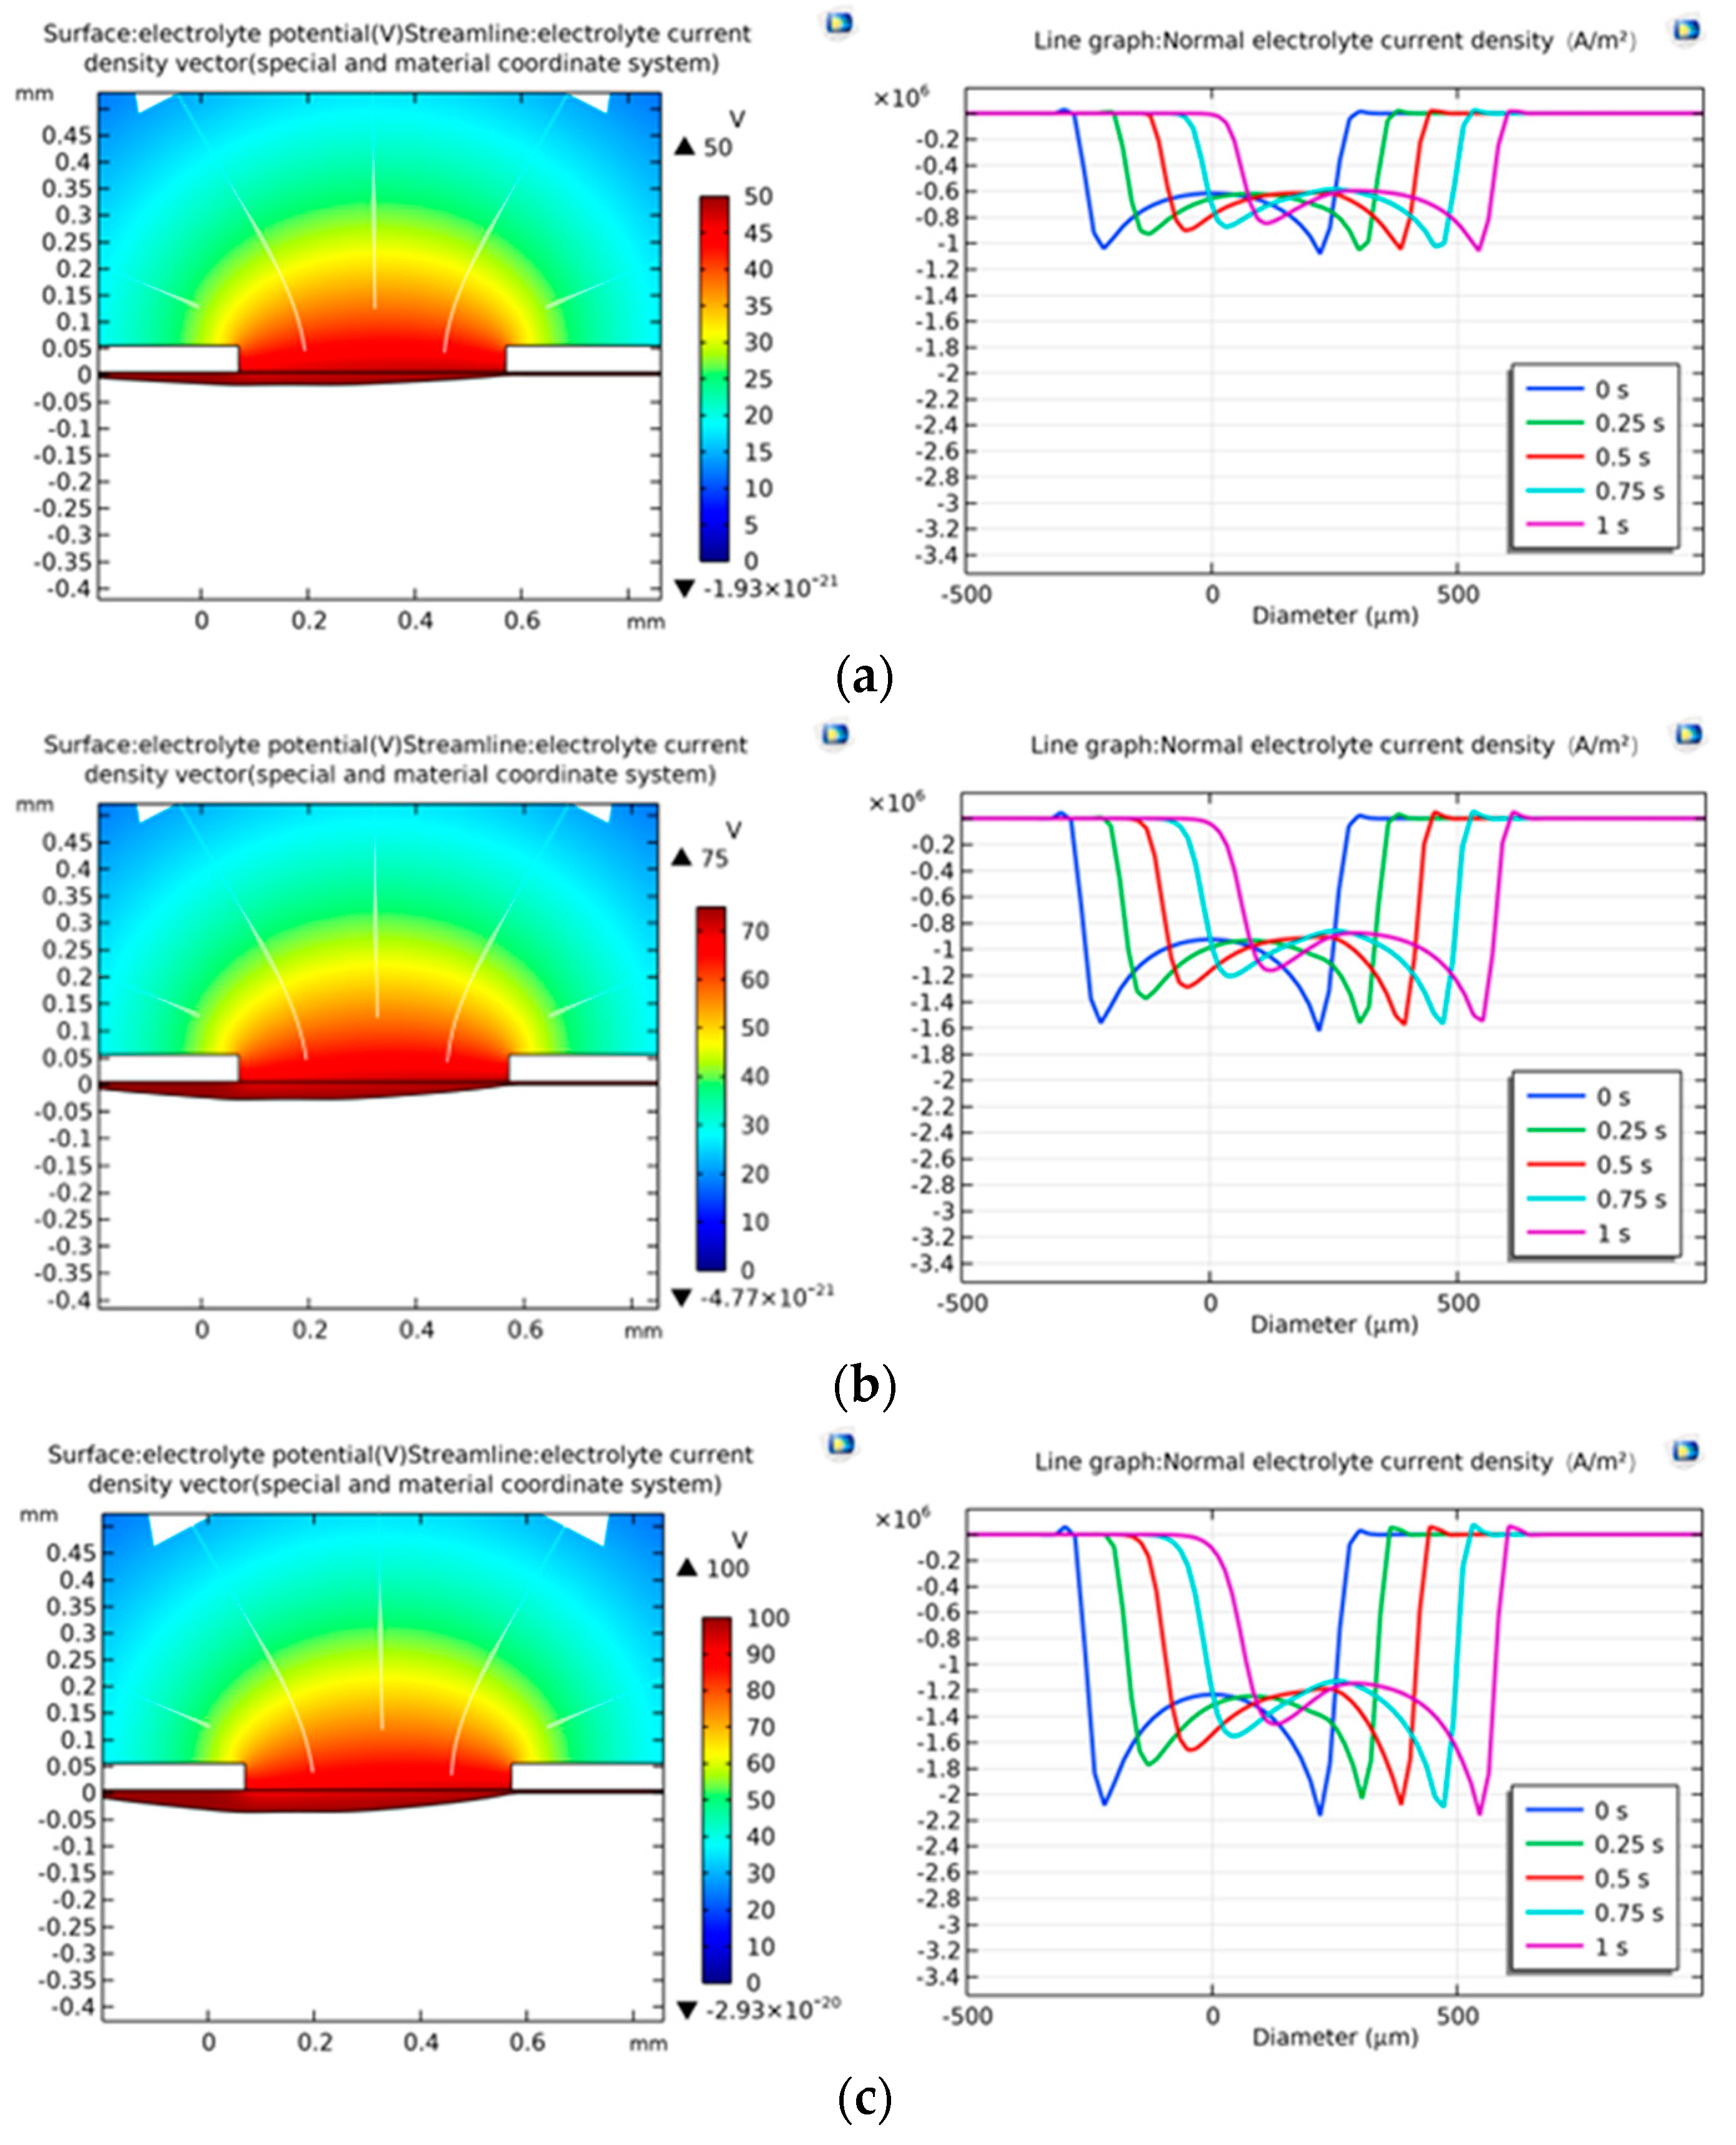
3.2.1. Simulation Analysis of Microgroove with Different Pulse Voltages

The pulse voltage is set to 50 V, 75 V, 100 V, and 125 V; the processing gap is 1 mm; and the processing time is 1 s. The electric field simulation model under different pulse voltages is established, and the electric field simulation analysis is carried out. In the analysis results, the corresponding electrolyte potential map and the current density line map for the 0.25 s time interval are selected, as shown in Figure 6.
From the electrolyte potential map, it can be seen that the middle position of the microgroove has the darkest color, and the color along the direction of the electric field line transitions from dark to light; thus, the potential decreases gradually. The potential distribution inside the microgroove is uniform and shows a decreasing trend along the direction of the electric field lines, and the adjustment of the pulse voltage does not affect the uniformity of the potential distribution. The potential reaches its maximum value at the anode workpiece, close to the applied external voltage, while the potential at the cathode nozzle is 0 V.
As can be seen from the current density line graph, the average current density of the jet electrolyte increases significantly by 154.2% when the voltage is increased from 50 V to 125 V. Under constant voltage conditions, the current density at the edge of the mask peaks at the beginning of the simulation calculation, and the average current density in other regions is relatively low. As the simulation time continues to progress, the mask nozzle gradually moves away from the microgroove start end, the area under the mask edge near the microgroove start end has experienced longer processing time than the area far away from the microgroove start end, and the microgroove is formed faster, resulting in the increased distance between the electrodes; and at the same time, the contact area between the electrolyte and the workpiece is increased, so the current density exhibits a gradual decrease in the trend of the electrolysis capacity decreases. With the relative movement of the mask nozzle and the workpiece, the mask edge that is situated away from the workpiece area under the start of the microgroove has been in the initial stage of processing, and its edge current density is almost unchanged. The region of the mask edge close to and under the start of the microtrench experienced a longer processing time than the region away from the start of the microtrench.

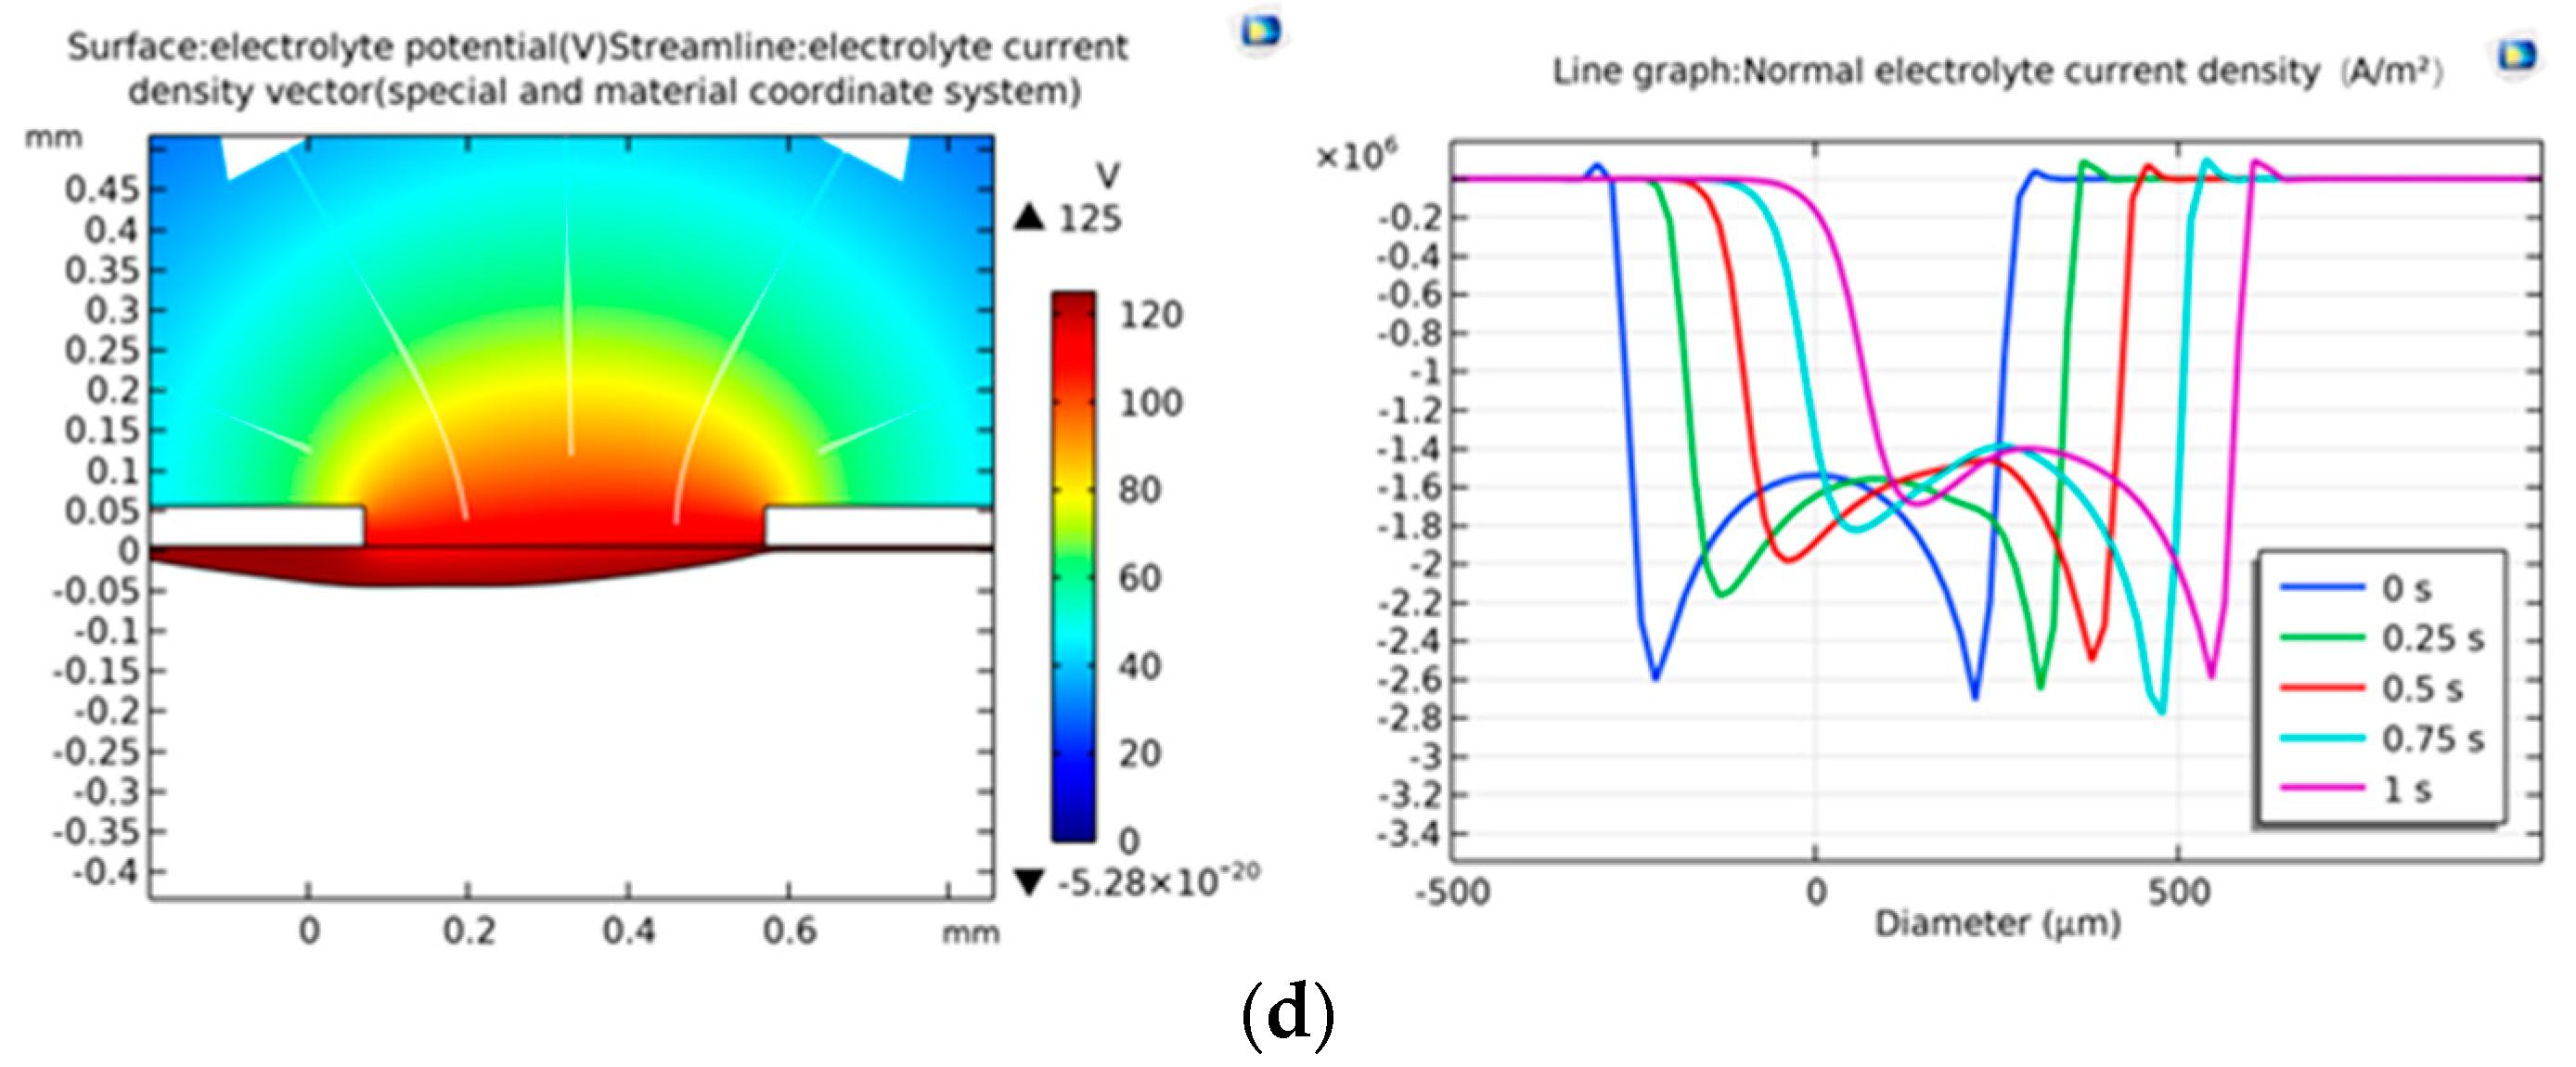
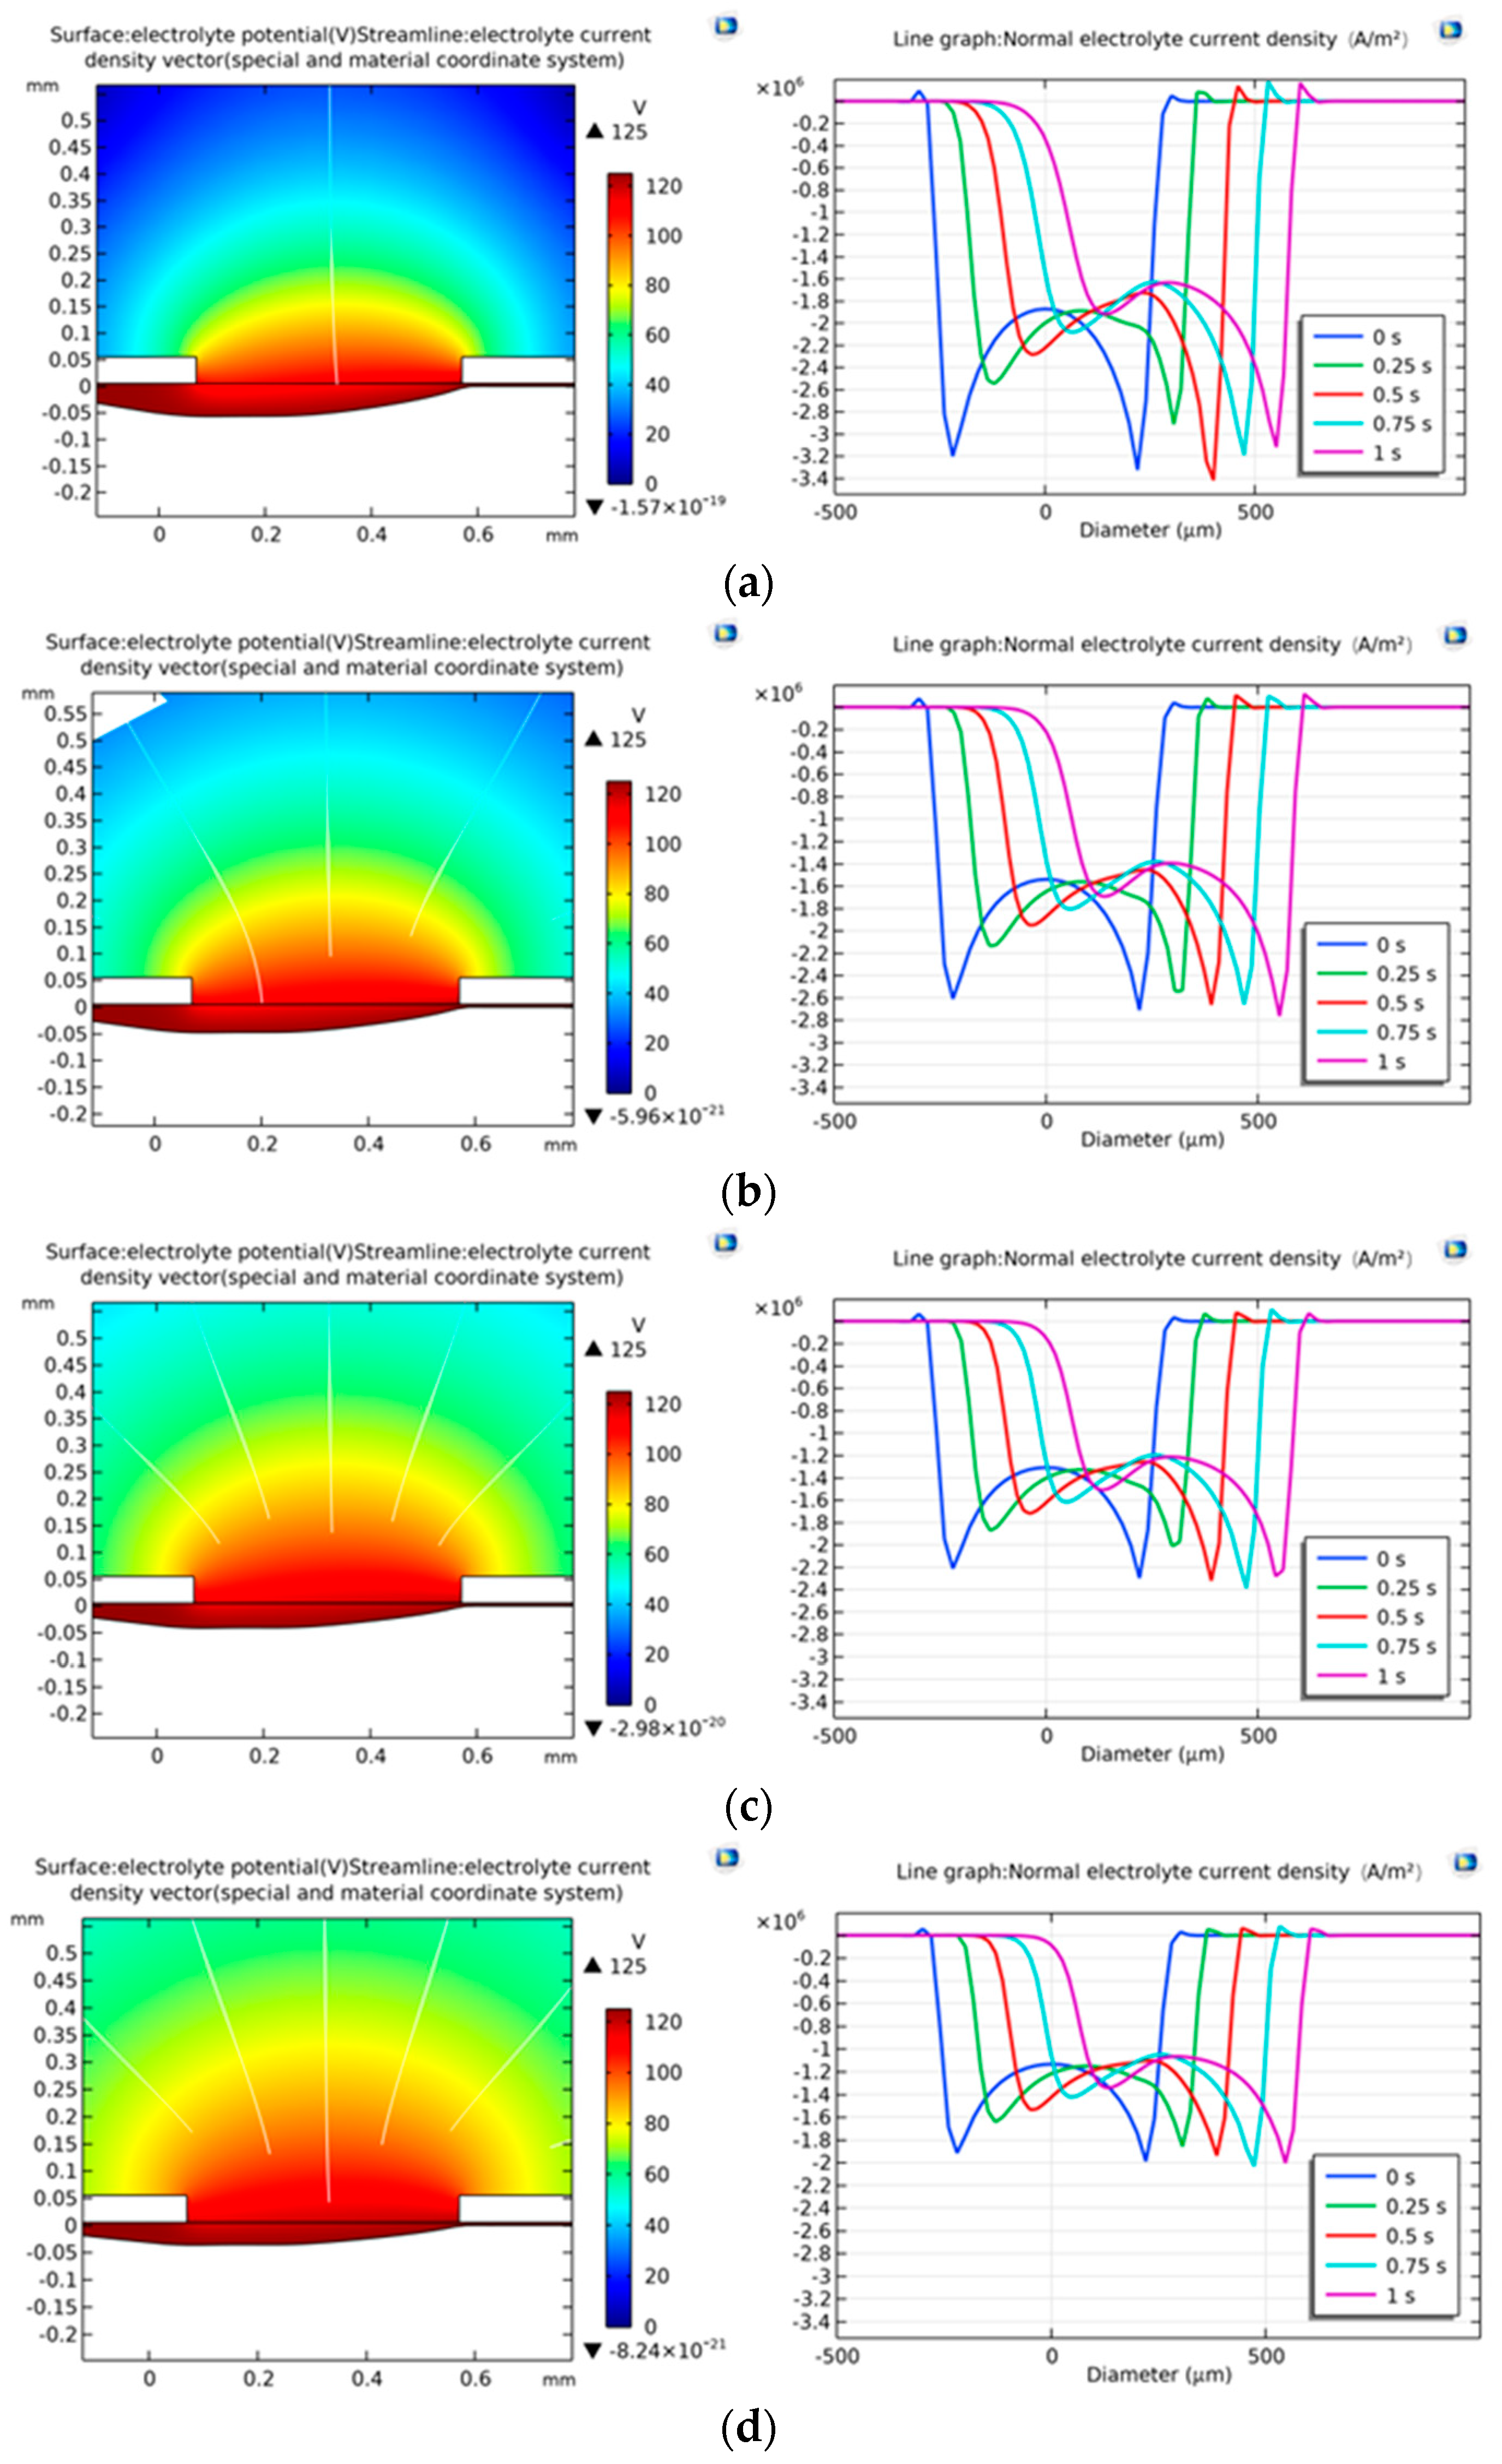
3.2.2. Simulation Analysis of Microgroove with Different Machining Gap

The machining gap is set to 0.5 mm, 1 mm, 1.5 mm, and 2 mm; the voltage is 125 V; and the machining time is 1 s. The electric field simulation models with different machining gaps are established and analyzed in the electric field simulation. In the analysis results, the corresponding electrolyte potential maps and current density line maps for 0.25 s time intervals are selected, as shown in Figure 7.
From the electrolyte potential maps, it can be seen that the potential distribution inside the microtrench is consistent and decreases gradually with the direction of the electric field lines. Due to the insulating property of the mask, the electrochemical reaction occurs between the charged workpiece surface and the electrolyte only in the uncovered area of the mask. At the position of the anode workpiece, the potential is close to the maximum value of 125 V. At the position of the cathode nozzle, the potential decreases to 0 V. The variation in the machining gap does not affect the consistency of the potential distribution.
From the current density line graph, it can be seen that the average current density inside the microgroove decreases by 42.8% as the machining gap increases from 0.5 mm to 2 mm, and the peak-to-valley difference in current density gradually decreases. The machining gap is constant, and the average current density reaches its maximum value at the beginning of the machining. The simulation calculations continued, the current density in the processed region under the mask edge near the microtrench initiation gradually decreased, and the overall electrolytic capacity weakened. The processing area under the edge of the mask away from the microtrench initiation is still undergoing electrolysis in the width and depth directions, and the change in electrolysis capacity is small.

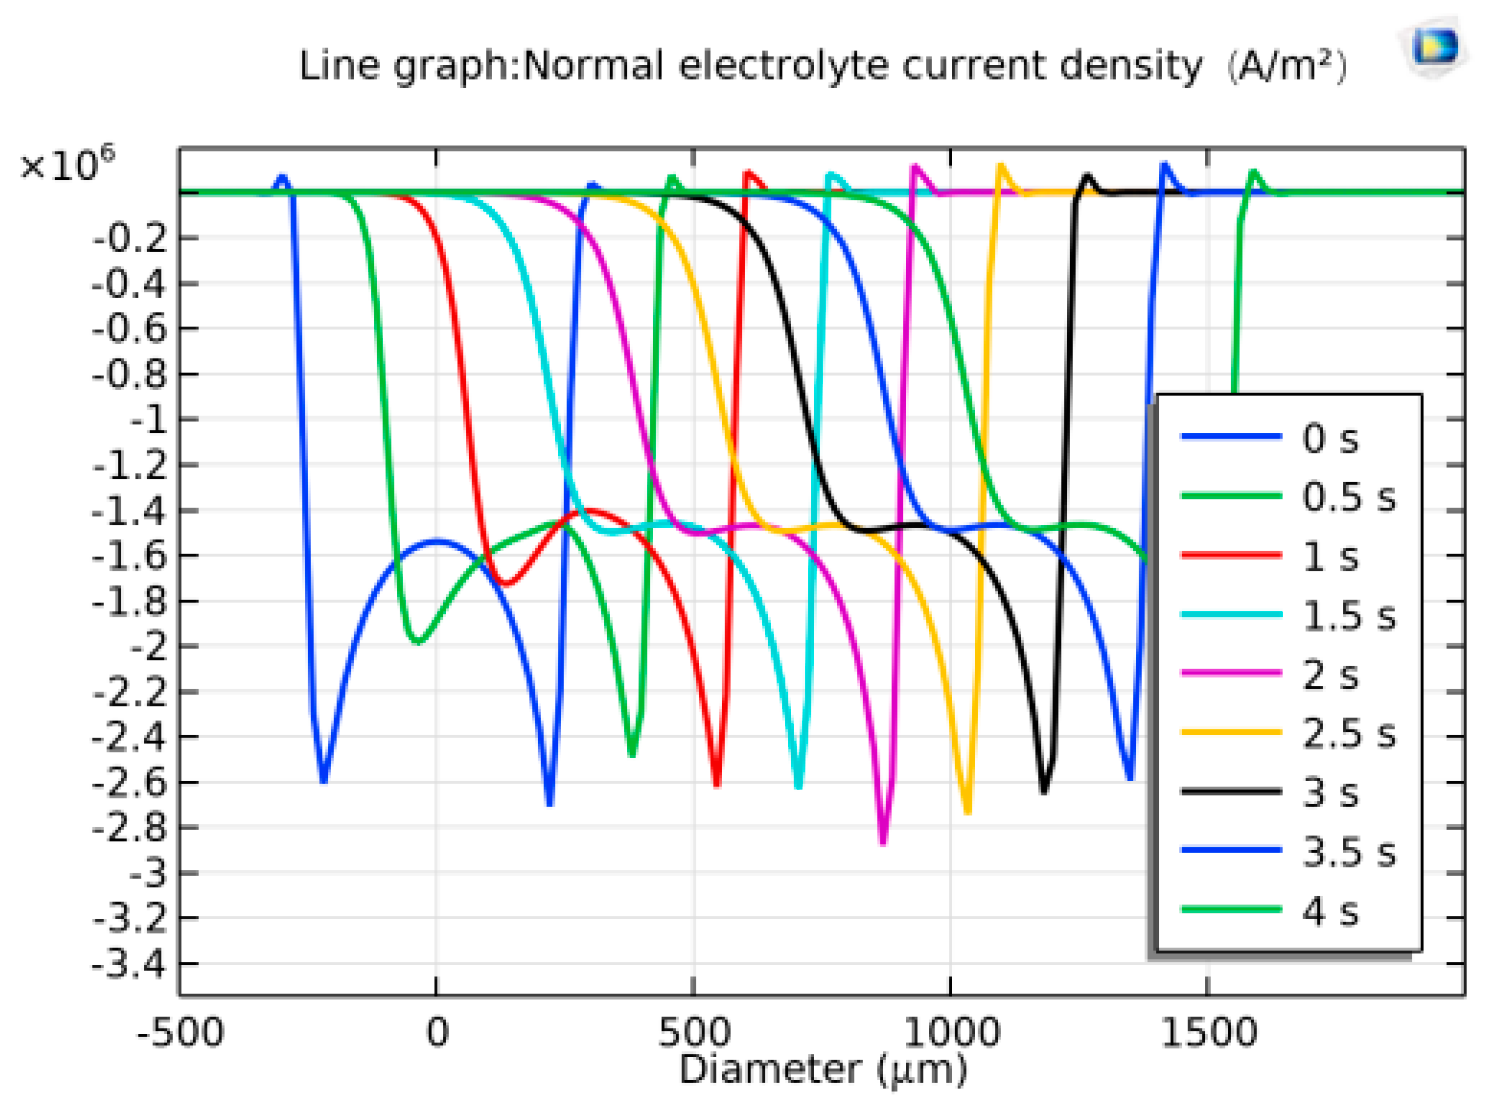
3.2.3. Simulation Analysis of Electric Field with Different Processing Times

The processing time is set to 1 s, 2 s, 3 s, and 4 s; the processing voltage is 125 V; and the processing gap is 1 mm. The current density line graphs for the 0.5 s time interval are shown in Figure 8.
As can be seen from Figure 8, the average current density decreases from 2.29 × 10⁶ A/m2 to 2.10 × 10⁶ A/m2, with a decrease of 8.3%, as the processing time continues, leveling off after 1.5 s, and the current densities in each part of the microgroove are unchanged. The current density of the processed area under the edge of the mask near the start end of the microtrench gradually decreases, and the current density of the processed area under the edge of the mask away from the start end of the microtrench remains relatively constant.

4. Experimental Research

In this study, we aimed to build the experimental platform for jet electrolytic processing; complete the preparation of the blue oil mask workpiece; conduct experiments on processing parameters such as pulse voltage, processing gap, and processing time; analyze the experimental data; and summarize the processing characteristic laws.

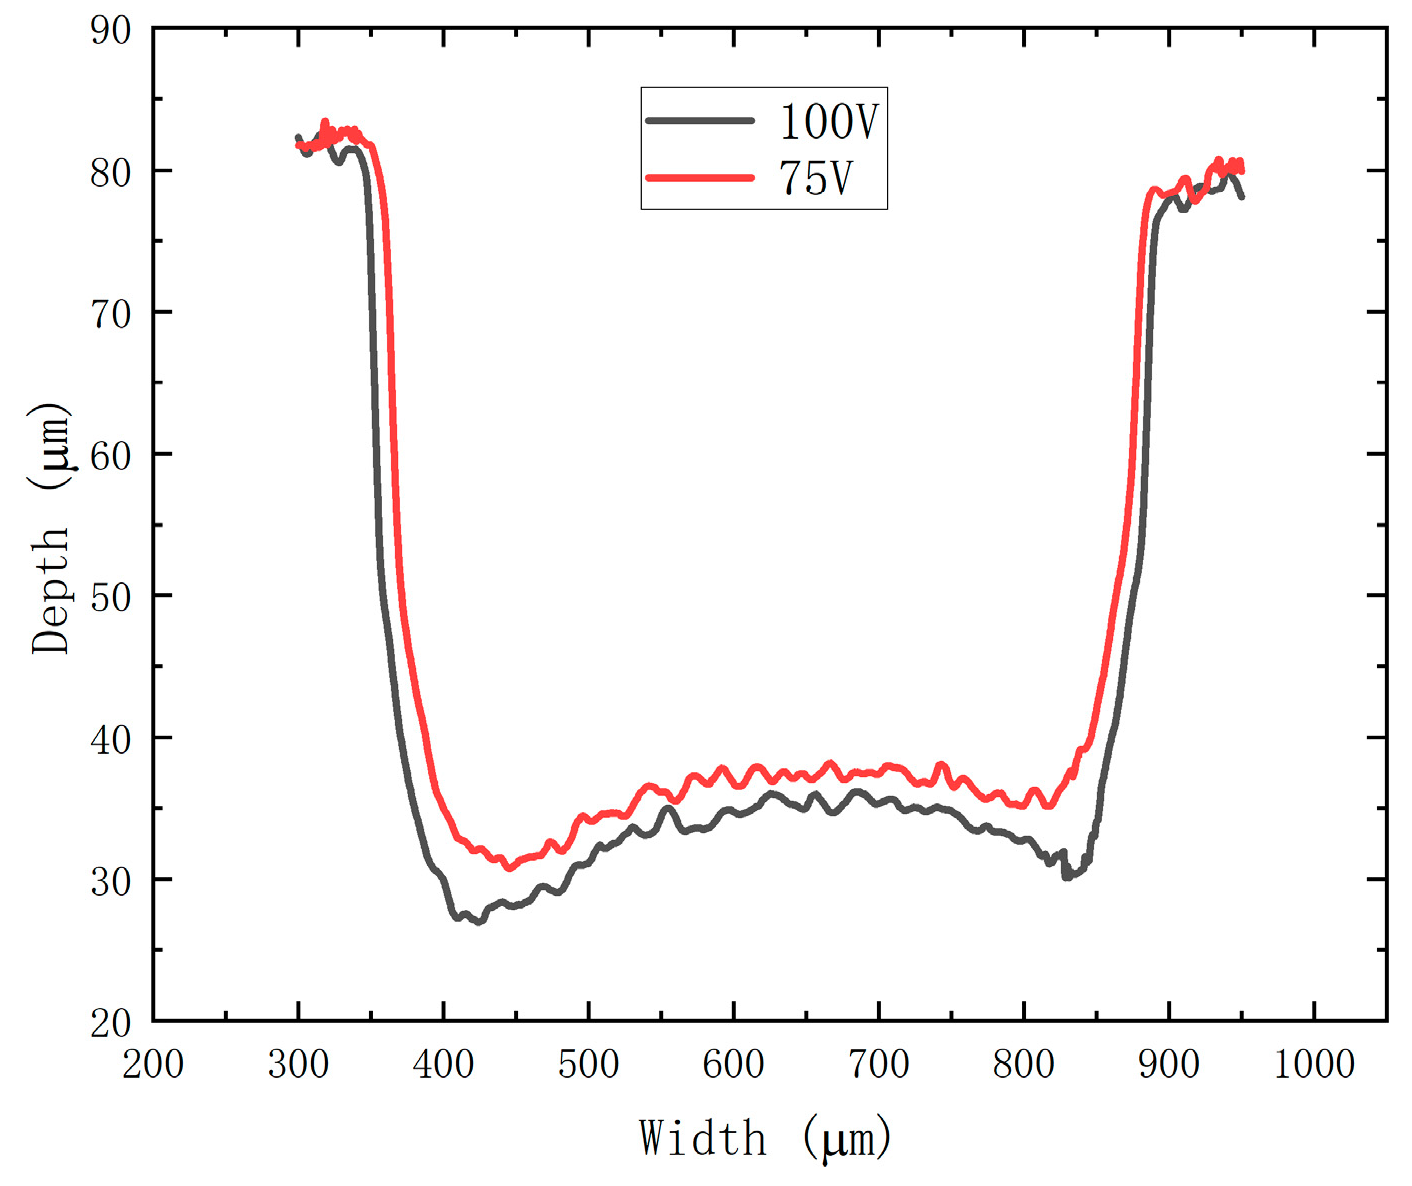
4.1. Impact of Pulse Voltage on Microgroove Structure

The pulse voltage is set to 50 V, 75 V, 100 V, and 125 V; the processing gap is 1 mm; the diameter of the jet is 1 mm; the initial width of the mask is 500 μm, and the length of the mask is 5 mm; and the effects of different pulse voltages on the width and depth of the processed microgroove are shown in Table 3.
The average width and depth corresponding to the above pulse voltages were plotted as a relationship using Origin, as shown in Figure 9. The left vertical coordinate represents the width of the microgroove in the form of a bar graph, and the right vertical coordinate represents the depth of the microgroove in the form of a line graph.
From Table 3 and Figure 9, it can be seen that the increase in machining voltage increases the material removal rate on the surface of the workpiece, and the width and depth of the microgrooves gradually increase. The average width of the microgroove increases from 532 μm at 50 V to 573 μm at 125 V, an increase of 7.7%. The average depth of microgrooves increases from 45 μm at 50 V to 58 μm at 125 V, with an increase of 28.8%. The depth of microgrooves tends to increase more than the width, and the mask plays a good role in restraining the shape of the workpiece. The depth-to-width ratio of the microgrooves increased from 0.084 at 50 V to 0.101 at 125 V, an increase of 20.2%, and the electrolytic processing capability was improved. The increase in pulse voltage leads to an increase in the average current density and an increase in the electrolytic reaction rate, which is corroborated by the voltage group simulation experiments.
The two-dimensional structure of microgrooves was analyzed using laser confocal microscopy.
As shown in Figure 10, the increase in pulse voltage has less effect on the microgroove shape, the groove shape is square, the flatness around the mask is good, the rectangular replication accuracy is high, and the mask is well constrained. A schematic diagram of the microtrench cross-section measurement is drawn, as shown in Figure 11.
From Figure 11, it can be seen that the microgrooves at 100 V machining voltage have more pronounced side etching, higher verticality of the inner wall, better machining definiteness, and better machining quality compared to 75 V. The bottom of the groove of the microgroove at 75 V machining voltage is smoother, and the island height is lower.

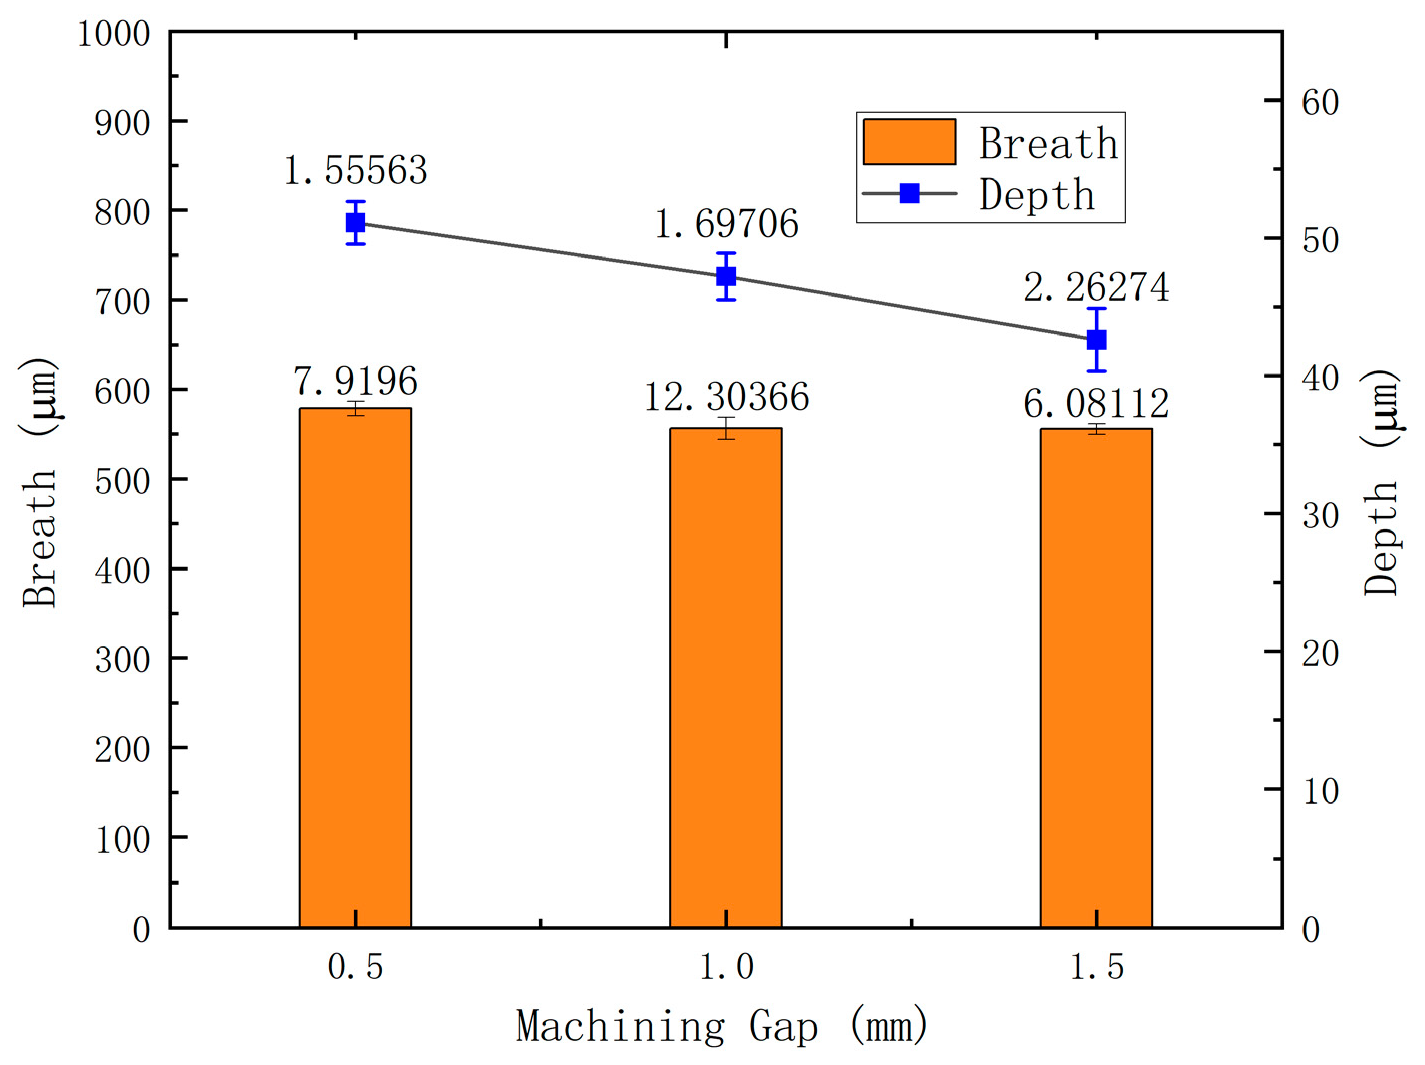
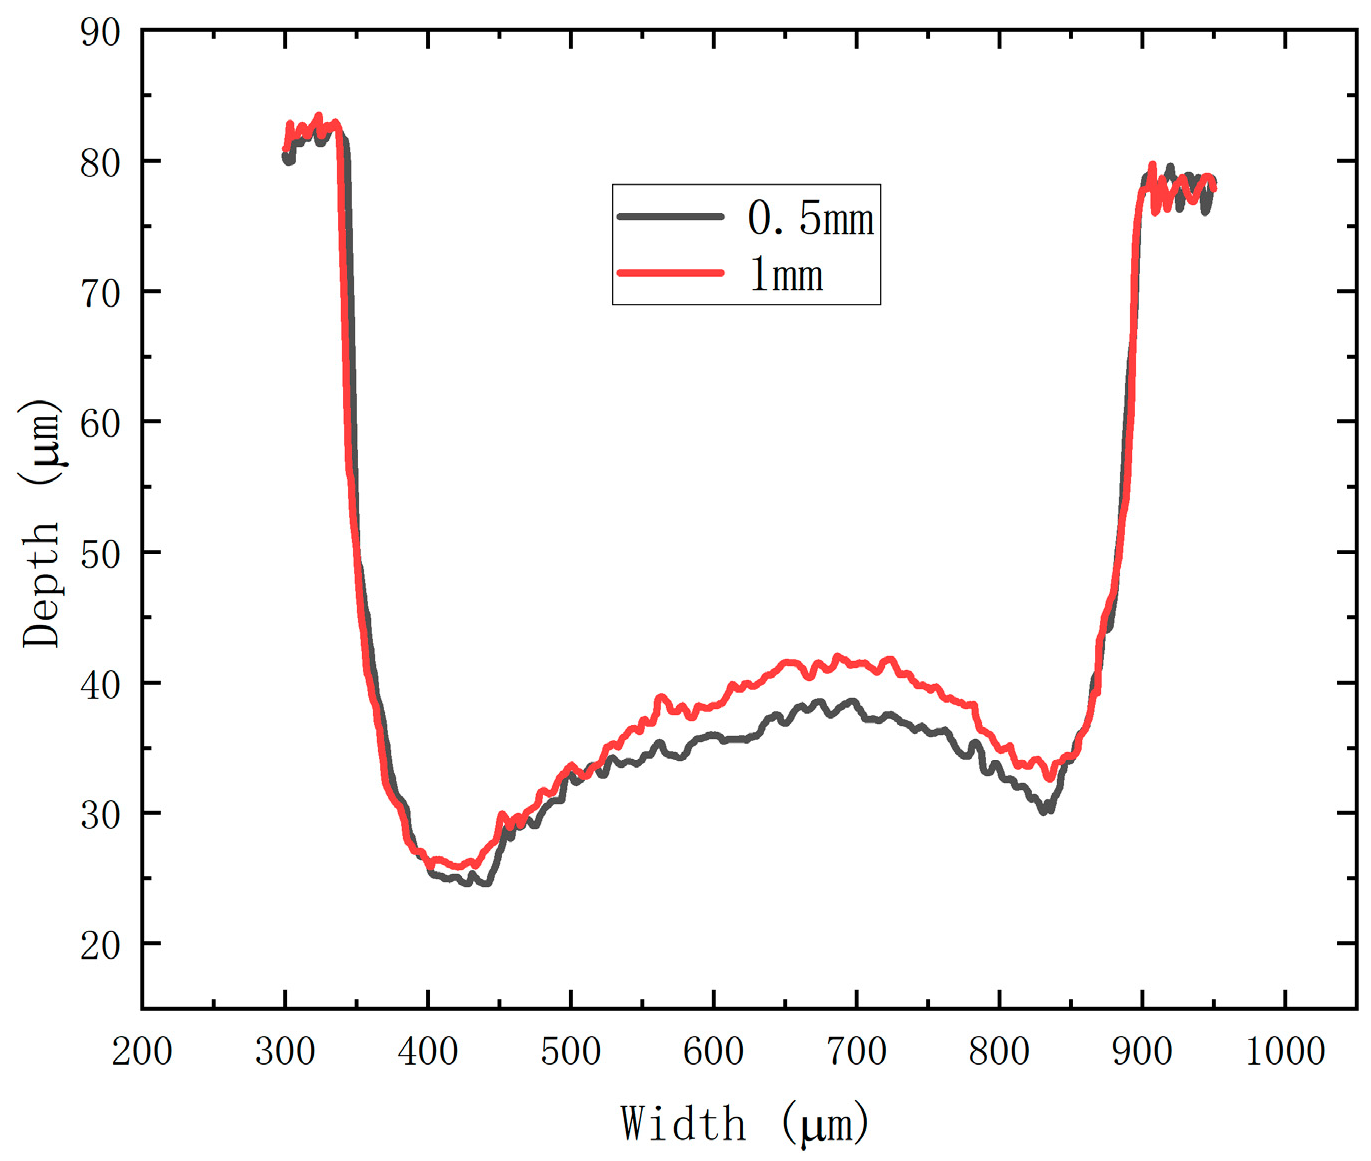
4.2. Effect of Machining Gap on Microgroove Structure

The processing gap is set to 0.5 mm, 1 mm, and 1.5 mm; the pulse voltage is 125 V; the diameter of the jet is 1 mm; the initial width of the mask is 500 μm, and the length is 5 mm; and the processing time is 1 s. The effects of the different processing gaps on the processed microgrooves’ width and depth are shown in Table 4.
The widths and depths corresponding to the above machining gaps were plotted as a relationship graph using Origin, as shown in Figure 12. The left vertical coordinate represents the microgroove width in the form of a bar graph, and the right vertical coordinate represents the microgroove depth in the form of a line graph.
From Table 4 and Figure 12, it can be seen that the width and depth of the microgrooves decrease gradually with the increase in the machining gap. The average width of microgrooves decreases from 573 μm at 0.5 mm to 560 μm at 1.5 mm, a decrease of 2.2%. The average depth of microgrooves decreases from 50 μm at 0.5 mm to 41 μm at 1.5 mm, a reduction of 18.0%, with good mask constraints. The depth-to-width ratio of the microgrooves decreases from 0.087 at 0.5 mm to 0.073 at 1.5 mm, a reduction of 16.1%, and the processing efficiency decreases. This verifies the findings of the machining-gap group simulations that the average current density decreases with increasing machining gap, which diminishes the electrolytic capacity.
To further investigate the machining morphology, we analyzed the two-dimensional structure of the microgrooves using laser confocal microscopy, as shown in Figure 13.
The machining gap is reduced, but the mask can still play a constraining role, especially if the microgroove width can be effectively controlled. The groove shape is regular, the machining accuracy is high, and the machining interval has a small effect on the morphology replication accuracy of the microgroove. A schematic diagram of the microgroove cross-section measurement is drawn, as shown in Figure 14.
As can be seen from Figure 14, compared with 0.5 mm, the 1 mm machining gap has a small change in the amount of side erosion and perpendicularity, an increase in the peak of the silo, and an increase in the silo effect. The machining gap has a large effect on the islanding effect and a small effect on the fixed domain.

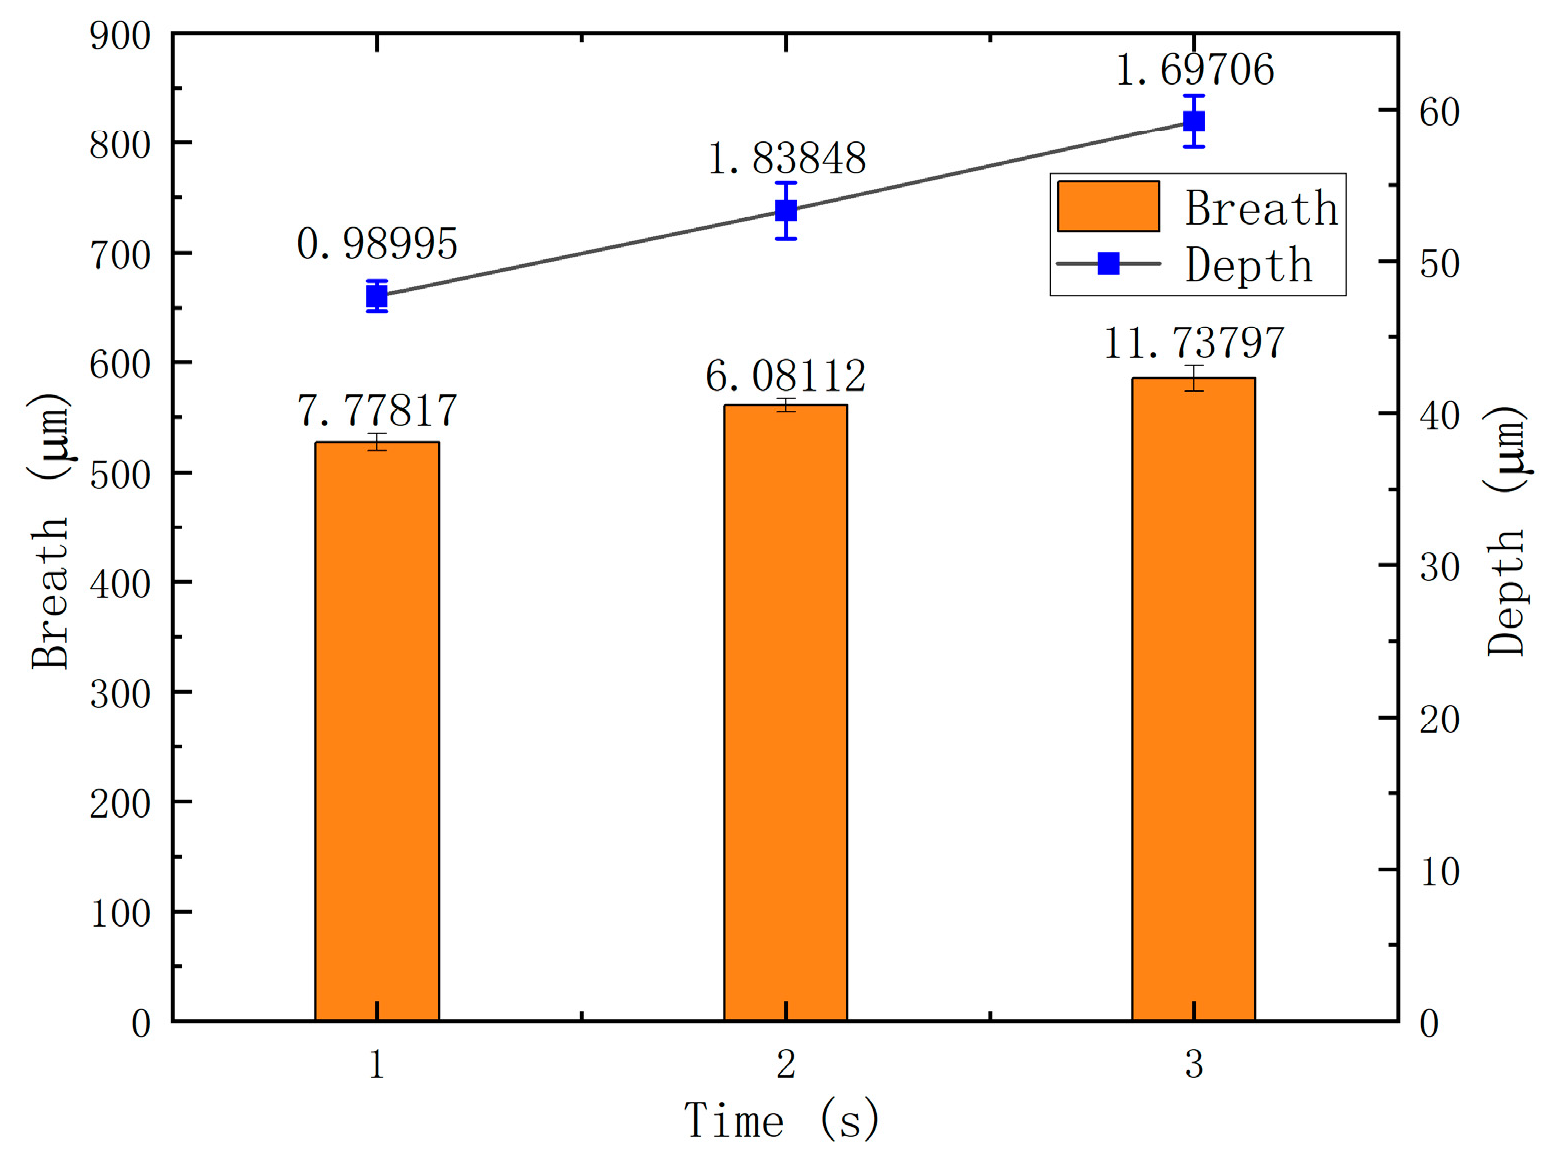
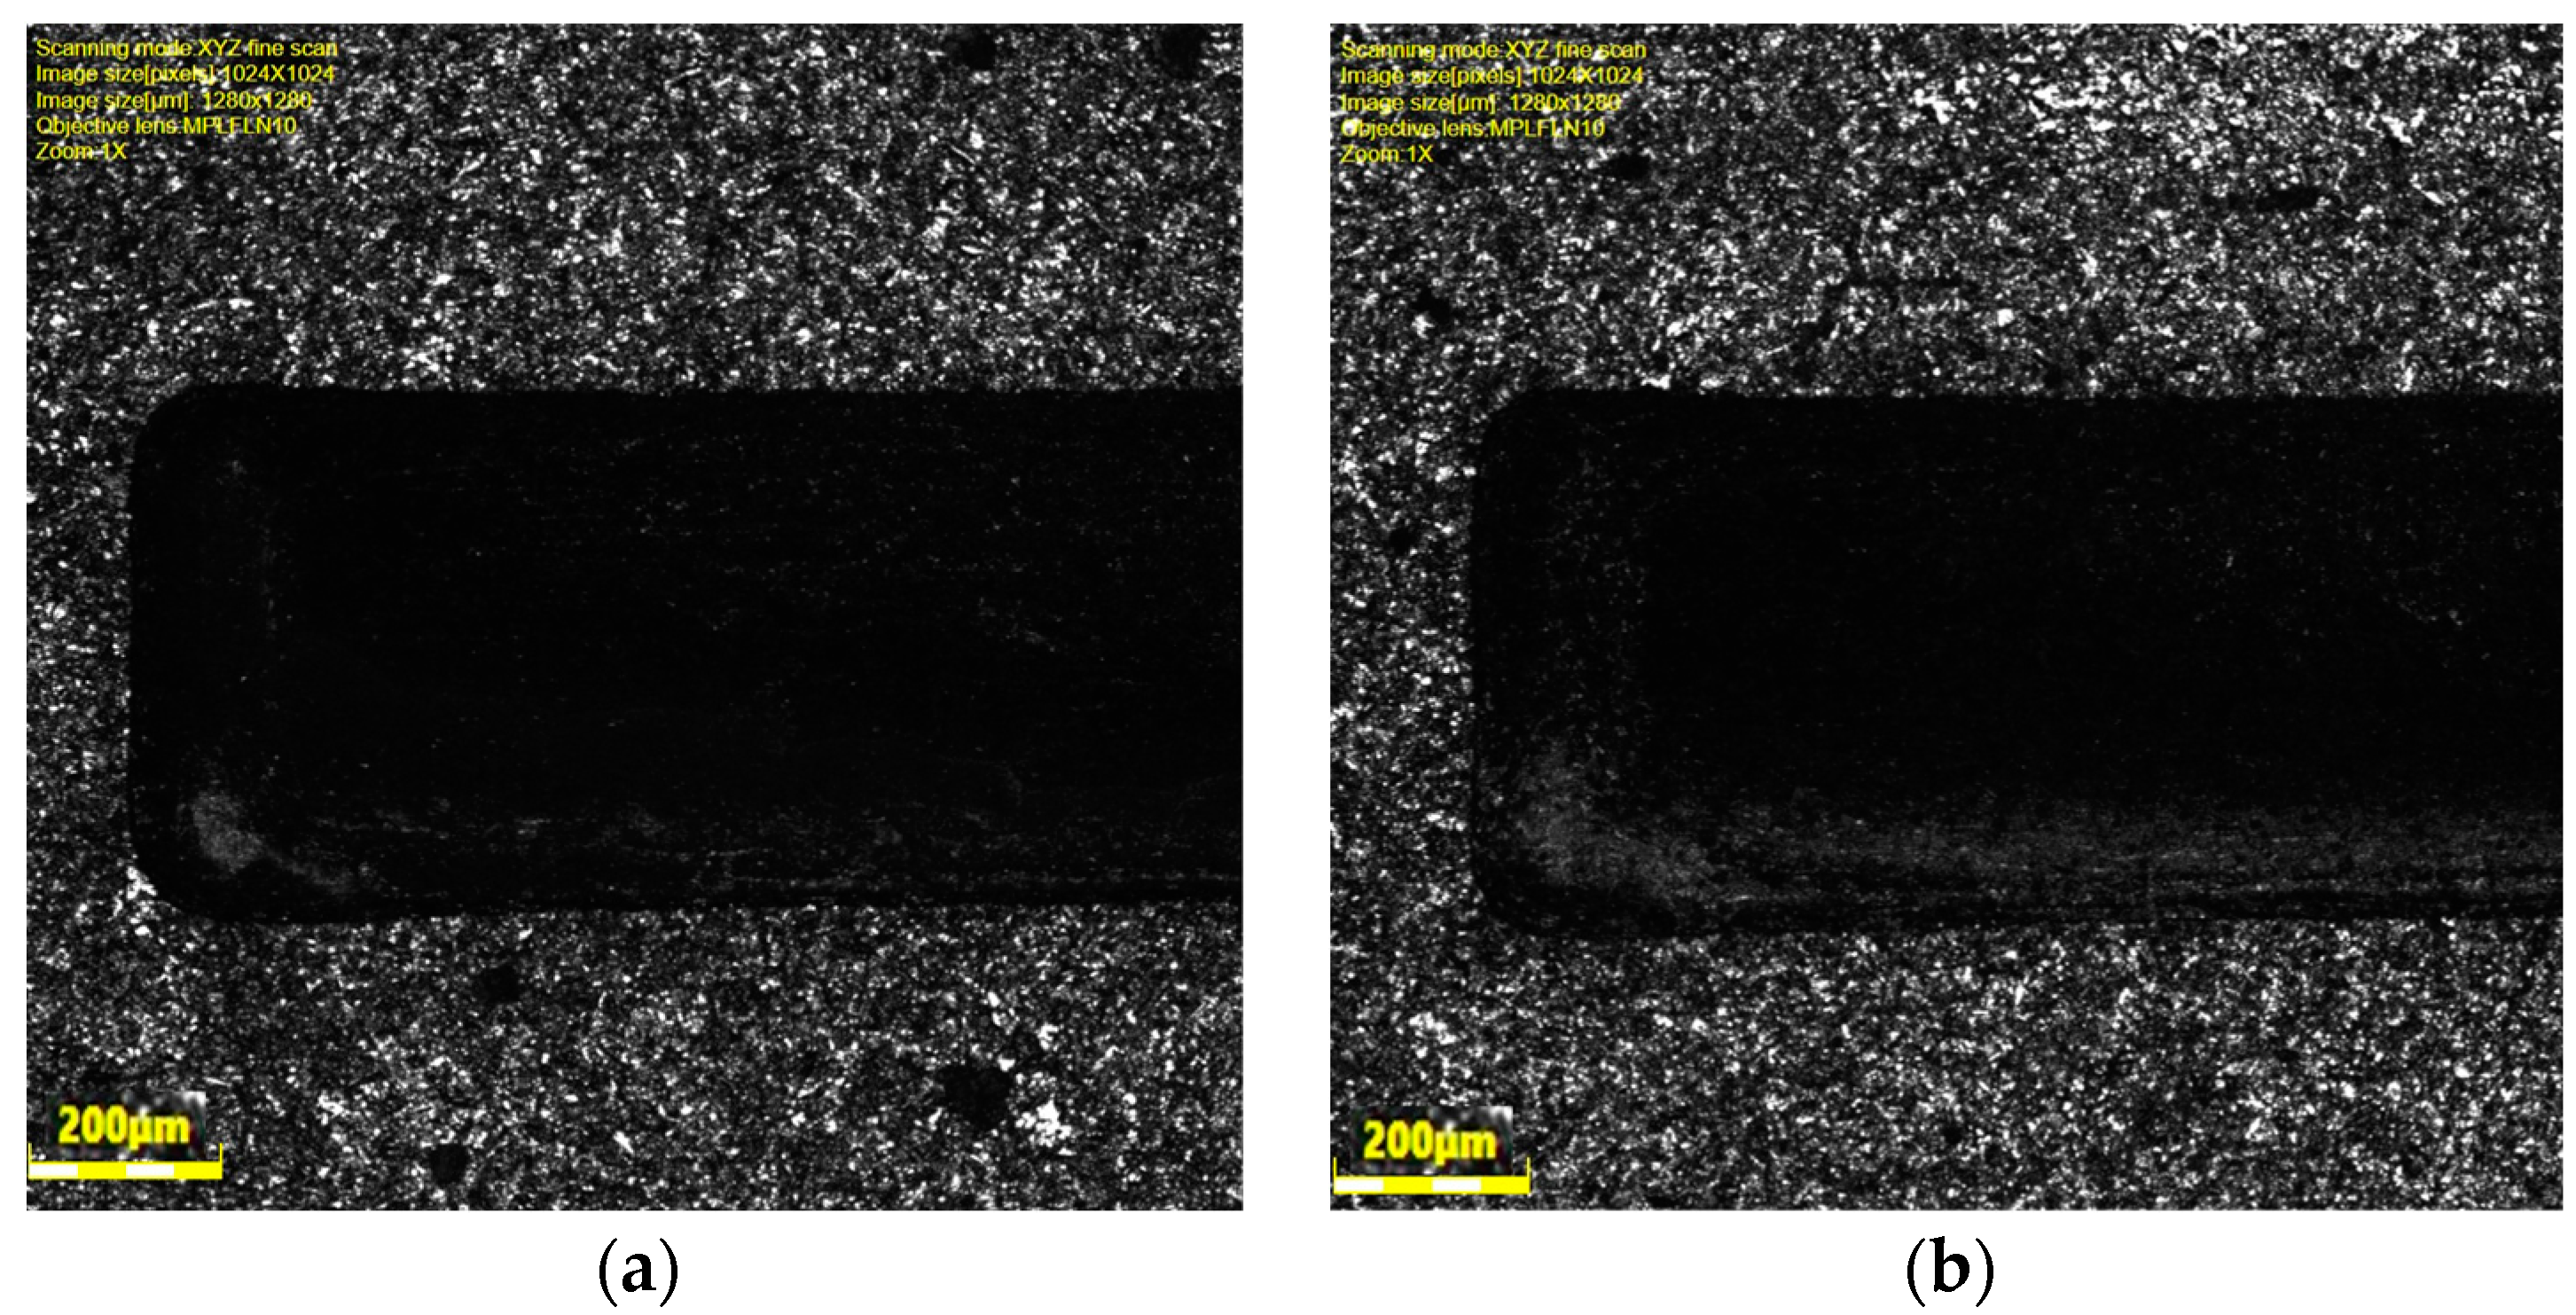
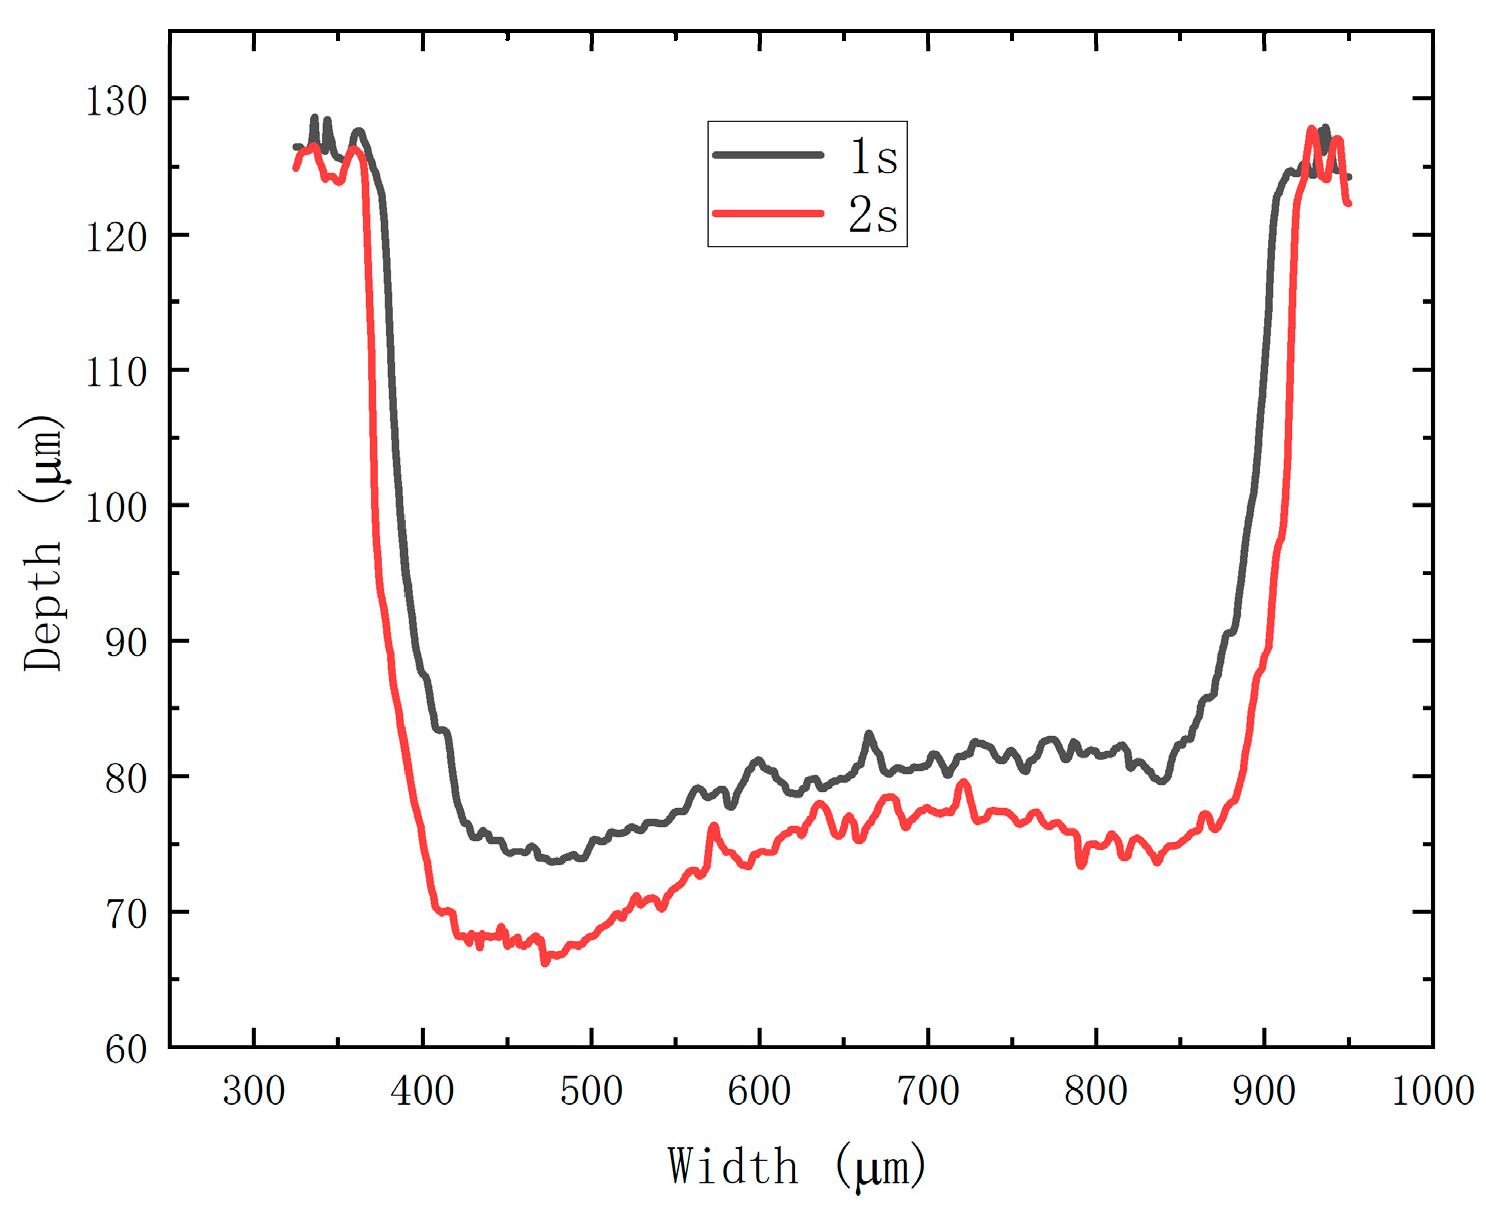
4.3. Effect of Machining Time on Microgroove Structure

The processing time is set to 1 s, 2 s, and 3 s; the processing gap is 1 mm; the diameter of the jet is 1 mm; the initial width of the mask is 500 μm, and the length is 5 mm; and the pulse voltage is 125 V. The width and depth of the microgroove corresponding to the different processing times are shown in Table 5.
The average width and depth corresponding to the above machining times were plotted as a relationship using Origin, as shown in Figure 15. The left vertical coordinate represents the width of the microgroove in the form of a bar graph, and the right vertical coordinate represents the depth of the microgroove in the form of a line graph.
As shown in Table 5 and Figure 15, the width and depth of the microgrooves gradually increase with the extension of the processing time and the material removal, and the average width of the microgrooves increases from 522 μm under 1 s to 593 μm under 3s, an increase of 13.6%. The average depth of microgrooves increases from 47 μm under 1 s to 58 μm under 3 s, an increase of 23.4%, and the width is constrained by the mask, which is more conducive to processing and shaping. The depth-to-width ratio of the microgroove increases from 0.090 under 1 s to 0.098 under 3 s, an increase of 8.8%, and the processing efficiency is greatly improved. However, if the processing time is too short, it will make the electrolytic processing effect not obvious, and it can even make the groove shape not clear, resulting in the groove not meeting the processing requirements.
The two-dimensional structure of the microgroove was analyzed using laser confocal microscopy, as shown in Figure 16.
As can be seen in Figure 16, the processing time changes, the microgroove shape is obvious, the rectangular replication accuracy changes little, and the mask effectively controls the processing shape. A schematic diagram of the microgroove cross-section measurement is drawn, as shown in Figure 17.
As can be seen from Figure 17, compared with 1 s, the depth of the microgroove under 2 s machining time increases significantly, the magnitude of lateral erosion increases, the degree of convexity and concavity of the bottom increases, the island effect increases, and the machining definiteness increases. Under 1 s, the island is close to disappearing, and the shorter the processing time, the smaller the width of the microgroove, and the shallower the processing depth, i.e., the machining domain reduces. As shown in Table 3, Table 4 and Table 5; and Figure 11, Figure 14 and Figure 17, with the electrolytic processing technology used in this experiment, the depth of the microgroove can reach more than 41 um, and the deterministic domain shape is good, compared with the literature [20], as it has a more obvious processing effect.

5. Conclusions

In this paper, we used jet electrolytic processing technology and conducted bionic marine animal surface microstructure experimental research, reaching the following conclusions:
(1)
Based on the COMSOL 6.2 software to construct the electric field simulation model of different processing parameters (pulse voltage, processing gap, and processing time), the results show that increasing the pulse voltage and reducing the processing gap can improve the electrolytic processing speed.
(2)
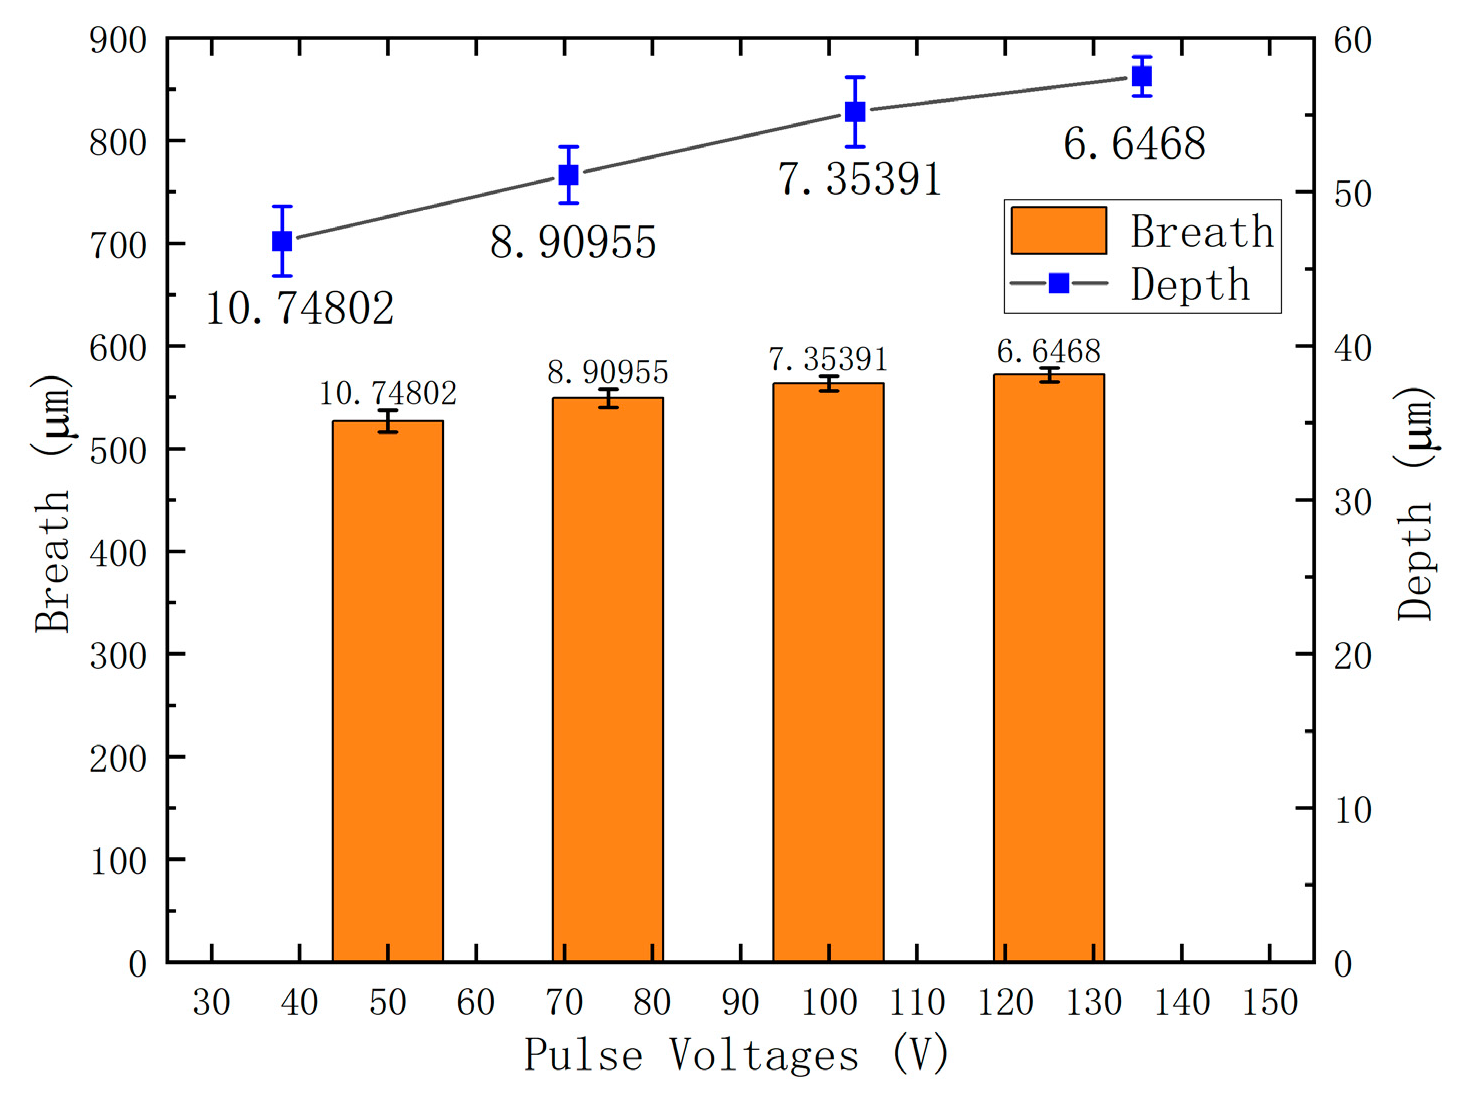
The contribution of 125 V pulse voltage to the depth of the microgroove is increased by 28.8%, and the contribution to the width is increased by 7.7% compared with that of 50 V. Reasonably increasing the pulse voltage can improve the microgroove replication accuracy and enhance the machining efficiency.
(3)
The contribution of the 1.5 mm machining gap to the microgroove depth decreases by 18.0%, and the contribution to the width decreases by 2.2% compared with 0.5 mm. It is concluded that by reducing the machining gap, the microgroove shape is well maintained, and the material removal rate is greatly improved.
(4)
The contribution of the 3 s machining time to the microgroove depth increased by 23.4%, and the contribution to the width increased by 13.6% compared with that of 1 s. By prolonging the processing time, the current efficiency can be effectively adjusted to achieve precise control of material removal, which is especially critical for fields such as the fabrication of microstructures on the surface of bionic marine animals.
Among the three machining parameters in this experiment, the parameter pulse voltage has the most significant effect on the machining effect, which determines the retention of the machined shape, the increase in the machining depth, and the material removal ability more than the machining gap and the machining time. This study has achieved some results, but there are still some limitations; the next stage of work will study the effect of different processing parameters on various types of mask processing.

Author Contributions

Conceptualization, C.C.; methodology, C.C.; software, C.C. and Z.Y.; validation, C.C. and X.S.; formal analysis, C.C. and Z.Y.; investigation, B.Z.; resources, C.C.; data curation, Z.X. and B.X.; writing—original draft preparation, C.C. and Z.Y.; writing—review and editing, C.C.; visualization, C.C.; supervision, Z.T.; project administration, Z.T.; funding acquisition, C.C. All authors have read and agreed to the published version of the manuscript.

Funding

This work was supported by the Foundation of Guangzhou Higher Education Quality and Reform Project (2023CJRHJD002), Key Research Platforms and Projects of Guangdong General Universities (No. 2023ZDZX2051), Guangdong Province Undergraduate Teaching Quality and Teaching Reform Project (Yue Jiao Gao Han [2024] No. 9), and Guangdong Provincial Natural Science Foundation (Youth Enhancement Project) 2024A1515030159.

Institutional Review Board Statement

Not applicable.

Informed Consent Statement

Not applicable.

Data Availability Statement

Data are contained within the article.

Conflicts of Interest

The authors declare no conflicts of interest.

References

  1. Yu, M.; Du, L.; Du, B.; Wang, F.; Zhang, C.; Li, D. Efficient evolution mechanism of electrolytic gas products from laser-assisted electrolyte jet machining. J. Mech. Work. Technol. 2024, 333. [Google Scholar] [CrossRef]
  2. Ding, H.; Chen, R.; Zhu, Y.; Shen, H.; Gao, Q. Effect of Frequency–Amplitude Parameter and Aspect Ratio on Propulsion Performance of Underwater Flapping-Foil. Biomimetics 2024, 9, 324. [Google Scholar] [CrossRef] [PubMed]
  3. Wang, H.; Xu, H.; Zhang, Y.; Chen, S.; Zhao, Z.; Chen, J. Design of a Bio-Inspired Anti-Erosion Structure for a Water Hydraulic Valve Core: An Experimental Study. Biomimetics 2019, 4, 63. [Google Scholar] [CrossRef] [PubMed]
  4. Li, Z.A. Research on Bionic Squid-inspired Robot for Underwater Monitorization and Preservation of Coral Reefs. In Proceedings of the 2023 IEEE International Conference on Sensors, Electronics and Computer Engineering (ICSECE), Jinzhou, China, 18–20 August 2023; pp. 844–851. [Google Scholar]
  5. Li, Y.; Xu, P.; Liu, B.; Liu, J.; Guo, L.; Meng, Z.; Xu, M. An Underwater Bionic Palm-Like Tactile Sensor Based on Triboelectric Nanogenerator. In Proceedings of the 2023 China Automation Congress (CAC), Chongqing, China, 17–19 November 2023; pp. 6241–6246. [Google Scholar]
  6. Li, A.; Guo, S.; Li, C. An Artificial Lateral Line-Based Active Obstacle Recognition Strategy and Performance Evaluation for Bionic Underwater Robots. IEEE Sensors J. 2024, 24, 26266–26277. [Google Scholar] [CrossRef]
  7. Wu, X.; Huang, J.; Wang, L. Pose Estimation-Based Visual Perception System for Analyzing Fish Swimming. IEEE Sensors J. 2024, 24, 13293–13303. [Google Scholar] [CrossRef]
  8. Wu, Z.; Yu, L.; Wang, J.; Dai, S.; Tan, M.; Yu, J. Hitch-Hiking Motion of Multiple Bionic Robotic Remoras With Enhanced Multimodal Locomotion. IEEE/ASME Trans. Mechatronics 2024, 1–12. [Google Scholar] [CrossRef]
  9. Du, R.; Li, Z.; Youcef-Toumi, K.; Alvarado, P.V. Robot Fish: Bio-inspired Fishlike Underwater Robots, 1st ed.; Springer Berlin: Heidelberg, Germany, 2015; pp. 143–145. [Google Scholar]
  10. Soltani-Kordshuli, F.; Miller, C.; Harris, N.; Zou, M. Laser Surface Texturing of Both Thin Polytetrafluoroethylene Coatings and Stainless Steel Substrates for Improving Tribological Properties. Polym. Test. 2023, 117, 107852. [Google Scholar] [CrossRef]
  11. Lv, X.; Xu, Z.; Liu, Y.; Wang, X.; Xie, S.; Xu, L.; Tan, H. Study on Liquid-Phase-Assisted Laser Surface Microtexturing and the Surface Properties of 304 Stainless Steel. J. Mater. Eng. Perform. 2023, 1–13. [Google Scholar] [CrossRef]
  12. Budakli, M.; Arik, M. Saturated and Superheated Water Vapor Condensation on a Custom Micro-Textured Surface. In Proceedings of the 2023 22nd IEEE Intersociety Conference on Thermal and Thermomechanical Phenomena in Electronic Systems (ITherm), Istanbul, Turkey, 26–29 June 2023; pp. 1–6. [Google Scholar]
  13. Qing, J.; Navarro-Cía, M. Analysis of the Capacity and Energy Efficiency of Metallodielectric Surface Wave Links Operating Beyond Y Band. In Proceedings of the 2024 18th European Conference on Antennas and Propagation (EuCAP), Glasgow, UK, 17–22 March 2024; pp. 1–3. [Google Scholar]
  14. Sun, Y.; Han, F.; Zhang, D.; Zhao, X.; Ye, D. An Underwater Soft Claw Based on Bionic Principle. In Proceedings of the 2021 IEEE International Conference on Robotics and Biomimetics (ROBIO), Sanya, China, 27–31 December 2021; pp. 973–977. [Google Scholar]
  15. Ionescu, O.; Cernica, I.V.; Manea, E.; Purica, M.; Corneliu, P.C.; Paun, C.; Alina, P. Microtextured photovoltaic cells system for UAVs autonomy extension. In Proceedings of the 2021 International Semiconductor Conference (CAS), Bucharest, Romania, 8–12 October 2021; pp. 99–102. [Google Scholar]
  16. Westgate, T.M.; Boivin, A.B.; Veerman, B.W.; Born, B.; Todd, G.; Holzman, J.F. A Corner-Cube-Cell Solar Array for Improved Capture of Optical Power and Increased Generation of Electrical Power. IEEE J. Photovoltaics 2021, 12, 344–352. [Google Scholar] [CrossRef]
  17. Chen, C.; Wu, S.; Zhang, T.; Wang, Y.; Shao, X.; Mo, F. Experimental Study of Electrolytic Processing of Discharge-Assisted Jet Masks. Coatings 2023, 13, 1280. [Google Scholar] [CrossRef]
  18. Chen, C.; Wu, S.; Wu, H.; Shan, L.; Li, K.; Wu, S. Discharge Characteristics and Mechanisms of Electrolytic Discharge Processing by Jet Mask. Coatings 2023, 13, 1933. [Google Scholar] [CrossRef]
  19. Chen, C.; Shao, X.; Guo, J.; Yu, Z.; Chen, Z.; Lu, X.; Jiang, Z. An Experimental Study Based on Surface Microtexture of Medical Devices. Coatings 2024, 14, 888. [Google Scholar] [CrossRef]
  20. Chen, X.L.; Dong, B.Y.; Fan, G.C.; Zhang, C.Y.; Liu, J.W.; Zhang, Y.J.; Guo, Z.N. Investigation on modified jet electrochemical machining of micro-channel. Int. J. Adv. Manuf. Technol. 2019, 104, 4433–4443. [Google Scholar] [CrossRef]
  21. Cui, Y.; Wang, F.; Hu, Q.; Zhang, W. Study on Antifatigue Crack Growth Characteristics of Ball-End Milling Bionic Surface. Coatings 2022, 12, 327. [Google Scholar] [CrossRef]
  22. Liu, W.; Luo, Y.; Zhao, Y.; Zhou, H.; Ao, S.; Li, Y. Electrochemical Jet Machining of Surface Texture: Improving the Strength of Hot-Pressure-Welded AA6061-CF/PA66 Joints. J. Compos. Sci. 2024, 8, 263. [Google Scholar] [CrossRef]
  23. Wu, M.; Guo, Z.; Qian, J.; Reynaerts, D. Multi-Ion-Based Modelling and Experimental Investigations on Consistent and High-Throughput Generation of a Micro Cavity Array by Mask Electrolyte Jet Machining. Micromachines 2022, 13, 2165. [Google Scholar] [CrossRef] [PubMed]
  24. Ge, Z.; Hu, Q.; Zhu, H.; Zhu, Y. Surface Tribological Properties Enhancement Using Multivariate Linear Regression Optimization of Surface Micro-Texture. Coatings 2024, 14, 1258. [Google Scholar] [CrossRef]
  25. Niu, S.; Wang, H.; Ming, P.; Qin, G.; Ren, L.; Liu, H.; Li, X. Electrochemical Properties and Jet Electrochemical Micromilling of (TiB+TiC)/Ti6Al4V Composites in NaCl+NaNO3 Mixed Electrolyte. Materials 2024, 17. [Google Scholar] [CrossRef] [PubMed]
  26. Wang, X.; Xu, P.; Liu, J.; Wang, T.; Wang, S.; Guan, T.; Liu, X.; Chen, T.; Zheng, J.; Tao, J.; et al. Bio-inspired Coral-like Sensor Aiming at Ocean Wave Monitoring. In Proceedings of the 2021 China Automation Congress (CAC)., Kunming, China, 11–13 August 2021; pp. 908–912. [Google Scholar]
  27. Bao, H.; Liu, H.; He, J.; An, X.; Hou, S.; Song, M. Surface Damping Bionic Design of a Small Underwater Cruising Robot. Mech. Des. 2023, 40, 149–156. [Google Scholar] [CrossRef]
Figure 1. Schematic diagram of the calculation of the material removal rate of microgroove.
Coatings 14 01606 g001
Figure 2. Physical diagram of the experimental device for jet electrolytic processing.
Coatings 14 01606 g002
Figure 3. Schematic diagram of mask jet electrolytic processing.
Coatings 14 01606 g003
Figure 4. Masked artifact diagram. (a) Dimensional drawing of slot mask processing. (b) Display of micro-groove workpiece diagram.
Coatings 14 01606 g004
Figure 5. Enlarged view of simulation model meshing. (a) Simulation model body meshing. (b) Local meshing of the simulation model.
Coatings 14 01606 g005
Figure 6. The plot of electrolyte potential changes at different pulse voltages and current density line comparison: (a) 50 V, (b) 75 V, (c) 100 V, and (d) 125 V.
Coatings 14 01606 g006aCoatings 14 01606 g006b
Figure 7. The plot of electrolyte potential change and current density line comparison at different processing gaps: (a) 0.5 mm, (b) 1 mm, (c) 1.5 mm, and (d) 2 mm.
Coatings 14 01606 g007
Figure 8. Current density line graph.
Coatings 14 01606 g008
Figure 9. Comparison of microgroove dimensions at different pulse voltages.
Coatings 14 01606 g009
Figure 10. Comparison of the 2D profile of microgroove: (a) 75 V and (b) 100 V.
Coatings 14 01606 g010
Figure 11. Cross-section of microgroove.
Coatings 14 01606 g011
Figure 12. Comparison of microgroove dimensions with different machining gaps.
Coatings 14 01606 g012
Figure 13. Comparison of the 2D profile of microgroove: (a) 0.5 mm and (b) 1 mm.
Coatings 14 01606 g013
Figure 14. Cross-sectional view of microgrooves.
Coatings 14 01606 g014
Figure 15. Comparison of microgroove dimensions at different machining times.
Coatings 14 01606 g015
Figure 16. Comparison of the 2D profile of microgroove: (a) 1 s and (b) 2 s.
Coatings 14 01606 g016
Figure 17. Cross-sectional view of microgroove.
Coatings 14 01606 g017
Table 1. Main parameters of the jet mask electrolytic processing experimental equipment.
NameDescriptionUnit
X/Y/Z-axis positioning accuracy5μm
Z travel 300mm
X/Y travel 200 × 200mm
External dimensions1000 × 750 × 2230mm
Control system softwareLabVIEW 2024 Q1
Table 2. Simulation parameters.
Parameter NameNumerical ValuesUnit
Machining clearance0.5, 1, 1.5, 2Mm
Pulse voltages50, 75, 100, 125V
Jet diameter1, 1.5, 2Mm
Mask diameter500Μm
Mask thickness60Μm
Stainless steel molar quality54.94g/mol
Density of stainless steel7.77g/cm3
Conductivity7.00S/m
Faraday’s constant96,486C/mol
Electrochemical equivalent2.1 × 10−3cm3(A·min)
Number of electrons in solution2.7Pcs
Processing time1, 2, 3, 4S
Table 3. Average values of width and depth of microgrooves at different pulse voltages.
Pulse Voltage (V)5075100125
Breath (μm)532552565573
Depth (μm)45495358
Table 4. Mean values of width and depth of microgrooves at different machining gaps.
Machining Gap (mm)0.511.5
Breath (μm)573565560
Depth (μm)504641
Table 5. Mean values of microgroove width and depth for different processing times.
Processing Times (s)123
Breath (μm)522565593
Depth (μm)475258
Disclaimer/Publisher’s Note: The statements, opinions and data contained in all publications are solely those of the individual author(s) and contributor(s) and not of MDPI and/or the editor(s). MDPI and/or the editor(s) disclaim responsibility for any injury to people or property resulting from any ideas, methods, instructions or products referred to in the content.

