Residual Stresses of 316L Stainless Steel Laser Direct Metal During Pulsed-Wave and Continuous-Wave Laser Additive Manufacturing: A Comparative Study

 ,
,
Abstract
1. Introduction
2. Materials and Methods
2.1. Materials and Samples
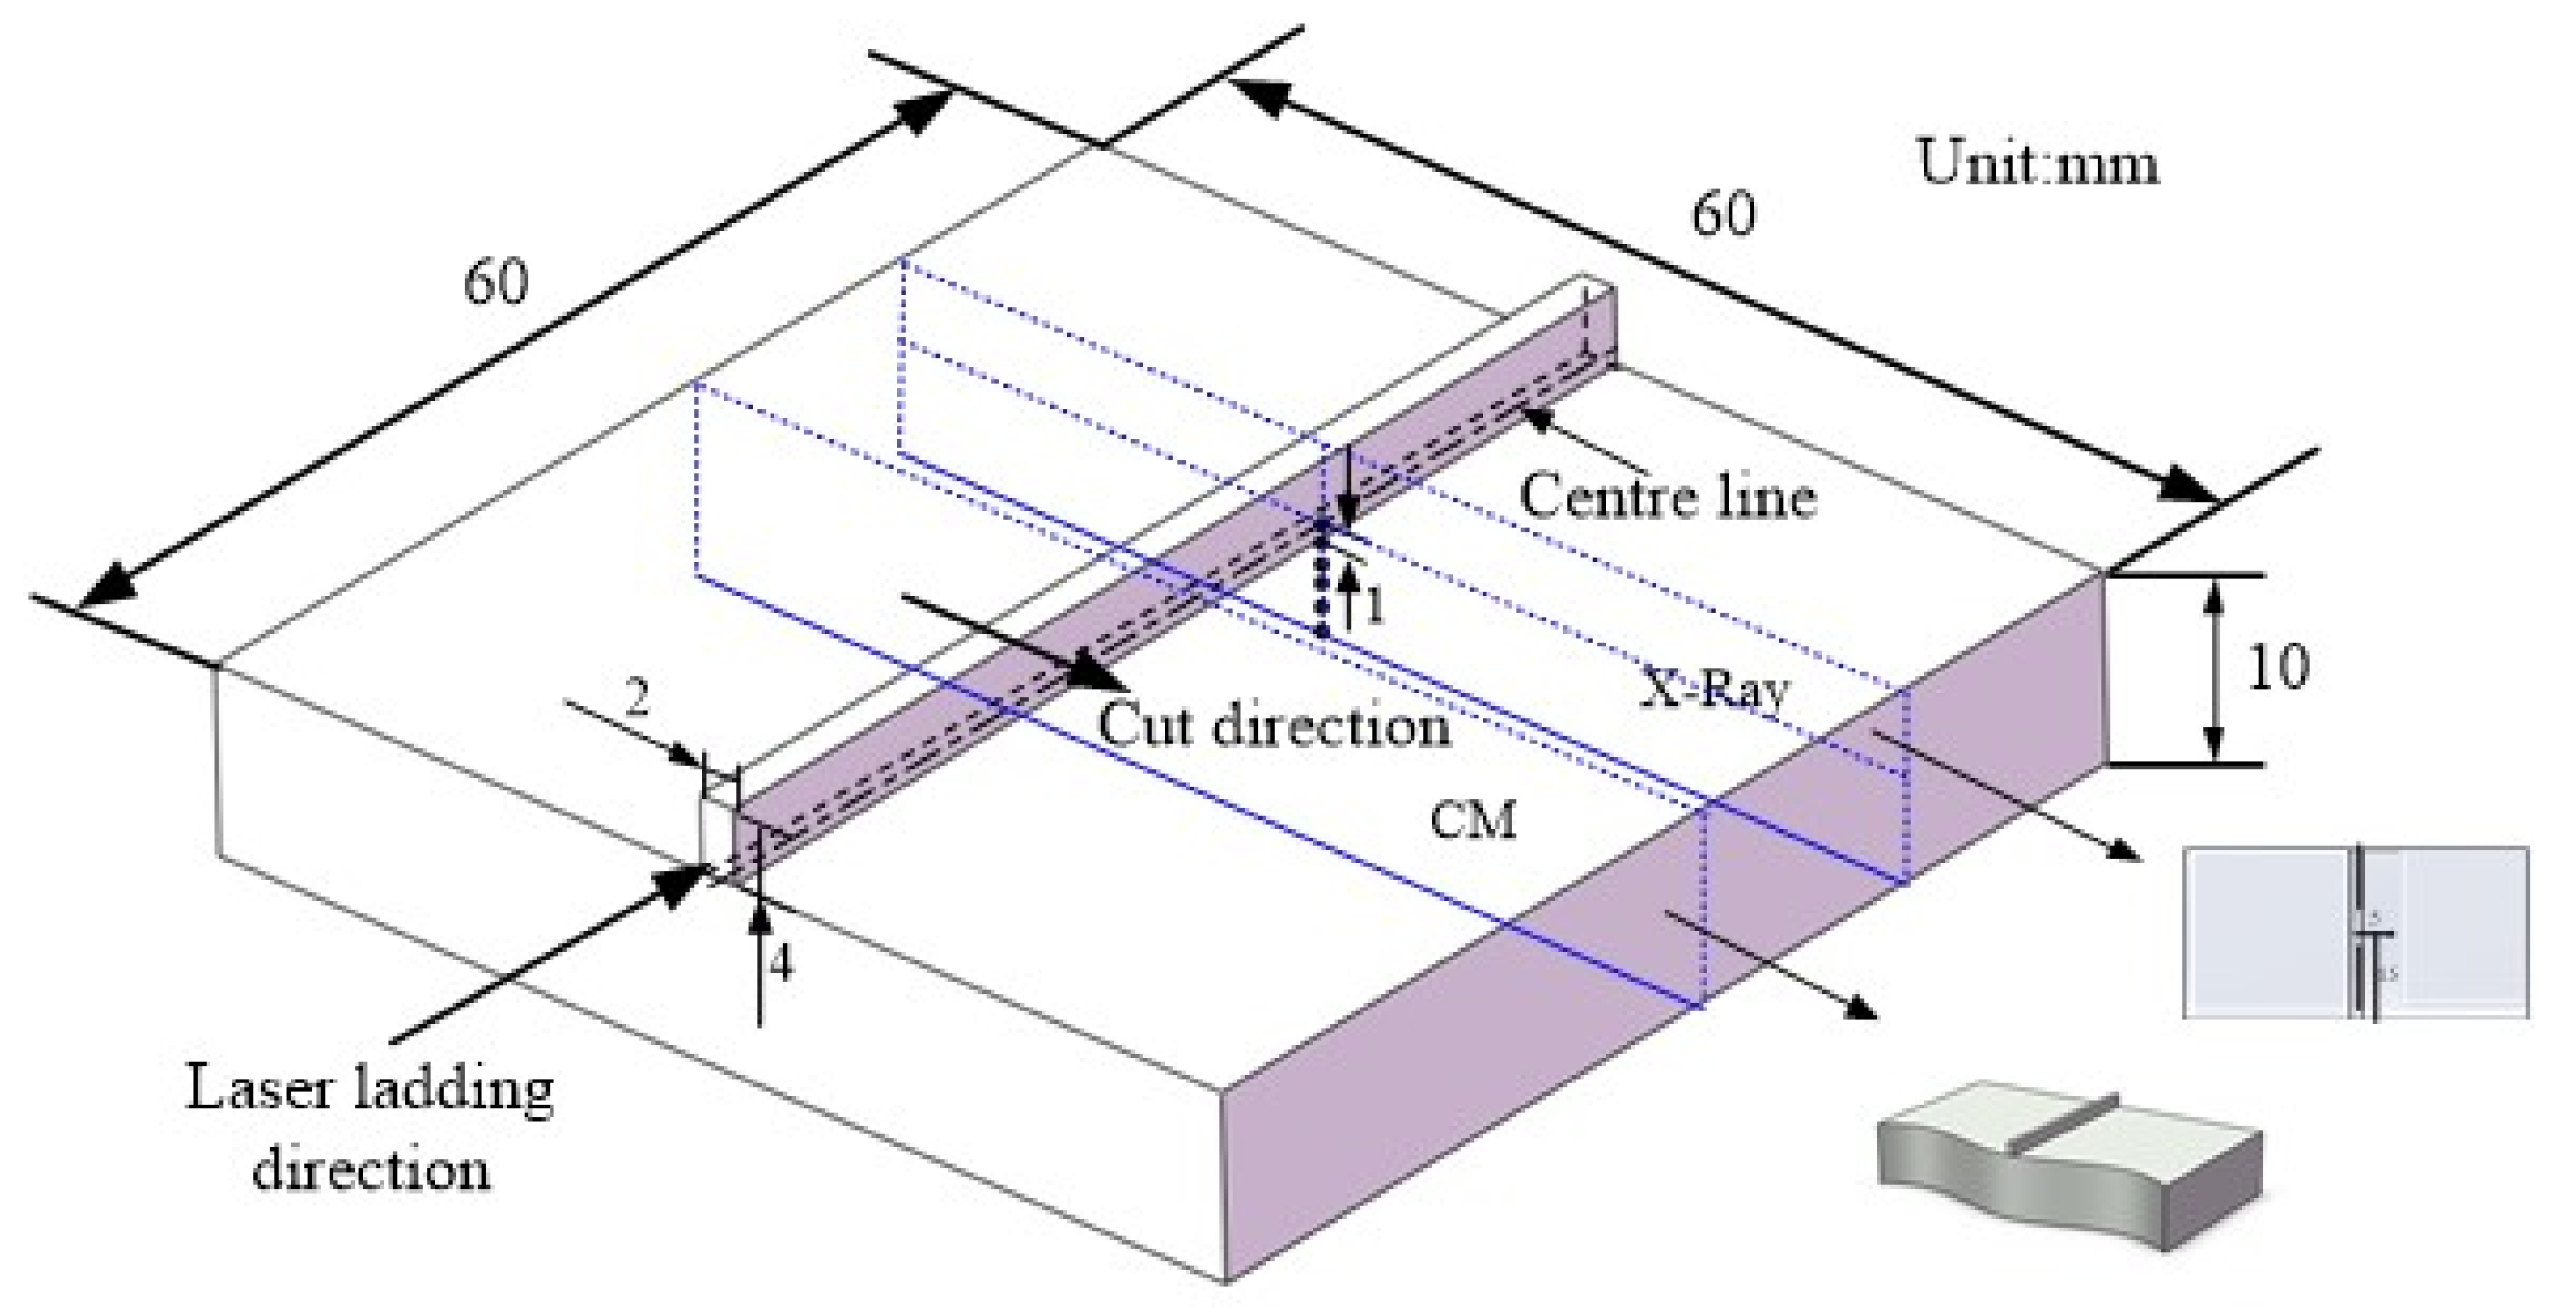
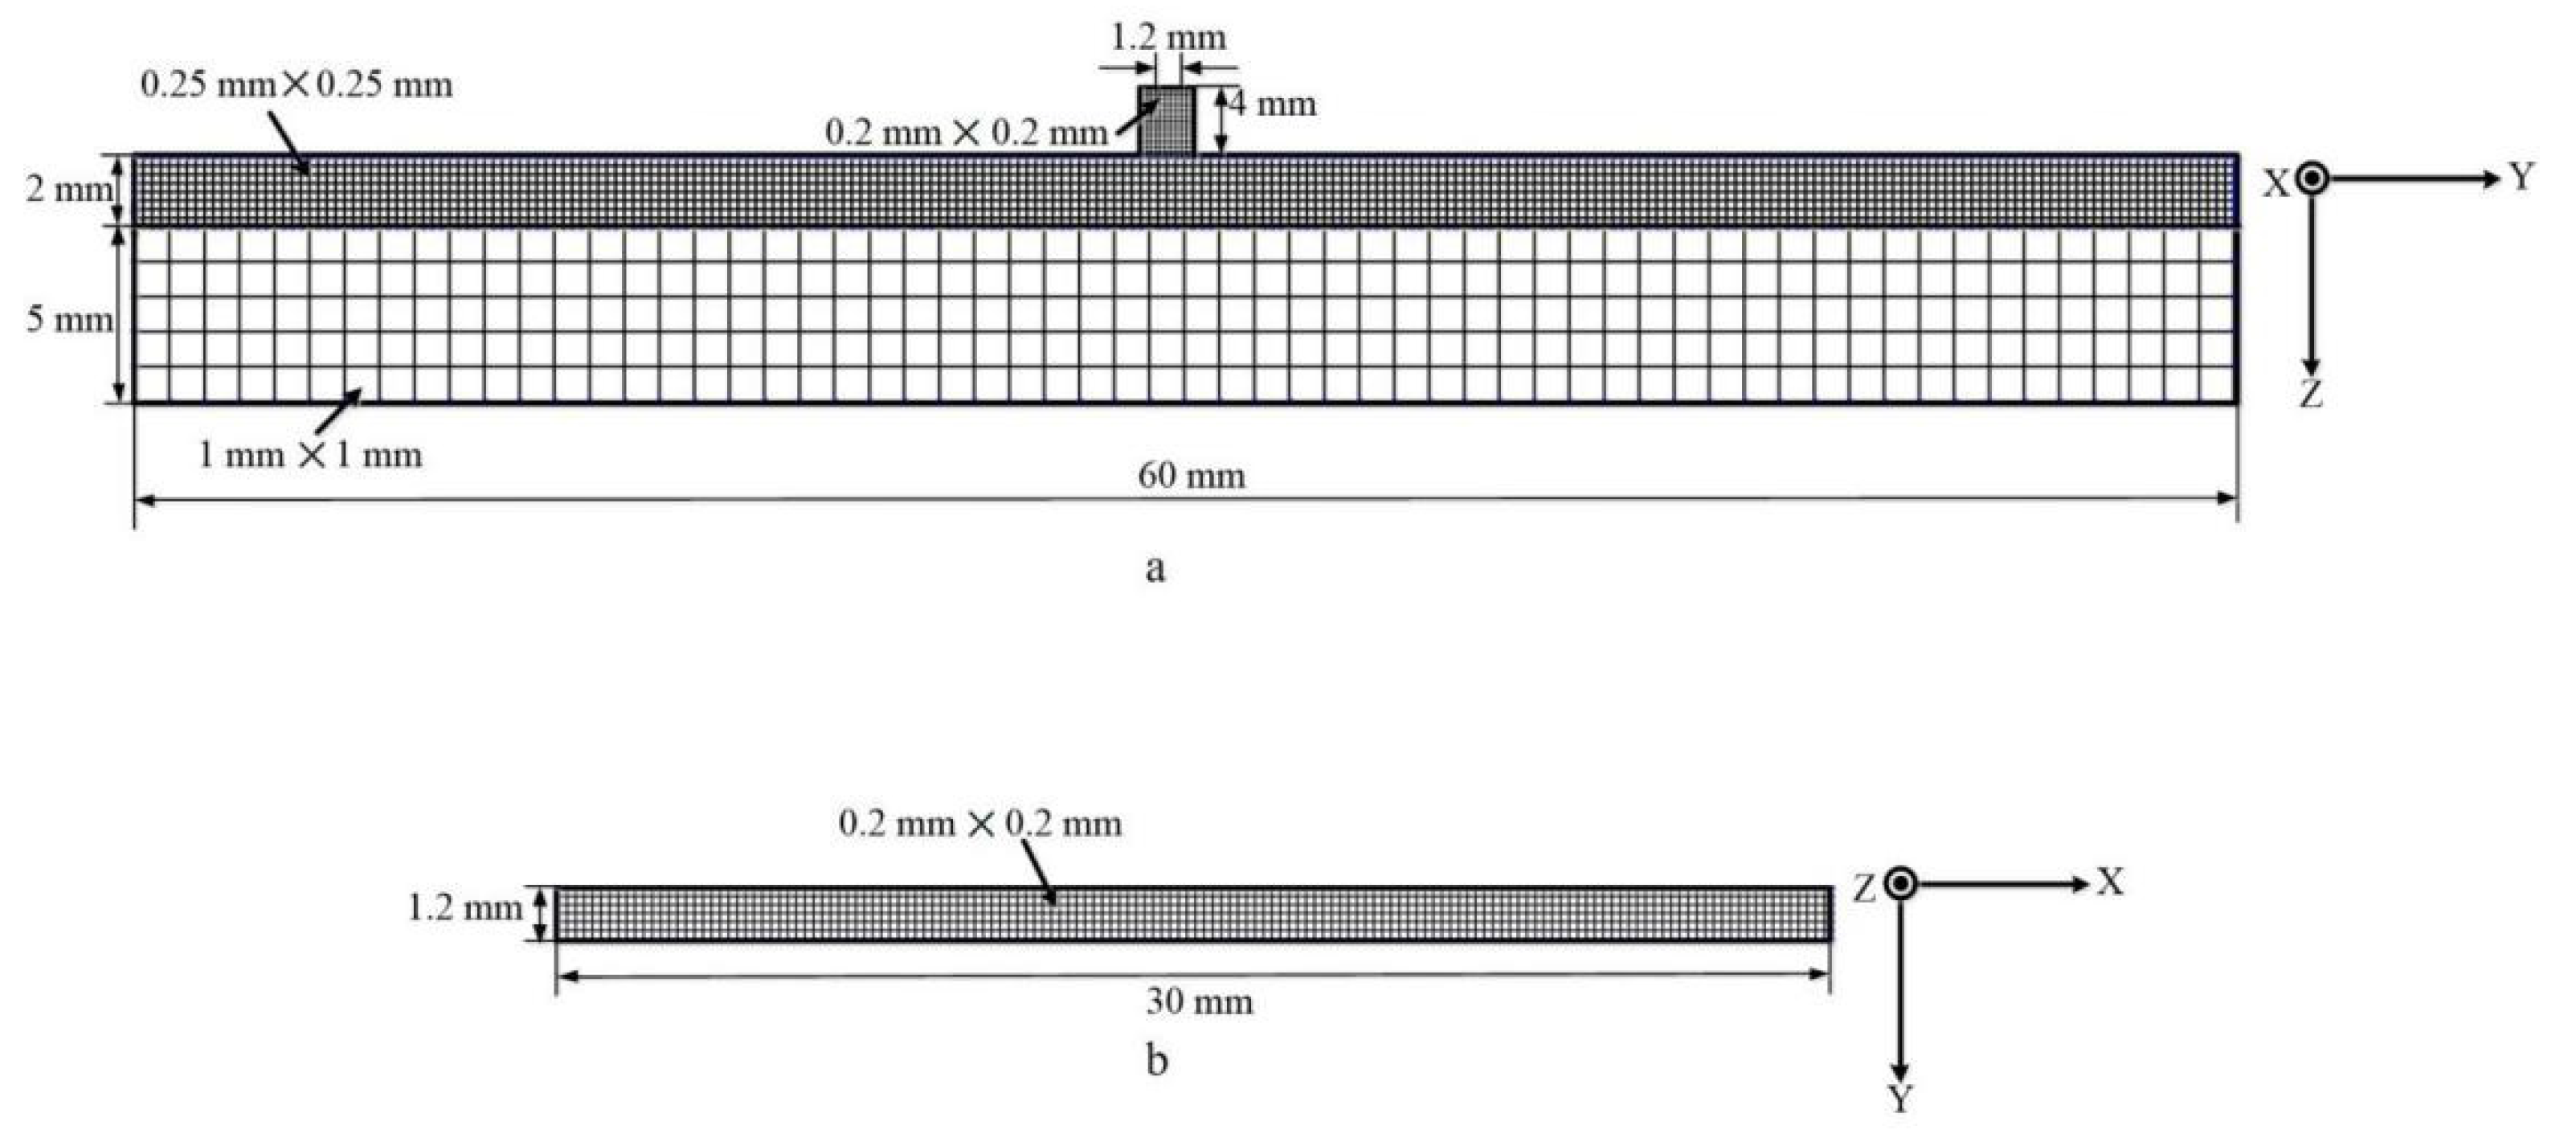
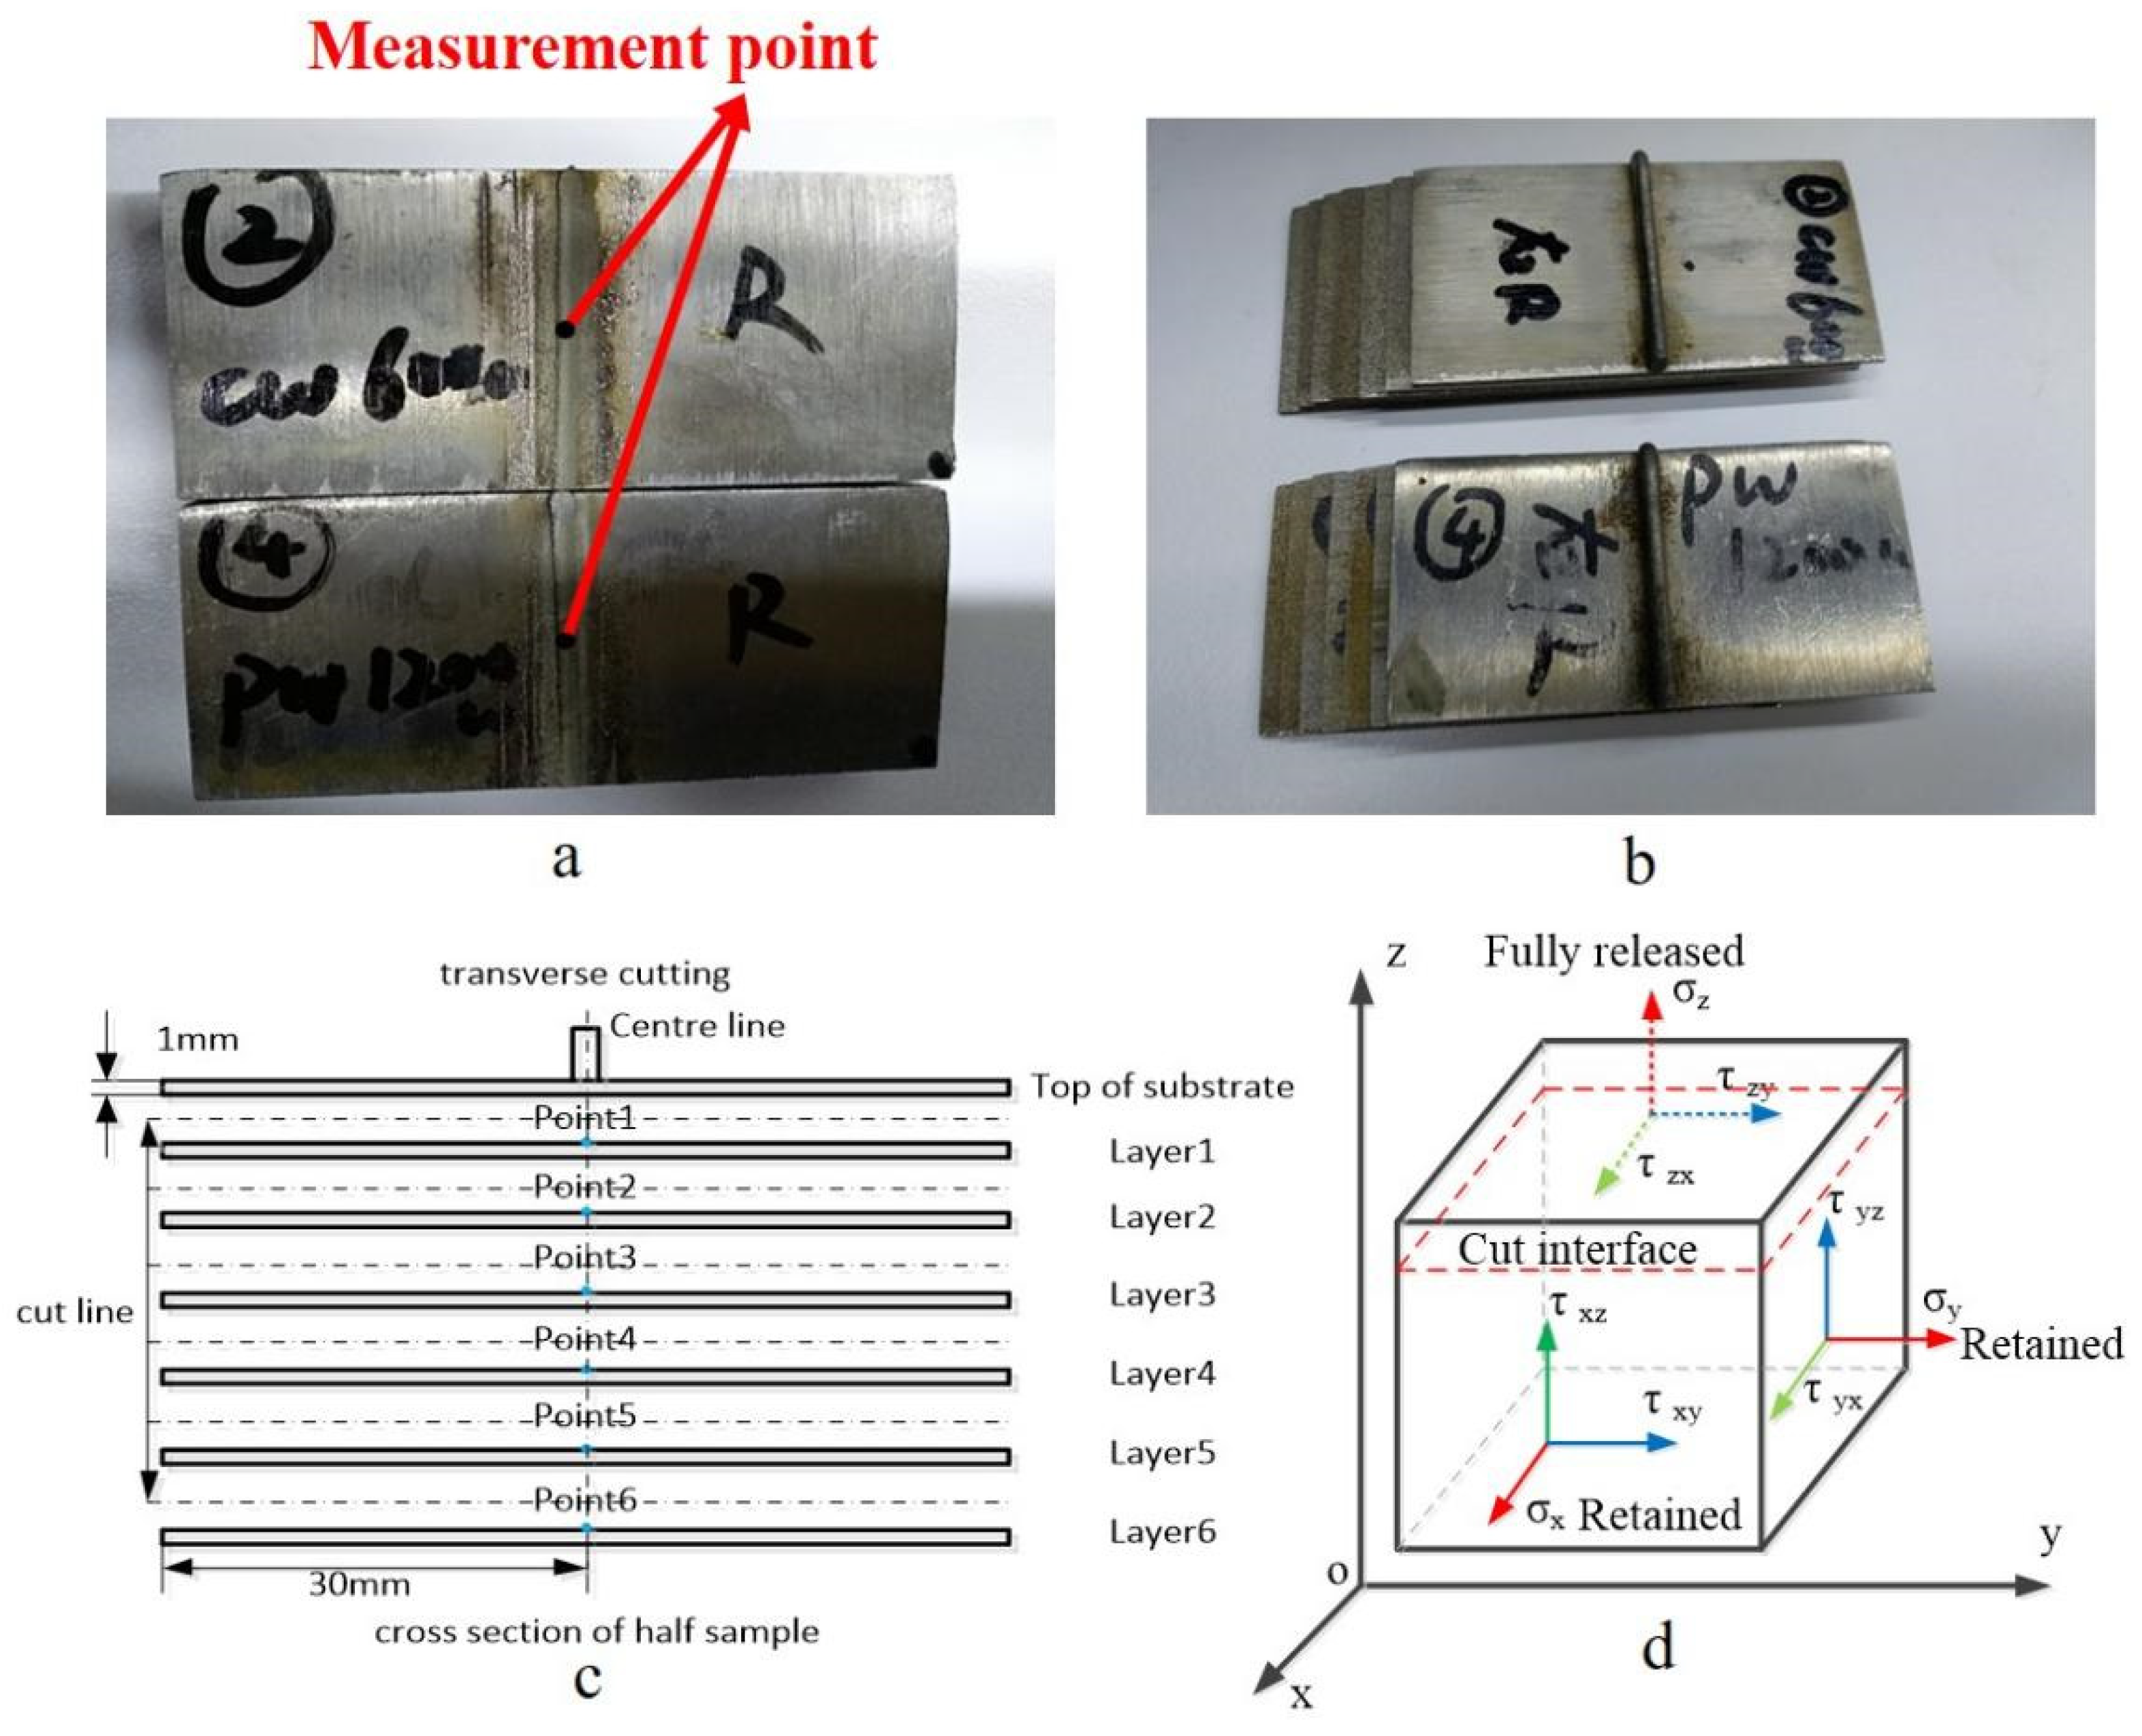
2.2. Residual Stress Measurement
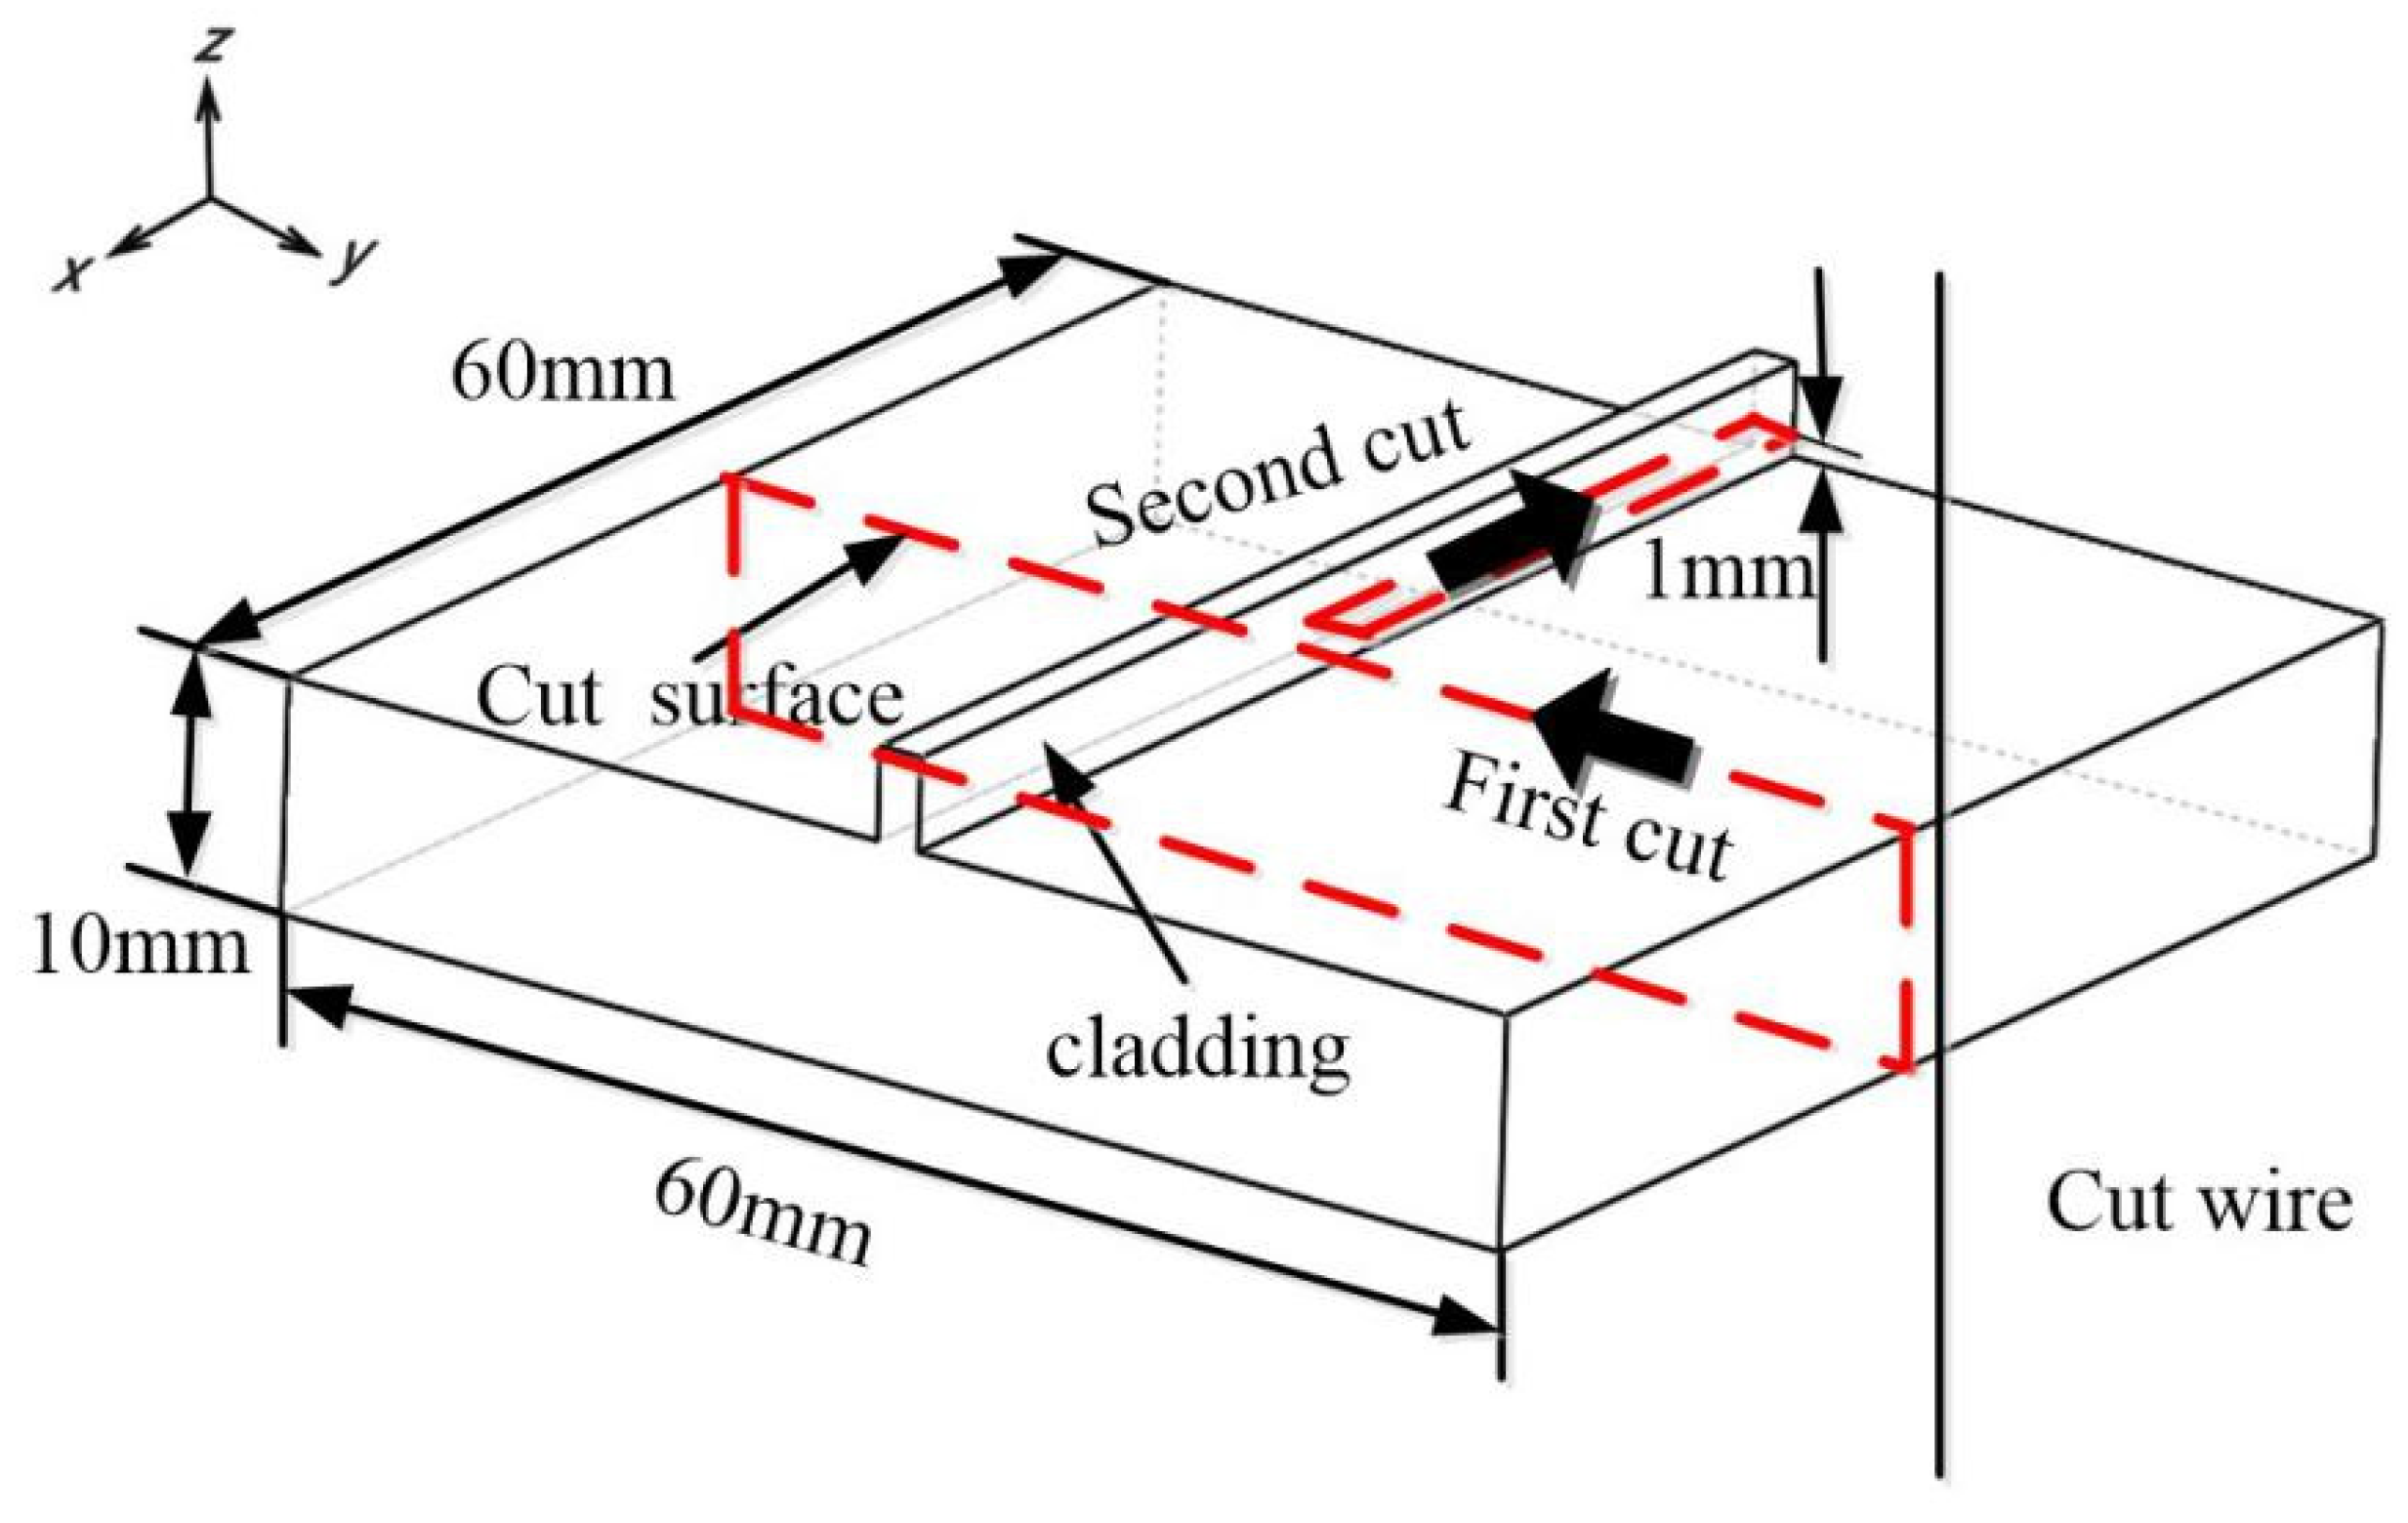
Contour Method
- (1)
- Making the cut
- (2)
- Measuring the Surface
- (3)
- Calculating Stress
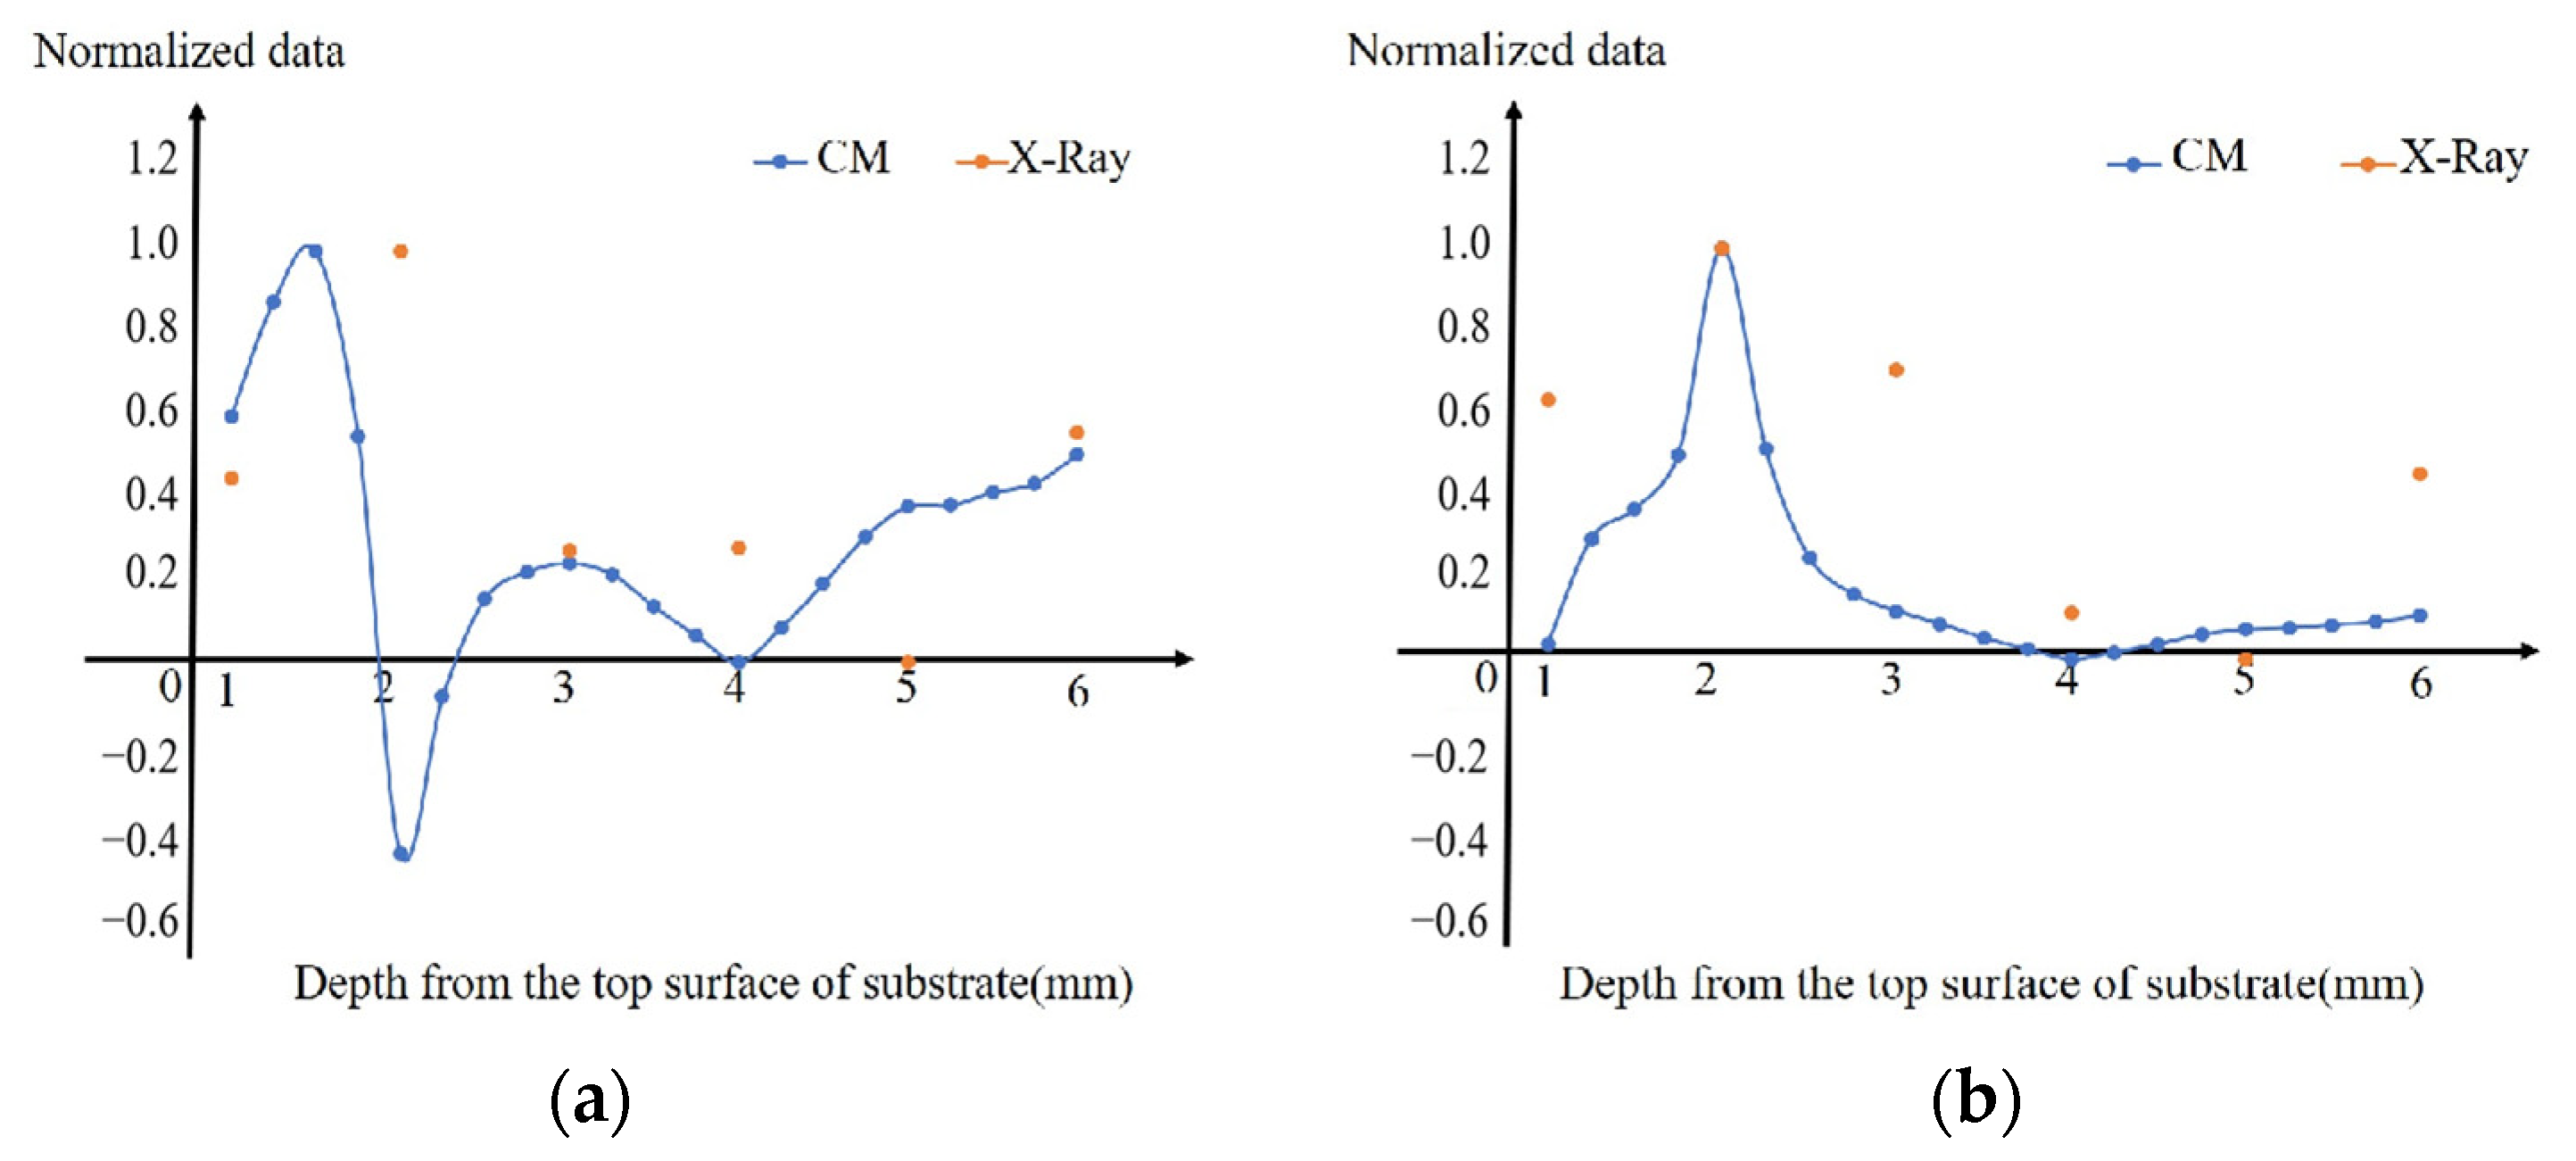
2.3. X-Ray Diffraction
3. Results
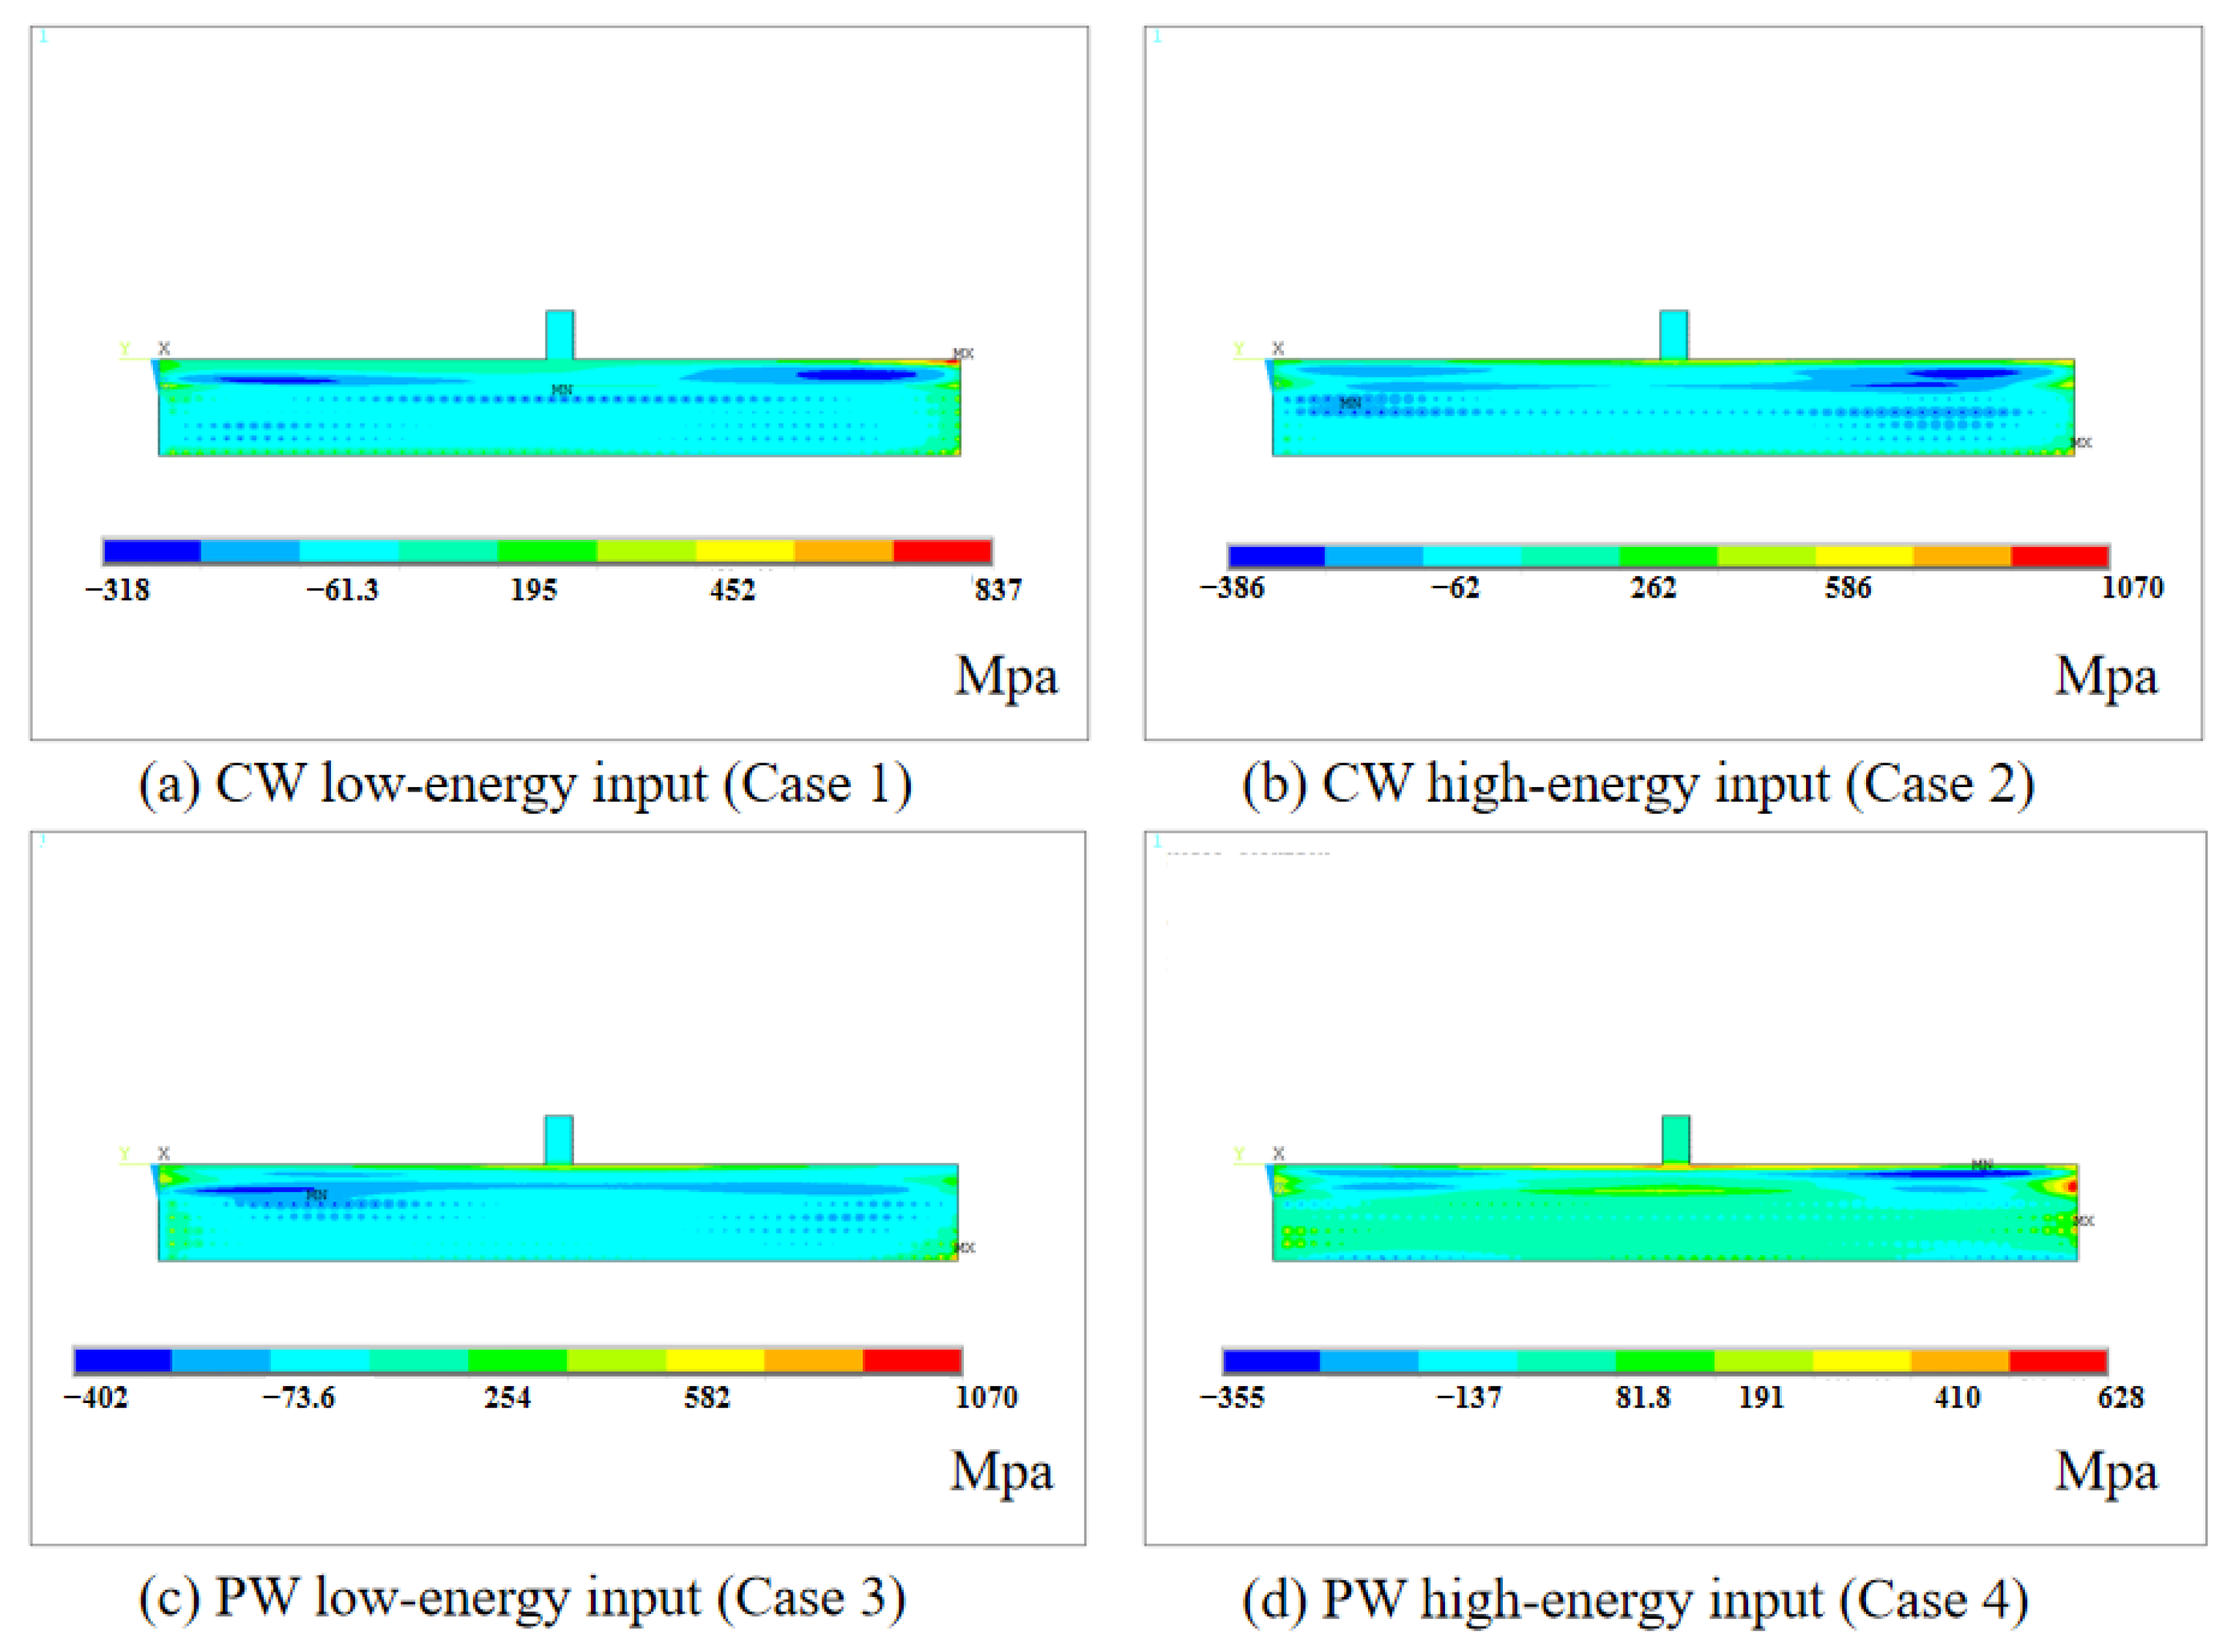
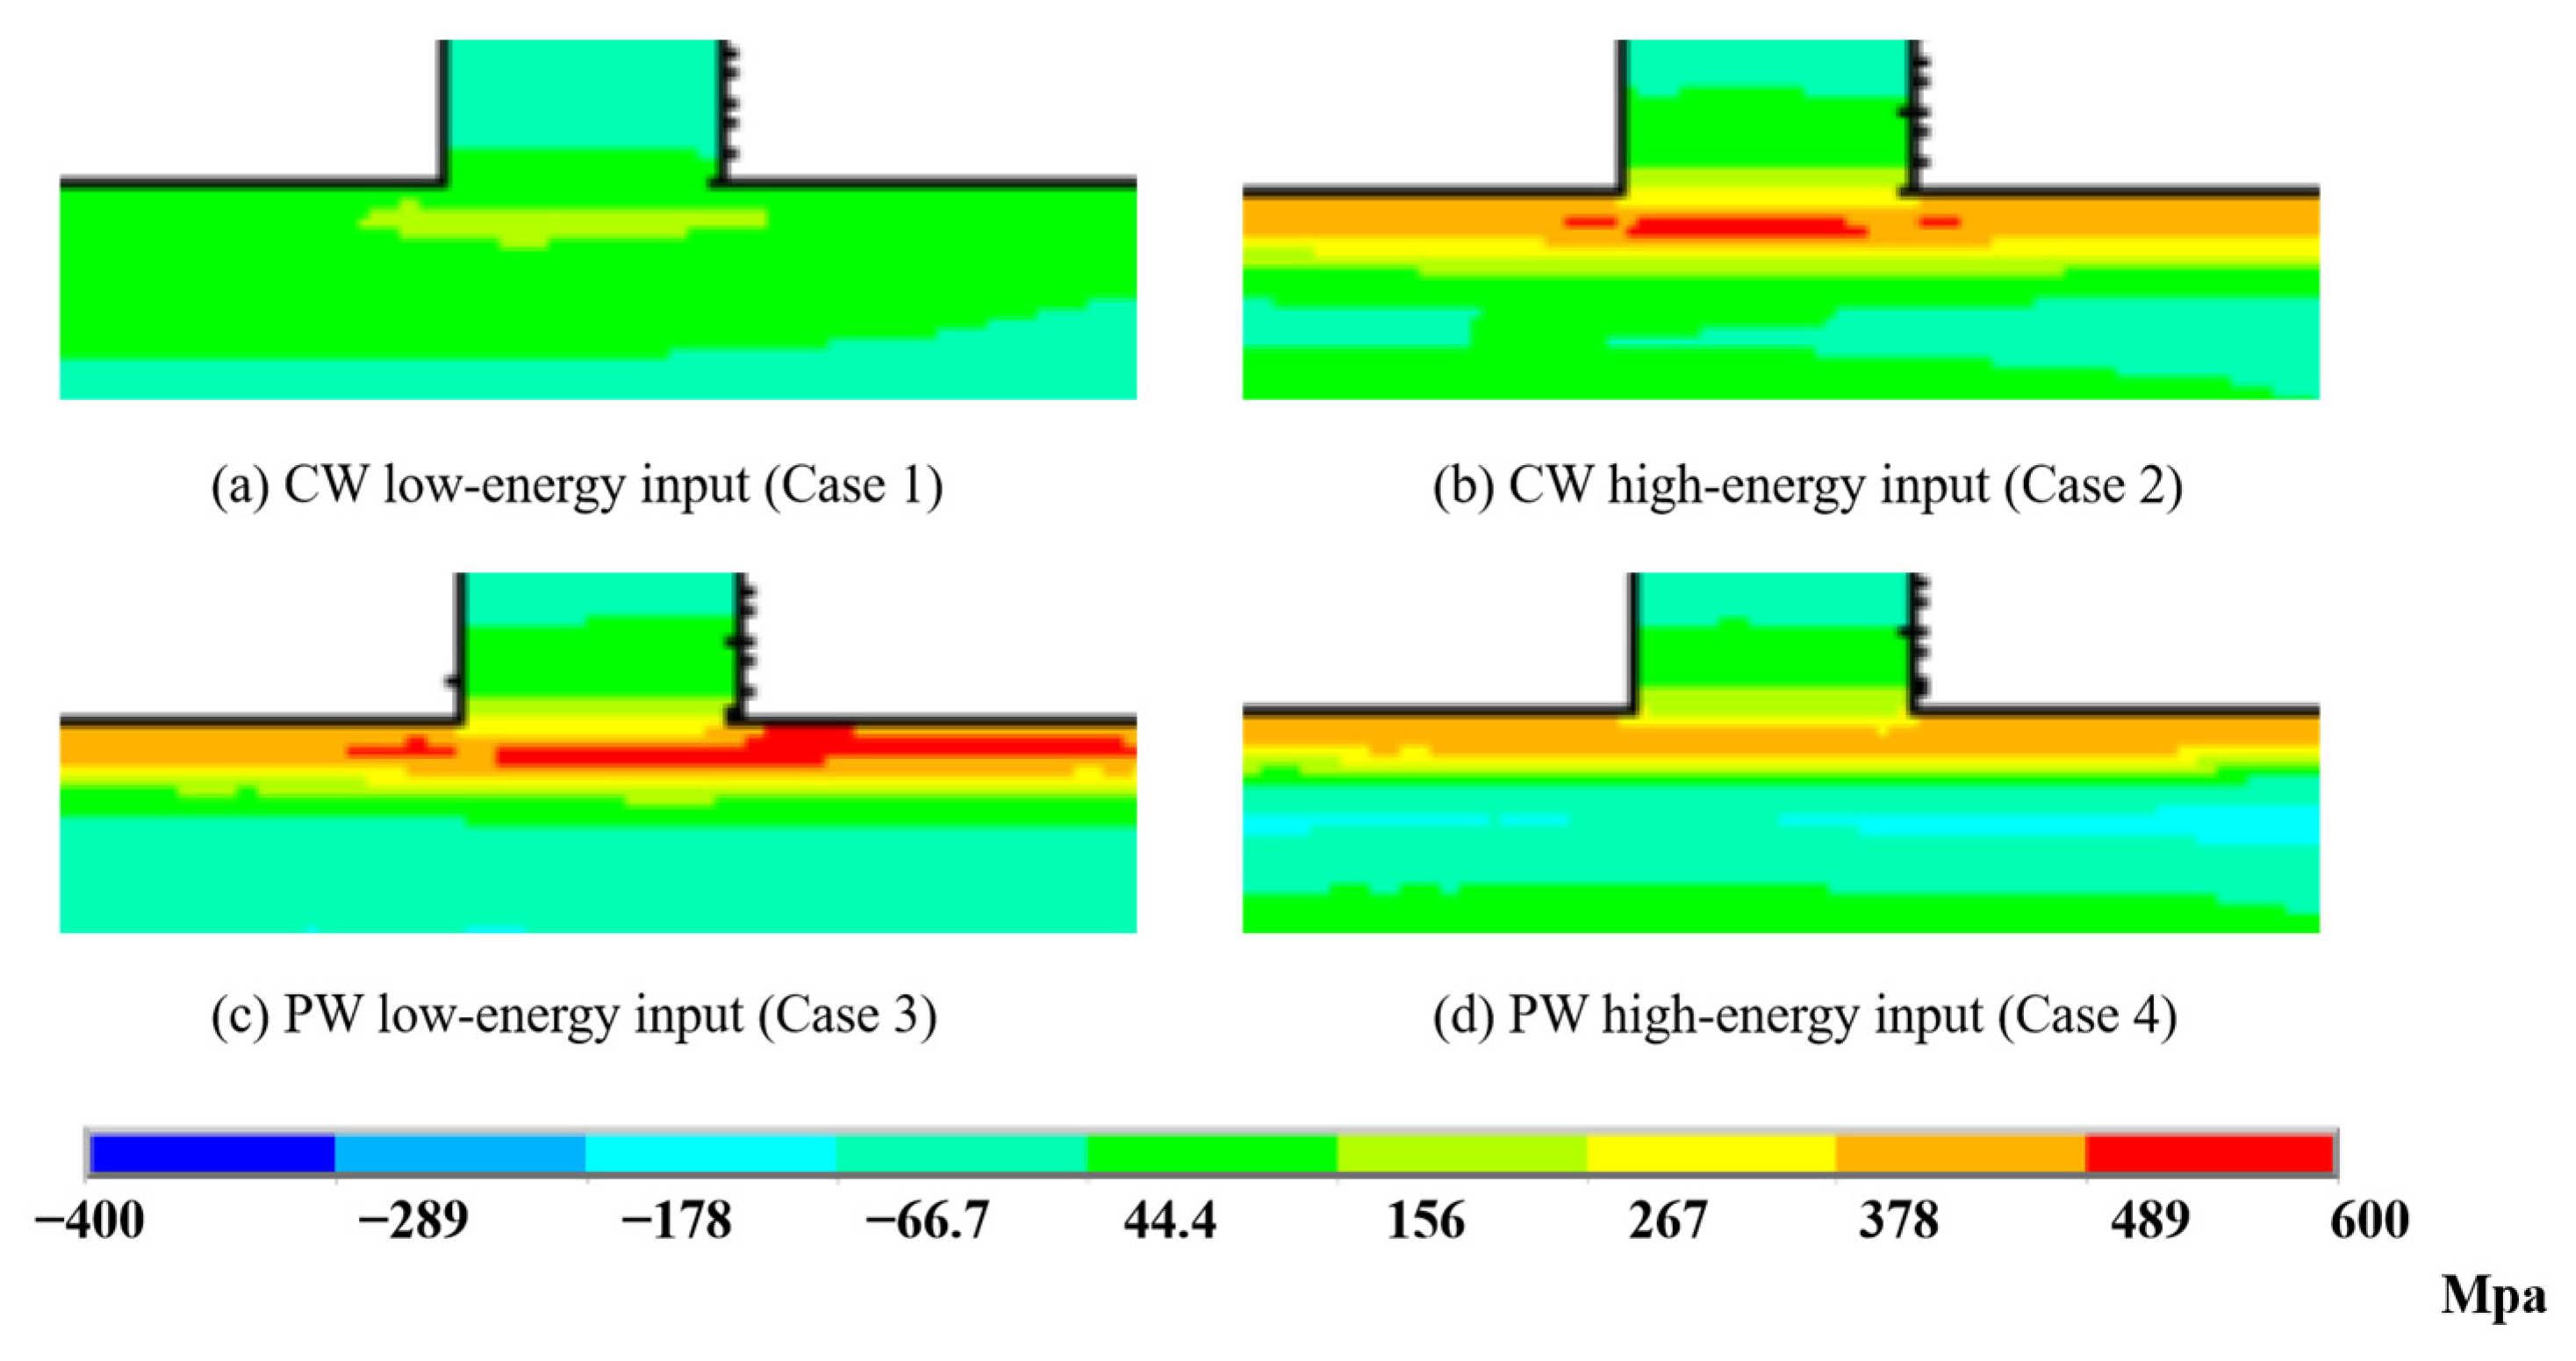
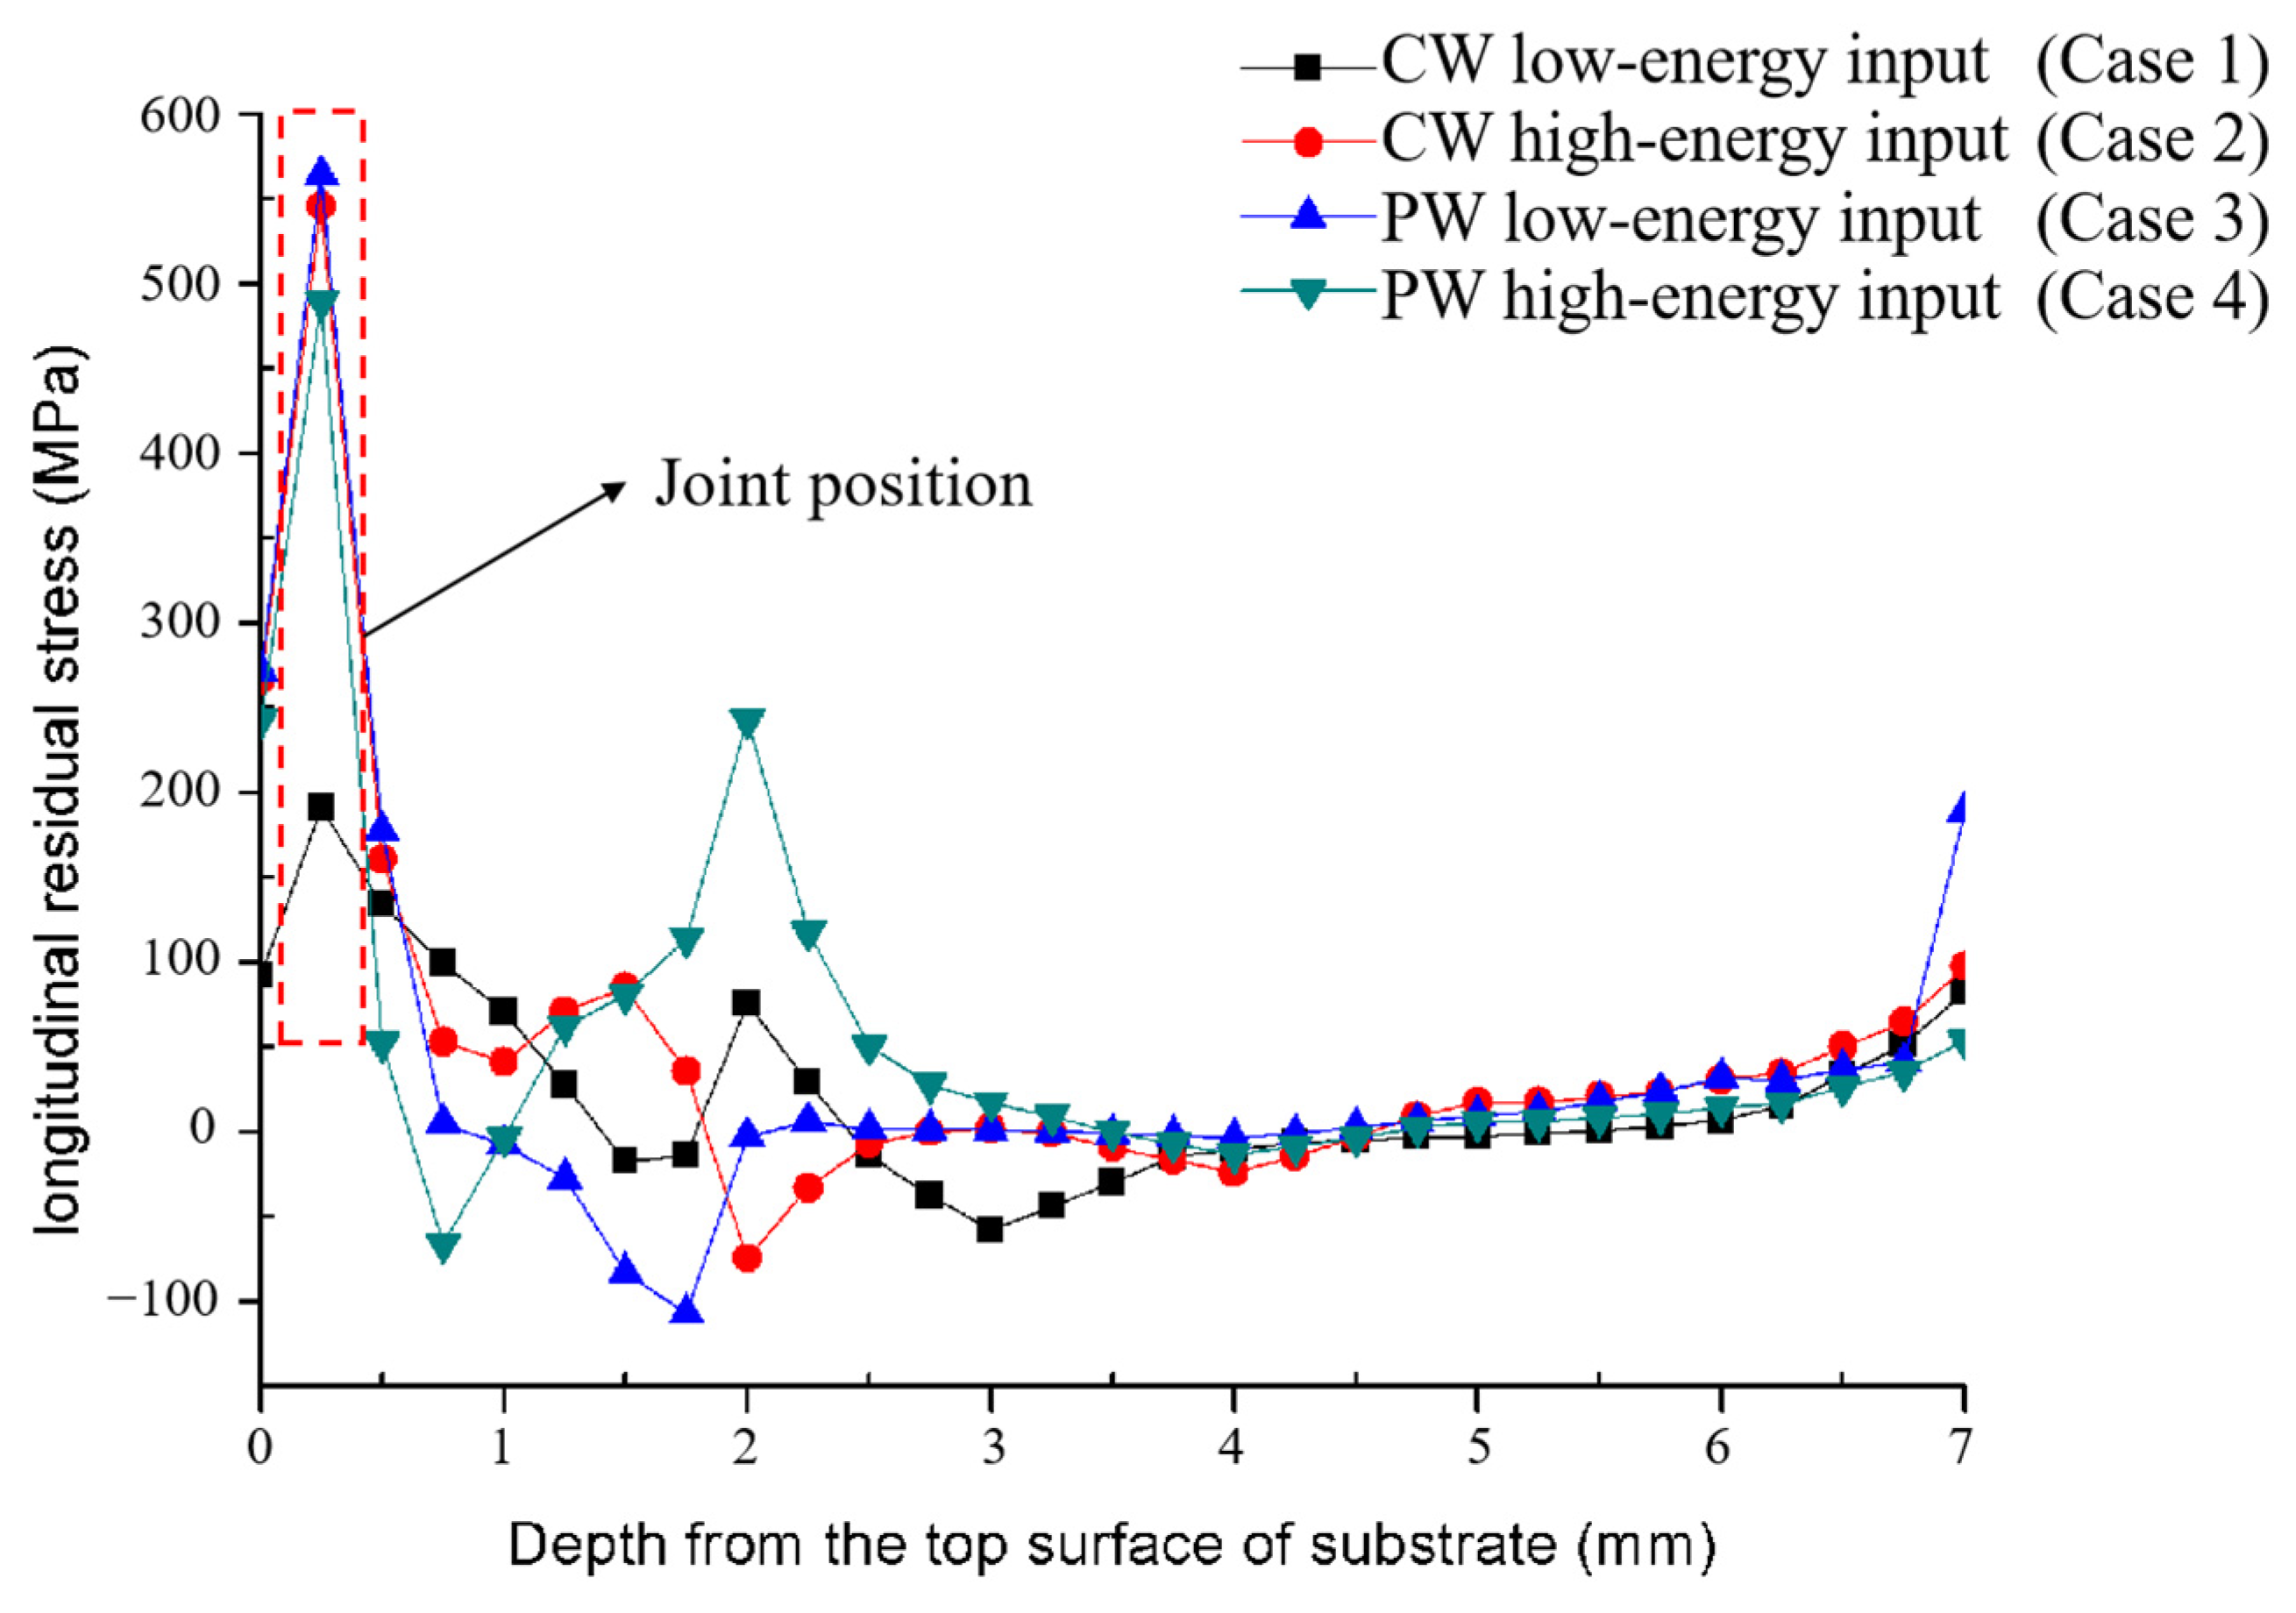
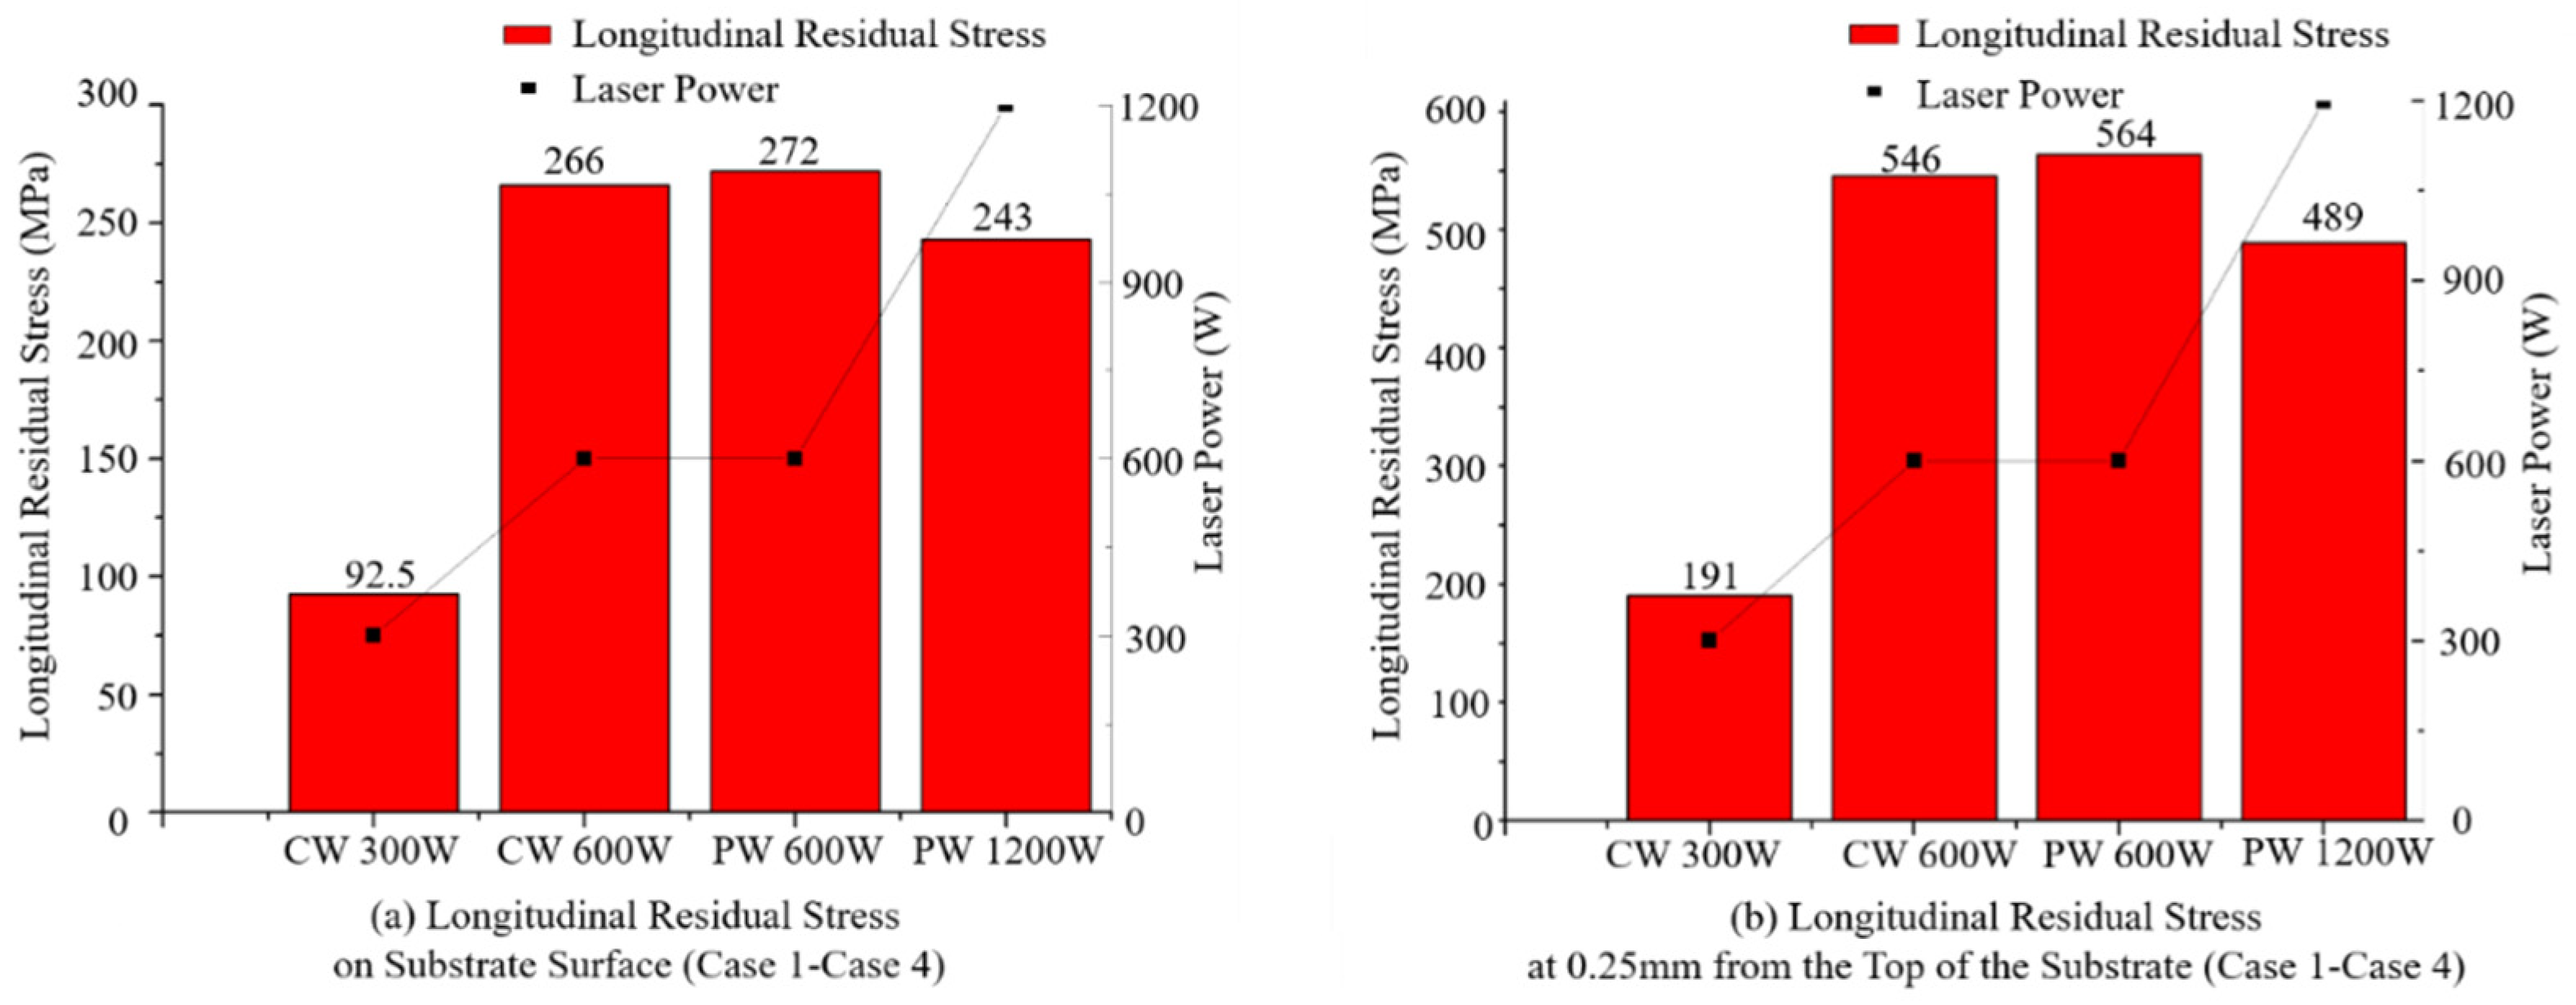
3.1. Residual Stresses in Substrate
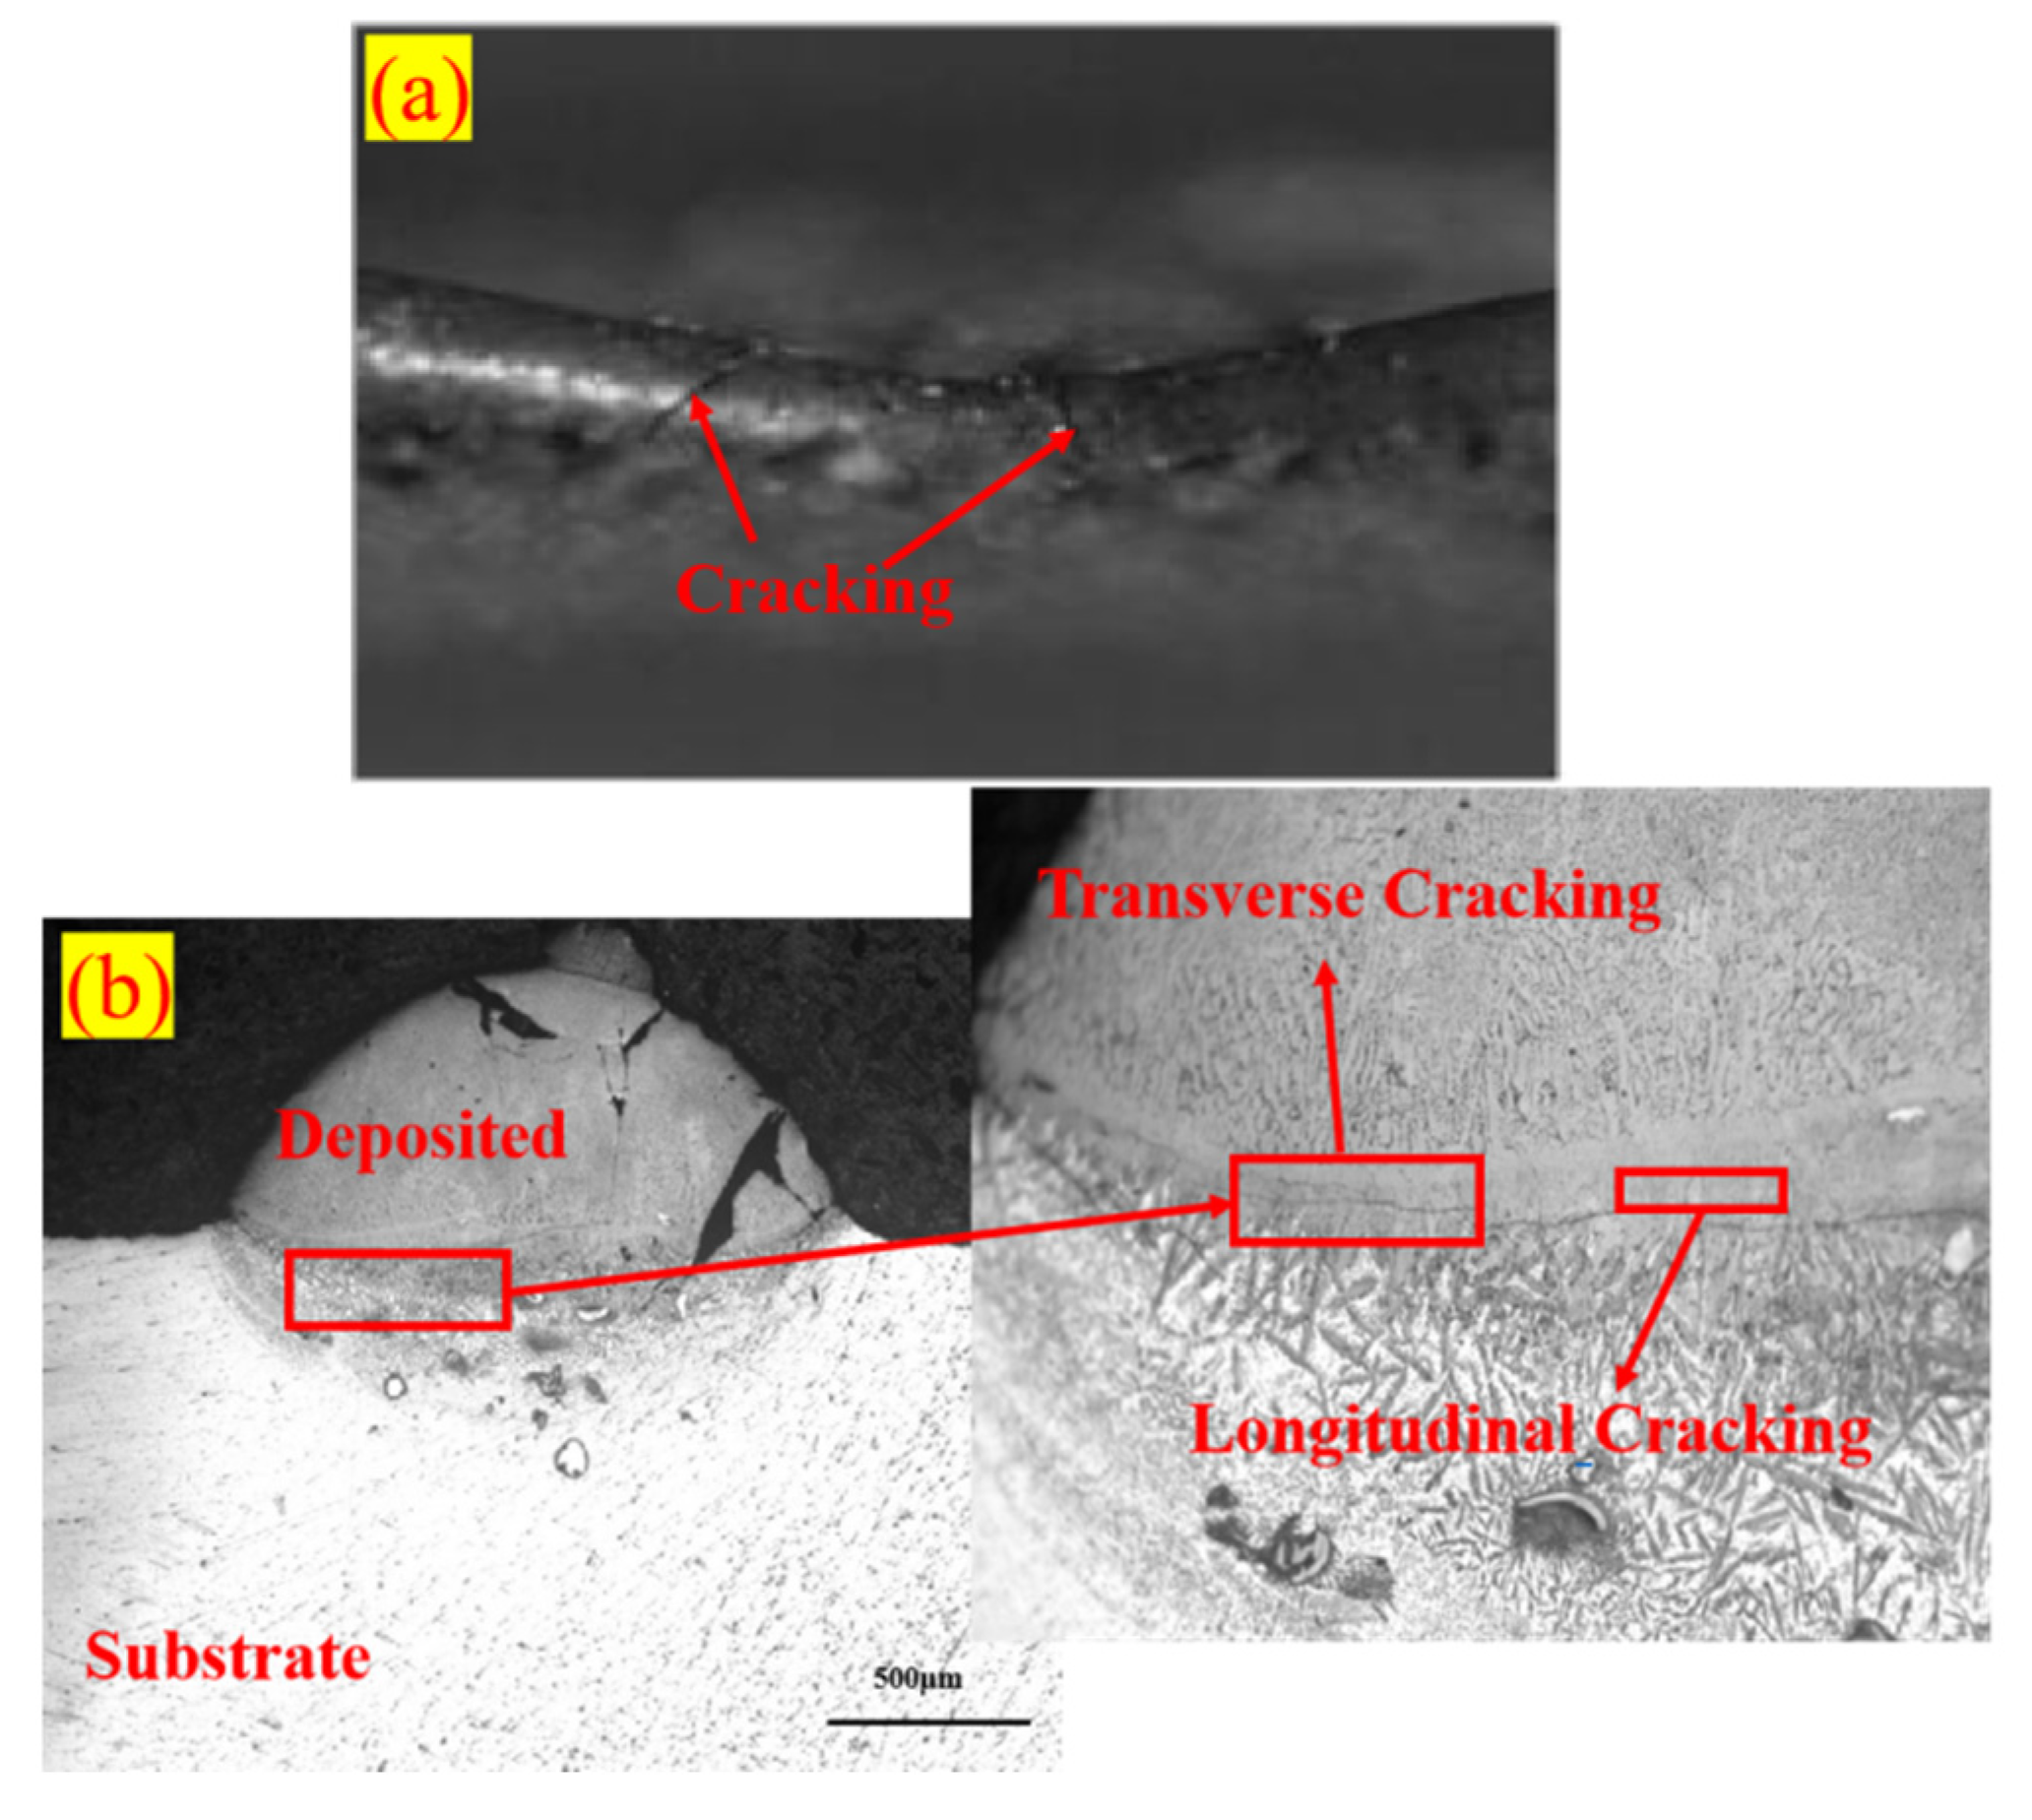
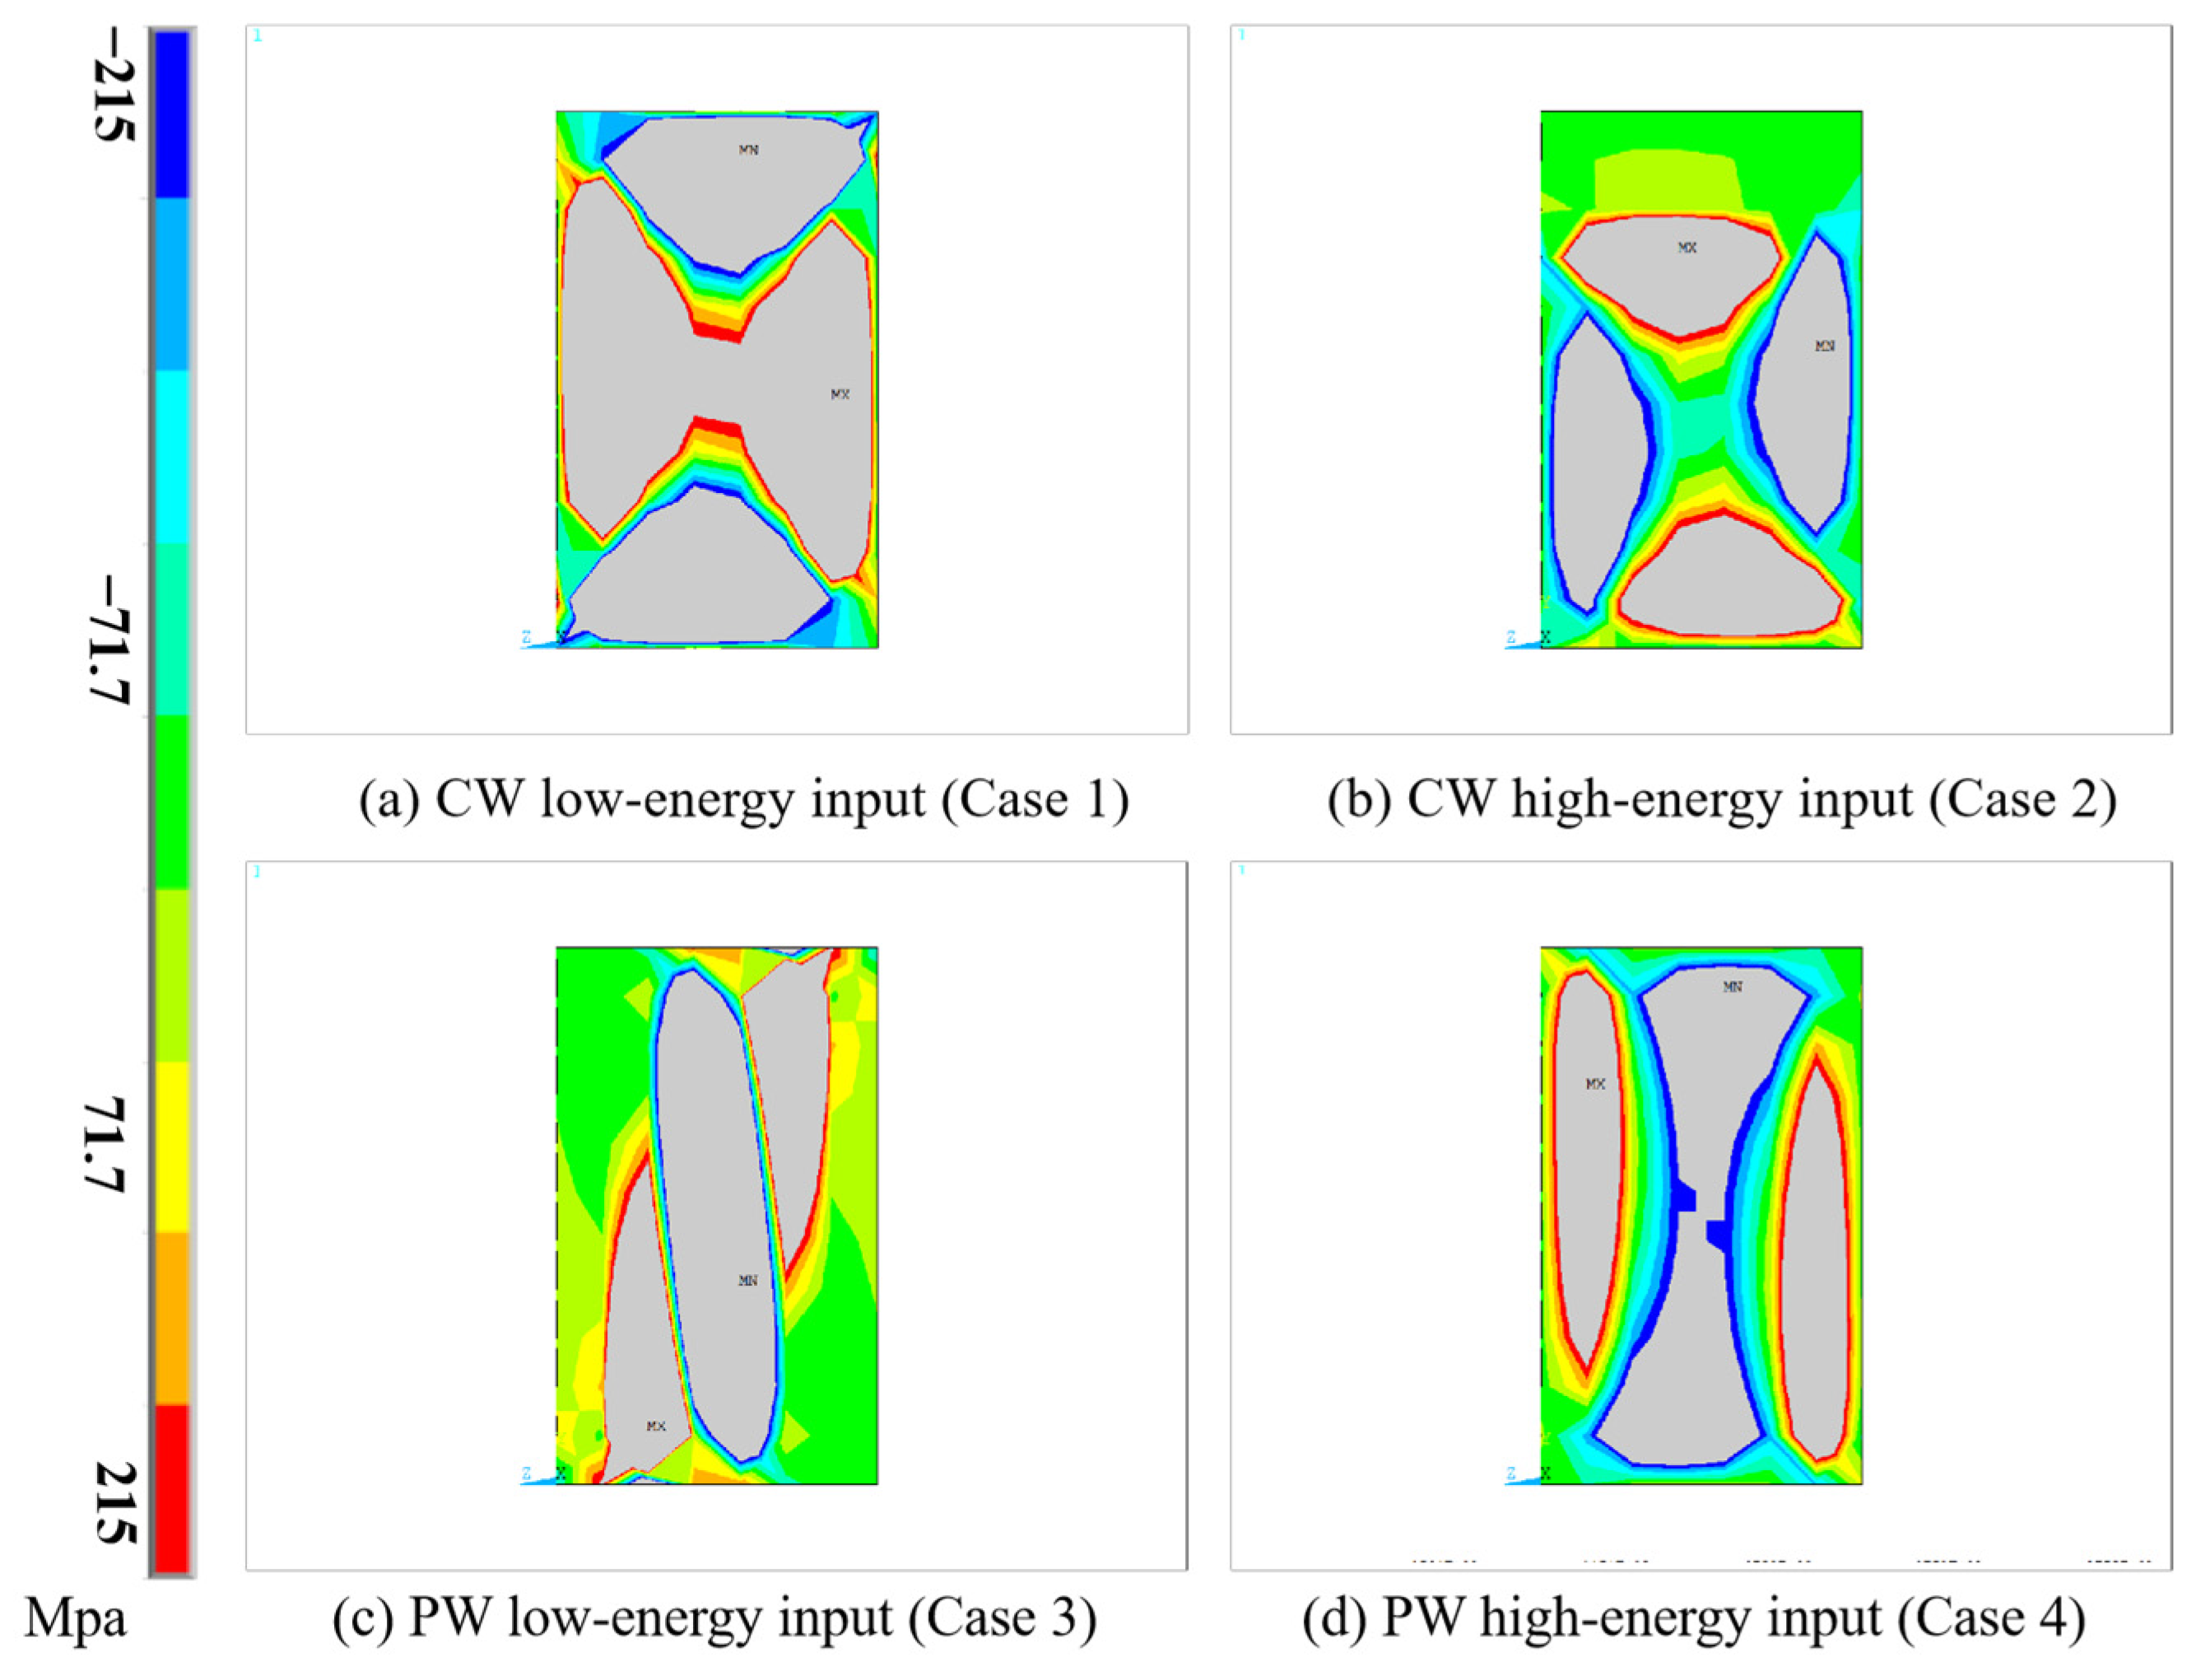
3.2. Residual Stresses in Deposited Materials
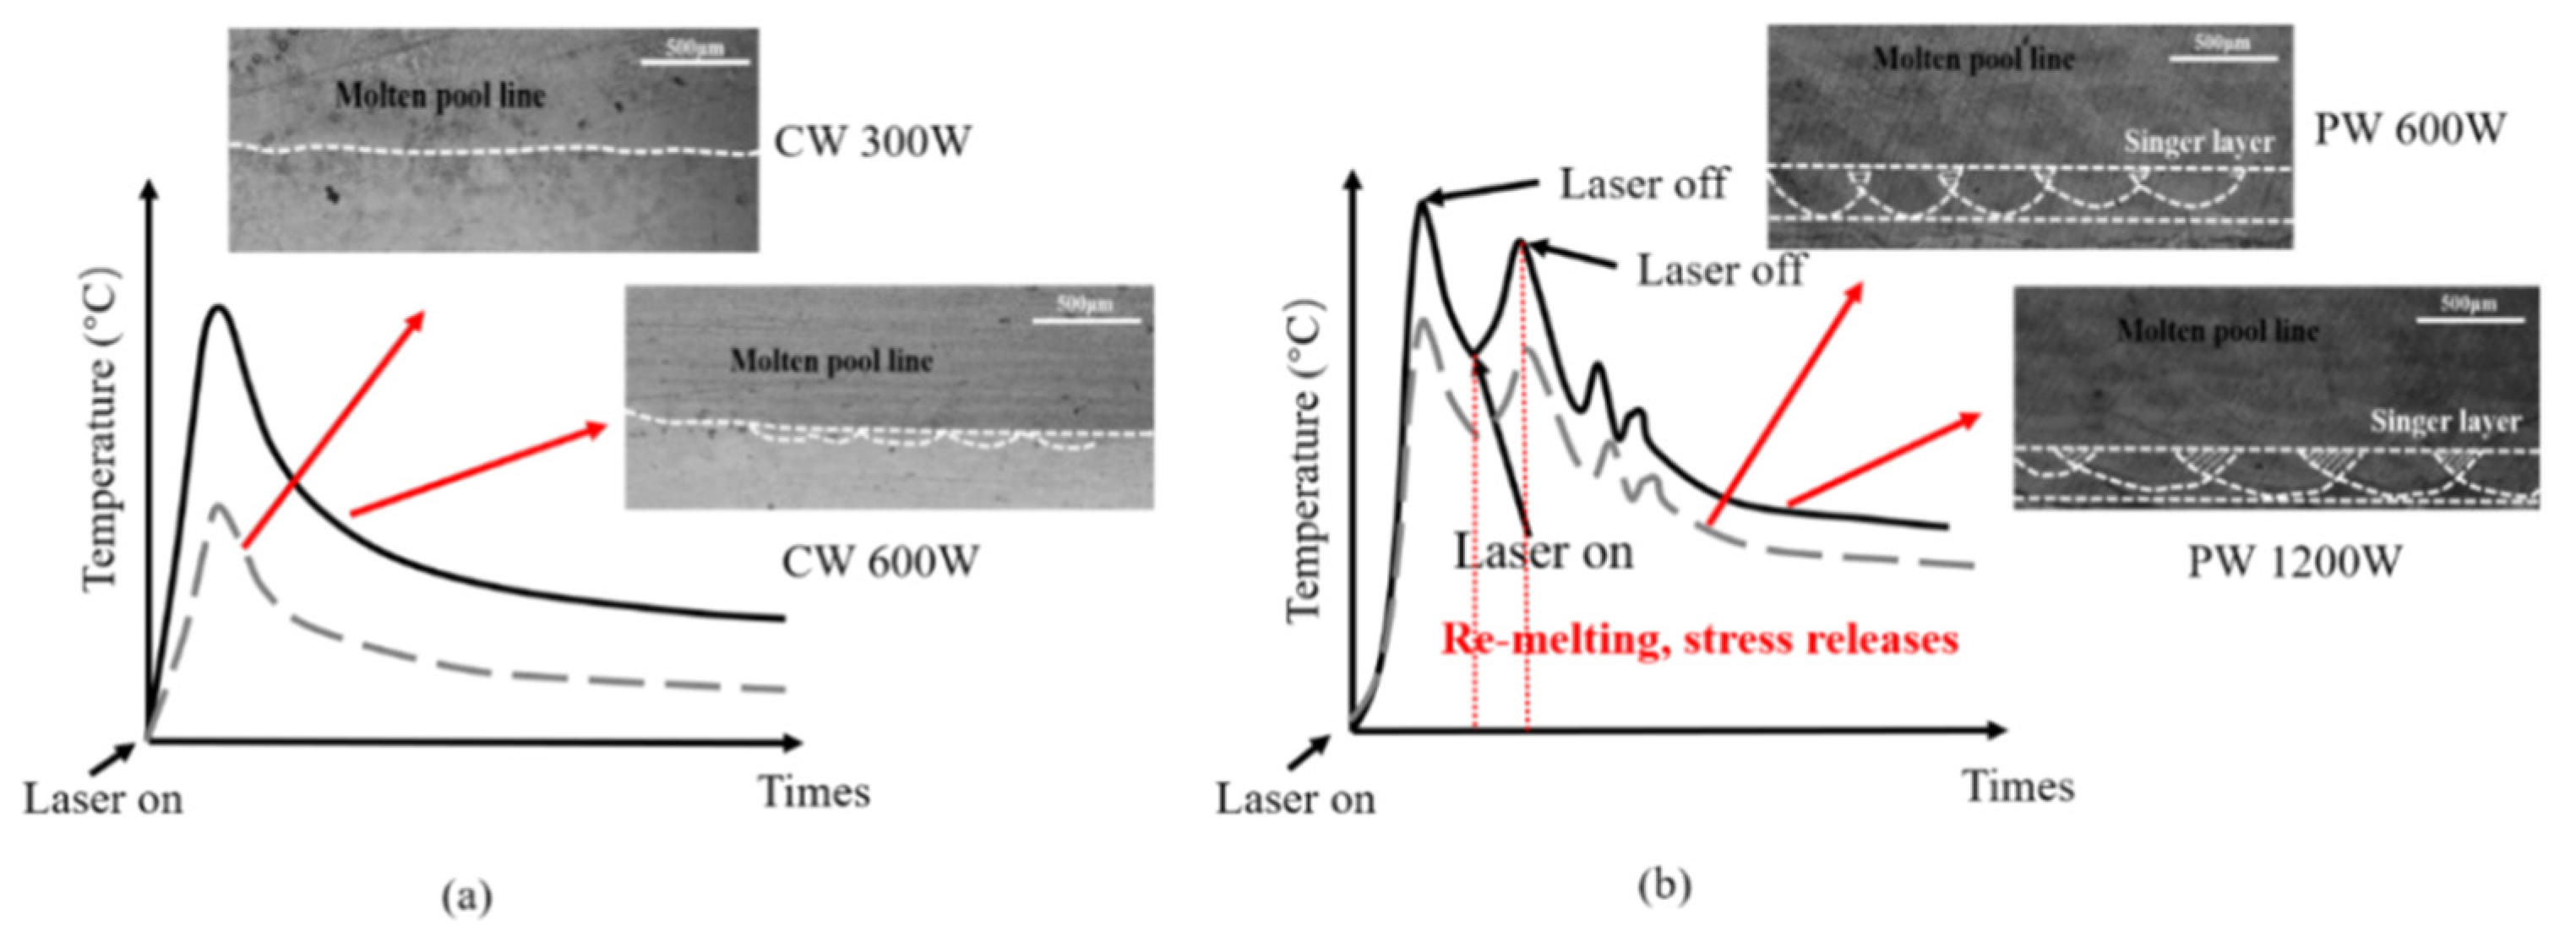
4. Discussion
5. Conclusions
- For low-energy input, in the substrate, the longitudinal residual stress increased significantly for the PW specimen compared to the CW specimen. A similar trend was observed in the deposited materials.
- For high-energy input, in the substrate, the longitudinal residual stress was smaller for the PW specimen than the CW specimen. In the deposited materials, an analogous trend was found.
- For CW mode, the longitudinal residual stress increased sharply with the increase in energy input.
- For PW mode, the longitudinal residual stress decreased by 13.2% with the increase in energy input.
- At the substrate–component junction, where micro-cracks and even delamination are prone to occur, it was found that PW mode could reduce the longitudinal residual stress by about 10.3% in the high-energy input sample.
Author Contributions
Funding
Institutional Review Board Statement
Informed Consent Statement
Data Availability Statement
Conflicts of Interest
References
- Murali, K.R.; Safia, A.S.; Mandar, G.; Julia, W.; Isaac, S.; Chandra, S.R.; Nithin, R.; Onome, S.E. Improving the Fatigue Life of an Additively Manufactured Stainless-Steel Specimen Using a Secondary Grinding Process. In Proceedings of the ASME Turbo Expo 2024: Turbomachinery Technical Conference and Exposition, London, UK, 24–28 June 2024; pp. 24–28. [Google Scholar]
- Chen, S.-G.; Gao, H.-J.; Zhang, Y.-D.; Wu, Q.; Gao, Z.-H.; Zhou, X. Review on residual stresses in metal additive manufacturing: Formation mechanisms, parameter dependencies, prediction and control approaches. J. Mater. Res. Technol. 2022, 17, 2950–2974. [Google Scholar] [CrossRef]
- Lai, Y.; Liu, W.; Zhao, J.; Zhao, Y.; Wang, F.; Han, W. Experimental Study on Residual Stress in Titanium Alloy Laser Additive Manufacturing. Appl. Mech. Mater. 2013, 431, 20–26. [Google Scholar] [CrossRef]
- Wu, A.S.; Brown, D.W.; Kumar, M.; Gallegos, G.; King, W.E. An Experimental Investigation into Additive Manufacturing-Induced Residual Stresses in 316L Stainless Steel. Metall. Mater. Trans. A 2014, 45, 6260–6270. [Google Scholar] [CrossRef]
- Zaeh, M.F.; Branner, G. Investigations on residual stresses and deformations in selective laser melting. Prod. Eng. 2010, 4, 35–45. [Google Scholar] [CrossRef]
- Denlinger, E.R.; Heigel, J.C.; Michaleris, P.; Palmer, T.A. Effect of inter-layer dwell time on distortion and residual stress in additive manufacturing of titanium and nickel alloys. J. Mater. Process. Technol. 2015, 215, 123–131. [Google Scholar] [CrossRef]
- Vasinonta, A.; Beuth, J.L.; Griffith, M.L. Process Maps for Controlling Residual Stress and Melt Pool Size in Laser-Based SFF Processes; Department of Mechanical Engineering Carnegie Mellon University: Pittsburgh, PA, USA, 2000. [Google Scholar]
- Shiomi, M.; Osakada, K.; Nakamura, K.; Yamashita, T.; Abe, F. Residual Stress within metallic model made by selective laser melting process. CIRP Ann. 2004, 53, 195–198. [Google Scholar] [CrossRef]
- Aggarangsi, P.; Beuth, J.L. Localized preheating approaches for reducing residual stress in additive manufacturing. In Proceedings of the 2006 International Solid Freeform Fabrication Symposium, Austin, TX, USA, 14–16 August 2006; pp. 709–720. [Google Scholar]
- Martina, F.; Roy, M.J.; Szost, B.A.; Terzi, S.; Colegrove, P.A. Residual stress of as-deposited and rolled wire+arc additive manufacturing Ti–6Al–4V components. Mater. Sci. Technol. 2016, 32, 1439–1448. [Google Scholar] [CrossRef]
- Zou, X.; Chang, T.F.; Yan, Z.; Zhao, Z.S.; Pan, Y.; Liu, W.Y.; Song, L.J. Control of thermal strain and residual stress in pulsed-wave direct laser deposition. Opt. Laser Technol. 2023, 163, 109386. [Google Scholar] [CrossRef]
- Moat, R.J.; Pinkerton, A.J.; Li, L.; Withers, P.J.; Preuss, M. Residual stresses in laser direct metal deposited Waspaloy. Mater. Sci. Eng. A 2011, 528, 2288–2298. [Google Scholar] [CrossRef]
- Liu, C.; Xiao, H.; Yan, J.L.; Yan, L.J.; Wang, L. Experimental evaluation of multiple-component residual stress distribution in a dissimilar metal repair joint of ferritic/martensitic steel using the asymmetric-cut and the symmetric-cut contour method. Int. J. Press. Vessel. Pip. 2024, 212, 105333. [Google Scholar] [CrossRef]
- Zhang, R.Y.; Li, X.W.; Hou, X.D.; Mo, J.H.; Oliveira, J.A.D.; Wang, F.; Zhang, Y.Z.; Li, J.; Paddea, S.; Dong, H.B.; et al. Residual stress mapping in additively manufactured steel mould parts using asymmetric and multiple cuts contour method. J. Manuf. Process. 2023, 102, 1000–1009. [Google Scholar] [CrossRef]
- Kollar, D.; Volgyi, I.; Joo, A.L. Assessment of residual stresses in welded T-joints using contour method. Thin-Walled Struct. 2023, 190, 110966. [Google Scholar] [CrossRef]
- Wu, J.; Qiang, B.; Liu, X.; Yao, C.G.; Li, Y.D. Determination of the three-dimensional welding residual stress in a thick plate T-welded joint using the stepwise eigenstrain-contour method. J. Manuf. Process. 2022, 84, 121–133. [Google Scholar] [CrossRef]
- Prime, M.B.; Sebring, R.J.; Edwards, J.M.; Hughes, D.J.; Webster, P.J. laser surface-contouring and spline data-smoothing for residual stress measurement. Exp. Mech. 2004, 44, 176–184. [Google Scholar] [CrossRef]
- Holden, T.M. Practical Residual Stress Measurement Methods; John Wiley & Sons, Ltd.: Hoboken, NJ, USA, 2013. [Google Scholar]
- Fitzpatrick, M.E.; Fry, A.T.; Holdway, P.; Kandil, F.A.; Shackleton, J.; Suominen, L. Determination of Residual Stresses by X-Ray Diffraction; Issue 2; National Physical Laboratory: Teddington, UK, 2005; pp. 38–39. [Google Scholar]
- Nobre, J.P.; Kornmeier, M.; Dias, A.M.; Scholtes, B. Use of the hole-drilling method for measuring residual stresses in highly stressed shot-peened surfaces. Exp. Mech. 2000, 40, 289–297. [Google Scholar] [CrossRef]
- Prime, M.B. Cross-Sectional Mapping of Residual Stresses by Measuring the Surface Contour After a Cut. J. Eng. Mater. Technol. -Trans. Asme 2001, 123, 162–168. [Google Scholar] [CrossRef]
- Leggatt, R.H. Residual stresses in welded structures. Int. J. Press. Vessel. Pip. 2008, 85, 144–151. [Google Scholar] [CrossRef]
- Yakout, M.; Elbestawi, M.A.; Veldhuis, S.C. Density and mechanical properties in selective laser melting of Invar 36 and stainless steel 316L. J. Mater. Process. Tech 2019, 266, 397–420. [Google Scholar] [CrossRef]
- Cheng, M.P.; Zou, X.; Pan, Y.; Yan, Z.; Liu, W.Y.; Song, L.J. Residual Stress Control Using Process Optimization in Directed Energy Deposition. Materials 2023, 16, 6610. [Google Scholar] [CrossRef] [PubMed]
- Chen, C.P.; Yin, J.; Zhu, H.H.; Xiao, Z.X.; Zhang, L.; Zeng, X.Y. Effect of overlap rate and pattern on residual stress in selective laser melting. Int. J. Mach. Tools Manuf. 2019, 145, 103433. [Google Scholar] [CrossRef]
- Li, S.M.; Xiao, H.; Liu, K.Y.; Xiao, W.J.; Li, Y.Q.; Han, X.; Mazumder, J.; Song, L.J. Melt-pool motion, temperature variation and dendritic morphology of Inconel 718 during pulsed- and continuous-wave laser additive manufacturing: A comparative study. Mater. Des. 2017, 119, 351–360. [Google Scholar] [CrossRef]
- Xiao, H.; Li, S.M.; Xiao, W.J.; Li, Y.Q.; Cha, L.M.; Mazumder, J.; Song, L.J. Effects of laser modes on Nb segregation and Laves phase formation during laser additive manufacturing of nickel-based superalloy. Mater. Lett. 2017, 188, 260–262. [Google Scholar] [CrossRef]
- Kar, J.; Roy, S.K.; Roy, G.G. Influence of beam oscillation in electron beam welding of Ti-6AL-4V. Int. J. Adv. Manuf. Technol. 2017, 94, 4531–4541. [Google Scholar] [CrossRef]


| Element | B | Cr | Fe | Si | Cu | Mo | Nb | Ni |
|---|---|---|---|---|---|---|---|---|
| Percentage | 20% | 9% | 8.5% | 3% | 7.2% | 3% | 5% | 44.3% |
| Number | CW/PW | Power (W) | Total Energy Input (J) | Scanning Speed (mm/s) | Powder Feeding Rate (g/min) | Number of Layers | Pulse Frequency (HZ) | Duty Ratio |
|---|---|---|---|---|---|---|---|---|
| 1 | CW | 300 | 300 | 6 | 10.3 | 20 | / | / |
| 2 | CW | 600 | 600 | 6 | 10.3 | 20 | / | / |
| 3 | PW | 600 | 300 | 6 | 10.3 | 20 | 10 | 50% |
| 4 | PW | 1200 | 600 | 6 | 10.3 | 20 | 10 | 50% |
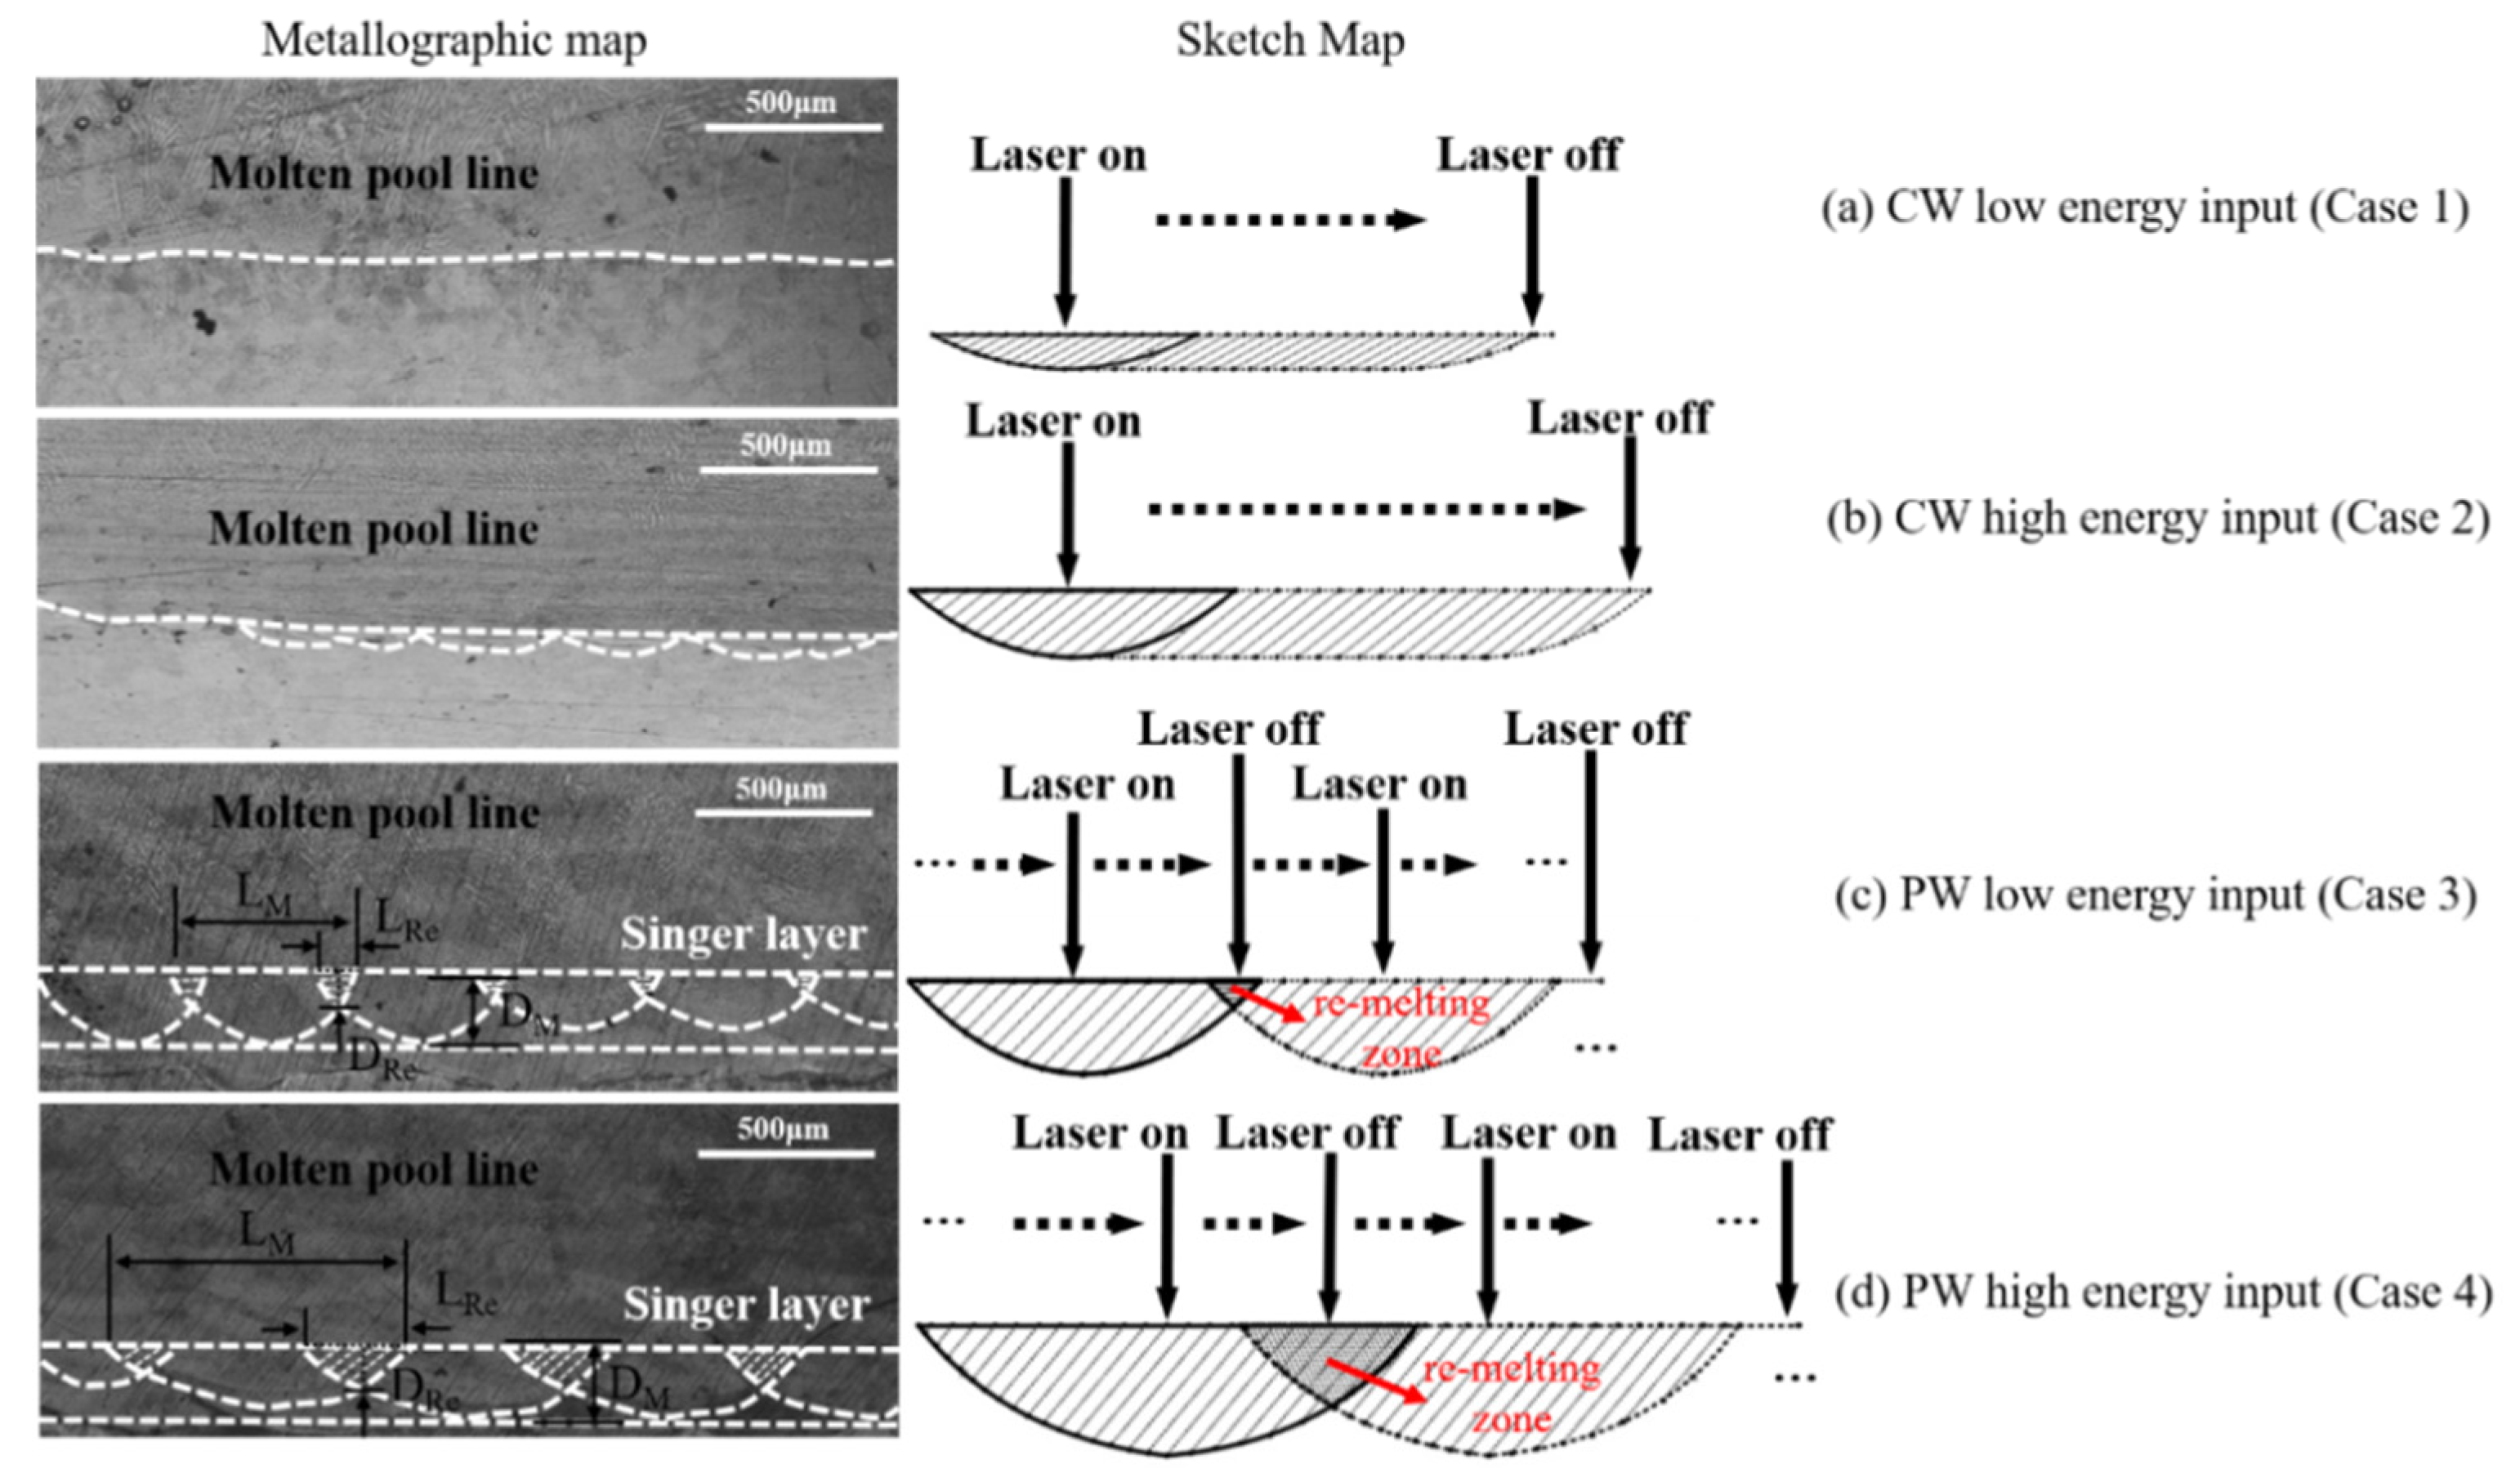
| Case | Molten Pool | Re-Melting Zone | Percentage | ||||
|---|---|---|---|---|---|---|---|
| LM (mm) | DM (mm) | AM (mm2) | LRe (mm) | DRe (mm) | ARe (mm2) | AreaRe/AreaM | |
| 1 | / | / | / | / | / | / | / |
| 2 | / | / | / | / | / | / | / |
| 3 | 0.5 | 0.187 | 0.047 | 0.111 | 0.083 | 0.0046 | 9.7% |
| 4 | 0.875 | 0.23 | 0.100 | 0.333 | 0.119 | 0.0198 | 19.8% |
Disclaimer/Publisher’s Note: The statements, opinions and data contained in all publications are solely those of the individual author(s) and contributor(s) and not of MDPI and/or the editor(s). MDPI and/or the editor(s) disclaim responsibility for any injury to people or property resulting from any ideas, methods, instructions or products referred to in the content. |
© 2024 by the authors. Licensee MDPI, Basel, Switzerland. This article is an open access article distributed under the terms and conditions of the Creative Commons Attribution (CC BY) license (https://creativecommons.org/licenses/by/4.0/).
Share and Cite
Cheng, M.; Zou, X.; Chang, T.; Cao, Q.; Ju, H.; Luo, G.; Zou, Z.; Wu, Z. Residual Stresses of 316L Stainless Steel Laser Direct Metal During Pulsed-Wave and Continuous-Wave Laser Additive Manufacturing: A Comparative Study. Coatings 2024, 14, 1598. https://doi.org/10.3390/coatings14121598
Cheng M, Zou X, Chang T, Cao Q, Ju H, Luo G, Zou Z, Wu Z. Residual Stresses of 316L Stainless Steel Laser Direct Metal During Pulsed-Wave and Continuous-Wave Laser Additive Manufacturing: A Comparative Study. Coatings. 2024; 14(12):1598. https://doi.org/10.3390/coatings14121598
Chicago/Turabian StyleCheng, Manping, Xi Zou, Tengfei Chang, Qi Cao, Houlai Ju, Guoyun Luo, Zhengwen Zou, and Zhenxing Wu. 2024. "Residual Stresses of 316L Stainless Steel Laser Direct Metal During Pulsed-Wave and Continuous-Wave Laser Additive Manufacturing: A Comparative Study" Coatings 14, no. 12: 1598. https://doi.org/10.3390/coatings14121598
APA StyleCheng, M., Zou, X., Chang, T., Cao, Q., Ju, H., Luo, G., Zou, Z., & Wu, Z. (2024). Residual Stresses of 316L Stainless Steel Laser Direct Metal During Pulsed-Wave and Continuous-Wave Laser Additive Manufacturing: A Comparative Study. Coatings, 14(12), 1598. https://doi.org/10.3390/coatings14121598