Article

Study on the Effect of Lignin Removal Rate on the Dielectric Properties of Delignified Materials

1
College of Material Science and Art Design, Inner Mongolia Agricultural University, Hohhot 010018, China
2
Inner Mongolia Key Laboratory for Sand Shrubs Fibrosis and Energy Development and Utilization, Hohhot 010018, China
3
National Forestry Grassland Engineering Technology Research Center for Efficient Development and Utilization of Sandy Shrubs, Hohhot 010018, China
*
Author to whom correspondence should be addressed.
These authors contributed equally to this work.
Coatings 2024, 14(11), 1421; https://doi.org/10.3390/coatings14111421
Submission received: 2 October 2024 / Revised: 1 November 2024 / Accepted: 5 November 2024 / Published: 8 November 2024

Abstract

:
To investigate the relationship between the lignin removal rate change of wood and its dielectric properties, this study employed Mongolian Scotch Pine and Paulownia as the test materials. The acidic sodium chlorite method was used to delignify the treated material, and the lignin removal rate was determined at a specified reaction time interval to ascertain the dielectric constant and the tangent of the dielectric loss angle. The findings revealed that: As the delignification process progresses, the lignin content declines, accompanied by a reduction in the dielectric constant at elevated frequencies. This decline reaches a plateau near 10 MHz. The results demonstrated that the dielectric constant of the samples decreased with an increase in frequency and exhibited a stabilizing effect near 10 MHz. However, the dielectric constant of delignified wood was significantly higher than that of untreated wood. Additionally, the dielectric constant exhibited a linear relationship with the increase in lignin removal rate, while the tangent of the dielectric loss angle demonstrated a tendency to increase and then decrease. An investigation into the dielectric properties of delignified wood can yield valuable data and a theoretical foundation for the development of wood-based dielectric materials.

1. Introduction

The internal structure and chemical composition of wood are closely related to its dielectric properties. Consequently, non-destructive testing techniques based on dielectric properties can be used to determine the internal defects of wood, assess its material strength characteristics, and deduce other properties of wood. The study of the dielectric properties of wood represents a significant avenue of inquiry for elucidating its electrical properties and dipole dynamics. Concurrently, the advancement of synthetic polymer materials for the substrates of conventional electronic devices in the direction of recyclability, decarbonization, and biodegradability has positioned wood as a focal point in investigating novel basic materials for electrical properties.
The primary constituents of the wood cell wall are cellulose, hemicellulose, and lignin, which are intimately associated with and collectively represent over 90% of the cell wall system [1]. Cellulose exists in the cell wall in the form of microfilaments and constitutes the microskeletal structure [2]. It is generally accepted that cellulose and lignin are amorphous substances wrapped around and filling the interstices of the microskeletal structure [3].
Lignin is an aromatic polymer compound with a three-dimensional structure, comprising phenylpropane-like structural units linked by carbon-carbon and ether bonds [4]. It contains a variety of reactive functional groups, including phenolic hydroxyl groups, methoxy groups, and carbonyl groups. The cellulose polymer chains have a high proportion of hydroxyl groups, which are capable of undergoing orientational polarization. However, intermolecular and intramolecular hydrogen bonding limits the orientational polarization in the AC electric field [5]. The Gu team [6] found that polar functional groups promote the formation of covalent and hydrogen bonds, and lignin molecules produce clusters of aggregates, which generate structural blockage under the interaction force and prevent polar groups from polarization shift in the electric field. Therefore, the delignification of wood can reduce the structural blockage phenomenon to a certain extent and optimize the dielectrophoretic polarization phenomenon.
Wood is hygroscopic, whereas water molecules are polar, readily orientated, and polarized. The relationship between the dielectric properties of wood below the fiber saturation point (FSP) and its moisture content (MC) has been demonstrated to exhibit an approximate exponential increase in dielectric constant (ε′) with rising MC, as evidenced by [7]. Nevertheless, the impact of alterations in the internal chemical composition of delignified wood (DW) with regard to clustering and structural blocking on the alterations in the dielectric properties of DW across different moisture content ranges remains to be explored from a theoretical perspective. In particular, wood can be employed as a novel environmentally friendly substrate material for electronic products in the fields of electronics and nanotechnology. This is due to the fact that it is a renewable and biodegradable resource, which may contribute to its use in the direction of insulation or energy storage. It is therefore essential to gain an understanding of the coordination mechanisms of the internal chemical composition of wood and the influence of its own dielectric properties.
The objective of this study was to analyze the mechanism of change in the dielectric properties of delignified wood with varying lignin contents following the delignification treatment of the wood. The effect of the lignin removal rate on the dielectric properties was analyzed by measuring the dielectric loss factor (tanδ) and the complex permittivity (ε′) at different frequencies (F). The resulting data and theoretical basis will inform the preparation of wood-based dielectric materials.

2. Experimental Procedure

In this experiment, artificial Mongolian Scotch Pine and Paulownia are employed as the raw materials, and delignification is conducted by varying the reaction time. Subsequently, the dielectric properties of the treated specimens are evaluated. The specific test procedure is illustrated in Figure 1.

2.1. Materials and Reagents

The commercially purchased artificial Mongolian scotch pine (Pinus sylvestris Linn. var. mongolica Litv.) and paulownia (Paulownia fortunei (Seem.) Hemsl.) were processed into small pieces of wood measuring 20 mm × 20 mm × 2 mm, which were subsequently noted as Mongolian scotch pine (M) and paulownia (P).
The chemicals sodium chlorite (80%), barium chloride, and calcium nitrate were procured from the Shanghai Aladdin Biochemical Science and Technology Co., Ltd. (Shanghai, China). The chemicals glacial acetic acid, anhydrous ethanol, nitric acid, sulfuric acid, and hydrochloric acid were obtained from the Tianjin Windship Chemical Reagent Technology Co. (Tianjin, China). The aforementioned chemicals were of analytical grade, and the distilled water was prepared in the laboratory.

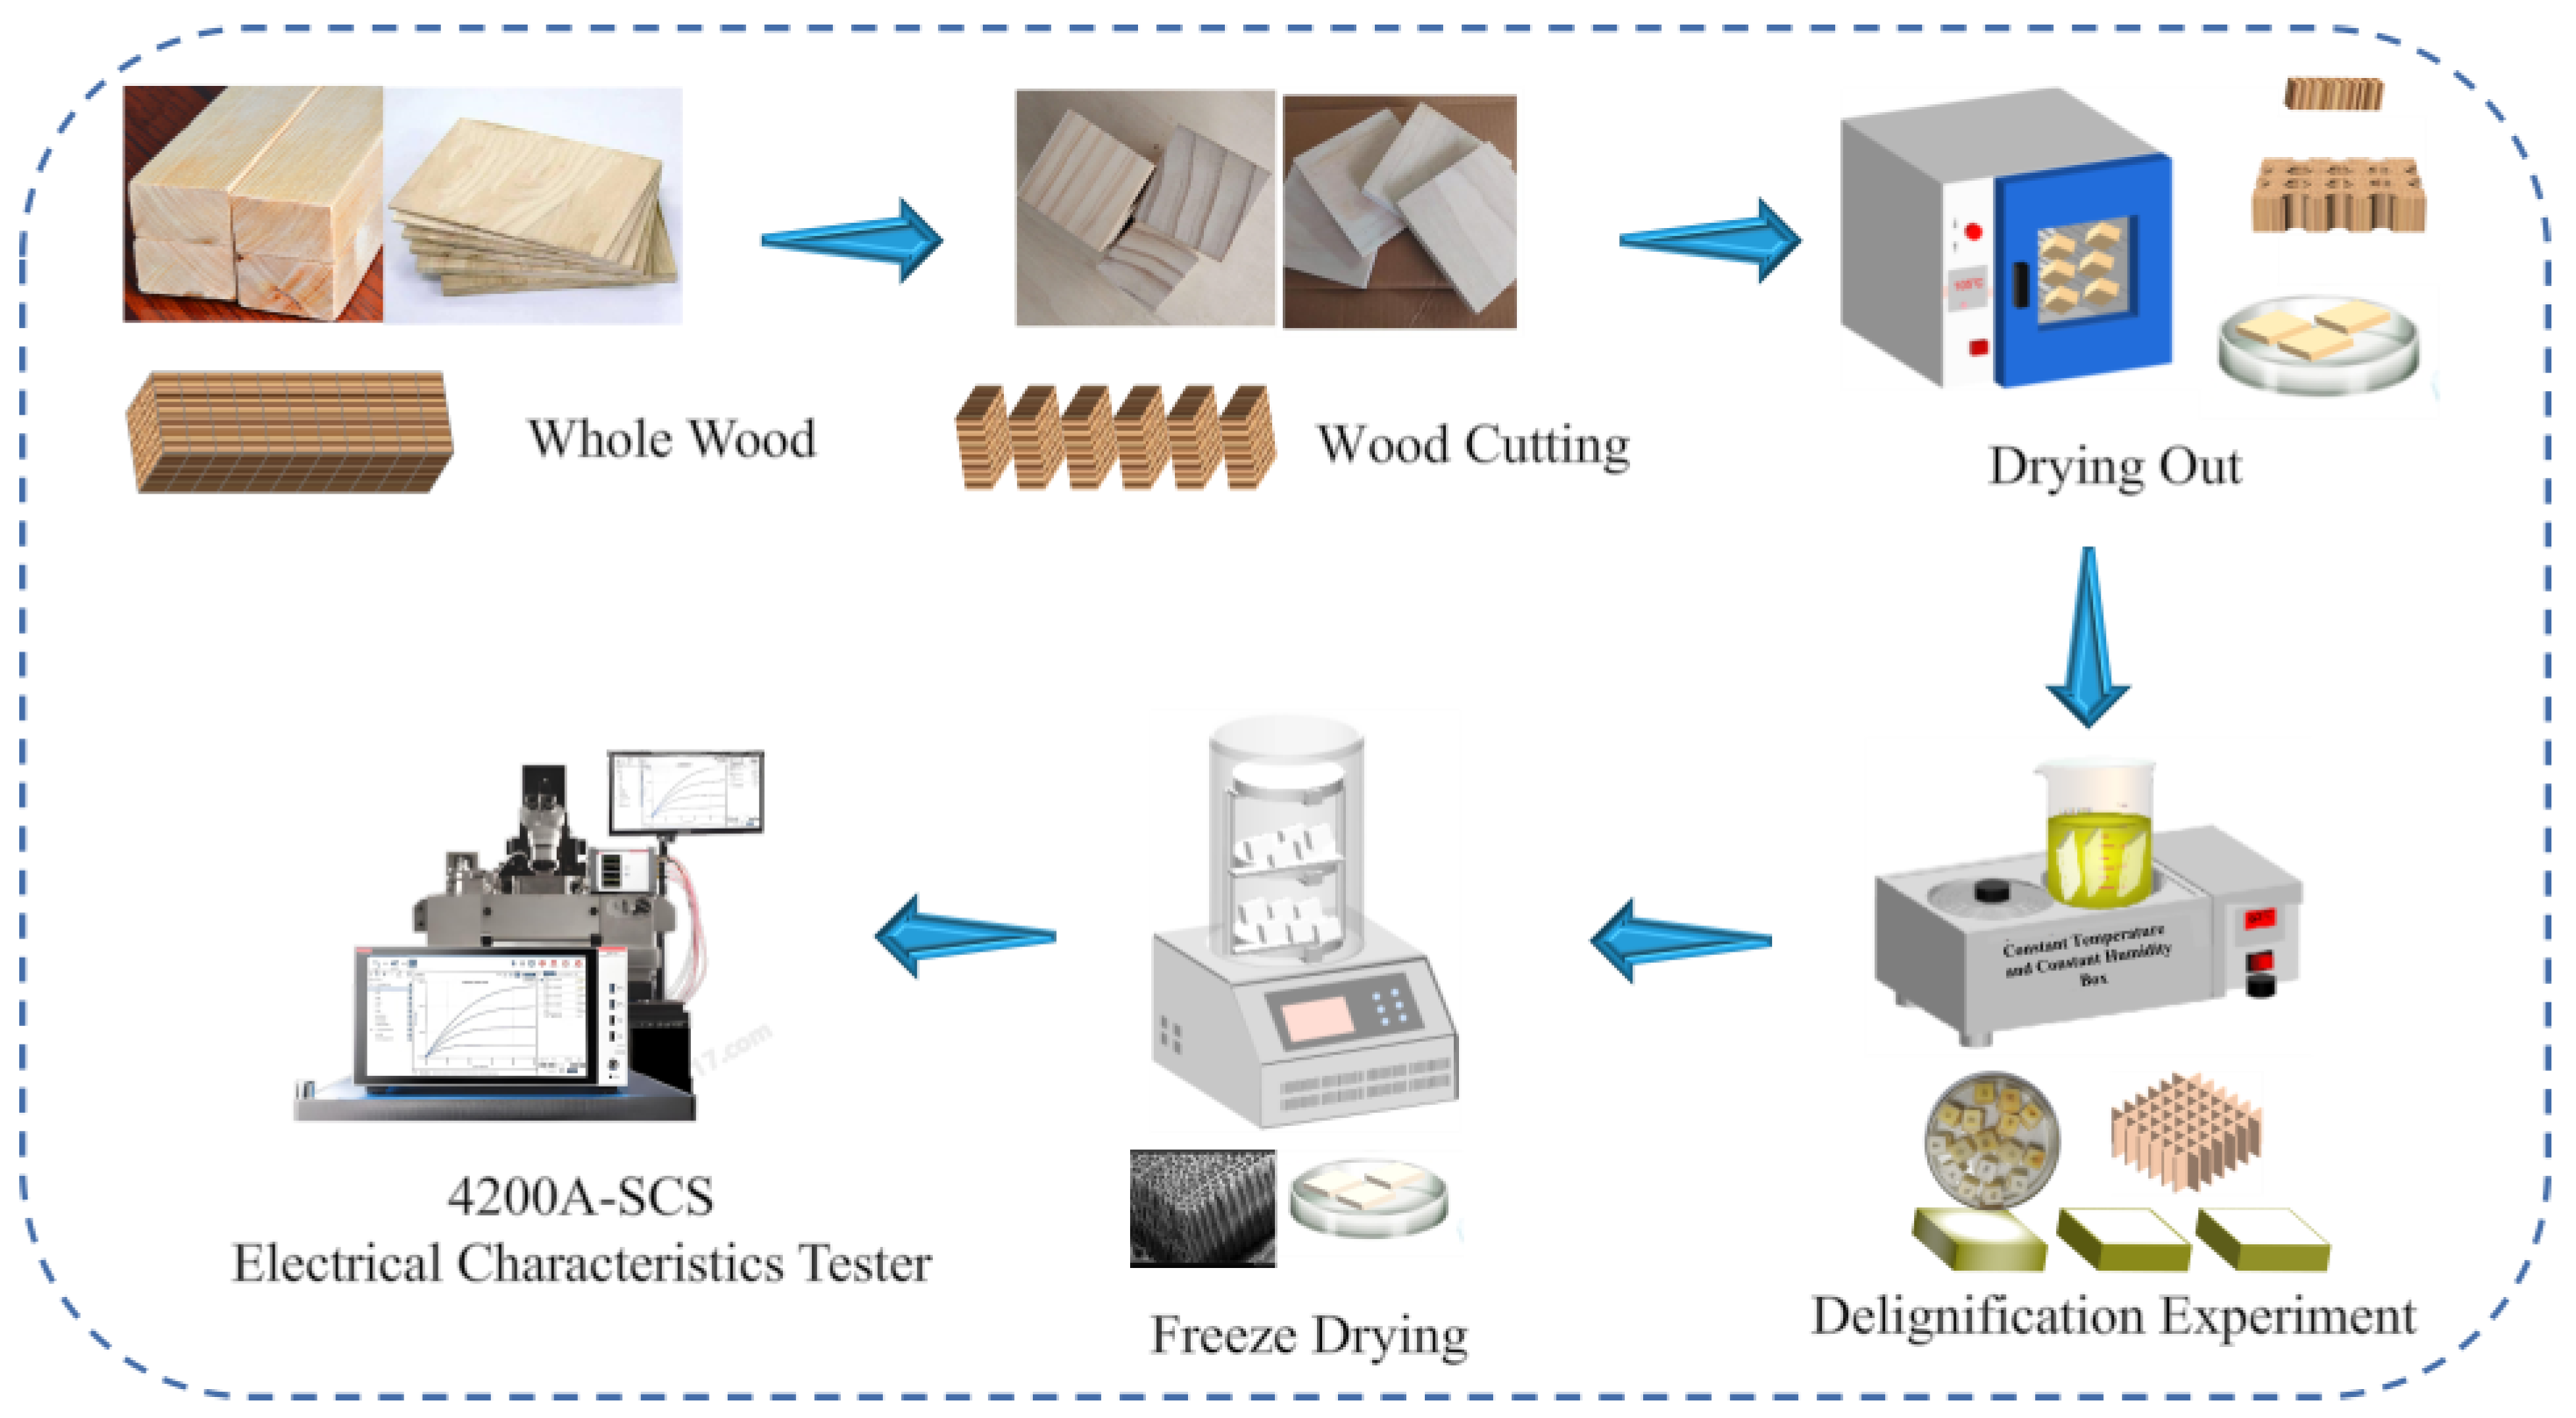
2.2. Instruments and Equipment

The Electrothermal Constant Temperature Triple Water Tank SHHW21-420, produced by the Shanghai Benting Instrument Co., Ltd. (Shanghai, China), is a device designed to maintain a constant temperature for water heating. The Universal High-Speed Pulveriser (DE-150 g), produced by the Zhejiang Hongjingtian Industry & Trade Co., Ltd. (Jinhua, China), is a pulverizing apparatus that employs high-speed technology for the pulverization of materials. The Electrothermal Constant Temperature Blast Drying Oven GZX-GF101-1-BS-II/H is produced by the Shanghai Yuejin Medical Instrument Co. (Shanghai, China) and is an apparatus designed for the drying of materials through the application of high temperatures. The Vacuum Drying Oven DZF-6020 is produced by the Changzhou Jintan Jingda Instrument Manufacturing Co. (Changzhou, China). The Circulating Water Vacuum Pump SHZ-D(III) is produced by the Shanghai Dongxi Refrigeration Instrument and Equipment Co., Ltd. (Shanghai, China). The analytical balance is the Sartorius BS224S, produced by Sartorius, Germany. The pH meter is the FE28-Standard, produced by the Qingdao Limi Biotechnology Co., Ltd. (Qingdao, China). The 4200A-SCS Electrical Characteristics Parameter Tester is produced by the Keithley Corporation (Cleveland, OH, USA).

2.3. Test Method

Lignin Removal Experiment

The wood specimens were subjected to a drying process in a drying oven maintained at a temperature of 105 °C for a period of 24 h. Subsequently, the wood was treated with an acidic sodium chlorite method for delignification in a water bath maintained at a temperature of 80 °C. The pH value of the 3 wt% sodium chlorite solution was adjusted to 4.5 using glacial acetic acid, and the wood was mixed with the reaction solution (mass ratio 1:40) to initiate the reaction. The reaction time was controlled at the set temperature and time, with six groups of experimental times (2, 4, 6, 8, 10, and 12 h) designed to control Mongolian Scotch Pine and Paulownia, respectively. The treatment solution was replaced at 6 h intervals. At the conclusion of the treatment, the samples were subjected to three rinses with a solution of anhydrous ethanol and water (mass ratio 1:1) [8], followed by a neutralization wash with distilled water. Thereafter, the samples were freeze-dried and processed to yield delignified samples (DW) at the designated reaction times, designated as M-DW-x and P-DW-x (x representing the reaction time).

2.4. Testing and Characterization

2.4.1. Determination of Lignin Content and Removal Rate

The determination of lignin content is conducted by the national standard GB/T 2677.8-1994, titled “Determination of acid-insoluble lignin content of paper raw materials” [9]. This is achieved through the application of Formulas (1) and (2), which are used to ascertain the lignin removal rate.
Am is the lignin content of the sample (%); Mm1 is the mass of the adiabatic ash and filter paper (g); Mm0 is the mass of the adiabatic filter paper (g); and M0 is the mass of the weighed adiabatic sample (g).
A m = M m 1   M m 0 M 0 × 100 %
A mT = A m 0 A m 1 A m 0 × 100 %
where AmT is the lignin removal rate (%) of the sample; Am0 is the lignin content (%) of the unlignified sample; and Am1 is the lignin content (%) of the delignified sample.

2.4.2. Determination of Dielectric Properties

The test employed the 4200A-SCS electrical characteristic parameter tester to assess the dielectric properties of DW samples at a frequency range of 103–107 Hz. This enabled the determination of the dielectric constant (ε′) and dielectric loss tangent (tanδ) of the samples, as well as the construction of electrical conductivity (σ) curves with varying frequencies.
By determining the capacitance value (Cp) and loss angle tangent (tanδ) of different DW materials, their dielectric constants (ε′) and dielectric loss angle tangent (tanδ) can be calculated using Equations (3) and (4). The conductivity is known to have a certain correlation with the relative dielectric loss of the medium [10]. Its value is obtained according to Equation (5), which is calculated by repeating the readings three times and taking the average value for plotting. Figure 1 shows the flow chart of one of the lignin removal and dielectric testing experiments.
ε = t α × C p S × ε 0
where tα average thickness of the material (m); Cp capacitance value (F); S electrode area (m2); and ε0 vacuum capacitance (8.854 × 10⁻¹² F/m).
tan δ = C p 0 C p 0   C p 1 × tan δ 1   tan δ 0
where capacitance value (F) before Cp0 is put into DW; capacitance value (F) after Cp1 is put into DW; tangent of loss angle after tanδ1 is put into DW; and tangent of loss angle before tanδ0 is put into DW.
σ = ε 0 × ε × ω × tan δ
where σ is the conductivity, S/m; ω is the angular frequency (rad/s); ω = 2πf, f is the frequency (Hz); ε0 vacuum capacitance (8.854 × 10⁻¹² F/m); and ε′ is the dielectric constant of the medium.

3. Results and Analysis

3.1. Influence of Different Reaction Times on the Morphology Analysis of DW

To confirm the effect of lignin removal time on the surface structure and hollow pore cavity size of the wood, samples were obtained from the physical and SEM tests, the results of which are presented in Figure 2, Figure 3 and Figure 4.
As illustrated in Figure 2, the oxidation of the carbonyl group and quinone-type structure of the lignin side chain [11] by chlorite during delignification results in the destruction of the chromophore group, leading to the bleaching of the DW samples. The color of the samples tends to become increasingly pure white with an extended delignification reaction time.
Despite the differing wood species, the same result is observed in Figure 3 and Figure 4. As the removal time increases, the lignin gradually decreases, and the thickness of the cell wall gradually becomes thinner, resulting in wrinkles. This indicates a reduction in the mechanical support capacity of the wood, which proves the success of the removal of lignin and other chemical constituents. However, when the reaction time was approximately 12 h, as illustrated in Figure 2 and Figure 4, it became evident that the M-DW-12 and P-DW-12 samples exhibited a phenomenon of sparsification, which resulted in the inability to maintain their original morphology.

3.2. Effects of Different Reaction Times on Changes in Lignin Content

To investigate the effect of different reaction times on the removal of lignin from DW samples, the lignin content and lignin removal rate were calculated according to the method described in Section 2.4.1, as illustrated in Figure 5, and analyzed in conjunction with Section 3.1.
The analysis of Figure 5 demonstrates that the lignin content of the samples exhibited a gradual decline with the extension of reaction time when comparing different tree species. Upon increasing the reaction time from 0 h to 10 h, it was observed that the lignin content of M decreased from 30.63% to 7.91% while that of P declined from 27.45% to 5.93%. Notably, the lignin content of M was consistently higher than that of P throughout the treatment period. As the reaction time approached 12 h, the difference in lignin content within the M-DW and P-DW samples was not significantly closer to approximately 4.89%, and the lignin removal rate was approximately 82.5%, which is in close alignment with the conclusions drawn in the study of transparent wood [12].
It can thus be concluded that when the reaction time of the removal process is 10 h, the lignin in M and P is essentially removed while maintaining the basic form. Consequently, the DW samples with a reaction time of 0–10 h were selected for the dielectric characterization experiments.

3.3. Effect of Different Reaction Times on the Molecular Structure of Wood

As indicated in Section 3.2, the lignin content within M and P is observed to decrease with the prolongation of removal time. To examine the alterations in chemical functional groups, FT-IR was employed to analyze the chemical composition of M and P before and after the removal treatment. The results are illustrated in Figure 6, and the corresponding attribution of their infrared absorption signals is presented in Table 1.
As illustrated in Figure 6, an increase in removal time has been observed to result in a reduction in the intensity of characteristic peaks associated with certain lignin components in M and P. This phenomenon can be observed in Figure 6b in the case of M at 1450 cm−1 and 1312 cm−1, which correspond to the benzene ring carbon skeleton vibration [13] and aliphatic methyl vibration [14], respectively. Despite this reduction in intensity, the position of these peaks remains unaltered. Figure 6d demonstrates that the intensity of the benzene ring backbone vibration and aliphatic methyl group in P at 1509 and 1313 cm−1 is slightly weakened, which corroborates the effective removal of lignin during the removal process. This finding aligns with the analysis results presented in Section 3.2. However, the intensity of the characteristic peaks of some lignin is observed to undergo an enhancement trend. This is exemplified by the C-H absorption peaks corresponding to the benzene ring conjugate group -C=O and the aliphatic upper ether hydroxyl group at 1593, 1369, and 1104 cm−1 for M, which exhibit a slight increase in the intra-benzene ring -CH telescoping vibration [15,16,17].
Additionally, the characteristic peaks of 1593, 1367, and 1106 cm−1 for P display a similar trend. Similarly, the stretching vibration caused by the -C=O [18] conjugate group at 1593 cm−1 for P exhibited an initial increase, followed by a decline. This phenomenon may be attributed to the disruption of the covalent bond-bound connections between lignin during its removal, while the molecular weight of lignin [19] is negatively correlated with the content of polar functional groups. The intermolecular forces the strength of the conjugation, and the removal of the lignin results in a significant number of conjugated groups being exposed. However, a portion of the lignin remains in the DW-10 sample, resulting in an elevated trend in the intensity of the characteristic peak at 1730 cm−1, which represents the non-conjugated C=O stretching vibrational peaks.
As the lignin content decreases, the cellulose characteristic peaks [20,21,22] in Figure 6a,b, such as M around 2883, 1418, and 877 cm−1, become increasingly prominent. This indicates that the cellulose content within the DW sample is elevated. Furthermore, the peak strengths of cellulose characteristic peaks representing -OH, -C-O, and -C-O-C bonds [23,24,25] also demonstrate an enhanced trend, as evidenced by the elevated trend of P in Figure 6c,d.

3.4. Effect of Different Reaction Times on the Dielectric Properties of Wood

The presence of lignin polymers’ aromatic multifunctional groups, coupling systems, and highly reactive groups indicates that they have certain electrical conductivity. Meanwhile, lignin’s polar functional groups (phenolic and aliphatic hydroxyl, carbonyl, and carboxyl groups) [19] undergo dipole polarization under the action of the electric field. This results in the removal of a large amount of lignin and an increase in the relative content of cellulose in the DW samples. This is combined with Section 3.3, which indicates that, with the increase of the removal time, the lignin benzene ring skeleton vibration is weakened, the relative content of phenolic hydroxyl, phenylmethyl, and conjugated, non-conjugated carbonyl and other functional group changes, and the cellulose of the secondary hydroxyl and primary hydroxyl and other reactive groups is “exposed”. This is combined with Section 3.3. It can thus be concluded that the removal experiment has a discernible impact on the dielectric properties of the DW samples. The dielectric constant (ε′), the dielectric loss tangent (tanδ), and the conductivity (σ) of the M-DW and P-DW at varying frequencies (F) and under adiabatic conditions for different removal times were measured and calculated using the 4200A-SCS Electrical Characteristics Tester, as illustrated in Figure 7, Figure 8 and Figure 9.
Figure 7 illustrates the frequency dependence of ε′ (ω) and tanδ (ω) at varying removal times. As can be observed in Figure 7a,b, the dielectric constant ε′ demonstrates an increase with the progression of removal time within the frequency range of 103–107 Hz. Further analysis of the trend of the ε′ value versus the lignin removal rate at 10 MHz can be seen in Figure 9a, which demonstrates that the ε′ value varies roughly linearly with the lignin removal rate. The outcomes of this examination are in close alignment with the statistical data for natural wood and the internal chemical constituents (lignin and cellulose) presented in Table 2. This may be attributed to the fact that as the ‘package’ of lignin is disrupted, its covalent bonds are interwoven with each other and its condensed structure is compromised [26], and the relative number of lignin’s polar groups (phenolic and aliphatic hydroxyl, carbonyl, and carboxyl) increases, and its cellulosic surface is damaged. The relative number of lignin functional groups (phenolic and aliphatic hydroxyls, carbonyls, and carboxyls) increases, as does the proportion of its cellulose surface active groups (sec-hydroxyls and primary hydroxyls). Additionally, the number of polaritons increases, while the intermolecular hydrogen bonding network is weakened, resulting in an increase in the dipole moment of the molecules and the formation of a new polar region [27]. Consequently, ε′ also rises. The slope [d(lgσ)/d(lgω)] calculated from the frequency dependence of σ(ω) (Figure 8) indicates that the K value decreases with the increase of the removal time. This phenomenon can be attributed to the electric field dissociation of polar groups within the wood. The pKa values associated with the main types of phenolic structures, namely those with conjugated, non-conjugated carbonyls, and condensed structures, are 7.7, 9.9, and 12.0 units [28], respectively. Similarly, the pKa values pertaining to the main types of alkane structures, which include sec-hydroxyl and primary hydroxyl groups, are 15.5 and 15.9 units, respectively. Furthermore, it is demonstrated that in electric field polarization, the main source of polariton change is the dipole undergoing polarization in the early stage, which is mainly lignin. With the increase in the removal time, the dipole is mainly supplied by the hydroxyl group of cellulose.
Concurrently, the value of ε′ diminishes in conjunction with an increase in F. As the removal time and lignin removal degree increase, the trend of ε′ becomes more pronounced. This may be attributed to the alternating electric field, which primarily affects wood internally through orientation polarization. However, orientation polarization requires a period to reach its maximum value under the corresponding electric field. The orientation movement of the polarizers cannot keep pace with the changing electric field, leading to a reduction in polarization and, consequently, a decline in ε′.
The dipole of the wood undergoes orientational polarization, which has a time scale for the response of the alternating electric field. This is due to the internal friction and mutual interaction of the dipoles during their movement, which results in a loss effect on the energy of the electric field. This phenomenon is responsible for the production of chirality. Figure 7c,d illustrates that in the frequency range of 103–105 Hz, the value of tanδ decreases with the increase of F, and in the range of 105–107 Hz, the value of tanδ gradually flattens out. It may be postulated that as the frequency of the electric field increases [29], the orientation of the dielectric dipole moment lags behind the change in the electric field. Consequently, the dielectric’s orientation polarization is unable to keep pace with the electric field response, resulting in a stabilization of the dielectric’s orientation movement at high frequencies. Consequently, tanδ demonstrates a declining and subsequently stabilizing trajectory.
A comparison of the changes in tanδ following the removal of different quantities of material revealed a trend whereby the value of tanδ initially increased and then decreased with the prolongation of the removal time. A further analysis of the trend of the tanδ value and lignin removal rate at 10 MHz is provided in Figure 9b. About Mongolian scotch pine, the trend of tanδ was observed to increase in the range of 0%–15.98% with the increase of the lignin removal rate and to decrease in the range of 15.98%–74%. The tanδ value of the M-DW sample was larger than that of the untreated material of M-DW-0 until 61.64%. For Paulownia, tanδ tends to increase in the range of 0-13.5% and decrease in the range of 13.5-78.48%. However, it should be noted that this is only the case at P-DW-2, where the value of tanδ is observed to deviate from the norm. The delta value is greater than that of P-DW-0, with the test results being in close alignment with the statistical outcomes for the tanδ of medium natural wood with an internal chemical composition (cellulose) as presented in Table 2. However, only for P-DW-2 was the tanδ value greater than that of P-DW-0. This phenomenon may be attributed to the sodium chlorite method employed for the removal of lignin from wood, which destroys the condensation structure of lignin. Concurrently, the number of polar groups, comprising phenolic hydroxyl, carbonyl, and carboxyl, in lignin is increased. Additionally, the van der Waals and electrostatic forces of the condensation structure are weakened [30], thereby enhancing the freedom of the polar groups in the electric field polarization response. Consequently, during the initial stages of the removal experiments, tanδ exhibits an upward trend. However, with the prolongation of the removal process, the lignin content in the DW samples diminished, accompanied by a reduction in the number of polar groups in lignin. During this period, tanδ exhibited a downward trajectory, while the lignin content declined and the cellulose content increased, with the primary polarization remaining concentrated in the neutral hydroxyl and primary hydroxyl of cellulose, along with other polar groups. Consequently, the tanδ value remained elevated in comparison to that of the untreated material, DW-0. As the removal experiment continues, the cellulose amorphous zone decreases while DW crystallinity increases. The crystallinity of M-DW-10 (50.63%) is greater than that of DW-0 (32.85%), while that of P-DW-10 (52.43%) is greater than that of P-DW-0 (35.31%). The hydroxyl group at the crystalline zone is subjected to the action of hydrogen bonding, which restricts its polarization response and causes a decreasing trend in tanδ. Concurrently, the removal of substantial quantities of lignin from the sample results in a reduction in density. The correlation between tanδ and density, as demonstrated in reference [31], is positive. The removal of lignin leads to a decrease in DW density, which in turn causes a reduction in tanδ.
Table 2. Comparison of the results of tests on the dielectric parameters of the different components within the wood under different reports.
Measuring MaterialsTest ConditionDielectric Constant (Ε′)Dielectric Loss (Ε″)Dielectric Loss Angle Tangent (TanΔ)Source
Natural wood Keranji
NaOH-treated Keranji
Frequency (Hz)Natural wood low frequency: 2.56
NaOH-treated LF: 4.63.
Natural wood low frequency: low frequency; 0.57
High frequency: 0.08
NaOH treated
Low frequency: 0.74
High frequency: 0.092
-[32]
Natural wood
Bubinga wood
Different test directions
8.2–12.4 GHz
X:2.691
Y:2.767
Z:3.270
X:0.2958
Y:0.2173
Z:0.4941
-[33]
Norway spruce,
Juniper,
Aspen
10−2–107 HzN:1.425–1.375
J:1.6–1.41
A:1.36–1.30
-N:0.06–0.002
J:0.01–0.007
A:0.1–0.0001
[34]
celluloseFrequency (Hz)5.9–7.5 tanδ less than 0.1[35]
Cellulose crystals Iα and IβDifferent XC generalized computational fitsIα: 0.6~0.75
Iβ: 0.7~0.95
--[5]
lignin10−1~107 Hz2.2–2.91.5–0.6-[36]
CMC composite film
CMC-lignin composite film
103–106 HzCMC:5.1–4.2
CMC-lingin:5.8–4.6
--[37]
chemically
modified kraft lignin
105 Hz
80–240 °C
0.31–0.12
4.2–2.1
Tanδ
ML:0.4–0.15
[38]

4. Conclusions and Prospects

The lignin content of the wood is the primary factor influencing its dielectric properties. This paper investigates the effect of post-delignification wood samples with varying degrees of delignification on the dielectric properties of wood, specifically the effect on the dielectric constant (ε′) and the dielectric loss factor (tanδ).
(1)
As the removal time is increased, the lignin content in the wood decreases, the lignin removal rate rises, reaching approximately 82.5%, and the intensity of the lignin benzene ring skeleton vibration characteristic peaks decreases, while the intensity of the phenol hydroxyl, hydroxyl, carbonyl, and carboxyl characteristic peaks is generally elevated.
(2)
As the rate of lignin removal increases, the value of ε′ varies in a roughly linear fashion with the lignin removal rate, with tanδ exhibiting an initial upward trend followed by a downward trend.
(3)
Further discussion is required regarding the relationship between the dielectric properties of electrical parameters and sample internal lignin content, as well as changes in the latter. It is yet unclear which ε′ and tanδ are affected by changes in chemical composition. While it has been proposed that the main polarization group number and degrees of freedom are restricted, the dielectric chirp mechanism of different polarity groups at different frequencies has not been sufficiently analyzed. To gain insight into the differing polarity groups in the AC electric field with a specific orientation, it is essential to consider the changes in ε′ and tanδ as a consequence of the combined influence of multiple factors. Further studies are required to elucidate the changing law of dielectric properties in Mongolian Scotch Pine and Paulownia.

Author Contributions

H.X.: writing—original draft. F.Q.: writing—review and editing. W.H.: writing—review and editing. Z.X.: methods, validation methods, validation. All authors have read and agreed to the published version of the manuscript.

Funding

Capacity Building Project for Key Laboratories in the Inner Mongolia Autonomous Region (BR221017).

Institutional Review Board Statement

This study did not involve experiments using human tissue.

Informed Consent Statement

Not applicable.

Data Availability Statement

The original codes and data used to support the findings of this study are available from the corresponding author upon request.

Conflicts of Interest

The authors declare that they have no known competing financial interests or personal relationships that could have appeared to influence the work reported in this paper.

Abbreviations

AbbreviationsItems
DWDelignified wood
FSPCellulose saturation point
MCMoisture content
MPinus sylvestris Linn. var. mongolica Litv
PPaulownia fortunei (Seem.) Hemsl
ε′Dielectric constant
tanδDielectric loss angle tangent
σElectrical conductivity

References

  1. O’Dea, R.M.; Willie, J.A.; Epps, T.H. 100th Anniversary of Macromolecular Science Viewpoint: Polymers from Lignocellulosic Biomass. Current Challenges and Future Opportunities. ACS Macro Lett. 2020, 9, 476–493. [Google Scholar] [CrossRef] [PubMed]
  2. Mittal, N.; Ansari, F.; Gowda, V.K.; Brouzet, C.; Chen, P.; Larsson, P.T.; Roth, S.V.; Lundell, F.; Wågberg, L.; Kotov, N.A.; et al. Multiscale Control of Nanocellulose Assembly: Transferring Remarkable Nanoscale Fibril Mechanics to Macroscale Fibers. ACS Nano 2018, 12, 6378–6388. [Google Scholar] [CrossRef]
  3. Kumar, A.; Jyske, T.; Petrič, M. Delignified Wood from Understanding the Hierarchically Aligned Cellulosic Structures to Creating Novel Functional Materials: A Review. Adv. Sustain. Syst. 2021, 5, 2000251. [Google Scholar] [CrossRef]
  4. Sharma, V.; Tsai, M.-L.; Nargotra, P.; Chen, C.-W.; Sun, P.-P.; Singhania, R.R.; Patel, A.K.; Dong, C.-D. Journey of Lignin from a Roadblock to Bridge for Lignocellulose Biorefineries: A Comprehensive Review. Sci. Total Environ. 2023, 861, 160560. [Google Scholar] [CrossRef] [PubMed]
  5. Yaadav, A.; Boström, M.; Malyi, O. Understanding of Dielectric Properties of Cellulose. Cellulose 2024, 31, 2783–2794. [Google Scholar] [CrossRef]
  6. Gu, Y.; Wang, D.; Gao, Y.; Yue, Y.; Yang, W.; Mei, C.; Xu, X.; Xu, Y.; Xiao, H.; Han, J. Solar-Powered High-Performance Lignin-Wood Evaporator for Solar Steam Generation. Adv. Funct. Mater. 2023, 33, 2306947. [Google Scholar] [CrossRef]
  7. Lunev, I.; Greenbaum (Gutina), A.; Feldman, Y.; Petrov, V.; Kuznetsova, N.; Averianova, N.; Makshakova, O.; Zuev, Y. Dielectric Response of Hydrated Water as a Structural Component of Nanofibrillated Cellulose (NFC) from Different Plant Sources. Carbohydr. Polym. 2019, 225, 115217. [Google Scholar] [CrossRef]
  8. Zhu, S.; Biswas, S.K.; Qiu, Z.; Yue, Y.; Fu, Q.; Jiang, F.; Han, J. Transparent Wood-Based Functional Materials via a Top-down Approach. Prog. Mater. Sci. 2023, 132, 101025. [Google Scholar] [CrossRef]
  9. Qin, J.; Li, X.; Shao, Y.; Shi, K.; Zhao, X.; Feng, T.; Hu, Y. Optimization of Delignification Process for Efficient Preparation of Transparent Wood with High Strength and High Transmittance. Vacuum 2018, 158, 158–165. [Google Scholar] [CrossRef]
  10. Dhatarwal, P.; Sengwa, R.J. Polymer Compositional Ratio-Dependent Morphology, Crystallinity, Dielectric Dispersion, Structural Dynamics, and Electrical Conductivity of PVDF/PEO Blend Films. Macromol. Res. 2019, 27, 1009–1023. [Google Scholar] [CrossRef]
  11. Wang, S.; Li, L.; Zha, L.; Koskela, S.; Berglund, L.A.; Zhou, Q. Wood Xerogel for Fabrication of High-Performance Transparent Wood. Nat. Commun. 2023, 14, 2827. [Google Scholar] [CrossRef] [PubMed]
  12. Li, Y.; Fu, Q.; Yang, X.; Berglund, L. Transparent Wood for Functional and Structural Applications. Phil. Trans. R. Soc. A 2018, 376, 20170182. [Google Scholar] [CrossRef] [PubMed]
  13. Seki, M.; Yashima, Y.; Abe, M.; Miki, T.; Nishida, M. Influence of Delignification on Plastic Flow Deformation of Wood. Cellulose 2022, 29, 4153–4165. [Google Scholar] [CrossRef]
  14. Ou, J.; Hu, S.; Yao, L.; Chen, Y.; Qi, H.; Yue, F. Simultaneous Strengthening and Toughening Lignin/Cellulose Nanofibril Composite Films: Effects from Flexible Hydrogen Bonds. Chem. Eng. J. 2023, 453, 139770. [Google Scholar] [CrossRef]
  15. Kolya, H.; Kang, C.-W. Oxidation Treatment on Wood Cell Walls Affects Gas Permeability and Sound Absorption Capacity. Carbohydr. Polym. 2022, 276, 118874. [Google Scholar] [CrossRef]
  16. Kolya, H.; Kang, C.-W. Effective Changes in Cellulose Cell Walls, Gas Permeability and Sound Absorption Capability of Cocos Nucifera (Palmwood) by Steam Explosion. Cellulose 2021, 28, 5707–5717. [Google Scholar] [CrossRef]
  17. Liu, R.; Smeds, A.; Tirri, T.; Zhang, H.; Willför, S.; Xu, C. Influence of Carbohydrates Covalently Bonded with Lignin on Solvent Fractionation, Thermal Properties, and Nanoparticle Formation of Lignin. ACS Sustain. Chem. Eng. 2022, 10, 14588–14599. [Google Scholar] [CrossRef]
  18. Qi, Y.; Zhou, Z.; Xu, R.; Dong, Y.; Zhang, Z.; Liu, M. Effect of NaOH Pretreatment on Permeability and Surface Properties of Three Wood Species. ACS Omega 2023, 8, 40362–40374. [Google Scholar] [CrossRef]
  19. Li, C.; Yue, J.; Wang, B.; Tao, Y.; Hu, J.; Lu, J.; Du, J.; Wang, H. Unveiling the Mechanism of Lignin Nanofiller in Boosting the Performance of Triboelectric Nanogenerators. Nano Energy 2024, 126, 109631. [Google Scholar] [CrossRef]
  20. Mudedla, S.K.; Vuorte, M.; Veijola, E.; Marjamaa, K.; Koivula, A.; Linder, M.B.; Arola, S.; Sammalkorpi, M. Effect of Oxidation on Cellulose and Water Structure: A Molecular Dynamics Simulation Study. Cellulose 2021, 28, 3917–3933. [Google Scholar] [CrossRef]
  21. Liu, Y.; Chen, B.; Lv, Y.; Ye, X.; Lin, C.; Liu, M. Insight into the Performance of Lignin-Containing Cellulose Nanofibers (LCNFs) via Lignin Content Regulation by p-Toluenesulfonic Acid Delignification. Cellulose 2022, 29, 2273–2287. [Google Scholar] [CrossRef]
  22. Wang, K.; Dong, Y.; Ling, Z.; Liu, X.; Shi, S.Q.; Li, J. Transparent Wood Developed by Introducing Epoxy Vitrimers into a Delignified Wood Template. Compos. Sci. Technol. 2021, 207, 108690. [Google Scholar] [CrossRef]
  23. Tang, Z.; Li, W.; Lin, X.; Xiao, H.; Miao, Q.; Huang, L.; Chen, L.; Wu, H. TEMPO-Oxidized Cellulose with High Degree of Oxidation. Polymers 2017, 9, 421. [Google Scholar] [CrossRef] [PubMed]
  24. Goldhahn, C.; Schubert, M.; Lüthi, T.; Keplinger, T.; Burgert, I.; Chanana, M. Wood–Gelatin Bio-Composite Membranes with Tunable Flux. ACS Sustain. Chem. Eng. 2020, 8, 7205–7213. [Google Scholar] [CrossRef]
  25. Dong, T.; Chen, W.; Cai, C.; Bai, F.; Zhou, Z.; Wang, J.; Li, X. Water-Stable, Strong, Biodegradable Lignocellulose Straws Replacement for Plastic Straws. Chem. Eng. J. 2023, 451, 138970. [Google Scholar] [CrossRef]
  26. Yang, C.; Magallanes, G.; Maldonado, S.; Stephenson, C.R.J. Electro-Reductive Fragmentation of Oxidized Lignin Models. J. Org. Chem. 2021, 86, 15927–15934. [Google Scholar] [CrossRef]
  27. Zhang, P.; Huang, H.; Wang, X.; Cai, K.; Chen, J.; Xu, Y.; Yu, F.; Nie, S.; Wang, S.; Liu, X. Anti-Moisture, Anti-Bacterial Cellulosic Triboelectric Materials Enabled by Hydroxyl Coordination Effect. Nano Energy 2024, 124, 109472. [Google Scholar] [CrossRef]
  28. Bogolitsyn, K.G.; Khviuzov, S.S.; Gusakova, M.A.; Pustynnaya, M.A.; Krasikova, A.A. The Differences between Acid–Base and Redox Properties of Phenolic Structures of Coniferous and Deciduous Native Lignins. Wood Sci. Technol. 2018, 52, 1153–1164. [Google Scholar] [CrossRef]
  29. Fares, O.; AL-Oqla, F.M.; Hayajneh, M.T. Dielectric Relaxation of Mediterranean Lignocellulosic Fibers for Sustainable Functional Biomaterials. Mater. Chem. Phys. 2019, 229, 174–182. [Google Scholar] [CrossRef]
  30. Shi, S.-C.; Chen, C.; Zhu, J.-L.; Li, Y.; Meng, X.; Huang, H.-D.; Li, Z.-M. Environmentally Friendly Regenerated Cellulose Films with Improved Dielectric Properties via Manipulating the Hydrogen Bonding Network. Appl. Phys. Lett. 2021, 119, 022903. [Google Scholar] [CrossRef]
  31. Roig, F.; Ramanantsizehena, G.; Lahatra Razafindramisa, F.; Dantras, E.; Dandurand, J.; Hoyet, H.; Bernés, A.; Lacabanne, C. Dielectric and Mechanical Properties of Various Species of Madagascan Woods. Wood Sci. Technol. 2017, 51, 1389–1404. [Google Scholar] [CrossRef]
  32. Jayamani, E.; Rahman, M.R.; Hamdan, S.; Kyari, M.I.; Bin Bakri, M.K.; Sanaullah, K.; Khan, A. Dielectric Properties of Natural Borneo Woods: Keranji, Kayu Malam, and Kumpang. BioRes 2020, 15, 7815–7827. [Google Scholar] [CrossRef]
  33. Bossou, O.V.; Mosig, J.R.; Zurcher, J.-F. Dielectric Measurements of Tropical Wood. Measurement 2010, 43, 400–405. [Google Scholar] [CrossRef]
  34. Albornoz-Palma, G.; Ortega-Sanhueza, I.; Teruel-Juanes, R.; Henríquez-Gallegos, S.; Ribes-Greus, A.; Pereira, M. Effect of Lignin on the Morphological, Rheological, and Dielectric Characteristics of Lignocellulose Nanofibrils from Pinus Radiata. Ind. Crops Prod. 2023, 204, 117323. [Google Scholar] [CrossRef]
  35. Luo, Q.; Shen, H.; Zhou, G.; Xu, X. A Mini-Review on the Dielectric Properties of Cellulose and Nanocellulose-Based Materials as Electronic Components. Carbohydr. Polym. 2023, 303, 120449. [Google Scholar] [CrossRef]
  36. Khviyuzov, S.S.; Volkov, A.S. Influence of Ionic Impurities on the Dielectric Properties of Lignin. Polym. Adv. Technol. 2024, 35, e6467. [Google Scholar] [CrossRef]
  37. Chen, W.; Li, C.; Tao, Y.; Lu, J.; Du, J.; Wang, H. Modulating Spatial Charge Distribution of Lignin for Eco-Friendly and Recyclable Triboelectric Nanogenerator. Nano Energy 2023, 116, 108802. [Google Scholar] [CrossRef]
  38. Culebras, M.; Sanchis, M.J.; Beaucamp, A.; Carsí, M.; Kandola, B.K.; Horrocks, A.R.; Panzetti, G.; Birkinshaw, C.; Collins, M.N. Understanding the Thermal and Dielectric Response of Organosolv and Modified Kraft Lignin as a Carbon Fibre Precursor. Green Chem. 2018, 20, 4461–4472. [Google Scholar] [CrossRef]
Figure 1. Flow chart of the experiment.
Coatings 14 01421 g001
Figure 2. Physical map of samples from 0–12 h of the Mongolian scotch pine and paulownia removal experiments.
Coatings 14 01421 g002
Figure 3. Changes in the cross-section of 0–4 h of the Mongolian scotch pine and paulownia removal experiment. (a) M-DW-0; (b) M-DW-2; (c) M-DW-4; (d) P-DW-0; (e) P-DW-2; (f) P-DW-4.
Coatings 14 01421 g003
Figure 4. Cross-sectional variation of the Mongolian scotch pine and paulownia removal experiments for 6–10 h. (a) M-DW-6; (b) M-DW-8; (c) M-DW-10; (d) P-DW-6; (e) P-DW-8; (f) P-DW-10.
Coatings 14 01421 g004
Figure 5. Changes in lignin content and lignin removal rate from 0–12 h in the removal experiments of Mongolian scotch pine and paulownia. (a) Lignin content; (b) Lignin removal rate.
Coatings 14 01421 g005
Figure 6. Infrared spectra of Mongolian scotch pine and paulownia before and after removal experiments. (a) M; (b) M in the range of 2000–1000 cm−1; (c) P; (d) P in the range of 2000–1000 cm−1.
Coatings 14 01421 g006
Figure 7. Variation of ε′ and tanδ of DW samples of Mongolian scotch pine and paulownia at different F: (a) M-ε′; (b) P-ε′; (c) M-tanδ; (d) P-tanδ.
Coatings 14 01421 g007
Figure 8. Variation of σ of DW samples of Mongolian scotch pine and paulownia indicus at different F: (a) M-σ; (b) P-σ.
Coatings 14 01421 g008
Figure 9. Variation of ε′ and tanδ of DW samples of Mongolian scotch pine and Paulownia indicus at different lignin removal rates: (a) ε′; (b) tanδ.
Coatings 14 01421 g009
Table 1. Infrared absorption signal attribution of Mongolian Scotch Pine and Paulownia spp.
Mongolian Scotch Pine Absorption Signal cm−1Paulownia Absorption Signal cm−1Functional Group (Chemistry)
33233323Mainly -OH stretching vibrations in the free and bound water fractions
28712907-CH3, -CH2 stretching vibrations of cellulose
17291730-C=O stretching vibrational peaks of non-conjugated acetyl or acid groups
15931598Stretching vibrations induced by the conjugate group-C=O of lignin
15081509Lignin benzene ring backbone vibrations and -CH2 deformation vibrations
14501425Stretching vibrations of the -C=O bond of lignin with the carbon skeleton of the benzene ring
1369, 13121367, 1313C-H absorption peaks of aliphatic methyl and ether hydroxyl groups
12661244Characteristic -C-O and -C-C peaks of hemicellulose acetyl, sugar carbonyl ester groups
12031202Mainly includes -C-H in-plane bending vibration and -C-O telescopic vibration
11571158Stretching vibrations of the -C-O bond of cellulose
11041106Intra-lignin benzene ring -CH stretching vibrations
1056, 10291054, 1027Vibrations induced by -C-O-C and -C=O of cellulose and hemicellulose
1418, 877891β-glycosidic bond vibrations of cellulose stretching vibrations of glycosidic bonds
Disclaimer/Publisher’s Note: The statements, opinions and data contained in all publications are solely those of the individual author(s) and contributor(s) and not of MDPI and/or the editor(s). MDPI and/or the editor(s) disclaim responsibility for any injury to people or property resulting from any ideas, methods, instructions or products referred to in the content.

