Abstract
Nanocrystalline metals possessing excellent mechanical strength have great potential to replace traditional metal materials as structural materials, but their poor resistance to creep deformation seriously restricts their engineering applications at high temperatures. The high-temperature creep behavior of nanocrystalline Ni with different volume fractions of initial vacancies ranging from 0% to 10% was studied systematically by molecular dynamics simulation in this study. The results showed that the steady-state creep displacement first increased and then decreased with increasing initial vacancy concentration, reaching the maximum when the initial vacancy concentration was 6%. The microstructural characteristics, such as quantity increment and distribution of the vacancies, the number and types of dislocations, and shear strain distribution during creeping, were analyzed in detail. The deformation-induced vacancies formed at the grain boundary (GB) in the initial creep stage, and their variation trend with the initial vacancy concentration was consistent with that of the creep displacement, indicating that the initial vacancy-dependent high-temperature creep behavior of nanocrystalline Ni was mainly determined by the rapidly increasing number of vacancies at the GB in the initial creep stage. Afterwards, the deformation-induced, vacancy-assisted 1/6{112} Shockley partial dislocation activities dominated the creep deformation of nanocrystalline Ni in the steady-state creep stage. The results can provide theoretical support for expanding the application of nanocrystalline metals from the perspective of crystal defect engineering.
1. Introduction
The mechanical properties of nanocrystalline (NC) metals are essentially different from those of traditional coarse-grained metals, mainly because the volume percentage of the grain boundary (GB) is too large to be ignored due to its nanoscale grain size. Enormous amount of research has proved the excellent room-temperature mechanical strength of nanocrystalline metals [1,2,3,4,5]. At present, the most promising application of nanocrystalline metals in mechanics is as a surface layer, possessing unique and excellent properties that traditional bulk materials do not, such as high strength and friction resistance. In experiments, nanocrystalline metal films can be prepared on substrates using bottom-up methods, such as electrolytic deposition (EP), physical vapor deposition (PVD), chemical vapor deposition (CVD), etc. Using top-down techniques, such as severe plastic deformation (SPD), the surface of bulk materials is crushed into nanostructured crystal units to prepare macroscopic-gradient nanostructured materials. The thickness of nanocrystalline metal films prepared by the above experimental methods is generally in the range of a few micrometers to a few hundred micrometers. However, the high proportion of GBs makes nanocrystalline metals creep at even room temperature, seriously restricting their application in engineering practice despite their extremely high strength.
The creep mechanisms of NC metals have been extensively investigated through experiments [6,7] and simulations [8,9]. It has been demonstrated that the dominant creep deformation mechanism in traditional coarse-grained metal materials is applicable to nanocrystalline metals, such as dislocation glide, dislocation climb [10], and Coble creep [11]. At the same time, the unique deformation mechanisms related to GB have also been confirmed in the creep deformation mechanism of nanocrystalline metals, such as GB diffusion and GB sliding [10]. Due to the large volume fraction of GBs, the creep process of nanocrystalline metals is always accelerated in terms of dislocation evolution and atom diffusion at the GB, even at lower temperatures and holding stress levels. The creep mechanism at both the primary creep and steady-state creep stages is Coble creep controlled by GB diffusion and accompanied by dislocation nucleation, while the creep mechanism at the tertiary creep stage is not only controlled by GB diffusion based on Coble creep but also controlled by Nabarro–Herring creep via lattice diffusion [12,13].
Point defects, which have a great impact on the mechanical properties and plastic deformation of nanocrystalline metals, have also been studied [14]. It was found that the yield stress and fracture stress for nanocrystalline Ni containing more vacancies were lower than those for the one containing fewer vacancies, and an increase in GB energy due to vacancies in the GB was suggested to enhance GB fracture. Generally, injection of point defects in the form of vacancies can enhance the diffusional plasticity of nanocrystalline metals. For example, vacancy-enhanced plasticity through higher atomic diffusivity at the GBs was revealed in pristine and irradiated nanocrystalline zirconium samples during tensile response [15]. If the vacancy has such a great influence on the strength and plasticity of nanocrystalline metals, it can be inferred that the vacancy will also have a critical influence on the creep behavior and the corresponding creep mechanisms of nanocrystalline metals. At present, the influence of vacancy concentration and distribution on the creep behavior of NC metals is not completely clear. The extent to which the vacancy can affect the deformation mechanism of creep is worth exploring.
Molecular dynamics (MD) simulation can provide new and complementary insights into the deformation mechanism during different stages of creep deformation for nanocrystalline metals. Although MD simulation suffers from the limitation of the relatively short time scale and insufficient model size, EAM potential can still be successfully applied to the simulation of vacancy and dislocation activity in metals [16,17], and the characteristics of the obtained creep curve are the same as the three stages of actual creep: initial creep, stable creep, and accelerated creep [18,19,20,21,22]. In addition, the deformation mechanism has also been noted to be consistent with the actual high-temperature creep mechanism [23,24,25]. Pure crystalline Ni, which possesses a face-centered cubic (FCC) crystal structure and has strong solid solution ability [26,27,28], is a typical material to explore the creep deformation mechanism of nanocrystalline metals. The influence of initial vacancy concentration on the creep deformation mechanism of nanocrystalline Ni was analyzed through MD simulation in this study. Creep displacements were found to be closely related to the initial vacancy concentration, reaching the largest value at the initial vacancy concentration of 6%. The number and distribution of new vacancies during deformation and the number and types of dislocations were analyzed to reveal the creep deformation mechanism of nanocrystalline Ni with initial vacancies. Discussion on the creep deformation mechanism of nanocrystalline Ni with initial vacancies will provide guidance for creep-related applications of typical FCC metals.
2. Simulation Model and Method
Nanocrystalline Ni models with a mean grain size of 3 nm were constructed based on Voronoi tessellation using the ATOMSK software Atomsk_b0.13_Windows [29]. The configuration of the models was a cubic structure of 15 × 15 × 15 nm3, as shown in Figure 1a. Nanocrystalline Ni models containing different volume fraction of initial vacancies ranging from 0% to 10% (0%, 0.1%, 1%, 2%, 3%, 4%, 5%, 6%, 7%, 8%, 9%, and 10%) were created by randomly removing certain fractions of atoms in the model. In Figure 1b, a model with initial vacancy concentration of 1% is shown, with the blue dots representing the coordinates of the deleted atomic sites. The assumption of vacancy concentration in the range of 10−2 in this study was mainly based on the following considerations. The equilibrium vacancy concentration can be calculated by the following equation: Cv = Aexp (−Ev/kT), where k = 1.38 × 10⁻²³ J/K, coefficient A = 1. The equilibrium vacancy concentration is exponentially related to the vacancy formation energy and temperature. The vacancy formation energy of common pure metals ranges from 0.4 to 2.0 eV, and the equilibrium vacancy concentration at 800 K can be calculated to be within the range of 10−2 to 10−8. In nanostructured metals, the formation energy of vacancies decreases with decreasing grain size, and the equilibrium vacancy concentration will correspondingly increase.
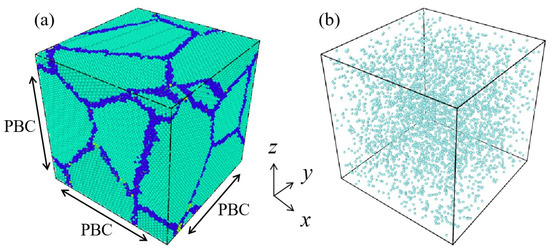
Figure 1.
(a) Nanocrystalline Ni model with mean grain size of 3 nm, where baby blue and dark blue representing the atoms inside grains and at grain boundaries, respectively. (b) Model with an initial vacancy concentration of 1%, with the blue dots representing the coordinates of the randomly deleted atomic sites.
MD simulations were performed using a large-scale atomic/molecular massively parallel simulator (LAMMPS) [30]. The interaction between Ni atoms was described using the embedded atom method (EAM) potential for Ni systems, which was developed by Etesami et al. [31]. The motion of atoms was controlled by a Nose–Hoover thermostat within the isobaric–isothermal (NPT) ensemble, and periodic boundary conditions (PBC) were applied on each direction of the models. As the degree of structural disorder increased due to the missing atoms, energy minimization and relaxation treatment at a certain temperature needed to be carried out before creep deformation in order to obtain a reasonable model. The model temperature remained unchanged after rising from 50 to 800 K within 50 fs. The loading stress of 2 GPa was applied in the Z direction and maintained at a temperature of 800 K within 500 fs.
Visualization of the microstructural evolution of each model was carried out through the software package of OVITO Ovito-basic-3.3.5-win64 [32]. Identification of point defects and dislocations was performed using Wigner–Seitz defect analysis and dislocation analysis (DXA). The plastic strain of each atom was colored by the calculated magnitude of atomic von Mises shear strain ηiMises [33,34], which has proved to be an effective parameter to characterize local atomic rearrangement.
3. Results and Discussion
3.1. Creep Behavior of Nanocrystalline Ni with Initial Vacancies
Figure 2a shows the variation in loading stress with the loading time applied on nanocrystalline Ni with different volume fractions of initial vacancies ranging from 0% to 10%. The blue region and orange region represent the loading stage and holding stage, respectively. Stress was firstly applied from 0 to 2 GPa within 50 fs and then maintained for 500 fs to obtain the creep interval of the models. Variation trends of creep displacement and creep strain rate with load holding time of the nanocrystalline Ni models are exhibited in Figure 2b,c. It can be seen that all models had two typical creep stages: the initial creep stage (that is, the deceleration creep stage) and the steady-state creep stage. In order to more intuitively show the influence of initial vacancy concentration on creep displacement, the relationship between the creep displacement and volume fraction of the initial vacancy at creep times of 50 and 200 fs is displayed in Figure 2d, representing the initial creep stage and the steady-state creep stage, respectively. It can be seen that with the increase in initial vacancy concentration, the creep displacement first remained unchanged when the initial vacancy concentration was less than 4% and then exhibited a significant increase when the initial vacancy concentration was between 4% and 6%. After that, the creep displacement decreased with further increase in the initial vacancy concentration, reaching the maximum when the initial vacancy concentration was 6%.
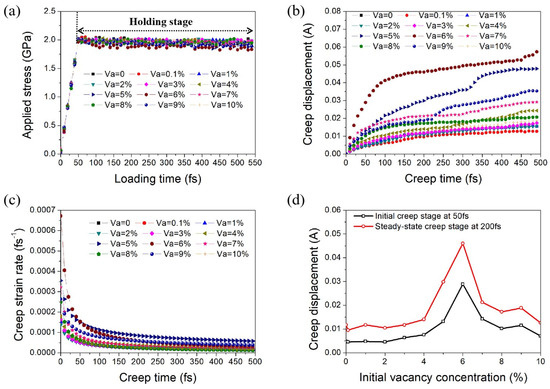
Figure 2.
(a) Different stress levels applied on nanocrystalline Ni with different volume fractions of initial vacancies with loading time. Variations in (b) creep displacement and (c) creep strain rate with time under loading stress of 2 GPa and temperature of 800 K. (d) Variation in creep displacement with initial vacancy concentration at creep times of 50 and 200 fs.
3.2. Characteristics of Deformation-Induced Vacancy Formation during Creep
The microstructures of nanocrystalline metals change dramatically during the creep process, such as the generation and annihilation of vacancies, the sliding and climbing of dislocations, and the reorganization of GBs. Here, we found that the change in the number of dynamic vacancies in nanocrystalline Ni caused by creep had an obvious characteristic. Figure 3a shows the variation trend of the increment of vacancy concentration with time for each model during the creep deformation process. The increment of vacancy concentration increased sharply at the beginning and reached the maximum in 50 fs. After that, the increment decreased rapidly and basically remained unchanged when the creep time exceeded 150 fs. In other words, the vacancy increments firstly increased to the peak value and subsequently decreased in the initial creep stage and then remained stable in the steady-state creep stage. The relationship between the maximum value of vacancy increment at creep time of 50 fs and the initial vacancy concentration of the model is shown in Figure 3b. With the increase in the volume fraction of initial vacancies, the vacancy increment during creep increased and reached the maximum at the initial vacancy concentration of 6%. After that, the vacancy increment during creep decreased as the initial vacancy concentration further increased. Interestingly, the changing trend of the maximum vacancy increment with the initial vacancy concentration of the model (as shown in Figure 3b) was basically consistent with the changing trend of creep displacement (as shown in Figure 2c).
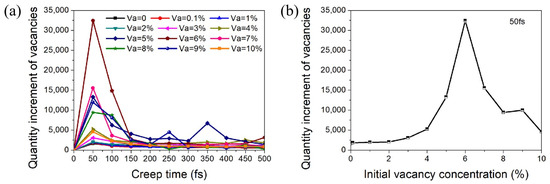
Figure 3.
(a) Variation trend of the increment of vacancy concentration with time during the deformation process of each model. (b) Variation in the quantity increment of vacancies at 50 fs with varying initial vacancy concentration.
3.3. Influence of Initial Vacancy Concentration on Dislocation-Related Activities
The effects of initial vacancy concentration on dislocation-related activities in nanocrystalline Ni were carefully examined. The correlation between the initial number of dislocations, the increment slope of the number of dislocations during creep, and the creep deformation of nanocrystalline Ni with varying initial vacancy concentrations was also analyzed.
The total number of dislocations of the nanocrystalline Ni models with different initial vacancy concentrations varied with the creep time, as shown in Figure 4a. In order to clearly clarify the changes of dislocation activity during creep, the variation trend of the number of different types of dislocations with creep time for nanocrystalline Ni with an initial vacancy concentration of 3% is shown in Figure 4b. It can be seen that 1/6{112} Shockley partial dislocations and 1/2{110} perfect dislocations accounted for the majority of the total dislocations during creep, and these kept slowly increasing during creep.
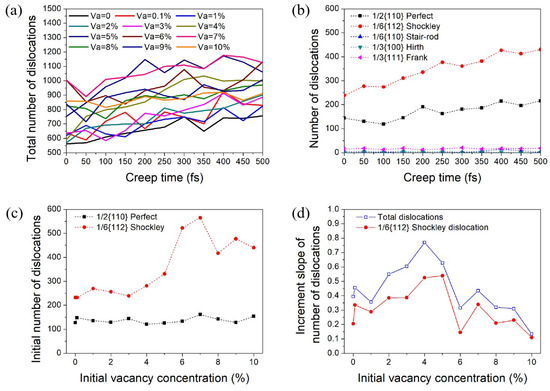
Figure 4.
(a) Variation in total number of dislocations of nanocrystalline Ni with different initial vacancy concentration with creep time. (b) Variation in the number of different dislocation types with creep time for nanocrystalline Ni with initial vacancy concentration of 3%. (c) Variation in the initial number of dislocations with initial vacancy concentration of nanocrystalline Ni models at creep time of 0 fs. (d) Variation in the increment slope of the total number of dislocations and the number of 1/6{112} Shockley partial dislocations with initial vacancy concentration of nanocrystalline Ni models during creep.
Due to the introduction of different contents of initial vacancies in nanocrystalline Ni, each model was relaxed at 50 K to ensure a stable state from the perspective of energy; subsequently, there was a certain number of initial dislocations in each model. Moreover, the loading process of each model also led to a change in the number of initial dislocations in each model. The initial number of dislocations of 1/6{112} Shockley partial dislocations and 1/2{110} perfect dislocations in nanocrystalline Ni with different initial vacancy concentration at creep time of 0 fs are displayed in Figure 4c. It can be seen that the number of 1/2{110} perfect dislocations was basically the same in nanocrystalline Ni with different initial vacancy concentrations, but the number of 1/6{112} Shockley partial dislocations increased significantly when the initial vacancy concentration was between 4% and 6% and then decreased when the initial vacancy concentration was above that.
The increment slope of the number of dislocations in the creep process can be obtained from the relationship between the number of dislocations and the creep time. The variation in the increment slope of the total number of dislocations and the 1/6{112} Shockley partial number of dislocations with initial vacancy concentration of nanocrystalline Ni in the steady-state creep stage is exhibited in Figure 4d. It was found that the increment slope of the number of dislocations firstly increased with initial vacancy concentration and then decreased, reaching the maximum when the initial vacancy concentration was about 4%. This was consistent with the significant increase in creep displacement when the initial vacancy concentration exceeded 4% (as shown in Figure 2c).
3.4. Microstructural Evolution of Nanocrystalline Ni during Creep
In order to further explore the distribution of deformation-induced vacancies that were generated during creep, the distributions of vacancy increment for nanocrystalline Ni with 1% vacancies were carefully examined. Figure 5a shows the three-dimensional distribution of the deformation-induced vacancies at creep time of 50 fs, where the vacancies are represented by orange dots. For a clear presentation, atoms of the model are removed to highlight the distribution of vacancies. It can be seen that the distribution of vacancies was not evenly distributed in the model. The distribution of the deformation-induced vacancies on the two-dimensional x = y plane is exhibited in Figure 5b,c. It can be seen that the vacancies generated in the deformation process were basically distributed along the GB, as shown by the blue dotted line along the GBs in Figure 5b. Slices with a thickness of 1 nm along the x = y plane of generated vacancies at 100, 200, 300, and 400 fs are shown in Figure 5c. With the extension of creep time, new vacancies gradually increased, which is consistent with the results in Figure 3a. The newly formed vacancies preferentially formed at the GB and in some grains with specific orientation.
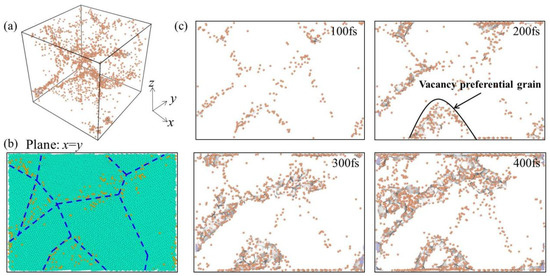
Figure 5.
(a) Three-dimensional distribution of vacancy increment at creep time of 50 fs for nanocrystalline Ni with 1% vacancies, with the orange dot corresponding to deformation-induced vacancies. (b) Distribution of vacancies in nanocrystalline Ni on the two-dimensional x = y plane, where the dark blue dotted line is along the GBs, and the baby blue dots representing the atoms inside grains. (c) Slices with a thickness of 1 nm along the x = y plane of generated vacancies at 100, 200, 300, and 400 fs.
The relationship between the distribution of deformation-induced vacancy and the concentration of initial vacancy in nanocrystalline Ni at the creep time of 50 fs is shown in Figure 6. Figure 6a–d corresponds to the initial vacancy concentrations of 0.1%, 3%, 6%, and 10%. It can be seen that the deformation-induced vacancies were still mainly distributed around the GBs. The number of deformation-induced vacancies increased with increasing initial vacancy concentration and reached the maximum when the initial vacancy was 6% at creep time of 50 fs, which is consistent with the results in Figure 3b.
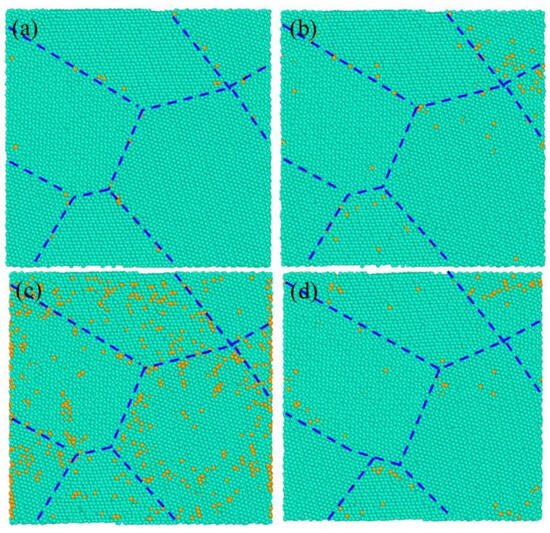
Figure 6.
The distribution of the generated vacancies during creep for nanocrystalline Ni varies with initial vacancy concentrations of (a) 0.1%, (b) 3%, (c) 6%, and (d) 10% at creep time of 50 fs, where the baby blue dots and the orange dots representing the atoms inside grains and deformation-induced vacancies, respectively, and the dark blue dotted line is along the GBs.
Generally, the increase in vacancy concentration in materials leads to a decrease in material strength and increase in plastic deformation. However, the results in Figure 5 and Figure 6 show that the increase in deformation-induced vacancy formation was mainly concentrated near the GB, and the increase of initial vacancy concentration at the GB caused the creep deformation firstly increased and then decreased. Although the initial vacancies were uniformly dispersed in the model, the vacancies produced during creep were mainly concentrated on or near the GBs. Segregation of these deformation-induced vacancies at the GBs was the main reason for the relationship between the initial vacancy concentration and the creep deformation.
To explore the reason why the vacancies generated by creep were preferentially distributed at the GB, the von Mises shear strain ηiMises of each atom was calculated to mark the areas with large local shear strain in the nanocrystalline Ni models. Shear strain distribution of nanocrystalline Ni models with initial vacancy concentration of 0.1%, 3%, 6%, and 10% at creep time of 50 fs is shown in Figure 7a–d. The local shear strain at the GB was the largest compared to that of the grain interior, that is to say, the atomic activity at the GB was more intense than that of the grain interior. In addition, there were still some regions with large local shear strain in the grain interior, which may be related to the average distribution of initial vacancy sites. It can be concluded that the generation of deformation-induced vacancies is directly related to the large atomic shear strain at the GBs.
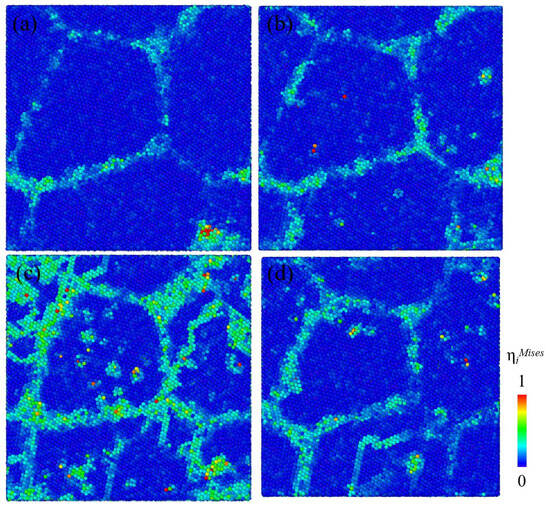
Figure 7.
Variation in shear strain distribution on the plane of x = y = 0 with initial vacancy concentration of (a) 0.1%, (b) 3%, (c) 6%, and (d) 10% at creep time of 50 fs, respectively. Atoms were all colored according to the calculated magnitude of von Mises shear strain ηiMises.
Figure 8a shows the three-dimensional dislocation spatial distribution of nanocrystalline Ni with initial vacancy concentration of 6% at 50 fs. The red dots represent the atoms of HCP structure, and the green lines represent 1/6{112} Shockley dislocations. It can be seen that 1/6{112} Shockley partial dislocation activities dominated the plastic deformation of nanocrystalline Ni. The relationship between the initial vacancy concentration and the partial dislocation activity and the reason for the creep displacement being related to the initial vacancy concentration were investigated.
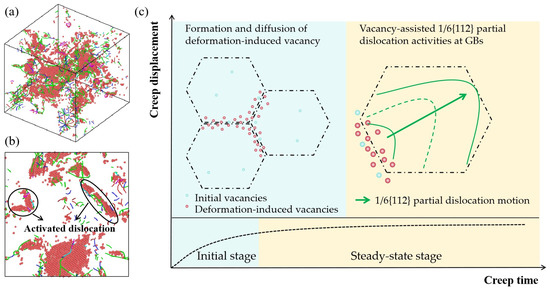
Figure 8.
(a) Dislocation distribution of nanocrystalline Ni with initial vacancy concentration of 6% at 50 fs, in which red dots represent atoms of HCP structure and green lines represent 1/6(112) Shockley dislocations. (b) The slices with a thickness of 3.4 nm cutting along the plane of x = y = 0 from (a). (c) Schematic diagram of the creep deformation mechanism of nanocrystalline Ni, where blue dots and red dots represent initial vacancies and deformation-induced vacancies, respectively. And the black dashed line and green line represent grain boundaries and dislocation lines, respectively.
Diffusion and slip are the two most important creep mechanisms. The creep mechanisms caused by intergranular dislocation slip (Weitzman creep), intergranular diffusion of vacancies (Nabarro–Herring creep) [35], and vacancy diffusion along the GB (Coble creep) [11] are all not consistent with the situation in this study. Studies have shown that GB deformations can be enhanced by vacancies in GBs because the creep rate for the vacancy-rich cell unit is more than twice that for the normal cell unit in the nanocrystalline NiW alloy [14]. The formation of deformation-induced vacancies at the GBs could be correlated with the Shockley partial dislocations and the initial vacancy concentration. As shown in Figure 3a, it can be seen that the deformation-induced vacancy increment mainly occurred in the initial stage of creep, while it was basically zero in the steady-state creep stage. According to the analysis of the number and types of dislocations during creep in Figure 4, the increment slope of the number of dislocations in the creep process was the largest at the initial vacancy concentration of 4%, and the number of initial dislocations, which was the largest with initial vacancy concentration of 6%, was positively correlated with the deformation-induced vacancy increment in the initial stage of creep.
A schematic diagram of the creep deformation mechanism of nanocrystalline Ni is shown in Figure 8c. As the structural weakest region in the crystal, the GB and initial vacancy first underwent local atomic deformation in the creep process. The initial vacancy at the GBs provided favorable conditions for the nucleation of partial dislocations during creep, while the increment of the number of dislocations could also cause the new formation of vacancies at the GBs. During creep, the partial dislocations were activated by the local larger shear strain at the GBs, and deformation-induced vacancies were consequently formed. The newly generated vacancies at the GBs further promoted the formation of partial dislocations at the GBs. This can be verified from Figure 4b, where the number of 1/6{112} Shockley partial dislocation kept increasing during both the initial creep stage and the steady-state creep stage. Vacancies can not only induce the generation of partial dislocations but also assist in the slip of partial dislocations. At high temperatures, vacancies gradually diffused into partial dislocations, and a row of atoms at the dislocation line absorbed vacancies due to thermal motion. The dislocation line moved upward by a slip plane, causing the dislocation to climb onto adjacent slip planes, thereby inducing further creep deformation. Therefore, the creep deformation mechanism of nanocrystalline Ni in the initial stage of creep was mainly dominated by the deformation-induced vacancy formation and diffusion. In the steady-state creep stage, the creep deformation mechanism of nanocrystalline Ni was dominated by the vacancy-assisted 1/6{112} Shockley partial dislocation activities at the GBs.
The initial number of dislocations increased with the increase in initial vacancy concentration before 6%. But when the concentration of initial vacancy reached a certain level, the number of dislocations reduced because a large number of vacancies connected themselves to coordinate plastic deformation. The number of deformation-induced vacancies with initial vacancy concentration of 6% was the maximum. Stress caused a difference in vacancy concentration, and atoms diffused from high concentration to low concentration, that is, atoms rearranged along the grain boundaries parallel to compressive stress, leading to grain elongation and causing creep deformation.
4. Conclusions
As vacancy is an important crystal defect affecting the creep behavior of nanocrystalline metals, the influence of the initial vacancy concentration on the high temperature creep behavior of nanocrystalline Ni was systematically investigated by molecular dynamics simulation in this study. It was found that the addition of 6% initial vacancy concentration caused the maximum creep displacement of nanocrystalline Ni. The newly generated vacancies during creep mainly occurred at the deceleration creep stage, i.e., the initial creep stage. These deformation-induced vacancies were mostly distributed around the GBs, mainly because the shear strain of atoms at the GB was larger than that of the grain interior. The number of these deformation-induced vacancies increased with increasing initial vacancy concentration and reached the maximum when the initial vacancy was 6%, which was consistent with the change trend of creep displacement with initial vacancy concentration. It was found that the number of initial dislocations played a decisive role in the formation of deformation-induced vacancy in the initial stage of creep, and the initial vacancy-dependent high-temperature creep behavior of nanocrystalline Ni was determined by newly generated vacancies at the GBs. In the steady-state creep stage, these newly generated vacancies could assist partial dislocation slip at the GBs, dominating the creep deformation mechanism of nanocrystalline Ni.
Author Contributions
Conceptualization, Y.C.; Methodology, Y.C.; Software, W.S.; Validation, W.S.; Investigation, Y.C.; Data curation, Y.C., W.S. and Y.S.; Writing—original draft, Y.C.; Writing—review & editing, Y.S. and Q.Z.; Visualization, Y.S. All authors have read and agreed to the published version of the manuscript.
Funding
This work was sponsored by the Shanghai Sailing Program (20YF1409600, 20YF1454200), the National Natural Science Foundation of China (Grant No. 52005184, 52175188), and the Natural Science Foundation of Shanghai (21ZR1469600). Additional support was provided by Feringa Nobel Prize Scientist Joint Research Center and Key Research and Development Program of Shaanxi Province (2023-YBGY-434) and State Key Laboratory for Mechanical Behavior of Materials (20222412).
Institutional Review Board Statement
Not applicable.
Informed Consent Statement
Not applicable.
Data Availability Statement
No new data were created.
Conflicts of Interest
The authors declare that they have no competing financial interests or personal relationships that could have appeared to influence the work reported in this paper.
References
- Zhu, T.; Li, J. Ultra-strength materials. Prog. Mater. Sci. 2010, 55, 710–757. [Google Scholar] [CrossRef]
- Liu, X.; Sun, L.; Zhu, L.; Liu, J.; Lu, K.; Lu, J. High-order hierarchical nanotwins with superior strength and ductility. Acta Mater. 2018, 149, 397–406. [Google Scholar] [CrossRef]
- Zhang, N.; Jin, S.; Sha, G.; Yu, J.; Cai, X.; Du, C.; Shen, T. Segregation induced hardening in annealed nanocrystalline Ni-Fe alloy. Mater. Sci. Eng. A 2018, 735, 354–360. [Google Scholar] [CrossRef]
- Li, Q.J.; Ma, E. When ‘smaller is stronger’no longer holds. Mater. Res. Lett. 2018, 6, 283–292. [Google Scholar] [CrossRef]
- Ren, Y.; Huang, Z.; Wang, Y.; Zhou, Q.; Yang, T.; Li, Q.; Jia, Q.; Wang, H. Friction-induced rapid amorphization in a wear-resistant (CoCrNi)88Mo12 dual-phase medium-entropy alloy at cryogenic temperature. Compos. Part B Eng. 2023, 263, 110833. [Google Scholar] [CrossRef]
- Kale, C.; Srinivasan, S.; Hornbuckle, B.; Koju, R.; Darling, K.; Mishin, Y.; Solanki, K. An experimental and modeling investigation of tensile creep resistance of a stable nanocrystalline alloy. Acta Mater. 2020, 199, 141–154. [Google Scholar] [CrossRef]
- Meraj; Pal, S. The Effect of Temperature on Creep Behaviour of Porous (1 at.%) Nano Crystalline Nickel. Trans. Indian Inst. Met. 2015, 69, 277–282. [Google Scholar] [CrossRef]
- Nie, K.; Wu, W.-P.; Zhang, X.-L.; Yang, S.-M. Molecular dynamics study on the grain size, temperature, and stress dependence of creep behavior in nanocrystalline nickel. J. Mater. Sci. 2016, 52, 2180–2191. [Google Scholar] [CrossRef]
- Yang, X.-S.; Wang, Y.-J.; Zhai, H.-R.; Wang, G.-Y.; Su, Y.-J.; Dai, L.; Ogata, S.; Zhang, T.-Y. Time-, stress-, and temperature-dependent deformation in nanostructured copper: Creep tests and simulations. J. Mech. Phys. Solids 2016, 94, 191–206. [Google Scholar] [CrossRef]
- Wang, Y.-J.; Ishii, A.; Ogata, S. Transition of creep mechanism in nanocrystalline metals. Phys. Rev. B 2011, 84, 224102. [Google Scholar] [CrossRef]
- Coble, R.L. A Model for Boundary Diffusion Controlled Creep in Polycrystalline Materials. J. Appl. Phys. 1963, 34, 1679–1682. [Google Scholar] [CrossRef]
- Nabarro, F.R.N. Steady-state diffusional creep. Philos. Mag. 1967, 16, 231–237. [Google Scholar] [CrossRef]
- Sun, Z.; Liu, B.; He, C.; Xie, L.; Peng, Q. Shift of Creep Mechanism in Nanocrystalline NiAl Alloy. Materials 2019, 12, 2508. [Google Scholar] [CrossRef]
- Yuasa, M.; Matsumoto, H.; Hakamada, M.; Mabuchi, M. Effects of Vacancies on Deformation Behavior in Nanocrystalline Nickel. Mater. Trans. 2008, 49, 2315–2321. [Google Scholar] [CrossRef]
- Islam, Z.; Wang, B.; Hattar, K.; Gao, H.; Haque, A. Departing from the mutual exclusiveness of strength and ductility in nanocrystalline metals with vacancy induced plasticity. Scr. Mater. 2018, 157, 39–43. [Google Scholar] [CrossRef]
- Ford, J.; Wheeler, J.; Movchan, A. Computer simulation of grain-boundary diffusion creep. Acta Mater. 2002, 50, 3941–3955. [Google Scholar] [CrossRef]
- Millett, P.C.; Desai, T.; Yamakov, V.; Wolf, D. Atomistic simulations of diffusional creep in a nanocrystalline body-centered cubic material. Acta Mater. 2008, 56, 3688–3698. [Google Scholar] [CrossRef]
- Zhao, F.; Zhang, J.; He, C.; Zhang, Y.; Gao, X.; Xie, L. Molecular dynamics simulation on creep behavior of nanocrystalline TiAl alloy. Nanomaterials 2020, 10, 1693. [Google Scholar] [CrossRef] [PubMed]
- Zeng, Y.; Li, X. Atomistic simulations of high-temperature creep in nanotwinned TiAl alloys. Extrem. Mech. Lett. 2021, 44, 101253. [Google Scholar] [CrossRef]
- Yang, C.; Yin, C.; Wu, Y.; Zhou, Q.; Liu, X. Atomic insights into the deformation mechanism of an amorphous wrapped nanolamellar heterostructure and its effect on self-lubrication. J. Mater. Res. Technol. 2023, 26, 4206–4218. [Google Scholar] [CrossRef]
- Zhou, Q.; Luo, D.; Hua, D.; Ye, W.; Li, S.; Zou, Q.; Chen, Z.; Wang, H. Design and characterization of metallic glass/graphene multilayer with excellent nanowear properties. Friction 2022, 10, 1913–1926. [Google Scholar] [CrossRef]
- Shi, Y.; Ye, W.; Hua, D.; Zhou, Q.; Huang, Z.; Liu, Y.; Li, S.; Guo, T.; Chen, Y.; Eder, S.J.; et al. Interfacial engineering for enhanced mechanical performance: High-entropy alloy/graphene nanocomposites. Mater. Today Phys. 2023, 38, 101220. [Google Scholar] [CrossRef]
- Yao, H.; Ye, T.; Yu, W.; Wang, P.; Wu, J.; Wu, Y.; Chen, P. Atomic-scale investigation of creep behavior and deformation mechanism in nanocrystalline FeCrAl alloys. Mater. Des. 2021, 206, 109766. [Google Scholar] [CrossRef]
- Pal, S.; Meraj, M. Investigation of reorganization of a nanocrystalline grain boundary network during biaxial creep deformation of nanocrystalline Ni using molecular dynamics simulation. J. Mol. Model. 2019, 25, 282. [Google Scholar] [CrossRef]
- Pal, S.; Mishra, S.; Meraj; Mondal, A.; Ray, B. On the comparison of interrupted and continuous creep behaviour of nanocrystalline copper: A molecular dynamics approach. Mater. Lett. 2018, 229, 256–260. [Google Scholar] [CrossRef]
- Weertman, J.R. Retaining the Nano in Nanocrystalline Alloys. Science 2012, 337, 921–922. [Google Scholar] [CrossRef]
- Pal, S.; Meraj; Deng, C. Effect of Zr addition on creep properties of ultra-fine grained nanocrystalline Ni studied by molecular dynamics simulations. Comput. Mater. Sci. 2017, 126, 382–392. [Google Scholar] [CrossRef]
- Li, G.; Zhang, F.; Zhu, D.; Wang, L. Segregation thickness effect on the mechanical behaviors of nanocrystalline Ni-doped W alloy. Phys. Lett. A 2021, 409, 127513. [Google Scholar] [CrossRef]
- Hirel, P. Atomsk: A tool for manipulating and converting atomic data files. Comput. Phys. Commun. 2015, 197, 212–219. [Google Scholar] [CrossRef]
- Plimpton, S. Fast Parallel Algorithms for Short-Range Molecular Dynamics. J. Comput. Phys. 1995, 117, 1–19. [Google Scholar] [CrossRef]
- Etesami, S.A.; Asadi, E. Molecular dynamics for near melting temperatures simulations of metals using modified embedded-atom method. J. Phys. Chem. Solids 2018, 112, 61–72. [Google Scholar] [CrossRef]
- Stukowski, A. Visualization and analysis of atomistic simulation data with OVITO—The Open Visualization Tool. Model. Simul. Mater. Sci. Eng. 2010, 18, 015012. [Google Scholar] [CrossRef]
- Falk, M.L.; Langer, J.S. Dynamics of viscoplastic deformation in amorphous solids. Phys. Rev. E 1998, 57, 7192–7205. [Google Scholar] [CrossRef]
- Shimizu, F.; Ogata, S.; Li, J. Theory of Shear Banding in Metallic Glasses and Molecular Dynamics Calculations. Mater. Trans. 2007, 48, 2923–2927. [Google Scholar] [CrossRef]
- Herring, C. Diffusional Viscosity of a Polycrystalline Solid. J. Appl. Phys. 1950, 21, 437–445. [Google Scholar] [CrossRef]
Disclaimer/Publisher’s Note: The statements, opinions and data contained in all publications are solely those of the individual author(s) and contributor(s) and not of MDPI and/or the editor(s). MDPI and/or the editor(s) disclaim responsibility for any injury to people or property resulting from any ideas, methods, instructions or products referred to in the content. |
© 2024 by the authors. Licensee MDPI, Basel, Switzerland. This article is an open access article distributed under the terms and conditions of the Creative Commons Attribution (CC BY) license (https://creativecommons.org/licenses/by/4.0/).