Abstract
Icing has caused much inconvenience to daily production and life. A microstructure surface possessing a hydrophobic property is an effective countermeasure to impede or delay ice formation for anti-icing purposes. However, surface wettability is sensitive to environmental conditions such as temperature and humidity. In the worst-case scenario, a Wenzel state drop forms and causes degradation of surface anti-icing performance. In this study, a copper alloy was used as the testing sample, and the surface was fabricated using mechanical polishing, micro-milling machining and ultrafast laser etching to form the desired topology and microstructures. The hydrophobicity and icephobicity of four types of surfaces including smooth flat, rough flat, rough microstructure and smooth microstructure were tested by depositing droplets from room temperature to an ultralow subzero temperature condition (below −30 °C). At −10 °C, the icephobicity of the surface was consistent with the surface wettability at room temperature. However, the hydrophobicity of the surface slightly decreased, and a Wenzel state drop formed on the microstructure surface. At −30 °C, the apparent contact angle and the ice–substrate contact area were mainly affected by ice nucleation rather than surface wettability. The bottom layer of the droplet froze after immediate contact with the substrate due to a higher degree of supercooling. The formation of a Cassie state drop reduced the ice–substrate contact area and created more air cushions, which facilitated the extension of the icing process of the drop. The enhancement in the anti-icing performance of the microstructure surface was analyzed from a theoretical basis.
1. Introduction
The phenomenon of surface icing widely exists in the application fields of energy utilization [1], outdoor communication [2], transportation [3] and aerospace [4]. The lowest outdoor air temperature recorded on Earth was −89.2 °C in Vostok, Antarctica [5]. Icing becomes a long-lasting problem all year round, especially in extremely cold regions of high altitudes or near the poles. Excessive ice accumulation on the surface increases weight, reduces heat dissipation, hinders air flow, leads to a change in thermal properties and increases stress to cause fatigue. Therefore, inhibition of surface icing is of significant scientific interest and there is an application demand for its normal operation and safety production.
Conventional deicing strategies rely on mechanical, electrical or solar energy to cause ice–substrate interface deformation [6] or directly melting [7] when ice inevitably forms on the surface. However, these strategies are usually costly, inefficient and greatly affected by environmental conditions. The passive anti-icing property of the surface becomes important and is generally considered to be correlated with surface wettability. For example, a hydrophobic surface has a better water repellent property compared with a hydrophilic surface, and thus is less likely to cause water/ice sticky to the surface [8]. Surface wettability closely depends on its geometric topography and chemical property [9]. Fluorinated coatings with low surface energy (<0.15 J/m2) are effective in preventing ice formation at harsh environmental conditions [10,11]. With the rising development of bionic surface engineering [12], imitating the “lotus effect” in nature [13], fabricating micro- and nano-hierarchical structures to form a super-hydrophobic surface (SHS) (contact angle > 150°) can help improve the comprehensive anti-icing performance [14]. A droplet stays on the top of the microstructure under the effect of Laplace pressure, forming the so-called Cassie state [15], which produces an air cushion (or cavitation) that significantly improves the contact angle, reduces the contact angle hysteresis and enhances droplet mobility like sliding and bouncing on the surface [13,16]. Furthermore, the reduced contact area between the droplet and substrate hinders the heterogeneous ice nucleation and prolongs the icing time. The decreased adhesion force also makes ice removal easier. Therefore, maintaining the droplet in the Cassie state on the microstructure surface facilitates improving the comprehensive anti-icing properties including enhancing droplet self-removing capacity, inhibiting ice nucleation, extending icing time and reducing the adhesion of ice to the surface.
Making the surface possess a certain hydrophobicity with microstructure has great prospects for realizing icephobicity; however, it only maintains high anti-icing performance for a short period of time and limited environmental conditions [17]. Under low temperature and high humidity environments, surface energy is sensitive to temperature change. Having higher surface energy at temperatures below C than that at room temperature indicates that a surface becomes more hydrophilic [18]. Also, a decreased contact angle suggests degradation in the original surface hydrophobicity after the temperature decreases to a vapor–liquid condensation point [19]. A Wenzel state drop [20] may form with water vapor condensation [21] or freezing rain impact with kinetic energy [22,23]. The increased contact surface area between the liquid and the substrate increases the heat transfer rate, thus reducing the total icing time. The microstructure could also be damaged by ice expansion during phase changes. When Wenzel ice forms, frost or ice crystals anchor inside the cavity of the structure [8]. The increased adhesion force makes it difficult to perform deicing. Therefore, the microstructure surface allows the droplet to stay in the Cassie state and is thus advantageous for anti-icing. However, once the liquid infiltrates into the microstructure to form Wenzel state ice, deicing becomes much more difficult. This suggests that a surface with hydrophobicity does not equally mean possessing icephobicity [24]. The issue is how to prevent Wenzel state ice formation and further icing accretion on the surface.
The icephobicity of the surface also depends on the thermodynamics or kinetics of the icing process [25]. Compared with homogeneous ice nucleation, which mainly depends on the subcooling of liquid, heterogeneous ice nucleation is also affected by surface properties such as roughness (e.g., nanoscale particles), wettability, etc. [26]. The Gibbs energy barrier that is required for heterogeneous nucleation is much lower than that for homogeneous nucleation [27]. Therefore, ice nucleation tends to occur on surfaces when the temperature reduces to a subzero degree. At the nanoscale or micro-nanoscale, the dimension of surface topography (50–10 ) required to present super-hydrophobicity is usually larger than the critical ice nucleus size (<10 nm) [28]. In this range, a smaller nanoparticle size has a higher contact angle and better ice inhibition capacity [29]. With a further decrease in nanoparticle size below 50 nm, it loses certain hydrophobicity but is still effective to suppress ice nucleation. Due to the fewer voids for ice nucleation, the anti-icing performance of a nanostructured surface is better than a hierarchical micro-nanostructured surface exposed to supercooled wet air flows [30]. However, regarding the mechanical strength, the nanostructure surface made using self-assembly or coatings is usually easily destroyed by mechanical forces due to poor adhesion of nanoparticles on the substrate [31]. Furthermore, a microstructure (>50 ) or hierarchical micro-nanostructure surface shows better anti-icing performance in dropwise freezing testing or supercooled water impact, as more air pockets and a large apparent contact angle repel macroscale droplets (millimeter in dimension). Herein, surface microstructure plays a significant role in affecting the apparent contact angle and the wetting state of the drop. The structure’s dimensions can be precisely tailored for presenting optimum hydrophobic/icephobic properties using micro-milling machining [32] or ultrafast laser-etching [33,34]. A smaller and sharper structure can create a greater energy barrier to prevent the transition from the Cassie state to the Wenzel state and reduce the liquid–substrate contact area to defer icing [35]. Increasing the Laplace pressure by designing a nanoscale hierarchical or closed-cell structure [13] can effectively suppress the formation of Wenzel drops. The preparation of a denser structure reduces the probability of droplet wetting into the microstructure and the in situ sites for icing. However, a denser structure of the surface is not contributive to forming superhydrophobicity. Therefore, the anti-icing performance of the microstructure surface for universal applications is still under debate.
In cold and wet conditions, a microstructure surface can delay icing but may not achieve complete anti-icing and weak deicing capability. As the viscosity of the droplet and surface energy increase, the water-repellant property becomes compromised and the drop becomes more adherent to the surface [31]. The formation of Wenzel state ice crystals in the microstructure weakens the anti-icing performance. In addition, under an ultra-low temperature, both the homogeneous and heterogeneous nucleation rate increase remarkably as temperature decreases [36]. The dominant factor needs to be analyzed when determining surface icing [37]. Therefore, the focus of the current study was to perform dropwise anti-icing testing on smooth and microstructure surfaces influenced by a wide subzero temperature condition. A 20–40% relative humidity reduced the influence of condensation and frosting. The microstructure was designed to show a macroscale effect on the original smooth and rough surfaces. The droplet wetting state, contact angle and icing time were investigated as references for the anti-icing effectiveness of the surface. A theoretical analysis combining the experiments revealed more physical principles behind the functionality of the icephobic surface.
2. Materials and Methods
The experimental setup shown in Figure 1a was designed based on the working principle of the refrigeration system (Figure 1b) and used as a cooling platform to provide the required temperature condition for the investigation.
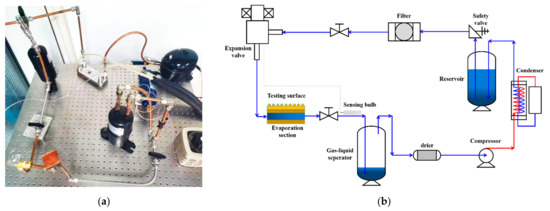
Figure 1.
(a) Experimental setup and (b) schematics of the refrigeration system.
The refrigeration system consisted of a compressor, a condenser, an expansion valve and an evaporation section. A reservoir was in the loop in order to store enough refrigerant (R134a) for circulation. The refrigeration system was designed to provide a cold surface with constant temperature for icing experiments. A drier was used for dehydration, and a filter was used to remove impurities in the loop. At the preparation stage of the experiment, 1 kg of refrigerant was added to the reservoir through the compressor. The temperature of the testing surface was adjusted by controlling the temperature of the water bath condenser and the flow rate of the refrigerant inside the loop. The lowest surface temperature of −35 °C could be achieved. In addition to the refrigeration loop, a data acquisition system for temperature measurement and a visualization system for optical observation were used to record data. The data acquisition equipment 34970A (Agilent, Santa Clara, CA, USA) was used to capture the temperature of the cooling platform, copper block and surrounding atmosphere. Thermocouples were inserted into the copper block and obtained two measurement points underneath the droplet, as shown in Figure 2. In the meantime, given the fact that the back side of the copper block was attached to the cooling platform and natural convection condition was applied to the front side, the temperature distribution of the copper block was numerically computed and showed a uniform temperature profile with the refrigerant. The natural convection of the air velocity and temperature profile were also illustrated, where is the convection heat transfer coefficient, u is the velocity of air flows close to the surface, and and are the temperatures of the substrate and surrounding atmosphere, respectively. The imaging visualization system consisted of a tilting contact angle measurement instrument (SDC-350) and a monitor (Kunshan shengding industrial intelligent technology Co., LTD., Kunshan, China). The charge-coupled device (CCD) camera was used to observe the static state and dynamic droplet freezing process. Once the droplet motion was recorded, the static images were extracted from the video and analyzed with an in-house imaging-processing program developed using MATLAB [38].
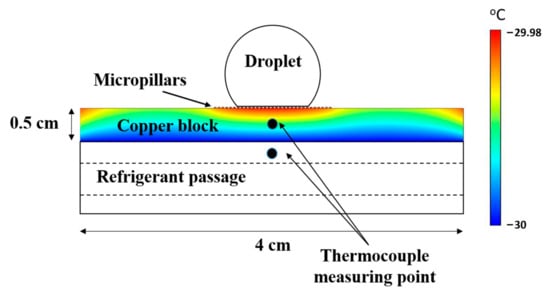
Figure 2.
Schematics showing the temperature distribution of the copper block and boundary conditions.
The testing sample was copper alloy (brass H59, Guangdong Guangouli Metal Material Co., Ltd., Guangzhou, China) manufactured using CNC milling machining into a 0.5 cm thick and 16 cm2 area copper block, which was placed on the cooling platform of the refrigeration system. The surface of the copper block was sanded with 1500- and 3000-grit sandpapers and polished with grinding paste to obtain a smooth surface (Surf 1). Subsequentially, the surface was etched using an ultrafast laser available in a femtosecond (fs) pulse duration to create a certain roughness and was exposed to ambient for a week (Surf 2). The fs-laser processing on the copper surface was achieved using a linearly polarized beam with a wavelength of 800 nm, a repetition rate of 200 kHz and a pulse duration of 600 fs. The beam had a power of 8 W focused on a spot size of 30 μm. The surface morphology of both the original copper surface and fs-laser-treated surface was measured using a scanning electron microscope (SEM) (Tescan, Brno, Czech Republic) and atomic force microscope (AFM) (Hitachi, Ltd., Tokyo, Japan), as shown in Figure 3. The surface roughness (Sa) was measured to be 0.1001 μm before treatment and 0.7760 μm after laser treatment (>7 days after the treatment). An energy dispersive spectrometer (EDS) analysis was used to quantify the chemical element composition of the surface. The elemental composition of the copper surface shown in Figure 4 and the results listed in Table 1 suggest a change in the chemical composition of the copper surface after the fs-laser processing. The oxygen atomic amount increased from 3.83% (Surf 1) before treatment to 19.44% (Surf 2) after laser treatment (>7 days after the treatment). The fs-laser-treated surface formed an oxidation layer with a thickness () of a few micrometers [39]. The fs-laser-treated surface presented a higher hydrophobicity than the original smooth copper surface since it changed in roughness and chemical properties.
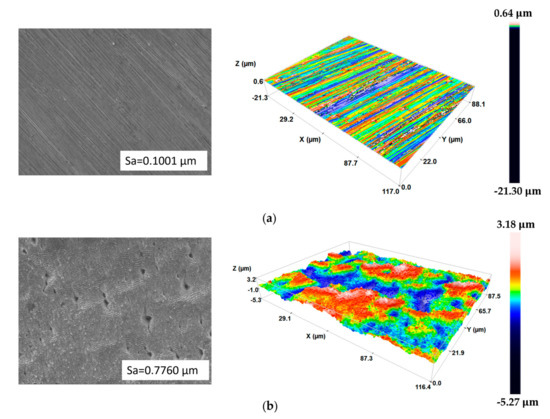
Figure 3.
SEM (left) and AFM (right) measurements of surface topology before and after fs-laser treatment. (a) Surf 1 and (b) Surf 2.
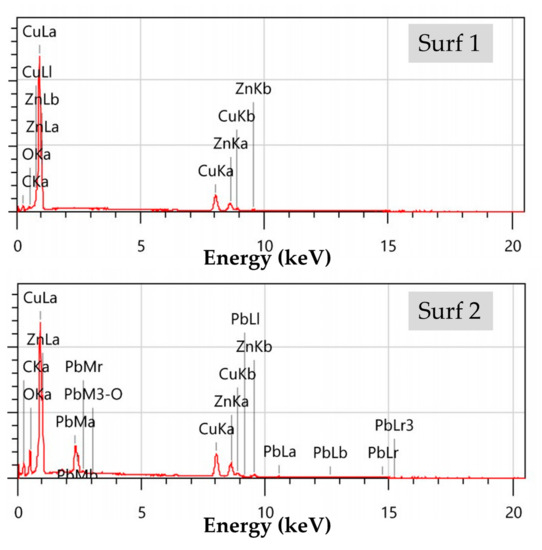
Figure 4.
EDS spectra of the copper surface before and after fs-laser treatment.

Table 1.
Surface chemical composition before and after fs-laser treatment.
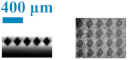
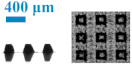
In order to evaluate the microstructure effect on the hydrophobicity and icephobicity of the flat surfaces, some regions of the smooth copper surface were etched less during fs-laser scanning, and a micropillar array was obtained with a triangular shape and pillar size of 100 μm (Surf 3). In order to maintain the original surface chemical property, the smooth copper surface was also fabricated using micro-milling machining into a trapezoidal micropillar array (Surf 4). The pillar size (l) referred to the pillar depth or width, and a pitch distance (spacing between adjacent pillars) equal to twice the pillar size was applied for the microstructure surfaces. A characterization of the testing surfaces that were fabricated using different surface treatment methods is shown in Table 2. After the surface was fabricated and prepared, the samples were cleaned, in order, with acetone, alcohol and deionized water in an ultrasonic bath for 15 min and dried with nitrogen gas before use for testing.
Table 2.
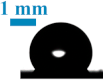
The testing surfaces with different morphologies and optical visualization of a 10 μL droplet.
Regarding the wetting properties, the measured results for the wettability of the testing surface at room temperature are listed in Table 3. The wettability of the surface was correlated with the wetting state, contact angle and actual liquid–substrate contact area. A volume of the 10 μL drop was quantified using a micropipette. A fresh water drop was taken from a room temperature container and gently placed onto the surface for each measurement in order to minimize the impinging kinetic energy. As the surface was polished, the intrinsic contact angle on the smooth copper surface (Surf 1) was . The apparent contact angle was affected by surface roughness (nanostructure), micropillars (microstructure) and combined effects (hierarchical structure). Based on Wenzel’s theory, the rough surface (Surf 2) had a larger apparent contact angle of . Surf 3 was super-hydrophobic, and the apparent contact angle exceeded due to the combined effects of micro- and nano-structures. Surf 4 had a contact angle of subjected solely to the microstructure effect. Regarding the apparent contact angle, the surface hydrophobicity from high to low was Surf 3 > Surf 4 > Surf 2 > Surf 1. Furthermore, the droplet wetting states were categorized into three types, which were predicted using Young’s model, Wenzel’s model and Cassie’s model, respectively. Generally, the surface (Surf 1) with a low contact angle had a maximum liquid–substrate contact area compared with that of high contact angles. The liquid–substrate contact area also depended on the droplet wetting state. The Wenzel state (Surf 2) had a larger liquid–substrate contact area than the Cassie state (Surf 3 and Surf 4). For freeze testing, in order to approach the subcooling state of freezing rain in an actual environment, a drop from ice water (ice and water mixture) was used. The icing time (including the icing delay time) was recorded from the moment the drop touched the surface to a complete freezing state (marked by the ice tip that appeared on the top of the droplet).
Table 3.
The measured results for the wettability of the testing surfaces.
3. Results and Discussion
In order to evaluate the hydrophobicity and icephobicity of the original copper surface and microstructure surface, the wetting state and contact angle of the sessile droplet were visualized and measured at room temperature and subzero temperatures. The anti-icing performance was evaluated by comparing the time duration for the icing process of the drop from initial ice nucleation to a complete freezing state. A longer icing time was expected when the drop was on the microstructure surface with a higher contact angle and a Cassie state.
3.1. Surface Wettability
Surface chemical properties and topography are primary factors to obtain a functional surface integrated with an icephobic property. As surface topography plays a significant role in enhancing the hydrophobicity of the original smooth surface, regulating the surface morphology will have an effect on the anti-icing performance.
3.1.1. Contact Angle
When a droplet is placed on a solid surface, the contact angle is a measure of the balance between the solid–liquid, solid–vapor and vapor–liquid interfacial tensions. Dependent on the droplet state on the surface, classical theories for the contact angle of the droplet are predicted using Young’s model (Figure 5a), Wenzel’s model (Figure 5b) or Cassie’s model (Figure 5c).
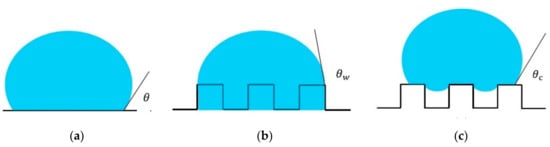
Figure 5.
The wetting state and contact angle of a drop on different surfaces predicted using (a) Young’s model, (b) Wenzel’s model, and (c) Cassie’s model.
Young’s model is strictly applicable to a surface with uniform chemical composition and absolute smoothness. However, in reality, a solid surface has a non-uniform chemical composition and certain roughness. Therefore, two different models that predict the contact angles in the Wenzel state and Cassie state were developed to explain wetting behaviors on geometrically rough surfaces [15,20].
On a smooth surface, the surface contact angle is the so-called intrinsic contact angle (), which is predicted using Young’s equation.
where , and represent the interfacial tensions between solid–vapor, solid–liquid and liquid–vapor, respectively. Wenzel [20] stated that a rough surface enhances the wettability of the original surface, i.e., to make a hydrophilic surface more hydrophilic and a hydrophobic surface more hydrophobic. Due to liquid–solid contact, the actual area of a rough surface () is larger than the projection area (). The apparent contact angle () is affected by the surface roughness (, defined as ) and surface intrinsic contact angle
where is the contact angle in the Wenzel state. Subsequently, Cassie and Baxter [15] established a new contact angle correlation based on morphological changes in a droplet on surface microstructures and proposed that when a droplet is on a rough solid surface, the air below forms an air pocket, and the actual solid–liquid contact area decreases and the apparent contact angle of the surface satisfies
where is the contact angle in the Cassie state and is the surface area ratio of the actual liquid–substrate contact area () over the total liquid interfacial area (, representing the summation of the liquid–substrate and liquid–air interfacial area). According to Cassie’s model, the rough surface with low surface energy shows super-hydrophobicity, and the water droplet easily rolls off because of the high contact angle and low contact angle hysteresis. According to Equation (3), when the air in the groove is completely filled with liquid, i.e., , Cassie’s equation is transformed into Wenzel’s equation.
The results show that measured contact angle of the sessile droplet reflected the hydrophobicity of the surface. The intrinsic contact angle of a droplet on the polished flat surface (Surf 1) was and presented a minor hydrophobic state. The apparent contact angle of the non-polished flat surface (Surf 2) was . The apparent contact angle of the 100 μm and 200 μm microstructure surfaces (Surf 3 and Surf 4) were and , respectively. When the drop was placed on the flat surface, the apparent contact angle was dependent on the intrinsic contact angle and surface roughness. Due to microstructure effects, a larger contact angle was obtained in the Cassie state, which was attributed to the air cushion underneath the droplet. A theoretical prediction using Cassie’s contact angle model in Equation (3) is plotted in Figure 6 to show the trend in the contact angle improvement on the microstructure surface compared with that on the plain surface. The surface fraction of liquid in contact with the substrate () on all microstructure surfaces was 0.25.
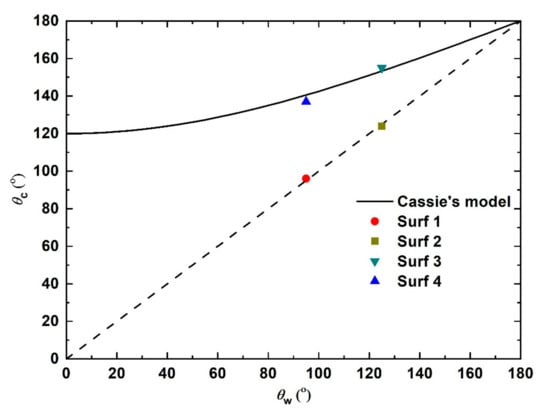
Figure 6.
The contact angle measured on the testing surfaces and the theoretical prediction using Cassie’s model.
3.1.2. Wetting State
Different from the state of the droplet on the smooth surface, two different morphological characteristics presented on the microstructure surface, i.e., Wenzel state and Cassie state. The Wenzel state droplet infiltrates into the microstructure and increases the contact area between the droplet and the surface. The Cassie state droplet, as shown in Figure 7, is in a nonwetting state and reduces liquid–substrate contact fraction, which presents a superhydrophobic property, i.e., large contact angle and low hysteresis. is the liquid–substrate contact area fraction, as aforementioned. As we consider a unit cell, assuming that the micropillar size is equal to l, for the micropillar array is 0.25. Also, the contact line density (CLD, ) is represented as the actual liquid–substrate contact lines (L) in the area of a unit cell (A).
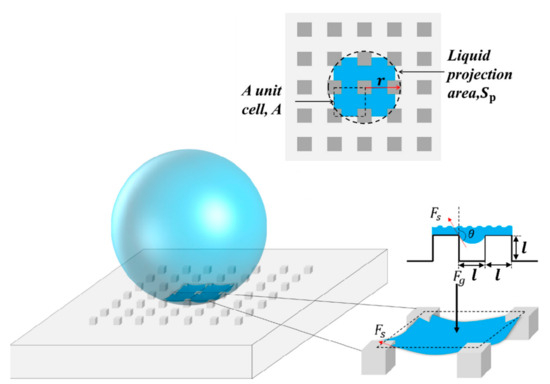
Figure 7.
Geometric condition of the micropillar-structured surface and the formation of a Cassie state drop.
The stability of the Cassie state can be simply evaluated according to the balance between the Laplace pressure (e.g., surface tension force, ) and hydrostatic pressure (e.g., gravitational force, ) acting on the liquid–air interface [40]
where is the critical contact line density (CLD) required for the minimum surface tension force against gravitational force to support a drop suspending, is the surface intrinsic contact angle, is the surface tension between liquid and vapor, is the density of the liquid and is the volume of the drop. Here, a volume area ratio (η) is introduced and represents the drop volume over the liquid projection area
If the actual CLD is smaller than the critical CLD, the liquid–air interface will collapse from the top to the bottom substrate, which leads to a transition from the Cassie state to the Wenzel state. In order to present a stable Cassie state, the intrinsic contact angle, the pillar size and the volume area ratio should satisfy
A small drop volume area ratio, a small pillar size and a large intrinsic contact angle help to maintain a stable Cassie state.
The volume of sample droplets ranging from 1 μL to 20 μL on the microstructure surface all presented a Cassie state at room temperature. The experimental observation was in good accordance with the theoretical prediction obtained using Equation (7). When the surface tension force exceeded the gravitational force, the drop remained in the Cassie state, and when vice versa, it collapsed to the Wenzel state.
3.2. Surface Icephobicity
Ice nucleation needs to overcome a Gibbs free energy barrier () that satisfies
where and denote the interfacial tension and volumetric free energy difference between ice and water, respectively. The free energy difference between ice and water satisfies the Gibbs–Helmholtz free energy equation
where is the melting temperature and T is the ambient temperature, which requires the ambient temperature to be lower than the ice melting temperature in order to initiate ice nucleation. is the volumetric enthalpy of fusion. The critical radius () of the ice crystal satisfies
After the ice crystal nucleation size increases beyond the critical nucleation size of the free energy barrier, it will grow rapidly and no longer transform into water liquid. Classical nucleation theory predicts the rate of formation of a critically sized ice nucleus, which is also called the ice nucleation rate ()
where is a kinetic pre-factor accounting for the diffusive flux of water molecules across the ice surface and is the Boltzmann constant. It is worth noting that the ice nucleation rate is inversely proportional to the nucleation delay time. Homogeneous icing occurs in liquid at a higher degree of supercooling to overcome surface tension. Heterogeneous ice nucleation is correlated with homogeneous ice nucleation theory but is also affected by surface factors such as contact angle, roughness, interfacial tension, etc. Heterogeneous ice nucleation occurs at a solid–liquid interface, so it only needs to overcome a low free energy barrier [29], and the relationship between its Gibbs free energy and surface geometry satisfies
where is the critical free energy barrier that needs to be overcome for heterogeneous ice nucleation. is the free energy barrier that needs to be overcome for homogeneous ice nucleation. is a coefficient that reflects the surface contact angle and the curvature of surface roughness. For an ultrafine surface roughness, f is further represented [26,27] as
where is the intrinsic contact angle. , and are surface tensions between ice–gas, water–gas and ice–water, respectively. f should be reduced in order to achieve an anti-icing surface. It is reasonable to assume that to delay icing for a supercooled droplet on the surface, the liquid–substrate contact area is minimized and the surface contact angle is maximized. For improved hydrophobicity, icing needs to overcome a higher energy barrier that occurs at a lower surface temperature. As the contact angle approximates , f becomes close to 1, and heterogeneous nucleation is similar to homogeneous nucleation. In other words, at an ultra-low temperature condition, the Cassie state of the drop with an increased surface contact angle and reduced liquid–substrate contact area is likely to form on the microstructure surface.
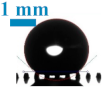
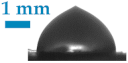
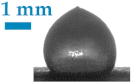
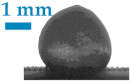
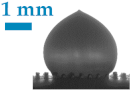
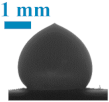
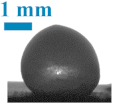
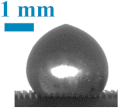
In Table 4 and Table 5, the wetting state and contact angle of the droplet on the testing surfaces were captured and measured at −C and −C temperature conditions. At −C, the droplet fully adjusted to a proper energy-minimized state (i.e., the Wenzel state) before the initiation of icing. After a delayed ice nucleation time, the droplet started to freeze. As a result, the contact angle of the drop reduced as compared with that measured under room temperature. It is also worth noting that all droplets at −C existed in Wenzel states on the microstructure surface. A Cassie state drop was difficult to form even after multiple attempts. It is interesting that although the contact angle on all testing surfaces was reduced, it was still influenced by the surface’s original wettability. The rebound behavior of the droplet representing the contact time and the contact area of the liquid–substrate interface was influenced by the ice freezing rate. At room temperature, due to a fast response speed, the droplet could completely rebound when hitting the superhydrophobic (SHS) surface [16]. Therefore, SHS was considered to have the potential ability to inhibit surface icing. However, in the current study, the superhydrophobic surface (Surf 3) lost a certain ice-inhibiting ability due to the formation of the Wenzel state drop at the subzero temperature condition.
Table 4.
Contact angle and wetting state of a 10 μL drop on the testing surfaces at −C.
Table 5.
Contact angle and wetting state of a 10 μL drop on the testing surfaces at −C.
At −C, a lower surface temperature reduced the Gibbs free energy barrier and accelerated the ice nucleation and droplet freezing process. If the ice nucleation rate was larger than the droplet response rate, the bottom of the droplet would immediately freeze when contacting the surface. A large contact angle meant low surface energy. In addition, the viscosity of the droplet increased as the wall temperature decreased. Once the strength was larger than the Van Der Waals force existing between the water molecules, the bottom layer of water froze and remained on the surface rather than flowing down, even though the upper layer was still flowing. The droplet tended to attach to the top of the microstructure. The morphology of the droplet on the surface was not correlated with the original surface wettability. All the testing surfaces have the same contact angle around 130°. The droplet tended to present a Wenzel state on 100 μm microstructure surface (Surf 3) for a small pillar height and a Cassie state on 200 μm microstructure surface (Surf 4) for a large pillar height. For ease of study, the sample droplet in the current case was assumed to be placed on the surface with no impinging velocity, although most frequently, the droplet impacted the surface with initial kinetic energy in the natural case scenario.
The contact angle and wetting state of the droplet were important factors affecting the icing process. A large contact angle and a small liquid–substrate contact area made the surface more hydrophobic, which could effectively inhibit ice nucleation and growth. When the droplet was placed on the microstructure surface at −C, it tended to wet the surface structure and form a Wenzel state before icing. Wenzel ice still formed after a delayed time. As a result, the hydrophobicity of a surface at room temperature undermines at a subzero temperature condition. At −C, the droplet was frozen immediately after being placed onto the tip of the structured surface and formed a Cassie state. The liquid–substrate contact area was reduced and left with an air cavity.
To provide a brief discussion, the contact angle was reduced, and the droplet tended to form a Wenzel state under an ice nucleation temperature (−C), which weakened the hydrophobicity of the testing surface. But the surface wettability was the dominating factor and dictated the droplet contact angle and wetting state. Under the ultra-low temperature conditions (<−C), the droplet wetting state was mainly due to the dominance of ice nucleation over surface wettability, and the surface wettability became a minor factor. Therefore, the droplet wetting state and contact angle were dependent on the surface temperature.
3.3. Icing Time
Energy transport between the droplet and the substrate mainly includes heat conduction through the ice layer, which grows along the direction of the positive y-axis, as shown in Figure 8. When the temperature is low, the sensible heat of droplet temperature changes, and heat convection and radiation with the environment are negligible. For a smooth surface, the drop phase change heat transfer rate () at a height of ice satisfies:
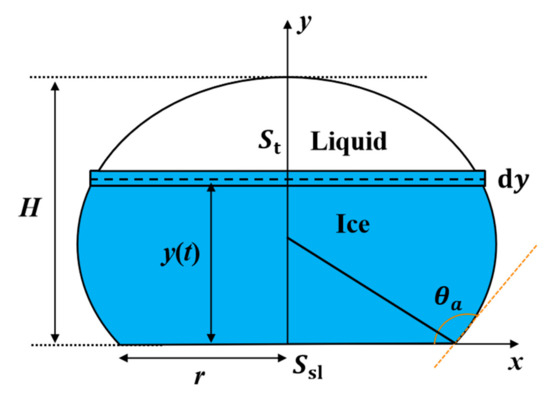
Figure 8.
Icing process of a drop on the subcooling surface.
In Equation (14), the contact area between the droplet and the substrate () will directly affect the freezing time of the droplet. and are the thermal conductivity and density of the ice, respectively. and are the thermal conductivity and thickness of the oxidation layer that covers the surface of the copper, respectively. Considering that the oxidation layer is relatively thin (a few micrometers), the effect on the icing process is negligible. is the degree of subcooling, which is expressed as . is the top interface between ice and liquid water. is the latent heat of fusion from ice to water. t is time. is the liquid–substrate contact area. For a droplet on a smooth surface, is equal to the projection surface area (Sp), which is expressed as , where is the contact radius
Therefore, the required icing time for a drop is obtained using an integration from the bottom to the top
To compute the drop geometry, the ratio of over is expressed as
The height of the drop is expressed as
For a Cassie or Wenzel state droplet on a structured surface, is also influenced by surface roughness and liquid–substrate contact fraction
There were multiple time scales to consider while depositing a droplet on the surface such as the response time of the macroscopic droplet [41], the delayed ice nucleation time [37] and the icing time of the droplet. The icing time of the droplet (a few second) captured was at least three orders of magnitude longer than the droplet dynamic response time (a few microsecond). As the temperature decreased, the delayed ice nucleation time was negligible compared with the icing time of the droplet. Also, due to a high thermal conductivity for the Copper surface, the solid–liquid heterogeneous nucleation rate was dominant compared with the liquid–gas and bulk homogeneous nucleation rates, which was different from an existing study reported for a titanium alloy surface [37]. Therefore, icing time was mainly affected by the surface temperature, droplet liquid–substrate contact area, wetting state and contact angles. In the ultra-low temperature condition, the droplet was in a Cassie state, which effectively extended the icing time.
The icing time as a function of the droplet volume on the testing surfaces at −C is plotted in Figure 9a. The icing time from long to short was Surf 3 > Surf 4 > Surf 2 > Surf 1. This was consistent with the wettability of the testing surface. Icing time on the microstructure surface was extended due to a higher surface hydrophobicity. The icing time as a function of the droplet volume on the testing surfaces at −C is plotted in Figure 9b. The icing time from long to short was Surf 4 > Surf 1 > Surf 2 > Surf 3. The contact angle and wetting state of the droplet in contact with the surface were different compared with that at the surface temperature at −C. As for the ultra-low temperature at −C, the droplet morphology on the testing surface was mainly attributed to the heterogeneous nucleation rate. A higher heat transfer rate allowed a short icing time, as expected. However, as aforementioned, a Cassie state with the reduced ice–substrate contact area extended the icing time, which even required a longer time than the freezing time of the Wenzel drop at −C. The icing time measured in the experiment matches well with theory predicted using the heat transfer model.
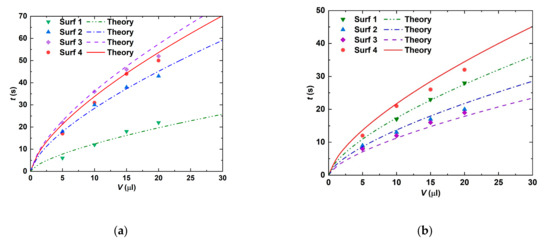
Figure 9.
Experimental measurement and theoretical prediction of the icing time of a droplet on the testing surfaces at (a) −C and (b) −C.
4. Conclusions
The hydrophobicity of the microstructure surface enhanced the anti-icing performance; however, the results depended on the surface temperature. At room temperature, a Cassie state drop preferentially formed on micropillar structures. With a decrease in the surface temperature, the apparent contact angle decreased, and the droplet infiltrated into the structures to form a Wenzel state. With a further decrease in the temperature to −C, the apparent contact angle increased, and a Cassie state drop formed due to the slow motion and rapid freezing of the droplet with an increased viscosity and reduced energy barrier for ice nucleation. As a result, the icing time was extended on the microstructure surface due to the maintenance of strong hydrophobicity at −C and formation of a Cassie state at −C, respectively. This study aimed at providing new insights and possible wetting/freezing states of drop/ice using a microstructure surface for anti-icing purposes. In conclusion, several points representing the major findings of this paper are summarized below:
- When the surface temperature decreased to the ice nucleation temperature of −C, the original surface hydrophobicity degraded, and a Wenzel state drop tended to form on the microstructure surface before ice nucleation.
- The surface hydrophobicity was improved due to the dominance of ice nucleation under an ultra-low temperature at −C, marked by a large contact angle and reduced ice–substrate contact area.
- A Cassie state drop on the microstructure surface creating an air cushion underneath the ice was advantageous to enhance anti-icing performance, including a small ice–substrate contact area, long icing time and strong de-icing capacities under the ultra-low temperature condition.
- The anti-icing performance was affected by the wettability of the surface under the ice nucleation temperature. The thermal dynamics and kinetics of the heterogeneous nucleation rate played a more significant role in the ice inhibition capability under an ultra-low temperature condition.
Funding
This research was funded by the Fundamental Research Funds for the Central Universities, grant number 2022JBMC031.
Data Availability Statement
The data are contained within this article.
Acknowledgments
The author expresses gratitude to Beijing Jiaotong University for providing the necessary support for this experiment.
Conflicts of Interest
The author declares no conflict of interest. The funders had no role in the design of this study; in the collection, analyses, or interpretation of data; in the writing of this manuscript; or in the decision to publish the results.
References
- Esfahani, M.B.; Eshaghi, A.; Bakhshi, S.R. Transparent hydrophobic, self-cleaning, anti-icing and anti-dust nano-structured silica based thin film on cover glass solar cell. J. Non-Cryst. Solids 2022, 583, 121479. [Google Scholar] [CrossRef]
- Zhou, X.; Zhu, Y.; Zhang, Y.; Li, H. A Review of Anti-icing and De-icing Technology of Overhead Ground Wire. In Proceedings of the 2022 International Symposium on Electrical, Electronics and Information Engineering (ISEEIE), Chiang Mai, Thailand, 25–27 February 2022; pp. 282–286. [Google Scholar]
- Fu, L.; Omer, R.; Jiang, C. Field test of organic deicers as prewetting and anti-icing agents for winter road maintenance. Transp. Res. Rec. 2012, 2272, 130–135. [Google Scholar] [CrossRef]
- Huang, X.; Tepylo, N.; Pommier-Budinger, V.; Budinger, M.; Bonaccurso, E.; Villedieu, P.; Bennani, L. A survey of icephobic coatings and their potential use in a hybrid coating/active ice protection system for aerospace applications. Prog. Aerosp. Sci. 2019, 105, 74–97. [Google Scholar] [CrossRef]
- Turner, J.; Anderson, P.; Lachlan-Cope, T.; Colwell, S.; Phillips, T.; Kirchgaessner, A.; Marshall, G.J.; King, J.C.; Bracegirdle, T.; Vaughan, D.G. Record low surface air temperature at Vostok station, Antarctica. J. Geophys. Res. Atmos. 2009, 114, D24102. [Google Scholar] [CrossRef]
- Zhang, Z.; Chen, B.; Lu, C.; Wu, H.; Wu, H.; Jiang, S.; Chai, G. A novel thermo-mechanical anti-icing/de-icing system using bi-stable laminate composite structures with superhydrophobic surface. Compos. Struct. 2017, 180, 933–943. [Google Scholar] [CrossRef]
- Wu, C.; Geng, H.; Tan, S.; Lv, J.; Wang, H.; He, Z.; Wang, J. Highly efficient solar anti-icing/deicing via a hierarchical structured surface. Mater. Horiz. 2020, 7, 2097–2104. [Google Scholar] [CrossRef]
- Varanasi, K.K.; Deng, T.; Smith, J.D.; Hsu, M.; Bhate, N. Frost formation and ice adhesion on superhydrophobic surfaces. Appl. Phys. Lett. 2010, 97, 234102. [Google Scholar] [CrossRef]
- Gao, H.; Jian, Y.; Yan, Y. The effects of bio-inspired micro/nano scale structures on anti-icing properties. Soft Matter 2021, 17, 447–466. [Google Scholar] [CrossRef]
- Tang, Y.; Zhang, Q.; Zhan, X.; Chen, F. Superhydrophobic and anti-icing properties at overcooled temperature of a fluorinated hybrid surface prepared via a sol–gel process. Soft Matter 2015, 11, 4540–4550. [Google Scholar] [CrossRef]
- Emelyanenko, K.A.; Emelyanenko, A.M.; Boinovich, L.B. Water and ice adhesion to solid surfaces: Common and specific, the impact of temperature and surface wettability. Coatings 2020, 10, 648. [Google Scholar] [CrossRef]
- Yao, X.; Song, Y.; Jiang, L. Applications of bio-inspired special wettable surfaces. Adv. Mater. 2011, 23, 719–734. [Google Scholar] [CrossRef] [PubMed]
- Wang, L.; Gong, Q.; Zhan, S.; Jiang, L.; Zheng, Y. Robust anti-icing performance of a flexible superhydrophobic surface. Adv. Mater. 2016, 28, 7729–7735. [Google Scholar] [CrossRef] [PubMed]
- Li, X.; Wang, G.; Moita, A.S.; Zhang, C.; Wang, S.; Liu, Y. Fabrication of bio-inspired non-fluorinated superhydrophobic surfaces with anti-icing property and its wettability transformation analysis. Appl. Surf. Sci. 2020, 505, 144386. [Google Scholar] [CrossRef]
- Cassie, A.; Baxter, S. Wettability of porous surfaces. Trans. Faraday Soc. 1944, 40, 546–551. [Google Scholar] [CrossRef]
- Ruan, M.; Li, W.; Wang, B.; Deng, B.; Ma, F.; Yu, Z. Preparation and anti-icing behavior of superhydrophobic surfaces on aluminum alloy substrates. Langmuir 2013, 29, 8482–8491. [Google Scholar] [CrossRef]
- Li, W.; Zhan, Y.; Yu, S. Applications of superhydrophobic coatings in anti-icing: Theory, mechanisms, impact factors, challenges and perspectives. Prog. Org. Coat. 2021, 152, 106117. [Google Scholar] [CrossRef]
- Wang, Z.-J.; Kwon, D.-J.; DeVries, K.L.; Park, J.-M. Frost formation and anti-icing performance of a hydrophobic coating on aluminum. Exp. Therm. Fluid Sci. 2015, 60, 132–137. [Google Scholar] [CrossRef]
- Karmouch, R.; Ross, G.G. Experimental study on the evolution of contact angles with temperature near the freezing point. J. Phys. Chem. C 2010, 114, 4063–4066. [Google Scholar] [CrossRef]
- Wenzel, R.N. Resistance of solid surfaces to wetting by water. Ind. Eng. Chem. 1936, 28, 988–994. [Google Scholar] [CrossRef]
- Zhang, H.; Zhao, G.; Wu, S.; Alsaid, Y.; Zhao, W.; Yan, X.; Liu, L.; Zou, G.; Lv, J.; He, X. Solar anti-icing surface with enhanced condensate self-removing at extreme environmental conditions. Proc. Natl. Acad. Sci. USA 2021, 118, e2100978118. [Google Scholar] [CrossRef]
- Lee, C.; Nam, Y.; Lastakowski, H.; Hur, J.I.; Shin, S.; Biance, A.-L.; Pirat, C.; Ybert, C. Two types of Cassie-to-Wenzel wetting transitions on superhydrophobic surfaces during drop impact. Soft Matter 2015, 11, 4592–4599. [Google Scholar] [CrossRef] [PubMed]
- Meuler, A.J.; McKinley, G.H.; Cohen, R.E. Exploiting topographical texture to impart icephobicity. ACS Nano 2010, 4, 7048–7052. [Google Scholar] [CrossRef] [PubMed]
- Kulinich, S.; Farhadi, S.; Nose, K.; Du, X. Superhydrophobic surfaces: Are they really ice-repellent? Langmuir 2011, 27, 25–29. [Google Scholar] [CrossRef] [PubMed]
- Ickes, L.; Welti, A.; Hoose, C.; Lohmann, U. Classical nucleation theory of homogeneous freezing of water: Thermodynamic and kinetic parameters. Phys. Chem. Chem. Phys. 2015, 17, 5514–5537. [Google Scholar] [CrossRef] [PubMed]
- Jung, S.; Tiwari, M.K.; Doan, N.V.; Poulikakos, D. Mechanism of supercooled droplet freezing on surfaces. Nat. Commun. 2012, 3, 615. [Google Scholar] [CrossRef]
- Turnbull, D.; Vonnegut, B. Nucleation catalysis. Ind. Eng. Chem. 1952, 44, 1292–1298. [Google Scholar] [CrossRef]
- Kreder, M.J.; Alvarenga, J.; Kim, P.; Aizenberg, J. Design of anti-icing surfaces: Smooth, textured or slippery? Nat. Rev. Mater. 2016, 1, 1–15. [Google Scholar] [CrossRef]
- Cao, L.; Jones, A.K.; Sikka, V.K.; Wu, J.; Gao, D. Anti-icing superhydrophobic coatings. Langmuir 2009, 25, 12444–12448. [Google Scholar] [CrossRef]
- Shen, Y.; Wang, G.; Tao, J.; Zhu, C.; Liu, S.; Jin, M.; Xie, Y.; Chen, Z. Anti-icing performance of superhydrophobic texture surfaces depending on reference environments. Adv. Mater. Interfaces 2017, 4, 1700836. [Google Scholar] [CrossRef]
- Qi, C.; Chen, H.; Shen, L.; Li, X.; Fu, Q.; Zhang, Y.; Sun, Y.; Liu, Y. Superhydrophobic surface based on assembly of nanoparticles for application in anti-icing under ultralow temperature. ACS Appl. Nano Mater. 2020, 3, 2047–2057. [Google Scholar] [CrossRef]
- Cai, Y.; Chang, W.; Luo, X.; Qin, Y. Hydrophobicity of pyramid structures fabricated by micro milling. In Proceedings of the 2017 World Congress on Micro and Nano Manufacturing, Kaohsiung, Taiwan, 27–30 March 2017; pp. 1–4. [Google Scholar]
- Vorobyev, A.Y.; Guo, C. Direct femtosecond laser surface nano/microstructuring and its applications. Laser Photonics Rev. 2013, 7, 385–407. [Google Scholar] [CrossRef]
- He, A.; Liu, W.W.; Xue, W.; Yang, H.; Cao, Y. Nanosecond laser ablated copper superhydrophobic surface with tunable ultrahigh adhesion and its renewability with low temperature annealing. Appl. Surf. Sci. 2018, 434, 120–125. [Google Scholar] [CrossRef]
- Nguyen, T.-B.; Park, S.; Lim, H. Effects of morphology parameters on anti-icing performance in superhydrophobic surfaces. Appl. Surf. Sci. 2018, 435, 585–591. [Google Scholar] [CrossRef]
- Alizadeh, A.; Yamada, M.; Li, R.; Shang, W.; Otta, S.; Zhong, S.; Ge, L.; Dhinojwala, A.; Conway, K.R.; Bahadur, V. Dynamics of ice nucleation on water repellent surfaces. Langmuir 2012, 28, 3180–3186. [Google Scholar] [CrossRef] [PubMed]
- Shen, Y.; Tao, J.; Tao, H.; Chen, S.; Pan, L.; Wang, T. Anti-icing potential of superhydrophobic Ti6Al4V surfaces: Ice nucleation and growth. Langmuir 2015, 31, 10799–10806. [Google Scholar] [CrossRef]
- Lu, Y.; Sur, A.; Pascente, C.; Annapragada, S.R.; Ruchhoeft, P.; Liu, D. Dynamics of droplet motion induced by electrowetting. Int. J. Heat Mass Transf. 2017, 106, 920–931. [Google Scholar] [CrossRef]
- Kruse, C.; Tsubaki, A.; Zuhlke, C.; Alexander, D.; Anderson, M.; Peng, E.; Shield, J.; Ndao, S.; Gogos, G. Influence of Copper Oxide on Femtosecond Laser Surface Processed Copper Pool Boiling Heat Transfer Surfaces. J. Heat Transf.-Trans. ASME 2019, 141, 051503. [Google Scholar] [CrossRef]
- Hou, B.; Wu, C.; Li, X.; Huang, J.; Chen, M. Contact line-based model for the Cassie-Wenzel transition of a sessile droplet on the hydrophobic micropillar-structured surfaces. Appl. Surf. Sci. 2021, 542, 148611. [Google Scholar] [CrossRef]
- Richard, D.; Clanet, C.; Quéré, D. Contact time of a bouncing drop. Nature 2002, 417, 811. [Google Scholar] [CrossRef] [PubMed]


Disclaimer/Publisher’s Note: The statements, opinions and data contained in all publications are solely those of the individual author(s) and contributor(s) and not of MDPI and/or the editor(s). MDPI and/or the editor(s) disclaim responsibility for any injury to people or property resulting from any ideas, methods, instructions or products referred to in the content. |
© 2023 by the author. Licensee MDPI, Basel, Switzerland. This article is an open access article distributed under the terms and conditions of the Creative Commons Attribution (CC BY) license (https://creativecommons.org/licenses/by/4.0/).