Abstract
The use of rapid-hardening cementitious materials for the emergency repair of critical infrastructure in coastal environments is becoming increasingly widespread, and concrete surface hydrophobic protection treatment is equally necessary to improve the durability of both new and old concrete. Among them, silane-based hydrophobic materials play an important role in concrete hydrophobic protection. Graphene oxide (GO)-modified silane materials can significantly improve the hydrophobic performance of coatings, but the hydrophobic mechanism of coatings modifying the sulfoaluminate cement’s main hydration product ettringite (AFt) has not yet been explored. In this study, molecular dynamics simulations were conducted to investigate the wetting properties of water droplets on the surface of AFt, isobutyltriethoxy silane (IBTS)-modified AFt, and IBTS/GO-modified AFt. It was found that the AFt substrate had good hydrophilicity, and the droplets could wet the interface through Ca-O ionic bonds and H-bonds. The IBTS coating initially impeded droplet wetting, but the adsorption stability of IBTS on the AFt substrate surface was poor under droplet action, leading to droplet penetration and dispersion of the IBTS coating on the AFt surface. However, the IBTS/GO coating significantly restricted droplet wetting due to the stable adsorption of GO on the AFt surface and the strong stability of hydrogen bonds between IBTS and GO. In conclusion, selecting a suitable bridging material between AFt and silane is crucial for improving the hydrophobic stability of silane coatings on sulfoaluminate cement materials.
1. Introduction
Concrete is one of the most widely used materials in infrastructure construction [1]. Throughout its lifespan, the durability of concrete structures has always been a focus of researchers to determine the safe operation and service life of buildings [2,3]. However, in coastal environments, concrete is often subjected to problems such as wave erosion (the damage from waves) [4], carbonation (the damage from reactions to CO2) [5], freeze–thaw cycles (the damage from water freezing and thawing) [4,6], wet–dry cycles (the damage from water loss) [7], and harmful ion erosion (the damage from ion intrusion) [8], which can cause concrete damage and cracking. In cases where important infrastructure concrete structures are damaged and need to be temporarily preserved to achieve rapid rescue [9], special cements, such as sulfoaluminate cement, high-alumina cement, and magnesium phosphate cement, usually play a crucial role [10,11]. Among them, sulfoaluminate cement has the advantages of fast setting, high early strength, and low shrinkage [12]. It has the inherent property of slight volume expansion, which can compensate for shrinkage and prevent concrete from cracking. It not only has better resistance to chloride and sulfate than high-alumina cement but also compensates for the weakness of magnesium phosphate cement in terms of water corrosion resistance [12]. Therefore, sulfoaluminate cement is favored in emergency repair projects.
Meanwhile, hydrophobic treatment places high demands on the concrete used in marine engineering [13]. Effective waterproof treatment can significantly reduce the surface energy of concrete, improve the hydrophobicity of composite materials, reduce water ingress and the intrusion of harmful ions caused by water transport [14], and prevent the corrosion of reinforcement [15,16,17]. Among them, silane groups have strong inorganic silicon-oxygen main chains and flexible hydrophobic organic tails and are widely used for the surface treatment of metals, glass, polymers, and ceramics [18,19,20].
In the construction industry, silane coating is an effective surface treatment method to improve the durability of concrete. Silane-based waterproof materials can penetrate to a certain depth on the surface of the concrete by utilizing their permeability and form a strong waterproof film layer that can maintain the permeability and water vapor permeability of the concrete surface [21]. This enables concrete to “breathe” freely [22] and has been widely used in the waterproof protection of concrete. The surface modification of sulfoaluminate cement-based materials from the aspects of the water absorption rate, carbonate mineralization rate, and pore structure by different silanes showed that isobutyltriethoxy silane (IBTS) was effective in hydrophobicity and anti-carbonation, with a reduced water absorption rate of up to 94.0%, which can effectively reduce the porosity below 50 nm and densify the microstructure.
One study [23] showed the influence of IBTS coating and coating layers on the chloride ion penetration resistance of concrete and found that the inhibition effect of a two-layer coating on the chloride ion-penetration resistance of concrete was the most significant. The waterproof effect of silane on cement-based materials under different exposure environments was evaluated and it was found that the waterproofing effect of the impregnation layer on the surface of cement-based materials was better under a relative humidity of approximately 50% [24]. Additionally, Zhu et al. [25] studied the protective properties of silane on the high water absorption rate of recycled aggregate concrete and found that silane treatment could effectively improve the anti-capillary water absorption, anti-carbonation, and anti-chloride ion-penetration properties of recycled aggregate concrete but could lead to a decrease in compressive strength. Wu et al. [26] found that the monomer viscosity of silane was low, and the volatility was strong. When in a high-temperature, low-humidity, and windy environment, the hydrophobic component of silane evaporated quickly, which seriously affected the application of silane on the surface of the concrete.
Therefore, researchers have carried out modification studies on silane waterproof materials. Among them, graphene oxide (GO) has unique and excellent mechanical [27,28], chemical [29], and electrical [30] properties due to its nanoscale two-dimensional layer structure and high specific surface area. Studies have found that graphene oxide can not only regulate the microstructure of cement hydration crystals, improve the strength of cement-based materials, and delay crack development [31,32] but also prevent the intrusion of harmful ions from the outside [33], making it an ideal material for concrete reinforcement. Currently, one research team has successfully used GO to nanomodify IBTS to produce IBTS/GO composite emulsions and has found that the IBTS/GO composite emulsion improved the water resistance [34] of silicate cement-based materials compared to IBTS.
However, research on the improvement of sulfate-aluminum cement-based materials using IBTS/GO composite emulsions is relatively scarce, and the interaction mechanism between IBTS/GO and sulfate-aluminum cement-based materials is not yet clear. Traditional experimental methods have difficulty breaking through the limitations of the nanoscale. Fortunately, molecular dynamics (MD) simulations can reveal the mechanisms between molecules at the nanoscale and display the movement patterns of molecules under different environmental factors. There have been a large number of studies on the adsorption and transport properties of solutions in the nanopores of cement hydration products, among which Yu et al. [35] used the MD method to investigate the adsorption and transport ability of water in C–S–H nanopores under different silicon coverage rates, believing that the rate of water ingress was inversely proportional to the silicon coverage rate, and the silicon coating would significantly reduce the adsorption capacity of the C–S–H interface to water molecules. Duan et al. [14] found that the IBTS coating could effectively block water transmission in AFt (ettringite, the main hydration product of sulfoaluminate cement) nanopores, and the GO-modified IBTS coating further improved its hydrophobic efficiency by forming a composite hydrogen-bond (H-bond) network. Wang compared the wetting characteristics of nanodroplets on the surfaces of various cement hydration products and revealed the driving force for water-droplet wetting based on the microstructures of different atoms at the water/substrate interface. Li et al. [36] used the MD method to investigate FAS-modified C–S–H and proposed a coating modification scheme for resisting saltwater erosion. However, the protection mechanism of hydrophobic coatings on the surface of AFt, the movement patterns of water droplets, and the driving force for wetting at the interface of water molecules are currently unknown.
This study used the MD method to investigate the wetting phenomenon of water droplets on the surface of the main hydration product AFt in fast-hardening sulfoaluminate cement, as well as the effects of one-layer IBTS and IBTS/GO coatings on the wettability of droplets on the surface. The wetting driving force of droplets at the AFt interface was explored from a molecular perspective, and the influence of the coating on the interaction force and motion behavior of water molecules in water droplets was identified. This study provides molecular insights into the adsorption and hydrophobic characteristics of coatings on the AFt surface, as well as the application of coatings in emergency repair projects.
2. Methods
2.1. Model Construction
The model construction of the substrate is divided into two parts, consisting of the AFt substrate and coatings. The AFt initial cell model was obtained from the Crystallography Open Database [37], as shown in Figure 1a,b, with a size of 21.35 Å × 11.17 Å × 19.34 Å, and the molecular formula is a column structure of 3CaO·Al2O3·3CaSO4·32H2O. The [Al(OH)6]3− octahedrons and CaO8 polyhedrons are arranged alternately along the direction of the column, forming a cylinder [Ca3Al(OH)6·12H2O]3+, SO42− and water molecules in a hexagonal distribution along the central axis of the cylinder in the gap of the cylinder [38]. The hydroxylated IBTS monomer model and GO model are displayed in Figure 1c,d. In the GO model, hydroxyl, carboxyl, and epoxy groups are randomly located on both surfaces of GO. The number of functional groups occupies 10% of the number of carbon (C) atoms in the GO sheet, and the size of GO is 47.63 Å × 45.25 Å. The –COOH groups are located at the edges of GO, whereas the –O– and –OH groups are distributed on the surface of GO and they do not occupy the same carbon atom. The details of GO are shown in Figure 1d.
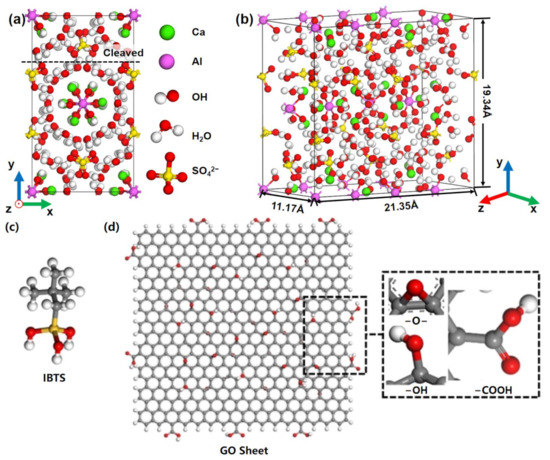
Figure 1.
(a,b) Diagram of the AFt unit cell. Diagram of the (c) IBTS model and (d) GO model.
The AFt cell was expanded 12 times along the x–direction and 6 times along the z-direction using supercell demand in Material Studio. Then, it was cut on the optimal cleavage plane (010) to obtain the AFt substrate [39], whose size was 134.04 Å ×128.10 Å × 19.34 Å.
A total of 432 IBTS monomers were completely laid on the surface of the AFt substrate to build the IBTS–modified AFt substrate model. On the basis of the substrate above, the GO was placed under the central IBTS to build the IBTS/GO–modified AFt substrate model. It is worth noting that the IBTS molecules were placed 2 Å above the AFt substrate surface in the AFt/S system, and in the AFt/S/GO system, the IBTS molecules and GO sheets were placed 2 Å above the AFt substrate surface, with the distance between GO and the surface–bound IBTS molecules also being 2 Å. Then, a cubic water droplet (1 g/cm3) with a size of 28.80 Å × 28.80 Å × 28.80 Å containing 800 water molecules, constructed using the Amorphous Cell tools in Material Studio, was placed on the surface of the AFt, IBTS–modified Aft, and IBTS/GO–modified AFt substrate. In addition, to eliminate the influence of the lower boundary of the AFt substrate on the droplet because of the existence of a periodic boundary, a sufficiently sized vacuum was expanded in the Y–direction. The model diagram of the three systems is shown in Figure 2.
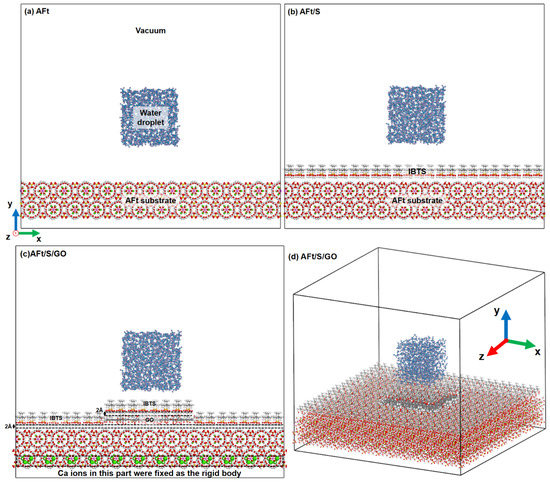
Figure 2.
The models of (a) Aft, (b) AFt/S, and (c,d) AFt/S/GO.
2.2. Force Field and Simulation Details
The ClayFF force field [40] was employed to accurately describe the interactions between the cement hydration products and solutions and to calculate the differences in the surface wetting behavior and state of water droplets on the AFt substrate. The SPC model was used to simulate the water molecules [41]. In addition, the sulfate parameter of AFt was chosen according to the research of Cannon [42], and the OPLS–AA force field [43] was used to describe the interaction parameters of IBTS and GO.
The simulations of the three systems were performed in LAMMPS [44]. Throughout the simulations, the models used a time step of 1 fs, were kept at 300 K, and were equilibrated for 1 ns at the canonical (NVT) ensemble. Atoms located in the range of 5–10 Å of the AFt substrate were set as rigid bodies to ensure the stability of the AFt substrate. The simulations consisted of two parts. First, the AFt, AFt/S, and AFt/S/GO substrates were optimized for 1 ns to ensure that the energy of the system remained stable. After the system reached equilibrium, the droplets fell freely on the substrate surface, and the system continued to operate for 2 ns. Finally, the atom coordinates were counted every 0.1 ps, and 20,000 atomic trajectories were obtained, which were used for structure and dynamic analysis.
The analysis software included VMD and Matlab. VMD software (1.9.3) was used to process the trajectory to obtain the image, and Matlab software (R2020a 9.8.0.1323502) was used to analyze the parameters of the study.
3. Results and Discussion
3.1. Wetting Behavior of Droplets at the Different System Interfaces
Figure 3 shows snapshots of the wetting behavior of water droplets on different surfaces at different times during the simulation process. As shown in Figure 3a, the water droplet appeared to be wet and spread on the surface of the AFt substrate during the simulation process. As the simulation time increased, the area of the droplet spreading on the surface increased, indicating that the AFt substrate had good wettability toward water droplets. In contrast, the process of water–droplet wetting at the AFt/S system interface is displayed in Figure 3b. Initially, the water droplet contacted the IBTS coating and exhibited a nonwetting state on the low–surface–energy hydrophobic alkyl surface. Then, as the simulation time increased, the water droplet penetrated and disrupted the coating composed of IBTS monomers and directly contacted and wetted the AFt substrate surface. As shown in Figure 3c, in the AFt/S/GO system, the water droplet existed in a spherical shape after falling onto the surface of the IBTS/GO composite coating, and during the 2000 ps simulation process, the droplet remained on the IBTS/GO coating surface, and its motion along the xoz plane was restricted. The wetting behavior did not change significantly. Most of the IBTS monomers were adsorbed on the GO surface, and some of the IBTS monomers were detached and attached to the water droplet. In summary, the AFt substrate is hydrophilic, and the modification of the IBTS single–layer coating reduced the wettability of the water droplet on the AFt substrate, whereas the modification of IBTS/GO effectively restricted water wetting.
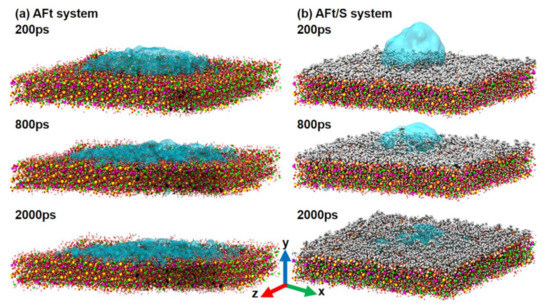
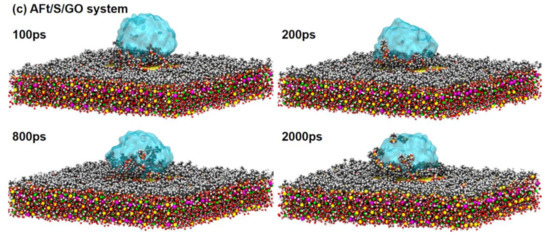
Figure 3.
Snapshots of the wetting process of water droplets on the surfaces of the (a) AFt, (b) AFt/S, and (c) AFt/S/GO systems.
To quantitatively understand the wetting conditions of water droplets at the substrate interface of the different systems, the evolution of the contact angle over time was calculated, as shown in Figure 4. From the distribution curve of the contact angle changing with time, it can be seen that in the AFt system, water droplets first fell onto the AFt substrate surface at a faster speed and then wetted the AFt surface. The value of the contact angle decreased rapidly to 21.2° at 500 ps and 11.6° at 1500 ps and remained stable in the later period. In the AFt/S system, water droplets first contacted the IBTS coating, and the initial contact angle on the IBTS coating was approximately 100°. With the simulation operating, after 400 ps, the contact angle gradually decreased, indicating that water droplets had good wettability at the interface, and the change in this phenomenon may be related to the desorption of the IBTS coating, namely the water droplets broke through the IBTS coating and directly contacted the AFt substrate, wetting its surface. In contrast to the AFt/S/GO system, the contact angle value of water droplets always fluctuated at approximately 132° after self–dripping onto the surface of the IBTS/GO composite coating, indicating that the composite coating effectively prevented water diffusion.
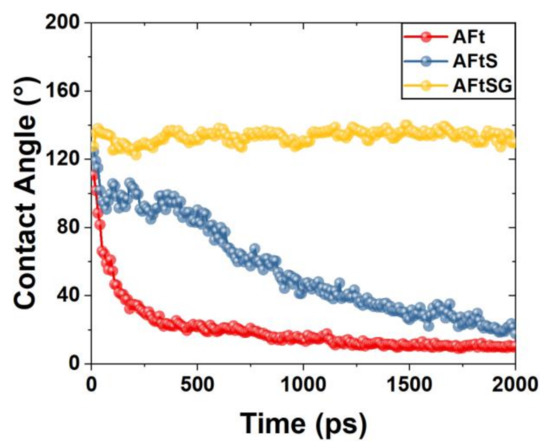
Figure 4.
Statistical diagram of contact angle variation over time.
Atomic intensity diagrams can be used to quantitatively analyze the droplet distribution in different systems. The atomic and ionic intensity distributions in the droplet equilibrium state from 1800 to 2000 ps were analyzed, as shown in Figure 5. The surface line of AFt was at 24 Å, where Ca, Al, S, Oh, Oso42−, and Owi represent calcium ions, aluminum atoms, sulfur atoms, oxygen atoms of hydroxyl groups, sulfate ions, and bound water in the AFt substrate, respectively. Ow represents the oxygen atom in the droplet, Si is the Si atom in IBTS, and C comes from GO. The intensity distribution of atoms after droplet wetting on the AFt substrate in the AFt system is shown in Figure 5a. The curve of Ow atoms exists in the interior of the AFt substrate across the surface line, indicating that the droplet will enter the interior of the AFt substrate in large quantities during the wetting process. At the same time, it was observed that Owi atoms also crossed the surface line and existed on the surface of the AFt substrate, indicating that the bound water molecules inside the AFt substrate would exchange with the water of the droplets. In addition, atoms in AFt were distributed across the surface lines, indicating that the structure of the AFt surface would change, and internal ions would disintegrate during the process of droplets wetting onto AFt.
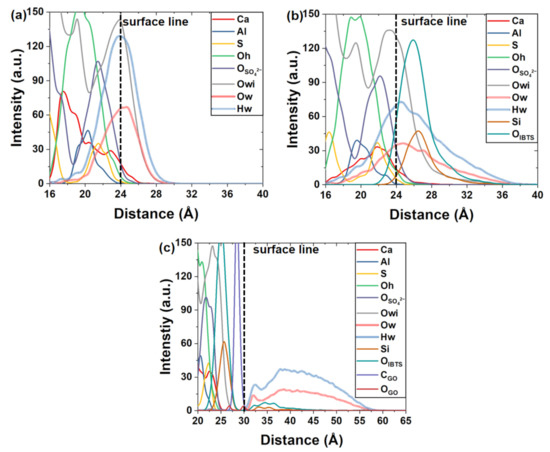
Figure 5.
Intensity distribution diagram of atoms and ions in the (a) AFt, (b) AFT/S, and (c) AFT/S/GO systems.
In the AFt/S system, as illustrated in Figure 5b, water molecules in water droplets also penetrated the IBTS coating, touched the AFt substrate, and wetted the interface, but the intensity distribution of Ow at the interface was significantly lower than that in the AFt system. Moreover, the overlapping distribution of the Si, Owi, and Ow curves in the z–direction indicates that droplets penetrated the IBTS into the AFt substrate and exchanged water molecules with it. However, some droplets were still blocked by the IBTS coating.
In the AFt/S/GO system, as shown in Figure 5c, it can be seen from the atomic intensity curve that the Ow curve is located on the right side of the C atomic curve, Owi atoms are distributed on the left side of C, and Si and Ow have overlapping distributions, showing that the combination of GO and IBTS successfully prevented droplets from diffusing on the GO surface and contacting the AFt substrate. The interaction between GO and IBTS made it difficult for IBTS to be dispersed by droplets, and the graphene sheet also had non–wetting properties. Additionally, the stability of the interaction between GO and IBTS was stronger than that between GO and the AFt substrate, which further prevented the diffusion of the droplet.
To investigate the wetting characteristics of droplets, the dipole moment of water molecules at the interface of the different systems within the range of surface lines ±1.5 Å was calculated, which can reflect the polarity characteristics of water molecules in droplets at the AFt interface and characterize the influence of the coating on the hydrophilicity and hydrophobicity at different interface locations. Figure 6 and Table 1 show the dipole moments of the three systems within the time interval of 1800~2000 ps. In the AFt system, the dipole moment value was approximately 2.5 D, which was consistent with previous research [45]. The peak value was greater than the value (2.44 D) of water molecules in bulk water reported previously [46], indicating that the Aft substrate showed good hydrophilicity. After IBTS modified the Aft surface, the peak value of the dipole moment was 2.48 D, slightly less than that of water droplets in the Aft system, and the dipole moment curve shifted slightly to the left, indicating that the IBTS coating changed the interaction between the Aft substrate and water. In the Aft/S/GO system, the dipole moment on the surface of the IBTS/GO composite coating moved further to the left compared to the Aft/S system, indicating that the affinity of the IBTS/GO composite coating to water molecules was smaller than that of the Aft substrate.
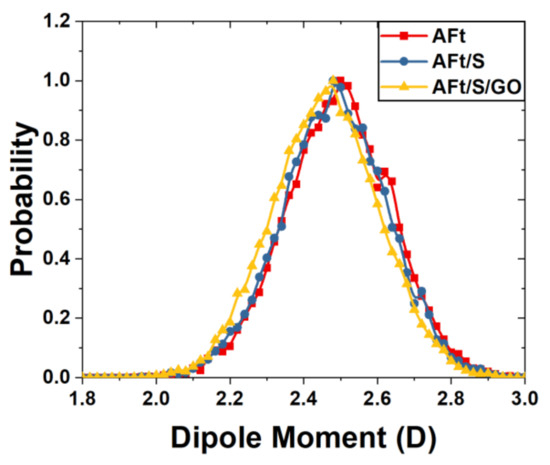
Figure 6.
Dipole moment distribution curve of water molecules at the interface.

Table 1.
The values of dipole moment in different systems.
3.2. Local Structure
The radial distribution function (RDF) can help analyze the interactions between the coating and AFt substrate, the interactions between coatings, and the interaction between the droplet and the substrate. In this section, the interaction between different atoms is analyzed and displayed as RDF curves.
To understand the interaction between IBTS–AFt and GO–AFt, the RDF curves between the coating and AFt substrate of the AFt/S and AFt/S/GO systems are shown in Figure 7a,b. Figure 7a shows that the interaction of IBTS and AFt in the AFt/S system can be divided into two forms, ionic bonds and H–bonds. The Ca ions in the AFt substrate and oxygen atoms (OIBTS) in IBTS have an obvious peak at 2.45 Å. The results show that there existed an ionic interaction between them in the form of Ca–OIBTS ionic bonds. In addition to the interaction between Ca–OIBTS ions, there was an H–bond interaction between IBTS and the AFt substrate. According to the RDF diagram, the H atoms (HIBTS) in the hydroxyl group of IBTS interacted with the Oh atoms, Owi atoms, and Oso42− atoms, as the RDF curves have obvious peaks at 1.7 Å, 1.75 Å, and 1.65 Å, respectively. The positions of the peaks in different H–bonding curves indicate that the Oso42− atoms more easily formed H–bonds with the HIBTS atoms, followed by the Oh and Owi atoms.
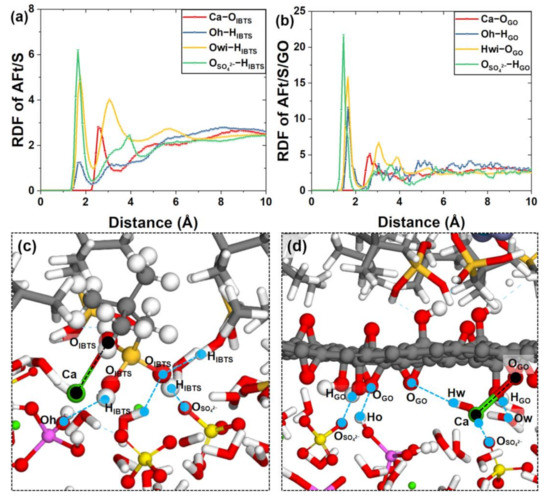
Figure 7.
RDFs of (a) IBTS and (b) GO interacting with the AFt substrate. Snapshots of (c) AFt–IBTS and (d) AFt–GO.
By comparing the peaks of the three types of H–bond RDF curves, it can be seen that the Oso42– atoms formed the largest number of H–bonds with IBTS, followed by the Owi and Oh atoms, indicating that Oso42− atoms accepted H–bonds from IBTS due to their high electronegativity. As there were far more Owi atoms in the AFt interface than Oh atoms, more Owi atoms with weaker electronegativity formed H–bonds with HIBTS. The microstructure between IBTS and the atoms of the AFt substrate is displayed in Figure 7c.
In the AFT/S/GO system, the RDF curve of the ionic bond interaction between the GO and AFt interface was calculated, as shown in Figure 7b. GO also interacted with the AFt substrate via ionic bonds and H–bonds. The peak of the Ca–OGO curve located at 2.5 Å indicates that the Ca ions in the AFt substrate interacted with the oxygen atoms in GO. For H–bonding, Os and HGO have prominent and sharp peaks at 1.5 Å, indicating strong H–bonding between Oso42−–HGO atoms. For H–bonding between Oh–HGO and Hwi–OGO, the peak of the RDF is located at 1.75 Å, which is obviously offset to the right compared to the Os–HGO curve, indicating that the H–bonding ability between them was slightly weaker than that of Oso42−–HGO. Compared with IBTS, GO was more inclined to form a H–bond with the AFt substrate. The microstructure of the interactions between GO and the AFt substrate is shown in Figure 7d.
Figure 8a illustrates the RDF of the interaction between IBTS and GO. The peak of HIBTS–OGO at 1.75 Å indicates that IBTS donated H–bonds to oxygen atoms on the GO surface and rarely received H–bonds from functional groups on the GO surface. The local microstructure of the H–bond between IBTS–GO is shown in Figure 8b.
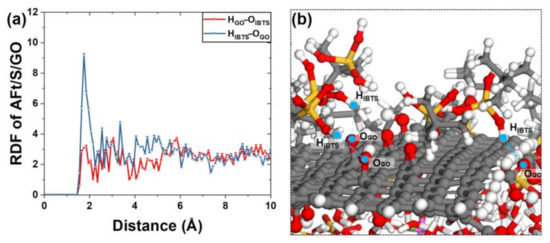
Figure 8.
(a) RDFs of IBTS–GO; (b) local structure of IBTS–GO.
The RDF curves of atoms in droplets interacting with the particles in the AFt substrate were calculated. Figure 9a shows the forms of interaction between water droplets and the AFt substrate in the AFt system, including ionic and H–bonds. The RDF of Ca–Ow possessed a sharp peak at 2.45 Å, demonstrating that strong ionic bonds existed between water droplets and the AFt substrate. For the RDF curve of the H–bond, it can be seen that the RDF of Oso42−–Hw had an obvious peak at 1.5 Å, whereas the locations of the Oh–Hw and Owi–Hw peaks were at 1.75 Å and 1.85 Å, respectively, showing that Oso42− atoms in AFt were more likely to produce H–bonds with Hw atoms in droplets. The local microstructure of the interactions of the different atoms is shown in Figure 9c and Figure 9d.
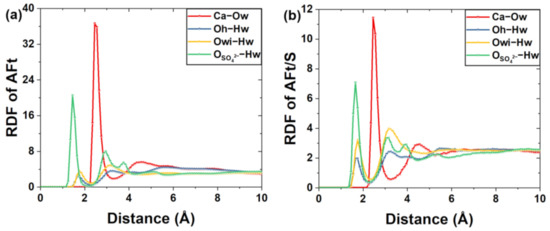
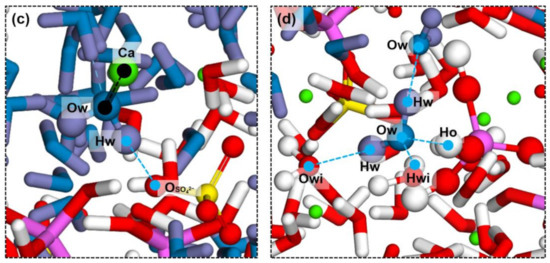
Figure 9.
RDF curves of droplets interacting with the AFt substrate in the (a) AFt system and (b) AFt/S system; local structure of the (c,d) water–AFt substrate.
Figure 9b shows the RDF curve of the water droplets interacting with the substrate in the AFt/S system. The Ca–Ow curve also occupied a peak at 2.45 Å. For the H–bond, the peak position of the RDF of Oso42−–Hw was 1.65 Å. Compared to the curve of the AFt system, there was a clear shift to the right, indicating that the presence of IBTS changed the H–bonding between the water droplets and Os atoms. The peaks of the RDF curves of Oh–Hw and Owi–Hw were at 1.75 Å and 1.85 Å, respectively, and the presence of IBTS did not significantly affect the interaction distance between H–bonds.
In terms of the RDF peak value, based on the combination of the two systems, the peak value in the presence of the IBTS coating was significantly smaller than that in the AFt system, indicating that IBTS had a significant influence on the wetting of the water droplets at the AFt interface.
3.3. Distribution Characteristics of Water Molecules at the Interface
Based on the existence of the above H–bond interactions, Figure 10 displays the distribution of the average H–bond numbers of water molecules in droplets in the y–direction of the three systems, which can intuitively indicate whether water molecules accepted or donated H–bonds and explain the distribution of the H–bond supply of water molecules at the interface position. The definition of the H–bond is displayed in Figure 10a, requiring that the distance between the hydrogen atom in the H–bond donator and the oxygen atom as the H–bond acceptor be closer than 2.45 Å, and the angle between both oxygen atoms in the water molecules and the OH vector as the donator be less than 30°.
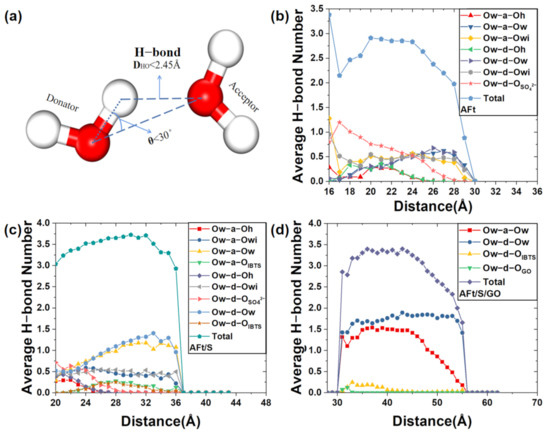
Figure 10.
(a) Schematic diagram of H–bonds; statistical diagrams of the average H–bond supply quantity of individual water molecules in different position intervals in the (b) AFt, (c) AFt/S, and (d) AFt/S/GO systems.
As shown in Figure 10b, the water invaded the interior AFt substrate and was located within the surface line with H–bonding interactions with hydrophilic ions in the interior of the AFt substrate. According to the observation along the surface line toward the interior direction of the AFt substrate (z–negative direction), the average H–bond of a single water molecule showed a trend of stabilizing first and then decreasing, indicating that water molecules existed in a relatively stable state within a certain range inside the interface. However, within 20 Å inside the AFt substrate, the supply relationships of the H–bonds between the water molecules in the droplet, Ow–a–Ow (an Ow atom in a water molecule accepted the H–bond from a Hw atom in another water molecule), and Ow–d–Ow (Hw atoms in one water molecule donated to Ow atom H–bonds in another water molecule), decreased significantly, indicating that water molecules inside the substrate were affected by the action of other ions, which weakened the H–bond binding sites. The number of Ow–d–OSO42− showed an increasing trend, and the number was the largest, demonstrating that sulfate ions with greater electronegativity were the main H–bond acceptors. The decrease in the total number of H–bonds was due to the change in Ow–a–On, and the number of H–bonds accepted by water molecules in the droplets decreased significantly, indicating that cations (Ca ions) in the AFt substrate formed Ca–Ow ionic bonds with oxygen atoms in water, thus replacing the sites where Ow accepted H–bonds. According to the observation along the surface line in the direction outside the AFt substrate (y–positive direction), the average number of H–bonds showed a decreasing trend, mainly because the number of H–bonds contributed to the gradual decrease of sulfate ions and hydroxyl groups as they moved away from the AFt substrate. In addition, the supply of H–bonds inside the droplets in the droplet gradually tended to balance. Meanwhile, Ow–a–Owi and Ow–d–Owi also reached dynamic equilibrium because water molecules in the middle of AFt were exchanged into the droplet after dissociation. Outside 28 Å, due to the location on the surface of the droplet, the H–bond supply direction of the water molecules was toward the interior of the droplet, making the sites receive H–bonds vacantly, and the average H–bonds decreased sharply.
In the AFt/S system, as shown in Figure 10c, droplets broke through the single layer of the IBTS coating and penetrated the interior of the AFt substrate. In addition, the average H–bonds of water molecules within the surface line gradually decreased along the z–negative direction, which also indicated that ionic bonds replaced the receiving sites of H–bonds to reduce the number of H–bonds. Beyond the surface lines, the average number of H–bonds of water molecules increased slightly and tended to be stable, illustrating that the presence of the IBTS coating limited the dissolution ability of ions in the AFt substrate and enhanced the interfacial stability. At the same time, IBTS, as an amphiphilic material, on the one hand, restricted water penetration through the alkyl groups with high surface energy at the hydrophobic end, and on the other hand, it formed an H–bond network with water molecules through the hydrophilic end so that water molecules could exist relatively stably at the AFt/S interface. In addition, the H–bond supply relationship between the inner droplets outside the positive direction of y along the interface line was Ow–d–Ow > Ow–a–Ow, which also confirms that Ow atoms were exposed in the outermost layer, and hydrogen atoms provided H–bonds to Ow atoms in the lower outer layer.
In the AFt/S/GO system in Figure 10d, the droplets located on the surface of GO supplied H–bonds to GO and IBTS, whereas the supply relationship of H–bonds inside the droplets was always Ow–a–Ow < Ow–d–Ow. The total average number of H–bonds was closely related to the Ow–a–Ow number, indicating that Hw atoms in the outermost layer of the droplet easily supplied H–bonds to Ow atoms inside the droplet, whereas the H–bond receiving site of the surface water molecules was vacant. The water molecules located at the GO interface supplied H–bonds to the Os atoms of the polar groups on the surface, but almost no H–bonds from GO and IBTS were detected, indicating that a relatively stable interaction was formed between GO and IBTS through H–bonding, which improved the surface energy and prevented the droplet from wetting through the polar functional groups on the GO surface.
The interaction energy is used to reflect the interaction relationship between AFt and droplets in different systems [14]. Figure 11 displays the interaction energy of AFt and droplets at 2000 ps. The interaction energy values of droplets in the AFt, AFt/S, and AFt/S/GO systems were −18,116.9 kcal/mol, −12,047.8 kcal/mol, and −323.58 kcal/mol, respectively. The AFt substrate, as a hydrophilic substrate, had the strongest effect on droplets. The presence of IBTS in the AFt/S system significantly weakened the interaction between the AFt substrate and droplets, which also confirmed that IBTS could effectively weaken the affinity of AFt to water molecules. The presence of GO in the AFt/S/GO system shielded the interaction between droplets and the AFt substrate. The root cause of this shielding effect was that GO and IBTS formed a stable bond cooperation, thus increasing the surface energy of the interface and improving the ability of anti–droplet wetting.
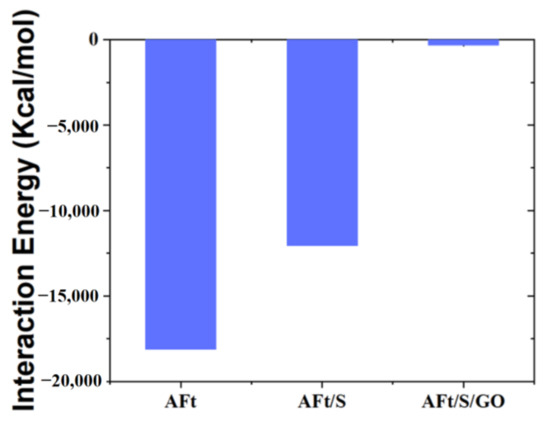
Figure 11.
Interaction energy of droplet and AFt substrate at 2000 ps.
The orientation distribution of water molecules is usually characterized by the dipole angle (DA), which helps understand the distribution characteristics of water molecules at the interface and reveals the influence of the substrate and coating on the wetting behavior of water molecules. Figure 12 shows the definition of the calculation method of the DA of water molecules. The vector perpendicular to the substrate pointing upwards is called φa, the vector addition of two OH vectors of water molecules is called φb, and the angle between the φa and φb vectors is defined as DA (φc).
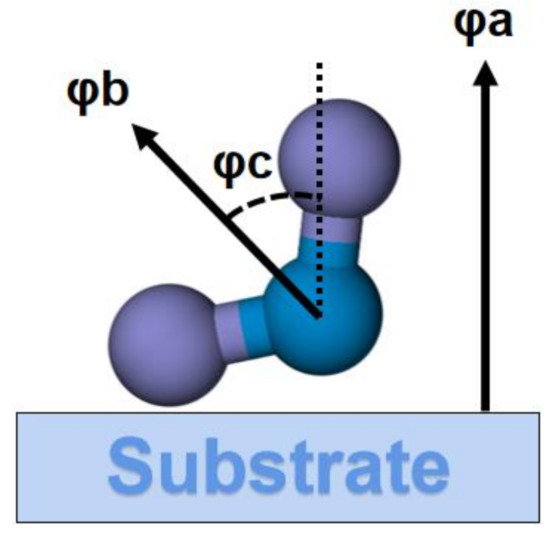
Figure 12.
Definition of the dipole angle.
Figure 13a shows the distribution of the DA of water molecules at the AFt interface (surface line ±2 Å) position. Within the range of 22–24 Å inside the surface line, a broad peak was observed in the angle range of 65°–115°, and the angle distribution was relatively symmetrical. This indicates that water molecules showed a specific orientation due to the H–bond interaction between the internal ionic bonds and polar functional groups of the AFt substrate, as shown in Figure 13b. In the range of 24–26 Å, the angle distribution of water molecules became significantly broader, indicating that the restriction of water molecules by the AFt substrate was reduced, and the orientation of water molecules became freer.
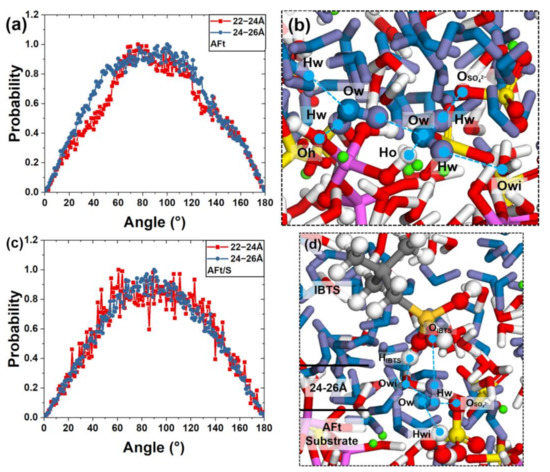
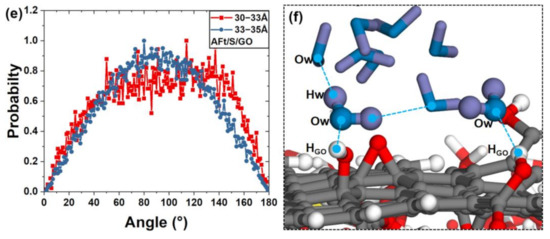
Figure 13.
DA distribution diagrams of the (a) AFt, (c) AFt/S, and (e) AFt/S/GO systems. Local structure diagrams of water molecules in the (b) Aft, (d) Aft/S, and (f) Aft/S/GO systems.
In the AFt/S system shown in Figure 13c, compared to the AFt system, the water DA distribution within 2 Å inside the surface line was freer, indicating that the IBTS coating reduced the restriction of the AFt substrate on water molecules. In the range of 24–26 Å, the DA of water molecules tended to be approximately 90°. This is because the water molecules that penetrated the interface between IBTS and AFt were affected by both the substrate and the coating. In other words, the water molecules donated H–bonds to the OIBTS atoms of IBTS and the On atoms in the AFt substrate, resulting in a distribution of the orientation with a peak at approximately 90°, as shown in Figure 13d.
Figure 13e shows the water molecule DA distribution within the 5 Å region outside the surface line. In the 30–33 Å region, compared to the AFt system and the AFt/S system, the orientation distribution outside the surface line was freer. The proportion of DAs between 10° and 50° significantly increased. This is because water molecules received H–bonds from the oxygen–containing functional groups on GO, and the HO vector in the water molecules pointed toward GO, as shown in Figure 13f. In addition, due to the occupation of the oxygen–containing functional groups on the surface of GO by IBTS and the partially infiltrated water molecules, water molecules exhibited a free distribution characteristic on the low–surface–energy graphene surface.
3.4. Dynamic Properties
The time correlation function (TCF) is a measure of the temporal correlation between physical quantities, providing a qualitative characterization of the stability of chemical bonds formed between the coating and Aft substrate, as well as water and the substrate.
The TCF curves in 1950–2000 ps are shown in Figure 14. Figure 14a shows the TCF curve of IBTS and Aft. With increasing time, the TCF values of IBTS and AFt decreased significantly. The TCF values of Oh–HIBTS, Os–HIBTS, and Owi–HIBTS decreased to 0.55, 0.75, and 0.34, respectively, at 50 ps, which corresponded to the peaks in the H–bond curve of the RDF. This indicates that the stability of H–bonds between the AFt substrate and IBTS followed the order Os–HIBTS > Oh–HIBTS > Owi–HIBTS. The TCF value of Ca–OIBTS decreased to 0.59, showing that the stability of the Ca–OIBTS ionic bond at the AFt interface was slightly stronger than that of the H–bonds.
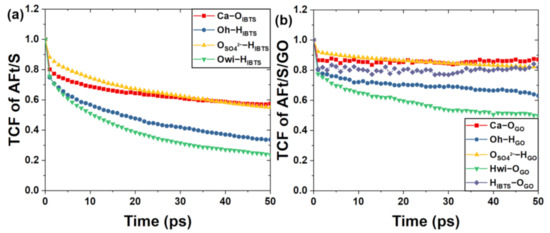
Figure 14.
TCF of the interaction between the coating and AFt substrate in the (a) AFt/S system and (b) AFt/S/GO system.
The TCFs of GO and AFt are illustrated in Figure 14b. Compared to the AFt/S system, the TCF attenuation values of Ca–OGO, Oh–HGO, Os–HGO, and Owi–HGO were all smaller. The TCF value of Os–HGO attenuated to 0.80 within 50 ps, demonstrating that the H–bonding of Os–HGO was more stable than that of Os–HIBTS. The TCF values of Oh–HGO and Hwi–OGO were 0.62 and 0.50, respectively, both of which were not less than 0.5, showing good stability. The H–bond stability was also Os–HGO > Oh–HGO > Hwi–OGO. The TCF value of Ca–OGO decreased from 1 to 0.88, indicating that the ionic bond of Ca–OGO also showed good stability on the AFt surface. The TCF results illustrate that the bond stability of GO and the AFt substrate was better than that of IBTS and the AFt substrate.
In addition, according to the TCF curve of HIBTS–OGO, the TCF curve decreased to 0.81 over 50 ps, indicating that IBTS was still adsorbed on the GO surface with relatively stable H–bonding in the presence of water droplets, thus further restricting the wettability of the droplet at the coating interface.
In addition, the bonding stability between water droplets and atoms of the ettringite substrate in the time interval of 1950–2000 ps was studied, as shown in Figure 15. In the AFt system shown in Figure 15a, the final TCF values of Ca–Ow and Os–Hw were 0.71 and 0.65, which were attenuated by 0.29 and 0.35, respectively, in the time interval of 50 ps, showing strong bonding stability. For the TCF curves of Oh–Hw and Owi–Hw, it can be seen that the values of the curves decayed rapidly in the first 10 ps and then at a lower rate, and the attenuation values in the whole interval were 0.69 and 0.85, demonstrating that the H–bonds between Oh and Owi atoms and Hw were weak.
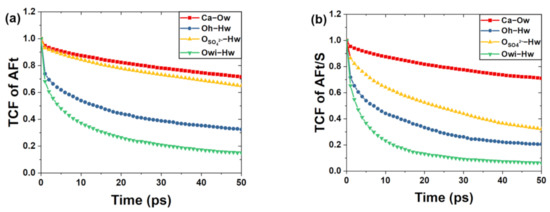
Figure 15.
TCF of the interaction between the droplets and AFt substrate in the (a) AFt system and (b) AFt/S system.
As shown in Figure 15b, in the AFt/S system, the TCF value of Ca–Ow decayed by 0.3 in the last 50 ps, which is similar to the Ca–Ow TCF curve in the AFt system. Ionic interactions between water droplets and Ca ions showed good bond–formation stability. For the TCF curve of the H–bond, the TCF values of Oh–Hw, Os–Hw, and Owi–Hw were 0.69, 0.80, and 0.92, respectively, at 50 ps, showing relatively weak H–bond interactions. In contrast to the AFt system, the presence of the IBTS coating in AFt/S greatly reduced the stability of the H–bond interaction of droplets and the AFt substrate and reduced the binding ability between water droplets and AFt.
The mean square displacement (MSD), a parameter that can characterize the motion state of particles in a system over time, can reflect the motion characteristics of particles. Figure 16 shows the MSD of water molecules in water droplets in the three systems after free release, and it can be seen that the MSD curves of the different models are distributed in a parabolic shape. In the first 100 ps after releasing water droplets, water molecules fell freely, and their MSD values increased rapidly. The curves in the three systems almost coincided. With the operation of the simulation, the variation trend of the MSD value changed. In the AFt system, the MSD value continued to increase at a relatively high rate, indicating that water droplets were rapidly wetted at the AFt interface. After 270 ps, the MSD value increased, the rate decreased, and water molecules moved due to the interaction with the AFt substrate. In the AFt/S system, the presence of IBTS significantly reduced the MSD value and limited the wetting of water droplets on the surface. In the AFt/S/GO composite system, the MSD value hardly increased after 500 ps, indicating that water droplets were limited on the surface of the IBTS/GO composite coating.
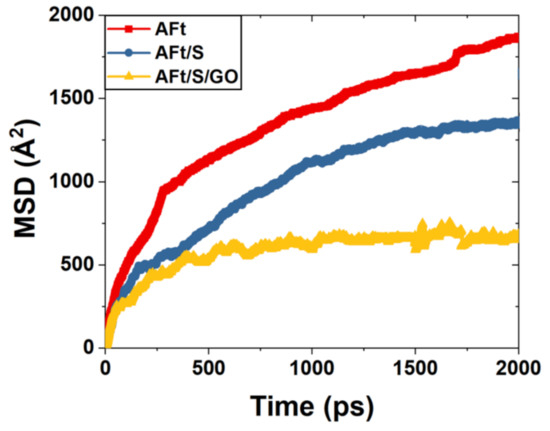
Figure 16.
MSD curve diagram of droplets.
Based on the analysis above and the conceptual diagram in Figure 17, it can be observed that the main hydration product of sulfoaluminate cement, ettringite, exhibits good hydrophilicity. Water droplets can spread and infiltrate at the interface, as shown in Figure 17a. However, when the interface of AFt modified with IBTS (Figure 17b) is present, the wetting behavior of water droplets at the interface is significantly inhibited. This is because the silane is adsorbed on the substrate surface in the form of ion pairs and hydrogen bonds. However, the stability of this interaction force is poor, and the wetting process of water droplets at the interface disrupts the interaction between IBTS and AFt, leading to the detachment of IBTS from the substrate surface and a weakening of the hydrophobic effect of the coating. On the other hand, as displayed in Figure 17c the GO/IBTS composite system can effectively achieve hydrophobicity at the interface. Firstly, due to its large specific surface area and a high number of polar functional groups, GO can stably exist on the surface of the AFt substrate. Secondly, IBTS can establish stable interactions with the polar functional groups on the surface of GO through hydrogen bonding. Under the influence of water droplets, this interaction remains stable. Moreover, since the polar sites on the GO surface are occupied by IBTS, nanodroplets cannot effectively wet the interface of the GO/IBTS composite system. Therefore, the key to improving the hydrophobic stability of silane–series composite coatings on sulfoaluminate cementitious materials lies in the selection of suitable materials that can stably adsorb on the ettringite surface while bridging with silane.
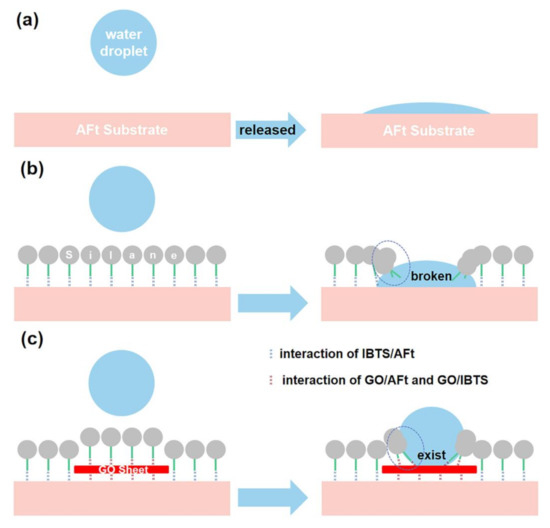
Figure 17.
Conceptual diagrams of (a) AFt system, (b) AFt/IBTS system, and (c) AFt/IBTS/GO system.
4. Conclusions
In this study, we investigated the wetting characteristics of water droplets on the surface of AFt, single–layer IBTS–modified AFt, and IBTS/GO–modified AFt using molecular dynamics simulations. The analysis included contact angle measurements, atomic intensity distribution, local structure, H–bond distribution, orientation distribution, and dynamic properties. The conclusions are as follows:
- (1)
- The AFt substrate has good hydrophilicity, and the contact angle of water droplets on the AFt substrate surface is 9.8°. The IBTS coating can effectively reduce the wetting rate, but the water droplets will still penetrate and disperse the IBTS coating on the AFt surface. The IBTS/GO coating significantly improves the interface hydrophobicity, and the wetting of water droplets is restricted.
- (2)
- IBTS and GO are adsorbed on the surface of the AFt substrate through Ca–O ionic bonds and H–bonds, and the adsorption stability of GO is higher than that of IBTS. IBTS is adsorbed on the GO surface through H–bonds and has good stability. The driving force for the wetting of water droplets on the AFt surface also comes from the actions of the ionic bond and H–bond inside the AFt substrate.
- (3)
- There are abundant H–bond interactions between water molecules and the AFt substrate, and the IBTS coating extends the distance of H–bond interactions between water molecules and the AFt substrate, significantly reducing the wetting ability of water droplets at the substrate interface. The IBTS/GO coating limits the wettability of droplets at the interface through stable H–bond interactions between IBTS and GO.
- (4)
- The dynamic characteristic results demonstrate that the IBTS and IBTS/GO coatings initially inhibit the wetting behavior of water droplets, but due to the relatively low interaction stability between IBTS and the AFt substrate, water molecules eventually wet the substrate in the middle and late stages. In contrast, GO acts as a bridge and stably adsorbs IBTS on the AFt surface, significantly improving the interface hydrophobicity. Therefore, it is crucial to choose a suitable material to bridge AFt and silane to improve the hydrophobic stability of silane coating on the sulfoaluminate cementitious materials.
Author Contributions
Conceptualization, S.L. and Y.D.; methodology, H.Z.; software, H.Z. and Y.D.; validation, Z.J., D.H. and P.W.; formal analysis, B.P.; investigation, H.Z. and Y.D.; resources, D.H., M.L.; data curation, P.W.; writing—original draft preparation, H.Z. and Y.D.; writing—review and editing, H.Z.; visualization, H.Z. and Y.D.; supervision, S.L. and M.L.; project administration, S.L. and M.L.; funding acquisition, S.L., Z.J., D.H., P.W. and B.P. All authors have read and agreed to the published version of the manuscript.
Funding
Financial support was provided by the National Key Research and Development project under grant no. 2022YFE0133800; the National Natural Science Foundation of China under grant no. U2106221, 52208259, 52078260, and 51978355; and the Natural Science Foundation of Shandong Province under grant no. ZR2022YQ55.
Institutional Review Board Statement
Not applicable.
Informed Consent Statement
Not applicable.
Data Availability Statement
Data available on request due to privacy. The data presented in this study are available on request from the corresponding author. The data are not publicly available due to it includes the original code we wrote.
Conflicts of Interest
The authors declare no conflict of interest.
References
- Li, Z.; Zhou, X.; Ma, H.; Hou, D. Advanced Concrete Technology; John Wiley & Sons: Hoboken, NJ, USA, 2022. [Google Scholar]
- He, Z.; Deng, H.; Fan, F.; Tan, J. Microstructure of four–graded roller compacted concrete. Constr. Build. Mater. 2018, 187, 25–37. [Google Scholar] [CrossRef]
- Shima, T. A review on five key sensors for monitoring of concrete structures. Constr. Build. Mater. 2019, 204, 492–509. [Google Scholar]
- Tang, S.W.; Yao, Y.; Andrade, C.; Li, Z. Recent durability studies on concrete structure. Cem. Concr. Res. 2015, 78, 143–154. [Google Scholar] [CrossRef]
- Salvoldi, B.; Beushausen, H.; Alexander, M. Oxygen permeability of concrete and its relation to carbonation. Constr. Build. Mater. 2015, 85, 30–37. [Google Scholar] [CrossRef]
- Ma, Z.; Zhao, T.; Yang, J. Fracture behavior of concrete exposed to the freeze–thaw environment. J. Mater. Civ. Eng. 2017, 29, 04017071. [Google Scholar] [CrossRef]
- Beskopylny, A.N.; Stel’makh, S.A.; Shcherban, E.M.; Mailyan, L.R.; Meskhi, B.; Chernil’nik, A.; El’shaeva, D.; Pogrebnyak, A.J. Influence of Variotropy on the Change in Concrete Strength under the Impact of Wet–Dry Cycles. Appl. Sci. 2023, 13, 1745. [Google Scholar] [CrossRef]
- Bertolini, L.; Elsener, B.; Pedeferri, P.; Redaelli, E.; Polder, R.B. Corrosion of Steel in Concrete: Prevention, Diagnosis, Repair; John Wiley & Sons: Hoboken, NJ, USA, 2013. [Google Scholar]
- Yang, Q.; Zhu, B.; Zhang, S.; Wu, X.J.C.; Research, C. Properties and applications of magnesia–phosphate cement mortar for rapid repair of concrete. Cem. Concr. Res. 2000, 30, 1807–1813. [Google Scholar] [CrossRef]
- Juenger, M.; Winnefeld, F.; Provis, J.L.; Ideker, J. Advances in alternative cementitious binders. Cem. Concr. Res. 2011, 41, 1232–1243. [Google Scholar] [CrossRef]
- Wang, Y.; Su, M.; Zhang, L. Sulphoaluminate Cement, 1st ed.; Beijing Industrial University Press: Beijing, China, 1999. [Google Scholar]
- García-Maté, M.; De la Torre, A.; León-Reina, L.; Aranda, M.; Santacruz, I. Hydration studies of calcium sulfoaluminate cements blended with fly ash. Cem. Concr. Res. 2013, 54, 12–20. [Google Scholar] [CrossRef]
- Horgnies, M.; Chen, J. Superhydrophobic concrete surfaces with integrated microtexture. Cem. Concr. Compos. 2014, 52, 81–90. [Google Scholar] [CrossRef]
- Duan, Y.; Zheng, H.; Wang, P.; Hou, D.; Wang, M.; Yin, B.; Li, S.J. Molecular dynamics simulation study on the hydrophobic mechanism of ettringite nanoporous channels modified by silane and silane/graphene oxide. Appl. Surf. 2023, 623, 156975. [Google Scholar] [CrossRef]
- Thakur, A.; Sharma, S.; Ganjoo, R.; Assad, H.; Kumar, A. Anti-corrosive potential of the sustainable corrosion inhibitors based on biomass waste: A review on preceding and perspective research. J. Phys. Conf. Ser. 2022, 2267, 012079. [Google Scholar] [CrossRef]
- Thakur, A.; Kumar, A. Sustainable inhibitors for corrosion mitigation in aggressive corrosive media: A comprehensive study. J. Bio-Tribo-Corros. 2021, 7, 1–48. [Google Scholar] [CrossRef]
- Thakur, A.; Kaya, S.; Kumar, A. Recent Trends in the Characterization and Application Progress of Nano-Modified Coatings in Corrosion Mitigation of Metals and Alloys. Appl. Sci. 2023, 13, 730. [Google Scholar] [CrossRef]
- Xie, Y.; Hill, C.A.; Xiao, Z.; Militz, H.; Mai, C. Silane coupling agents used for natural fiber/polymer composites: A review. Compos. Part A Appl. Sci. Manuf. 2010, 41, 806–819. [Google Scholar] [CrossRef]
- Tittarelli, F.; Moriconi, G. The effect of silane–based hydrophobic admixture on corrosion of galvanized reinforcing steel in concrete. Corros. Sci. 2010, 52, 2958–2963. [Google Scholar] [CrossRef]
- Matinlinna, J.P.; Lung, C.Y.K.; Tsoi, J.K.H. Silane adhesion mechanism in dental applications and surface treatments: A review. Dent. Mater. 2018, 34, 13–28. [Google Scholar] [CrossRef]
- Christodoulou, C.; Goodier, C.I.; Austin, S.A.; Webb, J.; Glass, G.K. Long–term performance of surface impregnation of reinforced concrete structures with silane. Constr. Build. Mater. 2013, 48, 708–716. [Google Scholar] [CrossRef]
- Xue, X.; Li, Y.; Yang, Z.; He, Z.; Dai, J.-G.; Xu, L.; Zhang, W. A systematic investigation of the waterproofing performance and chloride resistance of a self–developed waterborne silane–based hydrophobic agent for mortar and concrete. Constr. Build. Mater. 2017, 155, 939–946. [Google Scholar] [CrossRef]
- Qi, W.; Haiyang, L.; Yingfang, F. Chloride ion permeability of isobutyltriethoxy–silane coated concrete. J. Guangxi Univ. 2015, 40, 876–882. [Google Scholar]
- Bao, J.; Li, S.; Zhang, P.; Xue, S.; Cui, Y.; Zhao, T. Influence of exposure environments and moisture content on water repellency of surface impregnation of cement–based materials. J. Mater. Res. Technol. 2020, 9, 12115–12125. [Google Scholar] [CrossRef]
- Zhu, Y.-G.; Kou, S.-C.; Poon, C.-S.; Dai, J.-G.; Li, Q.-Y. Influence of silane–based water repellent on the durability properties of recycled aggregate concrete. Cem. Concr. Compos. 2013, 35, 32–38. [Google Scholar] [CrossRef]
- Ping, W. Application of permeable silicone hydrophobic agent in concrete protection. New Build. Mater. 2003, 55–57. [Google Scholar] [CrossRef]
- Zhu, Y.; Murali, S.; Cai, W.; Li, X.; Suk, J.W.; Potts, J.R.; Ruoff, R.S. Graphene and graphene oxide: Synthesis, properties, and applications. Adv. Mater. 2010, 22, 3906–3924. [Google Scholar] [CrossRef] [PubMed]
- Suk, J.W.; Piner, R.D.; An, J.; Ruoff, R.S. Mechanical properties of monolayer graphene oxide. ACS Nano 2010, 4, 6557–6564. [Google Scholar] [CrossRef] [PubMed]
- Yu, W.; Sisi, L.; Haiyan, Y.; Jie, L. Progress in the functional modification of graphene/graphene oxide: A review. RSC Adv. 2020, 10, 15328–15345. [Google Scholar] [CrossRef]
- Smith, A.T.; LaChance, A.M.; Zeng, S.; Liu, B.; Sun, L. Synthesis, properties, and applications of graphene oxide/reduced graphene oxide and their nanocomposites. Nano Mater. Sci. 2019, 1, 31–47. [Google Scholar] [CrossRef]
- Hong, X.; Lee, J.C.; Qian, B. Mechanical properties and microstructure of high–strength lightweight concrete incorporating graphene oxide. Nanomaterials 2022, 12, 833. [Google Scholar] [CrossRef]
- Chuah, S.; Pan, Z.; Sanjayan, J.G.; Wang, C.M.; Duan, W.H. Nano reinforced cement and concrete composites and new perspective from graphene oxide. Constr. Build. Mater. 2014, 73, 113–124. [Google Scholar] [CrossRef]
- Zheng, W.; Chen, W.; Feng, T.; Li, W.; Liu, X.; Dong, L.; Fu, Y.J. Enhancing chloride ion penetration resistance into concrete by using graphene oxide reinforced waterborne epoxy coating. Prog. Org. Coat. 2020, 138, 105389. [Google Scholar] [CrossRef]
- Shi, D.; Geng, Y.; Li, S.; Gao, J.; Hou, D.; Jin, Z.; Liu, A. Efficacy and mechanism of graphene oxide modified silane emulsions on waterproof performance of foamed concrete. Case Stud. Constr. Mater. 2022, 16, e00908. [Google Scholar] [CrossRef]
- Yu, J.; Li, S.; Hou, D.; Jin, Z.; Liu, Q. Hydrophobic silane coating films for the inhibition of water ingress into the nanometer pore of calcium silicate hydrate gels. Phys. Chem. Chem. Phys. 2019, 21, 19026–19038. [Google Scholar] [CrossRef] [PubMed]
- Li, G.; Akbar, A.; Zhang, L.-W.; Rosei, F.; Liew, K. Surface modification strategy for controlling wettability and ionic diffusion behaviors of calcium silicate hydrate. Appl. Surf. Sci. 2023, 622, 156993. [Google Scholar] [CrossRef]
- Gražulis, S.; Chateigner, D.; Downs, R.T.; Yokochi, A.; Quirós, M.; Lutterotti, L.; Manakova, E.; Butkus, J.; Moeck, P.; Le Bail, A. Crystallography Open Database–an open–access collection of crystal structures. J. Appl. Crystallogr. 2009, 42, 726–729. [Google Scholar] [CrossRef]
- Cody, A.; Lee, H.; Cody, R.; Spry, P. The effects of chemical environment on the nucleation, growth, and stability of ettringite [Ca3Al (OH) 6] 2 (SO4) 3· 26H2O. Cem. Concr. Res. 2004, 34, 869–881. [Google Scholar] [CrossRef]
- Goetz-Neunhoeffer, F.; Neubauer, J. Refined ettringite (Ca6Al2 (SO4) 3 (OH) 12∙26H2O) structure for quantitative X-ray diffraction analysis. Powder Diffr. 2006, 21, 4–11. [Google Scholar] [CrossRef]
- Cygan, R.T.; Liang, J.-J.; Kalinichev, A.G. Molecular models of hydroxide, oxyhydroxide, and clay phases and the development of a general force field. J. Phys. Chem. B 2004, 108, 1255–1266. [Google Scholar] [CrossRef]
- Jorgensen, W.L.; Chandrasekhar, J.; Madura, J.D.; Impey, R.W.; Klein, M.L. Comparison of simple potential functions for simulating liquid water. J. Chem. Phys. 1983, 79, 926–935. [Google Scholar] [CrossRef]
- Cannon, W.R.; Pettitt, B.M.; McCammon, J.A. Sulfate anion in water: Model structural, thermodynamic, and dynamic properties. J. Phys. Chem. 1994, 98, 6225–6230. [Google Scholar] [CrossRef]
- Jorgensen, W.L.; Maxwell, D.S.; Tirado-Rives, J. Development and testing of the OPLS all–atom force field on conformational energetics and properties of organic liquids. J. Am. Chem. Soc. 1996, 118, 11225–11236. [Google Scholar] [CrossRef]
- Plimpton, S.; Crozier, P.; Thompson, A. LAMMPS–large–scale atomic/molecular massively parallel simulator. Sandia Natl. Lab. 2007, 18, 43. [Google Scholar]
- Wang, P.; Duan, Y.; Zheng, H.; Chen, Z.; Wang, M.; Wang, X.; Li, H.; Hou, D. Molecular structure and dynamics of water on the surface of cement hydration products: Wetting behavior at nanoscale. Appl. Surf. Sci. 2023, 611, 155713. [Google Scholar] [CrossRef]
- Youssef, M.; Pellenq, R.J.-M.; Yildiz, B. Glassy nature of water in an ultraconfining disordered material: The case of calcium–silicate–hydrate. J. Am. Chem. Soc. 2011, 133, 2499–2510. [Google Scholar] [CrossRef] [PubMed]
Disclaimer/Publisher’s Note: The statements, opinions and data contained in all publications are solely those of the individual author(s) and contributor(s) and not of MDPI and/or the editor(s). MDPI and/or the editor(s) disclaim responsibility for any injury to people or property resulting from any ideas, methods, instructions or products referred to in the content. |
© 2023 by the authors. Licensee MDPI, Basel, Switzerland. This article is an open access article distributed under the terms and conditions of the Creative Commons Attribution (CC BY) license (https://creativecommons.org/licenses/by/4.0/).