Article

Design of a New Type of In-Hole Gold-Coated High-Performance Quasi-PCF Sensor Enhanced with Surface Plasmon Resonance

1
Zhejiang Huayun Electric Power Engineering Design & Consultation Co., Ltd., Hangzhou 310014, China
2
School of Automation, Hangzhou Dianzi University, Hangzhou 310018, China
*
Author to whom correspondence should be addressed.
Coatings 2023, 13(7), 1261; https://doi.org/10.3390/coatings13071261
Submission received: 5 June 2023 / Revised: 7 July 2023 / Accepted: 12 July 2023 / Published: 18 July 2023
(This article belongs to the Special Issue Micro-Nano Optics and Its Applications)

Abstract

:
With the development of aerospace, deep-sea exploration and other technologies, the demand for anti-electromagnetic, high-sensitivity and miniaturized sensors is increasingly urgent. In this paper, a model of a quasi-photonic crystal fiber (Q-PCF) refractive index (RI) sensor enhanced with surface plasmon resonance (SPR) is proposed. A stable gold film with a significant SPR effect is applied to the two identically sized and oppositely positioned air holes of the proposed sensor, and all air holes are filled with analyte. A detailed analysis of the mode characteristics, structural parameters and RI sensing performance of the sensor has been carried out using the finite element method. It has been shown that the maximum sensitivity (S) is 4977.59 nm/RIU in the RI range of 1.35–1.40, corresponding to a resolution (R) of 2.01 × 10⁻⁵ RIU and a figure of merit (FOM) of 160.36 RIU−1. The proposed Q-PCF sensor has unique fabrication advantages and outstanding sensing properties, providing a new idea for biosensing, complex environment monitoring and long-range measurement, and is of great practical value in the field of highly integrated sensing.

1. Introduction

In the age of information technology, the need to sense, detect and utilize information is becoming more and more urgent. Research into areas such as bioanalysis, chemical detection and physical field sensing has greatly contributed to the development of sensing technology [1,2,3]. This has led to the creation of many sensors based primarily on thermal, electrical and optical theories. Compared to traditional thermal and electrical sensors [4,5], optical sensors [6] have unique advantages such as high sensitivity, high stability, real-time detection and integration and are widely used in biomedical, aerospace, defense and military applications. The development of optical sensing structures such as core–shell structures [7], super-surfaces and special fiber-optic structures is flourishing. One important branch of optical sensing is optical fiber sensing, which has been a popular research topic for many years. There is a variety of designs to induce core modes such as side-throwing or bending of general optical fibers, fabricating periodically arranged metallic microstructures [8,9] and graphene [10] with voltage-modulating properties of the dielectric constant and the preparation of structured resonant cavities at the end face of the fiber [11] and the fabrication of probes with micro-structured arms at the tip of the fiber [12]. However, these designs suffer from low detection sensitivity, limited RI detection range, low design freedom and extremely high preparation technology requirements, which greatly limit their widespread use.
Photonic crystal fibers (PCFs) are waveguides with photonic crystal properties formed through artificially introducing different periodic arrangements of low RI media into the optical fiber, which can be divided into index-guiding PCF and photonic band gap guiding PCF according to the light-guiding mechanism [13]. Since the concept of PCF was proposed by Russel in 1992 and accepted by researchers, it has been widely used in large mode area transmission [14], broadband single mode transmission [15] and sensing due to its great design freedom and functionalization. And with the need for information perception and the development of optical fiber functionality, the structure of PCFs is being designed and manufactured functionally as required rather than strictly according to the concept of photonic crystals [16]. Common methods of extending the functionality of PCFs include designing different arrangements and sizes of air holes, as well as the method of filling the air holes with materials such as liquid, gas or liquid crystal and plating metal films [17]. The expanded design of PCFs has led to the creation of many fibers with microporous structures that have a photonic crystal-like structure and characteristics. In order to better differentiate them from other D-type fibers, anti-resonant fibers and photonic crystal fibers, we introduce the concept of a quasi-photonic crystal fiber (Q-PCF). Its unique properties provide new methods and ideas for polarization regulation, high power transmission, non-linear transmission, tunable dispersion, controlled mode field area and high birefringence in optical fibers.
Surface plasmon resonance (SPR) is a collective oscillation phenomenon that occurs when electrons and photons strongly interact on the surface of metal [18,19,20,21]. The frequency and intensity of SPR is remarkably sensitive to the variation of the refractive index (RI) of the dielectric in close contact with the surface of the metal [22,23,24,25,26]. This effect increases both the strength of the loss intensity of the output signal and the sensitivity of sensing and is therefore widely used in the areas of optical fiber sensing and meta-surface sensing [27]. With its unique mode guidance mechanism and special porous structure, the Q-PCF provides a flexible solution to the phase-matching problem in conventional SPR effect-based sensors and further extends its design freedom and suitability. Techniques to improve sensing sensitivity through coating PCFs with gold, ITO, AZO, silver, graphene, graphene oxide, etc. are commonplace and have resulted in significant performance improvements [28,29].
Currently, there are side-polishing [30,31], U-grooving [32,33], multi-core structures [34,35] and in-hole coatings [36,37] for the bonding of metal layers to PCF. Wang et al. [38] proposed a D-shaped fiber with a gold coating on the side-polishing surface and a liquid filling in one of the small-sized air holes, which greatly increased the difficulty of process preparation and added sources of error. Ding et al. [39] proposed a PCF structure with double elliptical holes plated with gold, having a variety of air hole sizes, which is undoubtedly difficult to achieve for current process technology. Liu et al. [40] proposed a rectangular slotted PCF structure with a complex arrangement of air holes and a slotting method that is less feasible in terms of process. The typical structures mentioned above are faced with the difficulties of a complex preparation process or high technical requirements. Based on the drawbacks of the current related research, this paper takes the in-hole gold-coated fiber as a breakthrough and designs a double-hole gold-coated Q-PCF with larger size and fewer influencing structural parameters. The structure has only two sizes of air holes and they are fewer in number and larger in size. The structure enhances the coupling strength of the core and SPP modes, improves the quality of film deposition under limited conditions, and is more ductile and less prone to fracture than side-thrown fibers. Only the two holes in the vertical direction are coated with a gold film, which will facilitate the strength of the mode coupling while achieving the polarization selection characteristics. Also taking into account the difficulties of selective filling of liquids in experiments, we filled all the holes with analytes. The influence of structural parameters, polarization mode transmission characteristics, RI sensitivity and other influential characteristic parameters are analyzed using the finite element method.

2. Structural Design and Sensing Principle

We have designed a new Q-PCF structure with larger sizes and fewer characteristic parameters as shown in Figure 1 to address some of the disadvantages of current PCF sensors. Figure 1a shows a two-dimensional cross-sectional schematic of the Q-PCF with an optic-fiber waveguide of diameter D made of fused silica. The air holes in the horizontal direction are at a distance from the core of K and have a radius of r2. The air holes in the vertical direction are at a distance from the core of K, have a radius of r1 and are coated with a layer of gold of thickness t on the inner wall. The other four air holes are at a distance L from the core and have a radius r0. The air holes are filled with analytes, either temperature-sensitive PDMS for temperature sensing, magnetic-field-sensitive MF for magnetic field sensing or various biochemical substances such as glucose solutions, hemoglobin, mercury-containing solutions, etc. The outermost layer is the perfect match layer (PML), used to act as a near-ideal absorber or radiator domain. In all the study, D, K, L and r0 are set to fixed values of 46 μm, 13 μm, 18 μm and 3.5 μm, respectively. The rest of the crucial structural parameters r1, r2 and t are studied in a more detailed manner as variables in the following sections. Figure 1b is a schematic diagram of a three-dimensional section of a two-hole gold-plated Q-PCF. The base structure can be prepared in three steps. Firstly, the prefabricated capillaries are arranged as required and then drawn to the specified length. Then, the end face of the air hole, which does not need to be coated with gold, is sealed and the end face of this fiber is aligned to the gold flow and uniformly coated with a gold film of the appropriate thickness. Finally, according to the detection requirements, the corresponding detection substance is injected into the hole and the device is properly encapsulated.
As fused silica is a highly transparent material, we have approximated it as a lossless material when performing the finite element method for analysis. The RI of fused silica can therefore be defined according to the Sellmeier’s equation as [41]:
n 2 λ = 1 + B 1 λ 2 λ 2 C 1 + B 2 λ 2 λ 2 C 2 + B 3 λ 2 λ 2 C 3
B1, B2, B3, C1, C2 and C3 in Equation (1) are constants 0.6961663, 0.4079426, 0.8974794, 0.0684043, 0.1162414 and 9.896161, respectively.
The dielectric constant of the gold layer can be characterized using the Drude–Lorentz model according to the following formula [42]:
ε m = ε ω D 2 ω ( ω + j γ D ) + Δ ε Ω L 2 ω 2 Ω L 2 + j Γ L ω
where ε is the dielectric constant at high frequency, ω is the angular frequency of the transmitted signal, ω D is the plasma frequency of the electron. Δ ε , γ D , Ω L and Γ L represent the weighting factor, the damping frequency, the oscillator strength and the spectral width of the Lorentz oscillator, respectively. Due to the small thickness of the gold film, we set it as a transition boundary condition in order to increase the speed of the calculation while ensuring high accuracy. For the outermost layer, we use the Perfect Match layer, which is a method used to simulate domains with open boundaries that effectively absorb outgoing waves and avoid interference from reflections and echoes. In addition, when meshing, all are divided into free triangular meshes, except for the mapping mesh used for the PML layer.
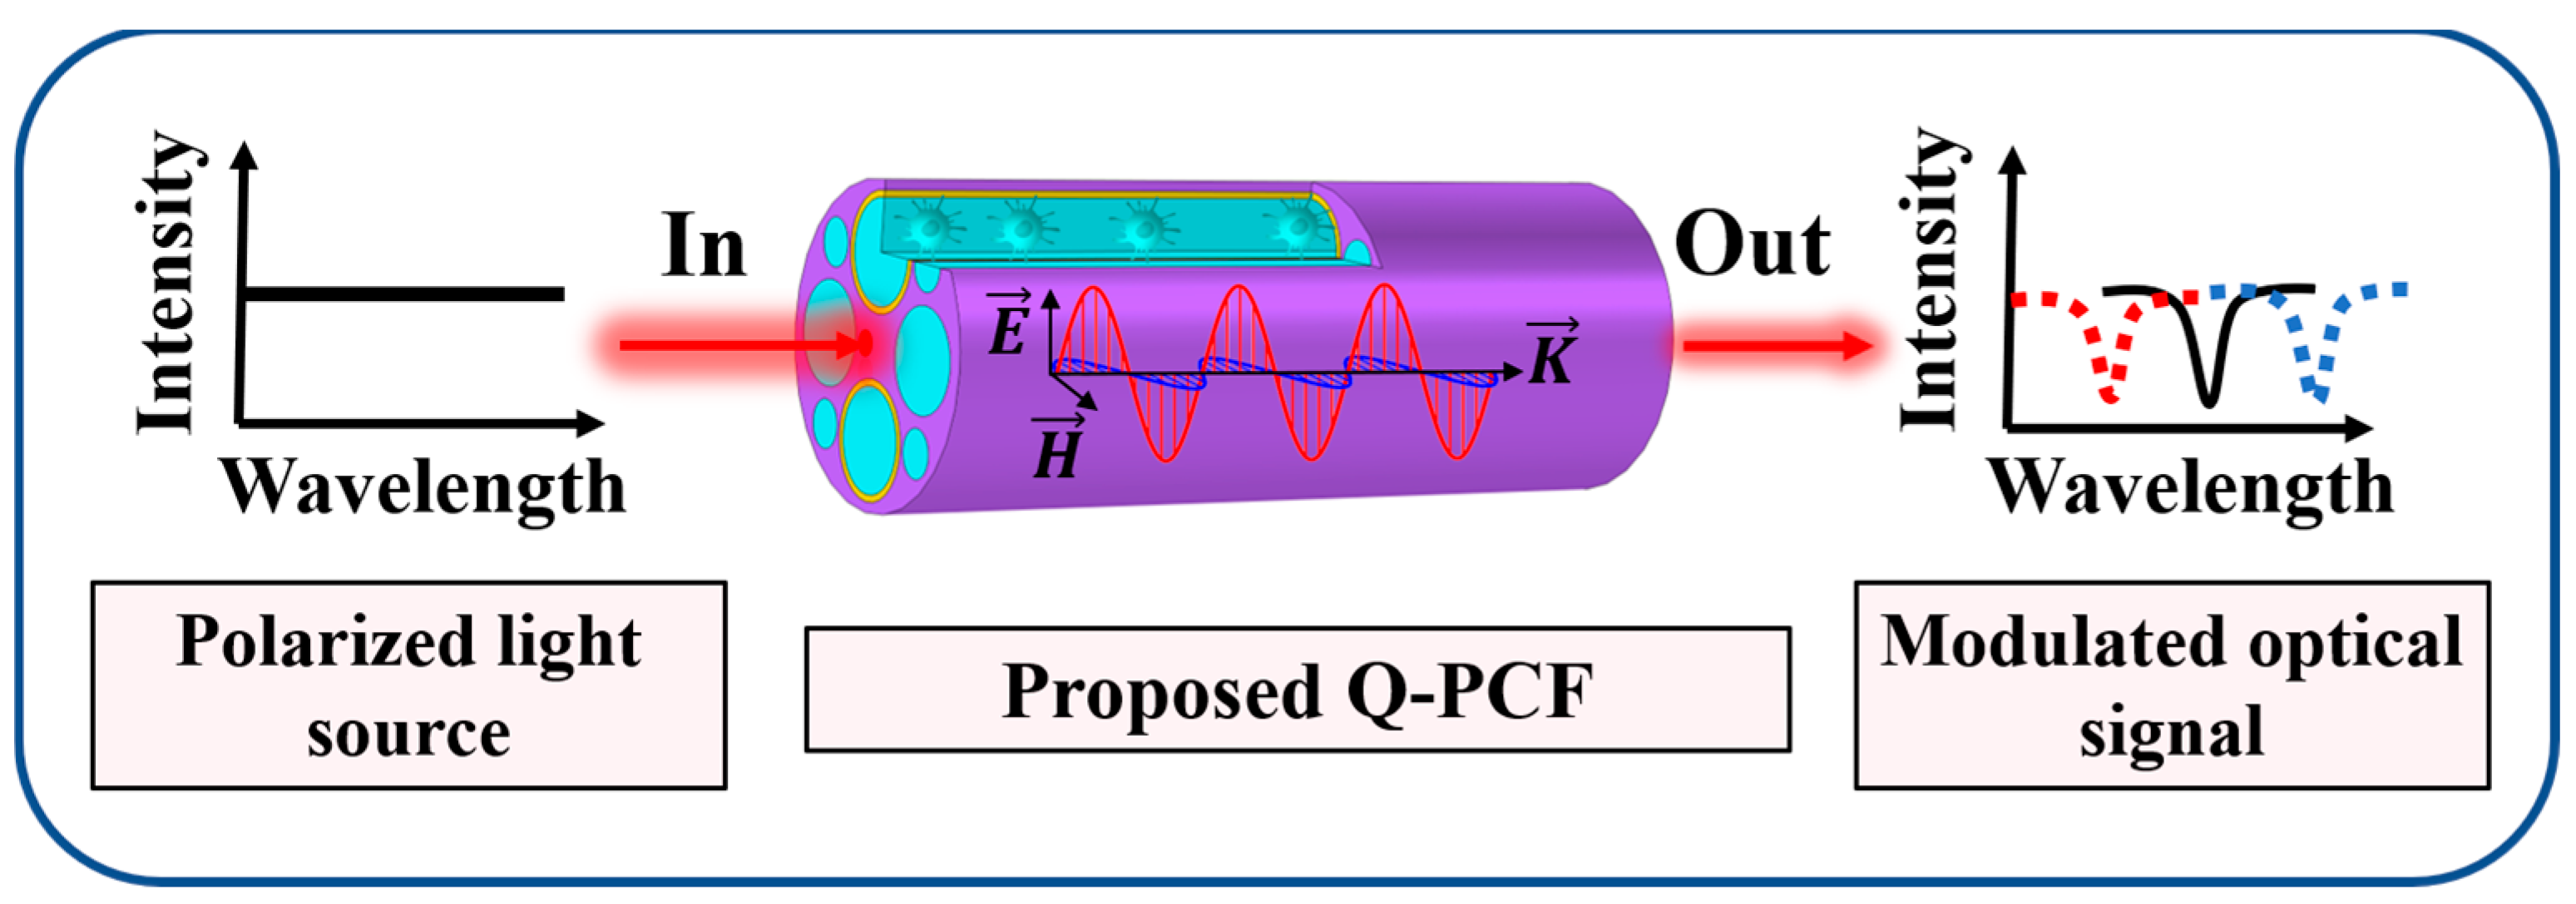
Figure 2 graphically illustrates the basic principle of the in-hole gold-coated Q-PCF to achieve sensing. When a broadband and flat-intensity light signal with polarization characteristics is coupled into the Q-PCF, the signal at a specific frequency will excite the SPR effect on the gold surface. The evanescent waves generated by the core mode at the gold film interface also result in coherent oscillations of free electrons on the gold surface in intimate touch with the analyte. At this point, most of the energy of the fundamental mode is trapped on the gold surface, creating a loss in the output signal at that particular frequency. The original signal with a flat intensity passes through the sensor and forms a loss peak. The interaction of the core mode and SPP mode can also be analyzed according to coupled mode theory [43]:
d E 1 d z + i β 1 E 1 = i k 21 E 2 d E 2 d z + i β 2 E 2 = i k 12 E 1
E1 and E2 represent the electric field energy propagation functions of the core mode and SPP mode, respectively. β1 and β2 represent the respective propagation constants. k21 and k12 represent the coupling coefficients between two waveguides, respectively. Mode coupling occurs when the propagation constants of each mode in the two waveguides are equal, and then there is a transfer of energy, and a loss peak is formed in the output signal in the spectrum analyzer. (In general, when considering two identical waveguides, k12 = k21). The frequency of excitation of the SPR effect on the gold layer is closely related to the RI of the medium surrounding the film. Then, the concentration of the analyte or changes in ambient temperature will have an effect on its RI, which in turn will cause the loss peak to be red-shifted or blue-shifted. The cause of the change can be inferred from the amount or direction of movement of the peak position, and then sensing can be realized. The confinement loss of PCF can be calculated according to the effective RI of the relevant mode, and the formula is [44]:
α loss = 8.686 × 2 π λ Im n eff × 10 7 dB cm
where Im n eff is the imaginary part of the effective RI of the core mode. λ stands for wavelength in nm.
The performance of a sensor is determined by the strength and sensitivity of its response to the external environment, where sensitivity is an important parameter that directly indicates the responsiveness of the sensor. It can be given by the following formula [45]:
S λ = δ λ peak n
where δ λ peak represents the amount of change in the resonance wavelength (RW) and n represents the change amount of external ambient RI.
Resolution is often used as a measure of the smallest change that a sensor can detect. For the Q-PCF sensor proposed in this paper, it is determined by the minimum resolution of the spectrum analyzer and the sensitivity of the proposed structure, expressed by the following equation [46]:
R = δ λ min S
where δ λ min denotes the minimum resolution of a general spectrum analyzer and is taken to be 0.1 nm in the calculation.
The figure of merit (FOM) is closely related to the full width of half peak (FWHM) of the loss peak and the sensitivity of the sensor. Usually, a higher-quality factor means better performance of the sensor and is calculated as follows [47]:
FOM = S λ FWHM
In this paper, we perform a mode analysis of the proposed fiber based on finite element methods. Due to the symmetrical distribution of the gold film, the structure has a centrosymmetric character. The horizontal direction is not equivalent to the vertical direction. So, it is necessary to carry out a comparative analysis of the fundamental modes for both polarization states. The loss spectra of X-polarized (X-pol) and Y-polarized (Y-pol) and the corresponding electric field energy distribution at the maximum loss are shown in Figure 3. The inner wall of the hole in vertical direction is coated with a gold film and the Y-pol signal at 622 nm excites a strong SPR effect on the gold surface, causing a partial transfer of energy from the core to the gold surface and generating a loss of 489.3 dB/cm. However, there is no metal layer in horizontal air hole. So, no significant SPR is excited in the wavelength range of 500–800 nm, and only part of the reflected electric field component through the hole produces a weak SPR phenomenon on the gold surface, with a maximum loss of 11.4 dB/cm at 622 nm. In addition, the trend of the real part of effective RI for the Y-pol mode is given in Figure 3. It can be clearly seen that at the strongest coupling frequency, the real part of effective RI undergoes an abrupt change and has an overall S-shape.

3. Analysis of Local Structure Parameters

PCFs are at the forefront of research and hotspots in the field of optical fibers for reasons such as superior physical properties, high stability and a very high level of design freedom. PCF structures are increasingly being designed functionally according to requirements rather than according to a strict photonic crystal concept. PCF waveguides transform external information into optical signal to achieve sensing, which greatly improves sensing sensitivity while placing higher requirements on structural size. It is therefore beneficial to investigate the variation trend of the output signal with the relevant structural parameters to offer a research reference for the design of a high-quality sensor with high confidence and sensitivity, as well as a reference for process error analysis [48,49].

3.1. Basic Model Exploration

In the structural design of this paper, we have sought to simplify the model as much as possible to improve the processability possibilities, resulting in three basic structural design ideas. Figure 4a shows the loss spectra of the three models, corresponding to the structures (b), (c) and (d), respectively. Their corresponding electric field distribution at the maximum loss are (e), (f) and (g), respectively. The maximum mode coupling wavelength of model No. 1 and model No. 2 is 622 nm, and the corresponding loss is 489.3 dB/cm and 469.9 dB/cm. And the electric field energy at this frequency is concentrated on the core and gold film surface, indicating that the air holes of radius r0 have a weak influence on the transmission of the signal. To enhance the binding capacity of the core mode and reduce the number of modes, model No. 1 has more potential for application. The maximum loss of model No. 3 is 176.4 dB/cm, and the corresponding wavelength is 629 nm. Compared with the structure of double-hole coating, the coupling frequency has a red-shift. As the thickness and structure of the gold film remain unchanged, the propagation constant of the SPP mode on the gold surface remains constant. The reason for the red-shift is that the single-hole coating changes the propagation constant of the Y-pol mode, which in turn changes the coupling frequency [49]. Through comparing models No. 2 and No. 3, it can be seen that dual-hole coating can effectively enhance the response of the sensor to the external environment. In summary, we choose model No. 1 as the prototype of the Q-PCF structure designed in this paper and carry out subsequent structural parameter research based on this prototype.

3.2. Radius of Hole in Vertical Direction

In this study, in order to enhance the strength of the mode coupling, gold films are applied to the inner walls of the two air holes closest to the fiber core and the holes are filled with analyte. The Y-pol mode excites a significant SPR effect on the inner wall of the vertically oriented gold-coated air hole. Hence, it is essential to study the effect of the size of the air holes coated with gold film on the SPR effect. When the distance K between the air hole in this direction and the center of the core is fixed at 13 μm, r1 increases from 5.2 μm to 8.8 μm in steps of 0.6 μm, corresponding to the loss spectrum illustrated in Figure 5a,b, which clearly show that the maximum loss of the Y-pol mode increases from 80.87 dB/cm to 671.12 dB/cm as r1 increases, and the RW blue-shifts slightly from 626 nm to 618 nm. These studies have shown that a larger radius means that the closer the gold film is to the core and the coupling coefficient between the two modes changes, resulting in stronger mode coupling, the more energy transfer from the core to the gold surface and the greater the losses in the fundamental mode at the resonant frequency. To ensure that the response of this structure is sufficiently strong and stable, r1 is therefore set to 8.2 μm in the later study.

3.3. Radius of Hole in Horizontal Direction

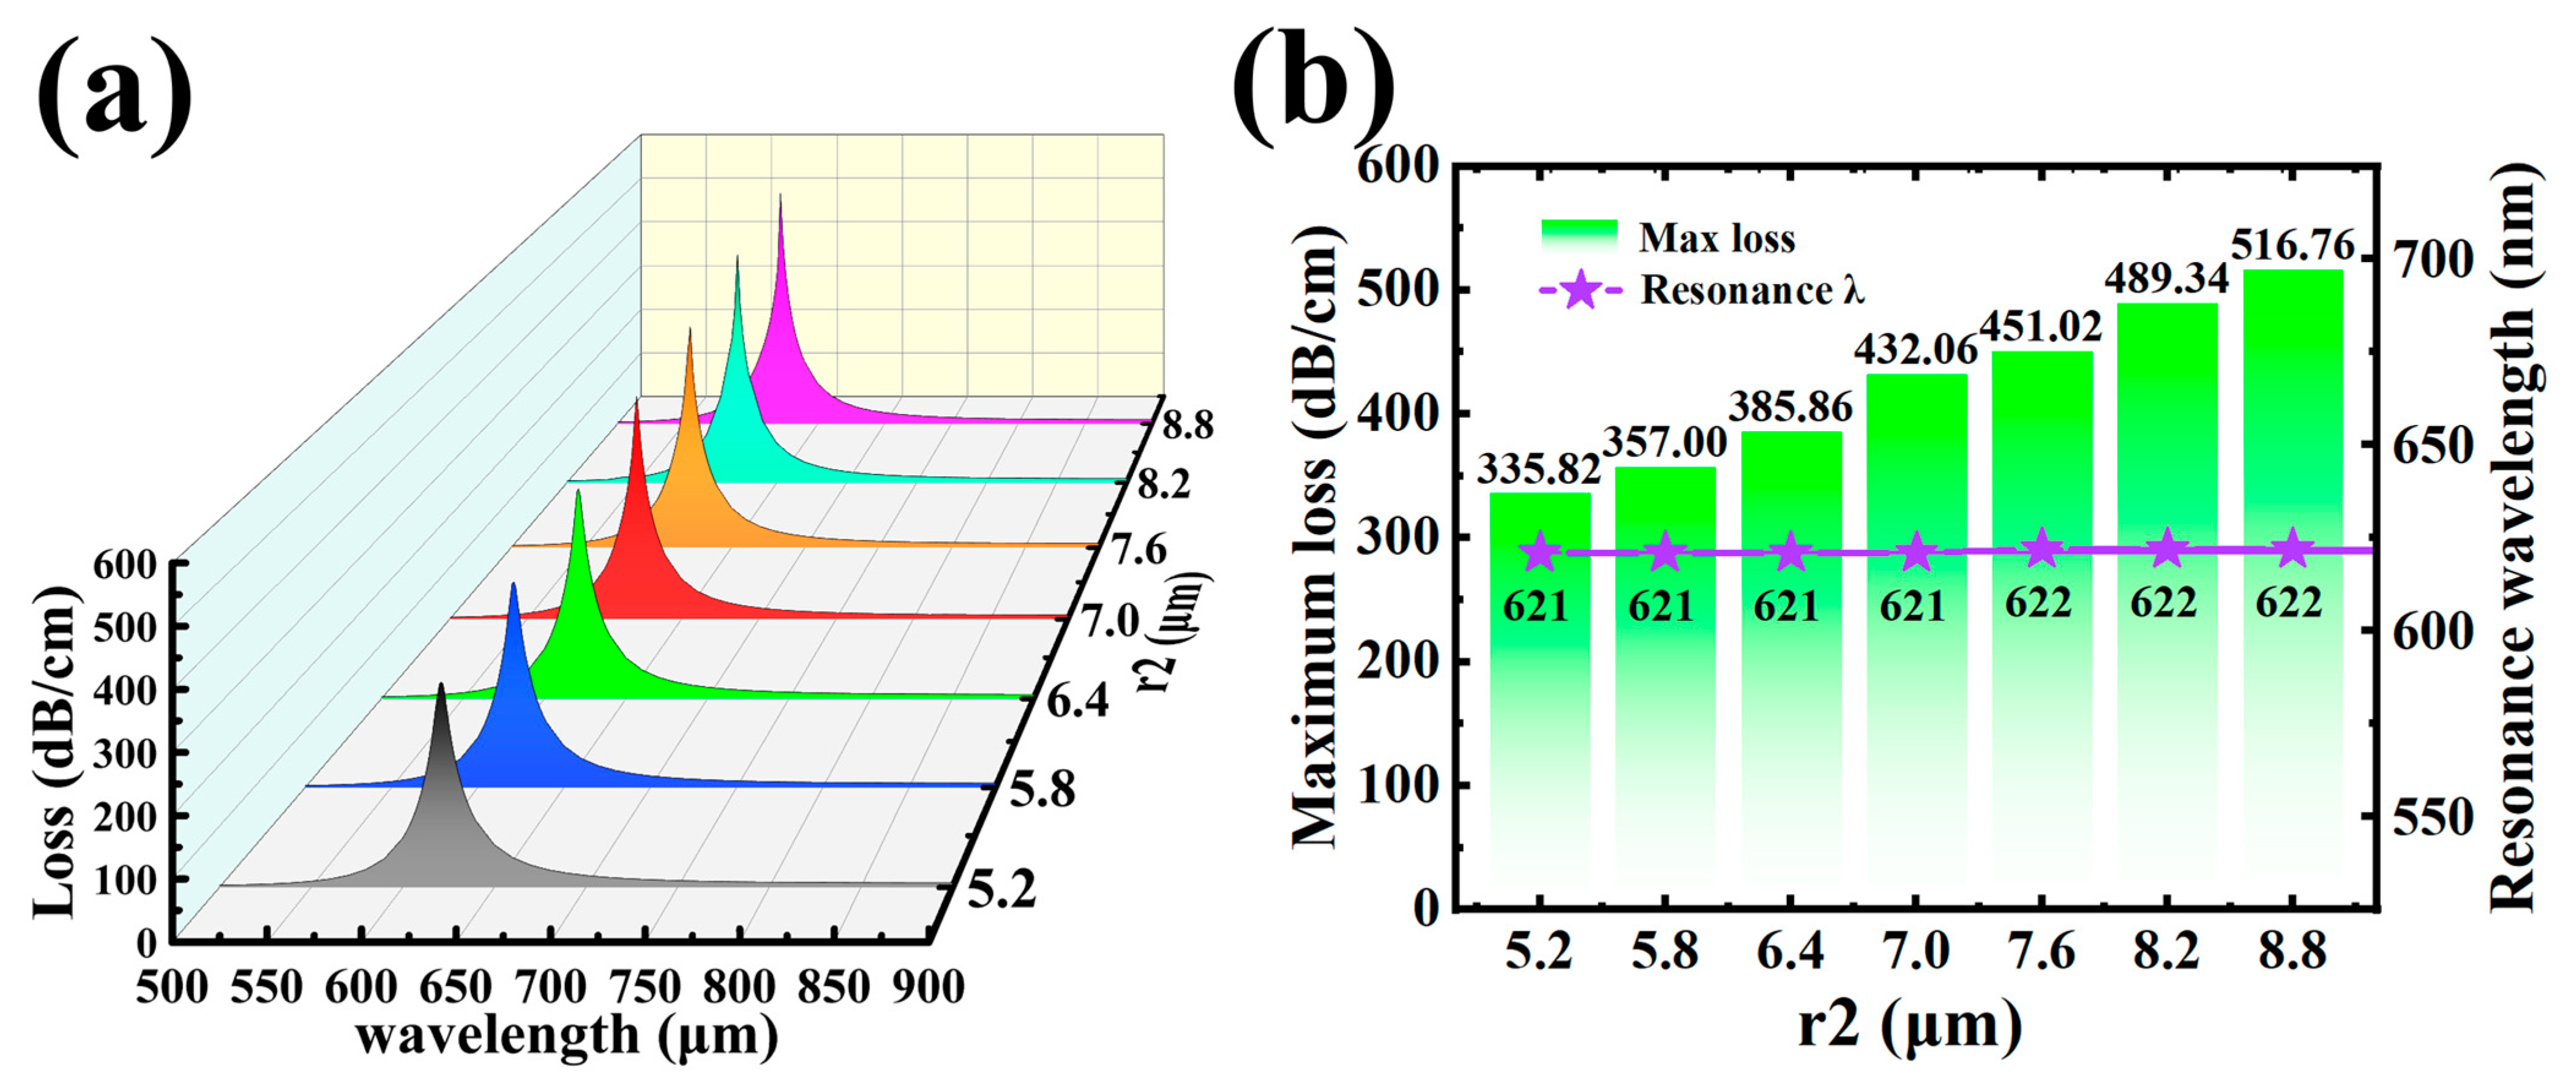
The inner walls of the horizontally oriented air holes are not coated with any metal layer, so that no energy is strongly coupled in that direction. The air holes in the horizontal direction are then filled with analyte and act only as a low-RI medium to reduce the effective RI around the core, which has a binding effect on the core mode. To further investigate the effect of its size on the transmission of the Y-pol mode, the loss spectra corresponding to an increase in r2 from 5.2 μm to 8.8 μm in steps of 0.6 μm are plotted in Figure 6a, and no significant change in the loss spectra can be seen. The RW and maximum loss of the loss peak are presented in Figure 6b. With the increase of r2, the RW is basically maintained at 622 nm, mainly because the structure of the gold film does not change, making the SPP mode stable and still able to strongly couple with the Y-pol mode at the same frequency. The maximum loss gradually increases with r2 from 335.82 dB/cm to 516.76 dB/cm. This is due to the fact that the increased diameter of the air holes in the horizontal direction causes a certain squeeze on the mode distribution of the core, allowing more energy to come closer to the gold film in the vertical direction and generating a stronger energy transfer.

3.4. Thickness of Gold Film

The gold film is in direct exposure to the analyte and influences the transmission of the guiding modes, and therefore plays an intermediary role in the proposed sensor. The sensing principle of the proposed sensor is based on the variation of the loss spectrum, which is essentially due to the excitation of the SPR effect on the gold film surface by the Y-pol mode at a specific frequency, and a part of the evanescent wave that excites the SPR on another gold film surface, resulting in most of the energy of the fiber core mode being bound to the gold film. The gold film is seen as a waveguide, and energy transfer will occur when the propagation constant of the SPP mode that can be stably present on its surface is equal to that of the core mode’s where mode coupling occurs [50,51]. A superior gold film thickness is therefore essential to improve the response strength and sensitivity of the sensor. Increasing the gold film thickness from 30 nm to 60 nm in steps of 5 nm corresponds to the loss spectrum shown in Figure 7a. Figure 7b shows the variation of the RW and maximum loss value of the loss peak for different gold film thickness conditions. As the thickness of the gold film increases, the RW red-shifts from 622 nm to 750 nm and the maximum loss is reduced from 489.34 dB/cm to 50.52 dB/cm. For the same increase in thickness, the RW red-shifts more and more slowly and the maximum loss decreases less and less. The motion state of the free electrons affects the frequency of mode coupling closely related to the thickness of the film. Light signals at low frequencies are more likely to excite the SPR effect on thick film surfaces [52,53]. Since the larger the loss value of the loss peak, the smaller the FWHM will be more favorable for spectral analysis, t = 30 nm will be chosen as the basic parameter setting for subsequent studies.

4. Study of RI Sensing Characteristics

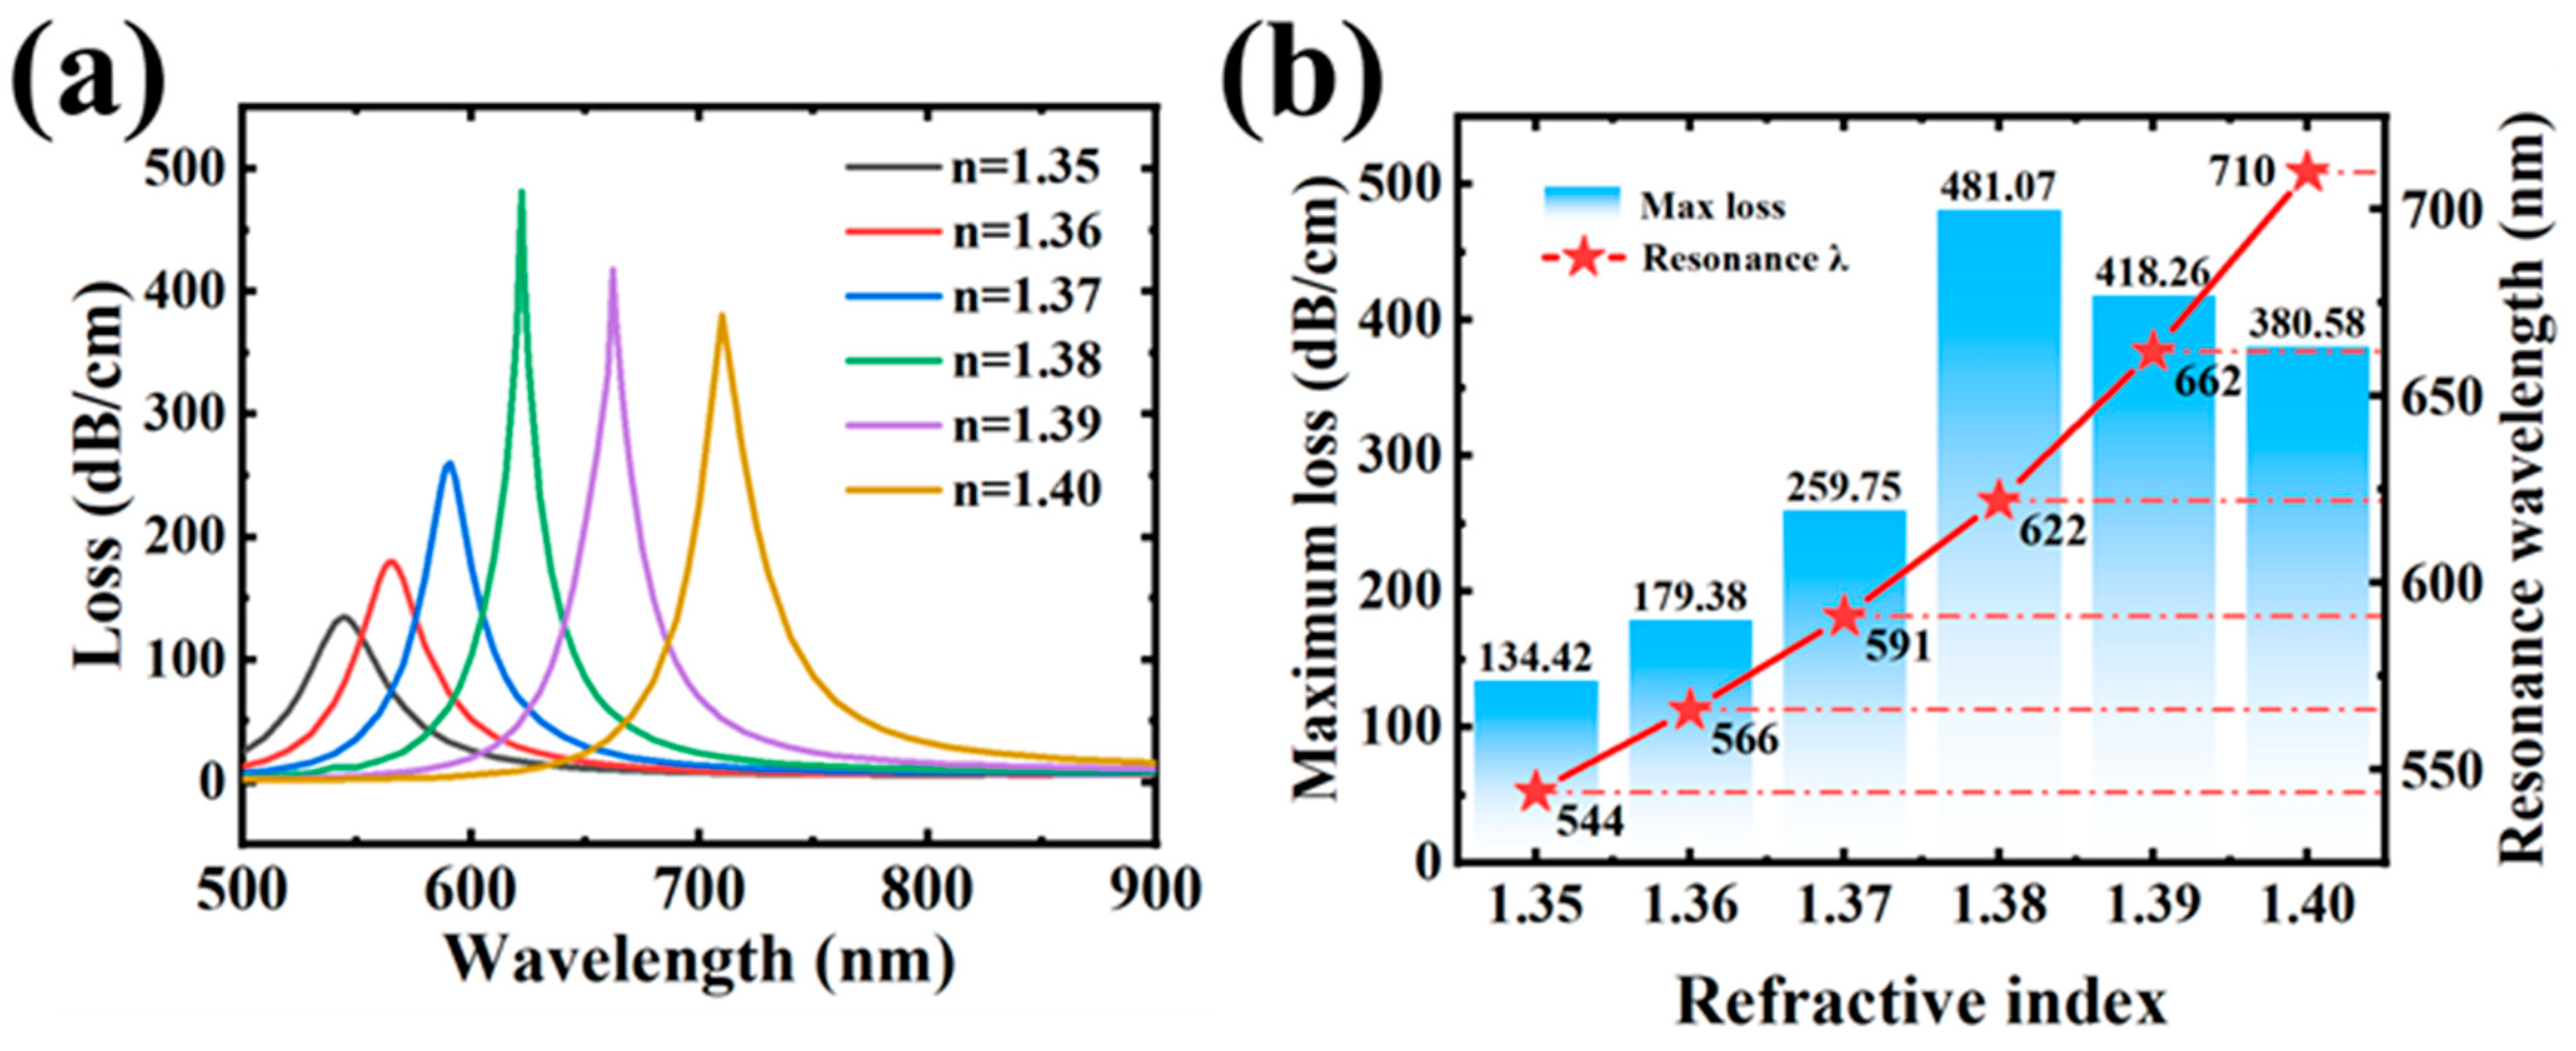
The RI sensor designed in this paper is based on the coupling frequency of the fiber core mode to the SPP mode being sensitive to the RI variation of the analyte within the air holes. Changes in RI can be caused by the change of physical field or by the change of material type or concentration [54,55,56,57]. Through the previous structural parameter studies, a superior structural parameter was chosen to carry out an RI sensitivity study on the model, which will facilitate the study of the scope of sensing of the proposed sensor and the variation of the various performance parameters within that range [58,59,60,61,62]. In addition, it could provide a reference for selective use in the detection of certain substances in specific RI ranges. The variation of the loss spectra as the RI of the analyte increases from 1.35 to 1.4 in increments of 0.01 is shown in Figure 8a. Figure 8b provides a detailed analysis of the variation in RW and maximum loss. As the RI increases, the corresponding losses are 134.42 dB/cm, 179.38 dB/cm, 259.75 dB/cm, 481.07 dB/cm, 418.26 dB/cm and 380.58 dB/cm, showing an increasing trend followed by a decreasing trend. The corresponding RWs are 544 nm, 566 nm, 591 nm, 622 nm, 662 nm and 710 nm, showing an increasing red-shift. The change in RI of the object to be measured affects the dynamic state of the free electrons on the gold surface, resulting in a change in the propagation constant of the SPP mode, which further affects the resonance frequency of the excited SPR effect. Ultimately, the coupling strength and frequency of the Y-pol and SPP modes are affected to varying degrees by changes in the RI of the analyte.
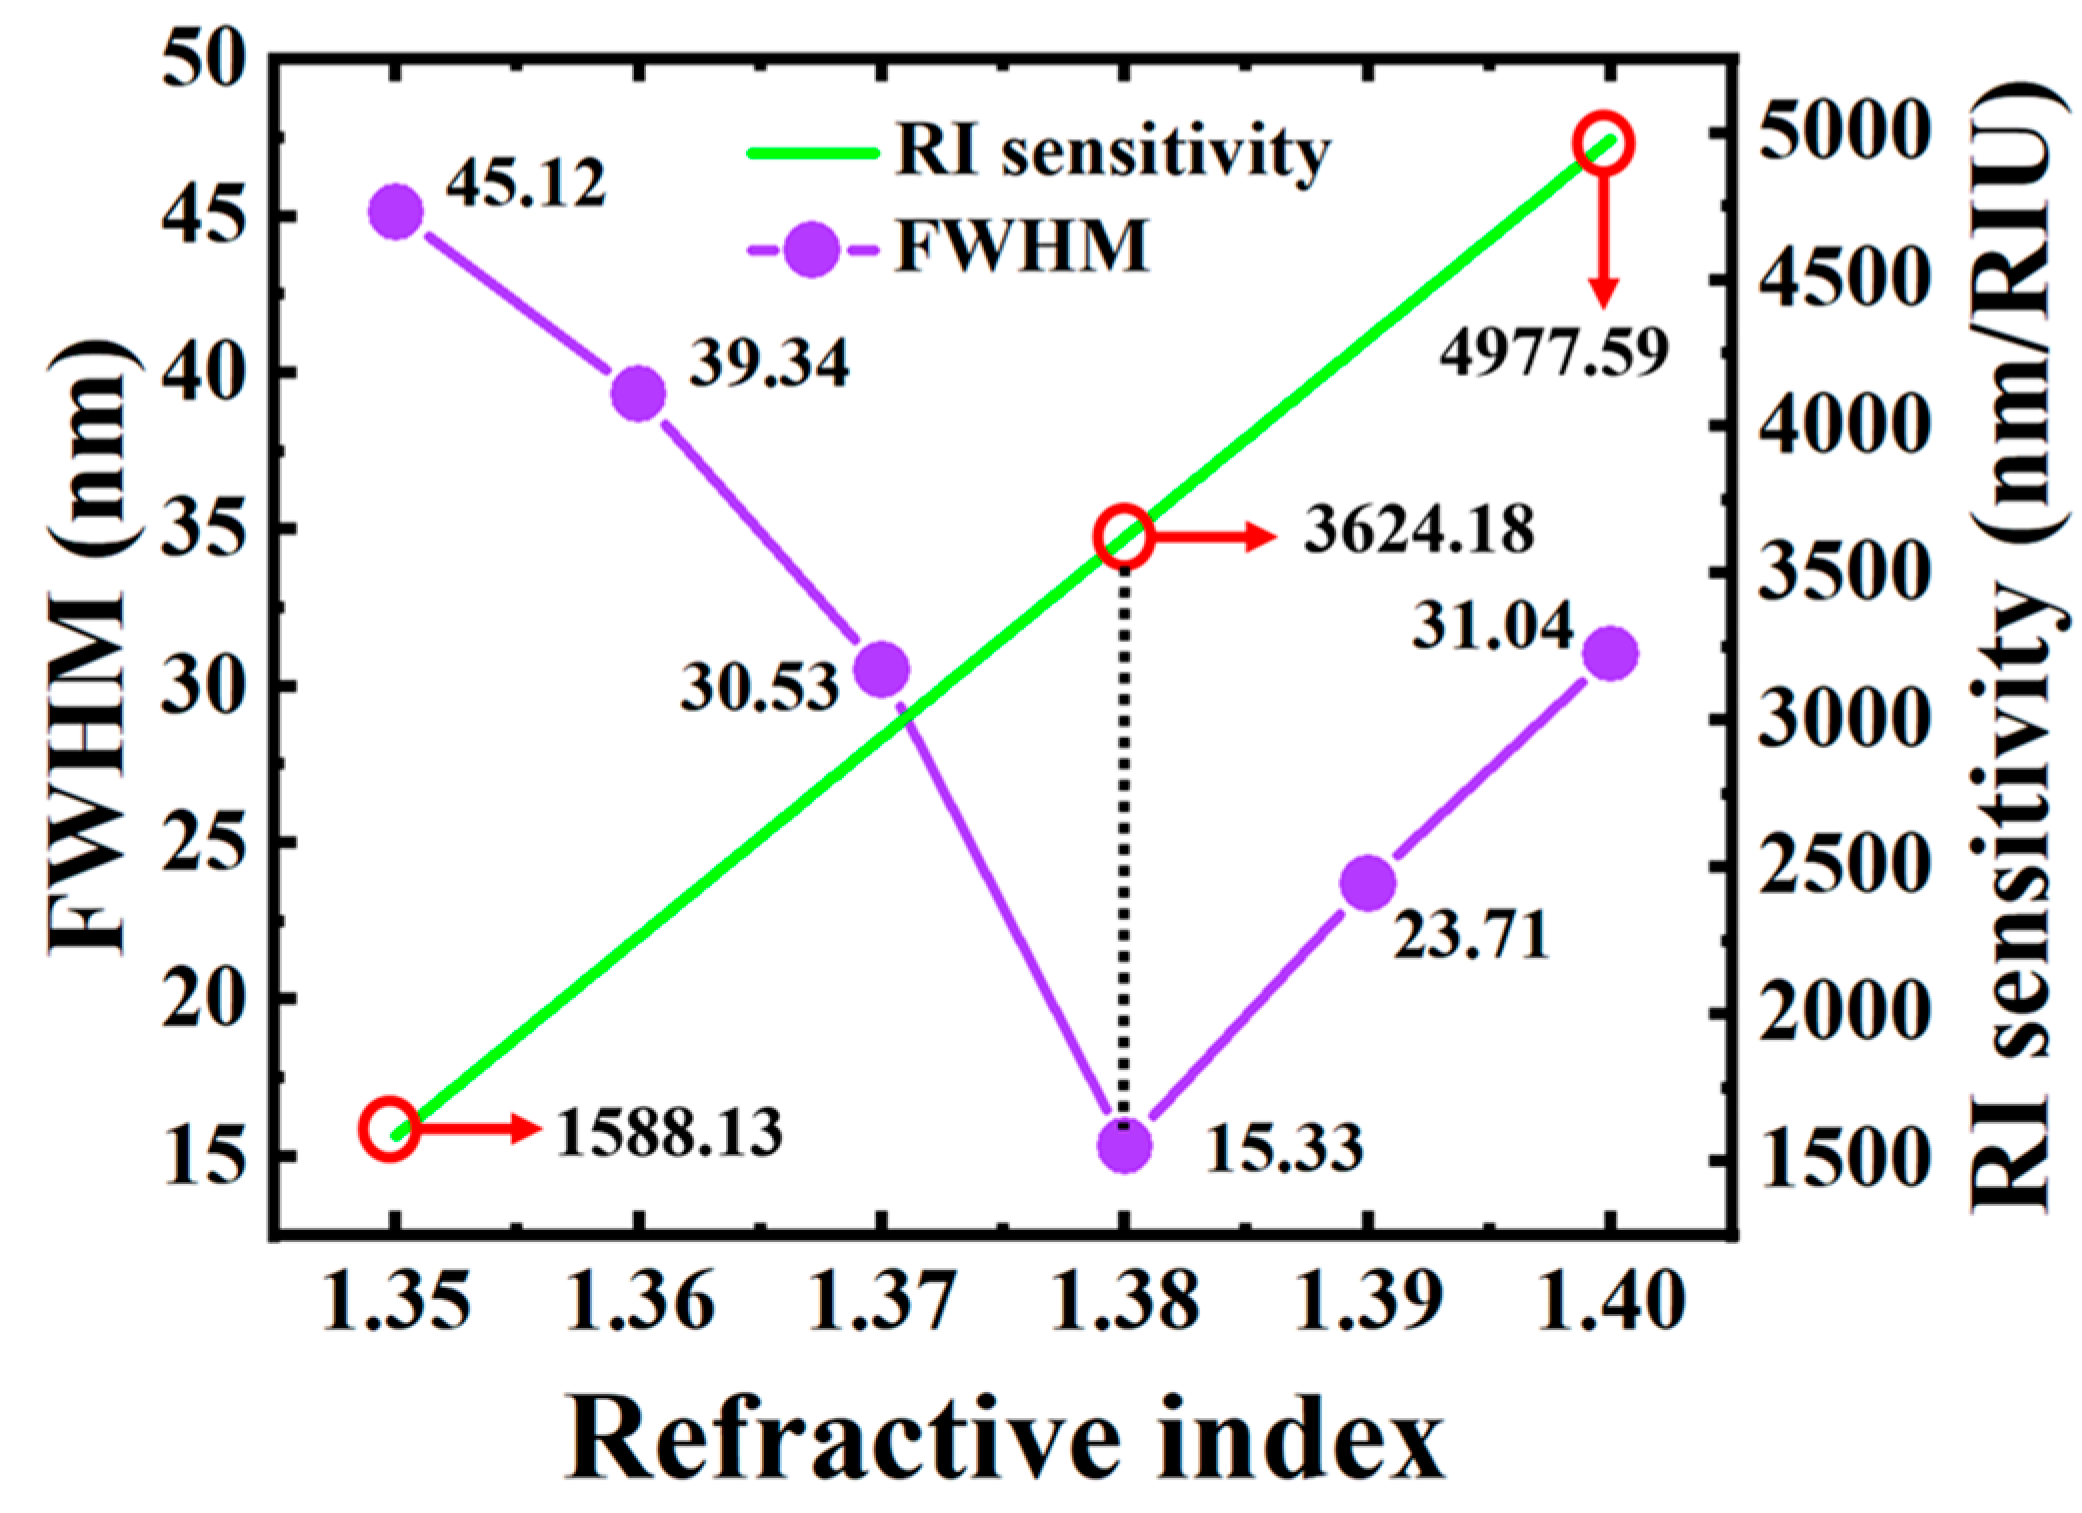
Through fitting a curve to the change in RW and obtaining the derivative, a linear relationship between RI sensitivity and RI is obtained, as shown in Figure 9. The RI sensitivity increases from 1588.13 nm/RIU to 4977.59 nm/RIU as the RI of the analyte increases in the range 1.35–1.40. In addition, the six characteristic RIs corresponding to the loss peaks FWHM of 45.12 nm, 39.34 nm, 30.53 nm, 15.33 nm, 23.37 nm and 31.04 are shown in Figure 9. The trend of the FWHM is opposite to that of the maximum loss, showing a decreasing trend followed by an increasing trend. The FOMs for analytes with RIs of 1.35, 1.38 and 1.40 are 35.2 RIU−1, 237.59 RIU−1 and 160.36 RIU−1, respectively. It shows that in a high-RI environment, although the sensor has a high sensitivity, the characteristic peaks appear to be broadened, which in turn affects the FOM of the detection. Furthermore, when the minimum resolution of the spectrum analyzer is determined, the resolution of the sensor is determined only by the RI sensitivity, and the higher the sensitivity, the higher the resolution. The sensor resolution is 2.01 × 10⁻⁵ RIU when the RI is 1.40. From the variation trend of the loss spectra information shown in Figure 9, it is clear that the RI detection range of the designed sensor is not limited to 1.35–1.40 and can be further expanded through tuning the structural parameters to both sides.
Some typical PCF sensor structures are listed in Table 1, and their RI detection range and maximum sensitivity are compared [60,61,62,63,64,65,66,67]. It can be seen that our designed structure has significant performance advantages.

5. Conclusions

A new type of in-hole gold-coated Q-PCF is proposed in this paper. The sensor offers significant advantages in preparation and material sensing performance compared to another in-hole coated PCF and side-throw PCFs. After optimizing the structural parameters, a maximum RI sensitivity of 4977.59 nm/RIU is realized in the RI range of 1.35–1.40, providing a resolution of 2.01 × 10⁻⁵ RIU and FOM of 160.36 RIU−1. The unique and simple structure of the proposed Q-PCF greatly improves the properties of optical fiber sensing and expands its application scenarios, which provides a new way of thinking and implementation for direct and indirect measurement and monitoring for complex environments and has a potentially scalable value. Metamaterials such as vanadium oxide, graphene or Dirac semimetals can also be used in future research for PCF sensing, which will be a hot research area where optical sensing is combined with electricity and thermodynamics.

Author Contributions

Conceptualization, W.Z., X.Q. and M.L.; data curation, W.Z., M.L. and L.Q.; formal analysis, W.Z. and L.Q.; methodology, W.Z., Z.C. and F.Z.; resources, F.Z.; software, W.Z., X.Q., M.L. and F.Z.; data curation, W.Z.; writing—original draft preparation, W.Z.; writing—review and editing, X.Q., M.L. and F.Z. All authors have read and agreed to the published version of the manuscript.

Funding

This work was supported by the Research and Development Project (2021330101003467).

Institutional Review Board Statement

Not applicable.

Informed Consent Statement

Not applicable.

Data Availability Statement

Publicly available datasets were analyzed in this study. These data can be found here: [https://www.lumerical.com/ (accessed on 1 January 2020)].

Conflicts of Interest

The authors declare no conflict of interest.

References

  1. Li, J.H.; Chen, J.H.; Xu, F. Sensitive and wearable optical microfiber sensor for human health monitoring. Adv. Mater. Technol. 2018, 3, 1800296. [Google Scholar] [CrossRef]
  2. Wu, X.; Yin, C.; Zhang, M.; Xie, Y.; Hu, J.; Long, R.; Wu, X.; Wu, X. The Intercalation Cathode of MOFs-driven Vanadi-um-based Composite Embedded in N-doped Carbon for Aqueous Zinc ion Batteries. Chem. Eng. J. 2023, 452, 139573. [Google Scholar] [CrossRef]
  3. Lai, R.; Shi, P.; Yi, Z.; Li, H.; Yi, Y. Triple-Band Surface Plasmon Resonance Metamaterial Absorber Based on Open-Ended Prohibited Sign Type Monolayer Graphene. Micromachines 2023, 14, 953. [Google Scholar] [CrossRef] [PubMed]
  4. Zhu, Y.; Tang, B.; Jiang, C. Tunable broadband bandwidth anisotropic absorber based on multi-layer black phosphorus ribbons. Appl. Phys. Express 2019, 12, 032009. [Google Scholar] [CrossRef]
  5. Zhu, L.; Hu, R.; Xiang, Y.; Yang, X.; Chen, Z.; Xiong, L.; Wu, X.; He, Z.; Lei, W. Enhanced performance of Li-S battery by constructing inner conductive network and outer adsorption layer sulfur-carbon composite. Int. J. Energy Res. 2020, 45, 6002–6014. [Google Scholar] [CrossRef]
  6. Liang, S.R.; Xu, F.; Li, W.X.; Yang, W.X.; Cheng, S.B.; Yang, H.; Chen, J.; Yi, Z.; Jiang, P.P. Tunable smart mid infrared thermal control emitter based on phase change material VO2 thin film. Appl. Therm. Eng. 2023, 232, 121074. [Google Scholar] [CrossRef]
  7. Barreda, Á.I.; Gutiérrez, Y.; Sanz, J.M.; González, F.; Moreno, F. Polarimetric response of magnetodielectric core–shell nanoparticles: An analysis of scattering directionality and sensing. Nanotechnology 2016, 27, 234002. [Google Scholar] [CrossRef]
  8. Liu, W.; Liu, C.; Wang, J.X.; Lv, J.W.; Lv, Y.; Yang, L.; An, N.; Yi, Z.; Liu, Q.; Hu, C.J.; et al. Surface plasmon resonance sensor composed of microstructured optical fibers for monitoring of external and internal environments in biological and environmental sensing. Results Phys. 2023, 47, 106365. [Google Scholar] [CrossRef]
  9. Chen, Z.H.; Cai, P.G.; Wen, Q.Y.; Chen, H.; Tang, Y.J.; Yi, Z.; Wei, K.H.; Li, G.F.; Tang, B.; Yi, Y.G. Graphene Multi-Frequency Broadband and Ultra-Broadband Terahertz Absorber Based on Surface Plasmon Resonance. Electronics 2023, 12, 2655. [Google Scholar] [CrossRef]
  10. Chen, J.H.; Xiong, Y.F.; Xu, F.; Lu, Y.Q. Silica optical fiber integrated with two-dimensional materials: Towards opto-electro-mechanical technology. Light Sci. Appl. 2021, 10, 78. [Google Scholar] [CrossRef]
  11. Tang, B.; Li, Z.; Palacios, E.; Liu, Z.; Butun, S.; Aydin, K. Chiral-Selective Plasmonic Metasurface Absorbers Operating at Visible Frequencies. IEEE Photonics Technol. Lett. 2017, 29, 295–298. [Google Scholar] [CrossRef]
  12. Liao, C.; Xiong, C.; Zhao, J.; Zou, M.; Zhao, Y.; Li, B.; Ji, P.; Cai, Z.; Gan, Z.; Wang, Y. Design and realization of 3D printed fiber-tip microcantilever probes applied to hydrogen sensing. Light Adv. Manuf. 2022, 3, 3–13. [Google Scholar] [CrossRef]
  13. Russell, P. Photonic crystal fibers. Science 2003, 299, 358–362. [Google Scholar] [CrossRef]
  14. Tang, F.; Wu, X.; Shen, Y.; Xiang, Y.; Wu, X.; Xiong, L.; Wu, X. The intercalation cathode materials of heterostructure MnS/MnO with dual ions defect embedded in N-doped carbon fibers for aqueous zinc ion batteries. Energy Storage Mater. 2022, 52, 180–188. [Google Scholar] [CrossRef]
  15. Wang, D.; Yi, Z.; Ma, G.; Dai, B.; Yang, J.; Zhang, J.; Yu, Y.; Liu, C.; Wu, X.; Bian, Q. Two channels photonic crystal fiber based on surface plasmon resonance for magnetic field and temperature dual-parameter sensing. Phys. Chem. Chem. Phys. 2022, 24, 21233. [Google Scholar] [CrossRef]
  16. Chen, H.; Li, W.; Zhu, S.M.; Hou, A.Q.; Liu, T.; Xu, J.S.; Zhang, X.W.; Yi, Z.; Yi, Y.G.; Dai, B. Study on the Thermal Distribution Characteristics of a Molten Quartz Ceramic Surface under Quartz Lamp Radiation. Micromachines 2023, 14, 1231. [Google Scholar] [CrossRef] [PubMed]
  17. Chen, K.; Zhou, X.; Cheng, X.; Qiao, R.; Cheng, Y.; Liu, C.; Xie, Y.; Yu, W.; Yao, F.; Sun, Z. Graphene photonic crystal fibre with strong and tunable light–matter interaction. Nat. Photonics 2019, 13, 754–759. [Google Scholar] [CrossRef] [Green Version]
  18. Li, W.; Ma, J.; Zhang, H.; Cheng, S.; Yang, W.; Yi, Z.; Yang, H.; Zhang, J.; Wu, X.; Wu, P. Tunable broadband absorber based on a layered resonant structure with a Dirac semimetal. Phys. Chem. Chem. Phys. 2023, 25, 8489–8496. [Google Scholar] [CrossRef]
  19. Zhang, Y.; Yi, Y.; Li, W.; Liang, S.; Ma, J.; Cheng, S.; Yang, W.; Yi, Y. High Absorptivity and Ultra-Wideband Solar Absorber Based on Ti-Al2O3 Cross Elliptical Disk Arrays. Coatings 2023, 13, 531. [Google Scholar] [CrossRef]
  20. Shan, L.; Zhou, J.; Zhang, W.; Xia, C.; Guo, S.; Ma, X.; Fang, G.; Wu, X.; Liang, S. Highly Reversible Phase Transition Endows V6O13 with Enhanced Performance as Aqueous Zinc-Ion Battery Cathode. Energy Technol. 2019, 7, 57. [Google Scholar] [CrossRef]
  21. Qin, F.; Chen, J.; Liu, J.W.; Liu, L.; Tang, C.J.; Tang, B.; Li, G.F.; Zeng, L.C.; Li, H.L.; Yi, Z. Design of high efficiency perovskite solar cells based on inorganic and organic undoped double hole layer. Sol. Energy 2023, 262, 111796. [Google Scholar] [CrossRef]
  22. Li, W.X.; Zhao, W.C.; Cheng, S.B.; Yang, W.X.; Yi, Z.; Li, G.F.; Zeng, L.C.; Li, H.L.; Wu, P.H.; Cai, S.S. Terahertz Selective Active Electromagnetic Absorption Film Based on Single-layer Graphene. Surf. Interfaces 2023, 40, 103042. [Google Scholar] [CrossRef]
  23. Meng, W.; Li, C.; Yao, M.; He, Z.; Wu, X.; Jiang, Z.; Dai, L.; Wang, L. Synthesis and electrochemical performance of Li1+xTi2−xFex(PO4)3/C anode for aqueous lithium ion battery. Adv. Powder Technol. 2020, 31, 1359–1364. [Google Scholar] [CrossRef]
  24. Wu, X.; Li, Y.; Xiang, Y.; Liu, Z.; He, Z.; Wu, X.; Li, Y.; Xiong, L.; Li, C.; Chen, J. Mixed-valence cobalt oxides bifunctional electrocatalyst with rich oxygen vacancies for aqueous metal-air batteries. Chem. Eng. J. 2023, 453, 139831. [Google Scholar] [CrossRef]
  25. Wu, X.; Li, Y.; Xiang, Y.; Liu, Z.; He, Z.; Wu, X.; Li, Y.; Xiong, L.; Li, C.; Chen, J. The electrochemical performance of aqueous rechargeable battery of Zn/Na0.44MnO2 based on hybrid electrolyte. J. Power Sources 2016, 336, 35–39. [Google Scholar] [CrossRef]
  26. Shangguan, Q.; Chen, Z.; Yang, H.; Cheng, S.; Yang, W.; Yi, Z.; Wu, X.; Wang, S.; Yi, Y.; Wu, P. Design of Ultra-Narrow Band Graphene Refractive Index Sensor. Sensors 2022, 22, 6483. [Google Scholar] [CrossRef]
  27. Islam, M.R.; Iftekher, A.; Noor, F.; Khan, M.R.H.; Reza, M.T.; Nishat, M.M. AZO-coated plasmonic PCF nanosensor for blood constituent detection in near-infrared and visible spectrum. Appl. Phys. A 2022, 128, 86. [Google Scholar] [CrossRef]
  28. Selvendran, S.; Divya, J.; Raja, A.S.; Sivasubramanian, A.; Itapu, S. A Reconfigurable Surface-Plasmon-Based Filter/Sensor Using D-Shaped Photonic Crystal Fiber. Micromachines 2022, 13, 917. [Google Scholar] [CrossRef] [PubMed]
  29. Cheng, Y.; Yu, W.; Xie, J.; Wang, R.; Cui, G.; Cheng, X.; Li, M.; Wang, K.; Li, J.; Sun, Z. Controllable growth of graphene photonic crystal fibers with tunable optical nonlinearity. ACS Photonics 2022, 9, 961–968. [Google Scholar] [CrossRef]
  30. Fan, Y.; Pu, S.; Li, D.; Zhao, Y.; Yuan, M.; Wang, J.; Liu, W. Bilaterally Polished Photonic Crystal Fiber Magnetic Field Sensor Based on Lossy Mode Resonance. IEEE Sens. J. 2022, 22, 23786–23792. [Google Scholar] [CrossRef]
  31. Wu, H.; Song, Y.; Sun, M.; Wang, Q. Simulation of High-Performance Surface Plasmon Resonance Sensor Based on D-Shaped Dual Channel Photonic Crystal Fiber for Temperature Sensing. Materials 2022, 16, 37. [Google Scholar] [CrossRef] [PubMed]
  32. Wang, D.; Zhu, W.; Yi, Z.; Ma, G.; Gao, X.; Dai, B.; Yu, Y.; Zhou, G.; Wu, P.; Liu, C. Highly sensitive sensing of a magnetic field and temperature based on two open ring channels SPR-PCF. Opt. Express 2022, 30, 39055–39067. [Google Scholar] [CrossRef] [PubMed]
  33. Zhu, W.; Yi, Y.; Yi, Z.; Bian, L.; Yang, H.; Zhang, J.; Yu, Y.; Liu, C.; Li, G.; Wu, X. High confidence plasmonic sensor based on photonic crystal fiber with U-shaped detection channel. Phys. Chem. Chem. Phys. 2023, 25, 8583. [Google Scholar] [CrossRef]
  34. Bing, P.; Huang, S.; Sui, J.; Wang, H.; Wang, Z. Analysis and improvement of a dual-core photonic crystal fiber sensor. Sensors 2018, 18, 2051. [Google Scholar] [CrossRef] [Green Version]
  35. Zhang, X.; Liu, Z.; Gui, Y.; Gan, H.; Guan, Y.; He, L.; Wang, X.; Shen, X.; Dai, S. Characteristics and preparation of a polarization beam splitter based on a chalcogenide dual-core photonic crystal fiber. Opt. Express 2021, 29, 39601–39610. [Google Scholar] [CrossRef]
  36. Zhang, J.; Yuan, J.; Qu, Y.; Qiu, S.; Mei, C.; Zhou, X.; Yan, B.; Wu, Q.; Wang, K.; Sang, X. A Surface Plasmon Resonance-Based Photonic Crystal Fiber Sensor for Simultaneously Measuring the Refractive Index and Temperature. Polymers 2022, 14, 3893. [Google Scholar] [CrossRef]
  37. Wang, S.; Ma, W.; Cheng, Q.; Liu, N.; Lu, Y.; Wu, X.; Xiang, J. Dual-Channel Surface Plasmon Resonance–Based Photonic Crystal Fiber Sensor with Metal-Ta2O5 Coating at Near-infrared Wavelength. Plasmonics 2022, 17, 119–129. [Google Scholar] [CrossRef]
  38. Wang, D.; Yu, Y.; Lu, Z.; Yang, J.; Yi, Z.; Bian, Q.; Zhang, J.; Qin, S.; Weng, J.; Yao, S. Design of photonic crystal fiber to excite surface plasmon resonance for highly sensitive magnetic field sensing. Opt. Express 2022, 30, 29271–29286. [Google Scholar] [CrossRef]
  39. Ding, Y.; Liu, C.; Sun, Y.; Wang, F.; Lin, Y.; Liu, Q.; Sun, T.; Chu, P.K. Single-polarization photonic crystal fiber filter composed of elliptical gold films. Opt. Eng. 2020, 59, 076103. [Google Scholar] [CrossRef]
  40. Liu, Q.; Jiang, Y.; Sun, Y.; Hu, C.; Sun, J.; Liu, C.; Lv, J.; Zhao, J.; Yi, Z.; Chu, P.K. Surface plasmon resonance sensor based on U-shaped photonic quasi-crystal fiber. Appl. Opt. 2021, 60, 1761–1766. [Google Scholar] [CrossRef]
  41. Zhu, Y.; Tang, B.; Yang, N.; Lang, X.; Su, J.; Li, Z. Tunable wide-angle perfect absorber based on black phosphorous-dielectric-metallic hybrid architecture. Phys. E 2021, 126, 114449. [Google Scholar] [CrossRef]
  42. Tang, B.; Jia, Z.; Huang, L.; Su, J.; Jiang, C. Polarization-Controlled Dynamically Tunable Electromagnetically Induced Transparency-Like Effect Based on Graphene Metasurfaces. IEEE J. Sel. Top. Quantum Electron. 2021, 27, 4700406. [Google Scholar] [CrossRef]
  43. Ma, J.; Wu, P.H.; Li, W.X.; Liang, S.R.; Shangguan, Q.Y.; Cheng, S.B.; Tian, Y.H.; Fu, J.Q.; Zhang, L.B. A five-peaks graphene absorber with multiple adjustable and high sensitivity in the far infrared band. Diam. Relat. Mater. 2023, 136, 109960. [Google Scholar] [CrossRef]
  44. Zheng, Z.P.; Zhao, W.C.; Yi, Z.; Bian, L.; Yang, H.; Cheng, S.B.; Li, H.L.; Li, G.F.; Zeng, L.C.; Li, H.; et al. Active thermally tunable and highly sensitive terahertz smart windows based on the combination of a metamaterial and phase change material. Dalton Trans. 2023, 52, 8294. [Google Scholar] [CrossRef] [PubMed]
  45. Li, C.; Shi, X.; Liang, S.; Ma, X.; Han, M.; Wu, X.; Zhou, J. Spatially homogeneous copper foam as surface dendrite-free host for zinc metal anode. Chem. Eng. J. 2020, 379, 122248. [Google Scholar] [CrossRef]
  46. Li, W.; Yi, Y.; Yang, H.; Cheng, S.; Yang, W.X.; Zhang, H.; Yi, Z.; Yi, Y.; Li, H. Active Tunable Terahertz Bandwidth Absorber Based on single layer Graphene. Commun. Theor. Phys. 2023, 75, 045503. [Google Scholar] [CrossRef]
  47. Li, Y.; Yang, S.; Du, H.; Liu, Y.; Wu, X.; Yin, C.; Wang, D.; Wu, X.; He, Z.; Wu, X. A stable fluoride-based interphase for a long cycle Zn metal anode in an aqueous zinc ion battery. J. Mater. Chem. A 2022, 10, 14399–14410. [Google Scholar] [CrossRef]
  48. Wang, Z.; Liu, Y.; Li, L.; Gao, S.; Zhu, D.; Yu, X.; Cheng, S.; Zheng, D.; Xiong, Y. An investigation of the effects of ZnO inverse opal pore size in the composite of ZnO nanorods/ZnO inverse opal on the performance of quantum dot-sensitized solar cells. Dalton Trans. 2023, 52, 81–89. [Google Scholar] [CrossRef]
  49. Tang, B.; Yang, N.; Huang, L.; Su, J.; Jiang, C. Tunable anisotropic perfect enhancement absorption in black phosphorus-based metasurfaces. IEEE Photonics J. 2020, 12, 4500209. [Google Scholar] [CrossRef]
  50. Zheng, Y.; Yi, Z.; Liu, L.; Wu, X.W.; Liu, H.; Li, G.F.; Zeng, L.C.; Li, H.L.; Wu, P.H. Numerical simulation of efficient solar absorbers and thermal emitters based on multilayer nanodisk arrays. Appl. Therm. Eng. 2023, 230, 120841. [Google Scholar] [CrossRef]
  51. Wu, X.; Tan, C.; He, C.; Zhao, T.; Wu, X.; Ma, Z.; Wang, H.; Cai, Y.; Wu, Q.; Li, Q. Strategy for boosting Co-Nx content for oxygen reduction reaction in aqueous metal-air batteries. J. Power Sources 2022, 520, 230891. [Google Scholar] [CrossRef]
  52. Wu, F.Y.; Shi, P.C.; Yi, Z.; Li, H.L.; Yi, Y.G. Ultra-Broadband Solar Absorber and High-Efficiency Thermal Emitter from UV to Mid-Infrared Spectrum. Micromachines 2023, 14, 985. [Google Scholar] [CrossRef] [PubMed]
  53. Liu, Y.; Wang, Z.; Li, L.; Gao, S.; Zheng, D.; Yu, X.; Wu, Q.; Yang, Q.; Zhu, D.; Yang, W.; et al. Highly efficient quantum-dot-sensitized solar cells with composite semiconductor of ZnO nanorod and oxide inverse opal in photoanode. Electrochim. Acta 2022, 412, 140145. [Google Scholar] [CrossRef]
  54. Wu, X.; Li, Y.; Li, C.; He, Z.; Xiang, Y.; Xiong, L.; Chen, D.; Yu, Y.; Sun, K.; He, Z.; et al. The electrochemical performance improvement of LiMn2O4/Zn based on zinc foil as the current collector and thiourea as an electrolyte additive. J. Power Sources 2015, 300, 453–459. [Google Scholar] [CrossRef]
  55. Tang, B.; Guo, Z.; Jin, G. Polarization-controlled and symmetry-dependent multiple plasmon-induced transparency in graphene-based metasurfaces. Opt. Express 2022, 30, 35554–35566. [Google Scholar] [CrossRef]
  56. Jia, Z.; Huang, L.; Su, J.; Tang, B. Tunable electromagnetically induced transparency-like in graphene metasurfaces and its application as a refractive index sensor. J. Light. Technol. 2021, 39, 1544–1549. [Google Scholar] [CrossRef]
  57. Liang, S.; Xu, F.; Yang, H.; Cheng, S.; Yang, W.; Yi, Z.; Song, Q.; Wu, P.; Chen, J.; Tang, C. Ultra long infrared metamaterial absorber with high absorption and broad band based on nano cross surrounding. Opt. Laser Technol. 2023, 158, 108789. [Google Scholar] [CrossRef]
  58. Ye, Z.; Wu, P.; Wang, H.; Jiang, S.; Huang, M.; Lei, D.; Wu, F. Multimode tunable terahertz absorber based on a quarter graphene disk structure. Results Phys. 2023, 48, 106420. [Google Scholar] [CrossRef]
  59. Ren, Y.; Zhou, T.; Jiang, C.; Tang, B. Thermally switching between perfect absorber and asymmetric transmission in vanadium dioxide-assisted metamaterials. Opt. Express 2021, 29, 7666–7679. [Google Scholar] [CrossRef]
  60. Tang, B.; Ren, Y. Tunable and switchable multi-functional terahertz metamaterials based on a hybrid vanadium dioxide–graphene integrated configuration. Phys. Chem. Chem. Phys. 2022, 24, 8408–8414. [Google Scholar] [CrossRef]
  61. Qi, H.; Tang, B. An active tunable terahertz functional metamaterial based on hybrid-graphene vanadium dioxide. Phys. Chem. Chem. Phys. 2023, 25, 7825–7831. [Google Scholar] [CrossRef]
  62. Ren, Y.; Tang, B. Switchable Multi-Functional VO2-Integrated Metamaterial Devices in the Terahertz Region. J. Light. Technol. 2021, 39, 5864–5868. [Google Scholar] [CrossRef]
  63. Wang, G.; Lu, Y.; Duan, L.; Yao, J. A refractive index sensor based on PCF with ultra-wide detection range. IEEE J. Sel. Top. Quantum Electron. 2020, 27, 2993866. [Google Scholar] [CrossRef]
  64. An, G.; Li, S.; Yan, X.; Zhang, X.; Yuan, Z.; Wang, H.; Zhang, Y.; Hao, X.; Shao, Y.; Han, Z. Extra-broad photonic crystal fiber refractive index sensor based on surface plasmon resonance. Plasmonics 2017, 12, 465–471. [Google Scholar] [CrossRef]
  65. Otupiri, R.; Akowuah, E.K.; Haxha, S. Multi-channel SPR biosensor based on PCF for multi-analyte sensing applications. Opt. Express 2015, 23, 15716–15727. [Google Scholar] [CrossRef] [PubMed] [Green Version]
  66. Rifat, A.A.; Mahdiraji, G.A.; Ahmed, R.; Chow, D.M.; Sua, Y.; Shee, Y.; Adikan, F.M. Copper-graphene-based photonic crystal fiber plasmonic biosensor. IEEE Photonics J. 2015, 8, 2510632. [Google Scholar] [CrossRef]
  67. Rifat, A.A.; Hasan, M.R.; Ahmed, R.; Butt, H. Photonic crystal fiber-based plasmonic biosensor with external sensing approach. J. Nanophotonics 2018, 12, 012503. [Google Scholar] [CrossRef]
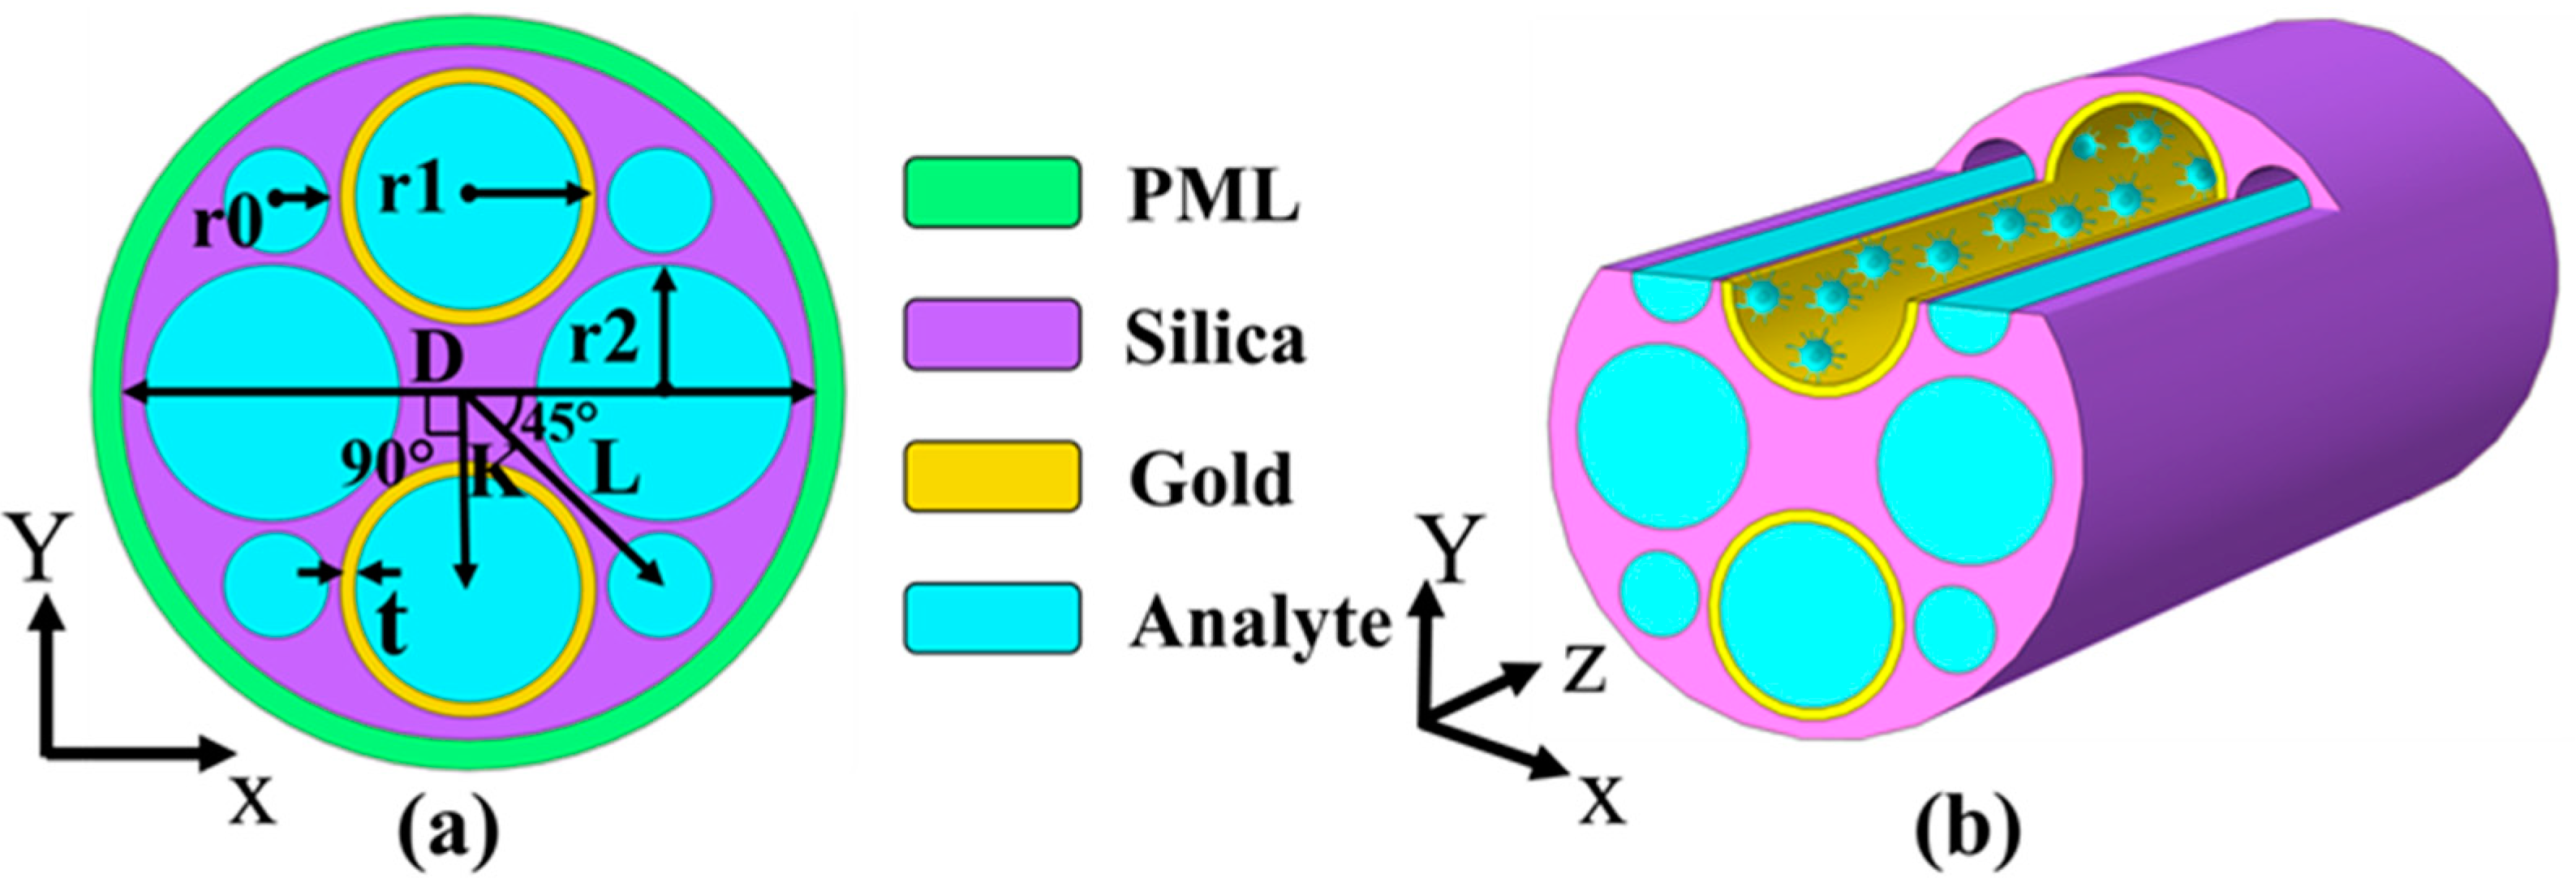
Figure 1. (a) The simulation cross-section of the Q-PCF. K represents the distance between the air holes in the horizontal direction with radius r2 and the fiber core. The air hole in the vertical direction has a radius of r1 and the inner wall is coated with a gold layer of thickness t. L represents the distance from the fiber core to the other four air holes of radius r0. D represents the diameter of the Q-PCF. (b) 3D schematic of the Q-PCF.
Coatings 13 01261 g001
Figure 2. Schematic diagram of the sensing principle of the proposed Q-PCF. A broadband intensity-flat signal passing through the sensor will form a loss peak at a specific frequency. The loss peaks appear blue-shifted or red-shifted due to changes in refractive index.
Coatings 13 01261 g002
Figure 3. The real part of RI of Y-pol mode, the loss spectra of the X-pol and Y-pol mode and the corresponding electric intensity distribution of coupling mode when n = 1.38, t = 30 nm, r1 = 8.2 μm, r2 = 8.2 μm.
Coatings 13 01261 g003
Figure 4. The initial parameters are t = 30 nm, n = 1.38, r1 = 8.2 μm and r2 = 8.2 μm, respectively. (a) shows the loss spectra corresponding to the three models, and the three models are shown in (bd), respectively. The electric field distributions of the corresponding coupled modes at their peaks are shown in (eg), respectively.
Coatings 13 01261 g004
Figure 5. The initial parameters are n = 1.38, t = 30 nm and r2 = 8.2 μm, respectively. (a) The variation of the loss spectra with r1; (b) maximum losses and resonance wavelengths corresponding to different r1.
Coatings 13 01261 g005
Figure 6. The initial parameters are n = 1.38, t = 30 nm and r1 = 8.2 μm, respectively. (a) The variation of the loss spectra with r2; (b) maximum losses and resonance wavelengths corresponding to different r2.
Coatings 13 01261 g006
Figure 7. The initial parameters are n = 1.38, r1 = 8.2 μm and r2 = 8.2 μm, respectively. (a) The variation of the loss spectrum with t; (b) maximum losses and resonance wavelengths corresponding to different t.
Coatings 13 01261 g007
Figure 8. The initial parameters are t = 30 nm, n = 1.38, r1 = 8.2 μm and r2 = 8.2 μm, respectively. (a) The variation of the loss spectrum with n; (b) maximum losses and resonance wavelengths corresponding to different n.
Coatings 13 01261 g008
Figure 9. FWHM and the fitted RI sensitivity lines for the loss spectra corresponding to different RIs.
Coatings 13 01261 g009
Table 1. Comparison of refractive index sensing performance of some typical structures.
Structure SchematicCoatings 13 01261 i001Coatings 13 01261 i002Coatings 13 01261 i003Coatings 13 01261 i004Coatings 13 01261 i005Coatings 13 01261 i006
Detection
Range
1.29–1.491.63–1.791.32–1.391.33–1.371.33–1.371.35–1.40
Max RI Sensitivity (nm/RIU)4156.8232334600200040004977.59
References[63][64][65][66][67]This work
Disclaimer/Publisher’s Note: The statements, opinions and data contained in all publications are solely those of the individual author(s) and contributor(s) and not of MDPI and/or the editor(s). MDPI and/or the editor(s) disclaim responsibility for any injury to people or property resulting from any ideas, methods, instructions or products referred to in the content.