Article

The Mechanical and Self-Sensing Performance of Reactive Powder Cement Concrete with Nano-Stainless Steel Powder

1
Department of Civil Engineering, Henan Vocational College of Water Conservancy and Environment, Zhengzhou 450000, China
2
China Construction First Grp. Corp. Ltd., 52 South West Sihuan Rd, Beijing 100161, China
3
China Railway Major Bridge Engineering Group Co., Ltd., Zhengzhou 450000, China
4
School of Civil Engineering and Geographic Environment, Ningbo University, Ningbo 315000, China
*
Author to whom correspondence should be addressed.
Coatings 2023, 13(7), 1153; https://doi.org/10.3390/coatings13071153
Submission received: 24 May 2023 / Revised: 14 June 2023 / Accepted: 23 June 2023 / Published: 26 June 2023
(This article belongs to the Special Issue Surface Modified Repairing Materials and Mechanics)

Abstract

:
In order to prepare cement concrete with high mechanical properties and durability, nano-stainless steel powder reactive powder cement concrete (RPC) was manufactured. The dosage of nano-stainless steel powder ranged from 0% to 1.2% by the total volume of the RPC. In this study, the compressive and flexural strengths of the RPC with nano-stainless steel powder were determined, the dry shrinkage rate of the RPC was tested and the electrical resistance and alternating current (AC) impedance spectrum of the RPC were measured; moreover, the corresponding strain-sensing properties were investigated, and the scanning electron microscope (SEM) was used for observing the microstructures of the RPC. The results showed that the RPC with 1.0% nano-stainless steel powder exhibited the threshold values of the mechanical strengths. The maximum flexural strength and compressive strength were 16.1% and 14.2% higher than the minimum values. The addition of the nano-stainless steel powders reduced the dry shrinkage rate by 12.1%–39.8%. The electrical resistance of the RPC decreased in the form of the cubic function with the volume fraction of the stainless steel powders. The 1.0% nano-stainless steel powder was the threshold value for the electrical resistance and piezoresistive performance. The relationship between the electrical reactance and electrical resistance fitted well with the quadratic function. As obtained from the SEM results, the addition of the nano-stainless steel powder could effectively improve the compactness of the hydration products.

1. Introduction

Cement concrete is the most widely used construction building material, which has been used for more than 200 years [1,2,3]. Cement concrete can be used for constructing facilities such as bridges, buildings and pavement [4]. Cement concrete constructions have been applied in various environments [5,6]. For these reasons, its mechanical properties and durability are of the utmost importance [7,8]. Hence, high strength and durability concrete needs to be developed [9,10]. Additionally, the performance decay needs to be sensed promptly [11,12,13].
Reactive powder cement concrete (RPC) is a special cement concrete material with high strength and durability [14,15,16]. This material was invented in the 1990s, and has been applied in the laying of bridge decks and in the preparation of bridge and building components [17,18]. For manufacturing RPC with excellent performance, the RPC matrix should be made with high compactness. Moreover, the reinforced fibers are essential to improve the mechanical strengths of the RPC. Steel fibers, polypropylene fibers, carbon fibers and straw fibers have been confirmed to improve the mechanical strengths of RPC [19,20]. However, these fibers have some defects. Steel fibers rust easily. The polypropylene fibers, carbon fibers and straw fibers have low plasticity [21,22]. Additionally, these fibers are difficult to evenly disperse in cement-based materials [23,24]. In order to solve these issues, nanofibers have been proposed.
Piezoresistivity refers to the property of a material to undergo changes in its electrical resistance in response to mechanical deformation or pressure. By incorporating conductive fibers or particles within an insulating matrix, a conductive network can be formed, which exhibits sensitivity to damage propagation in composites [25,26,27]. In order to increase the self-sensing properties of cement concrete, the conductive fibers should be added in the cement matrix [28]. Carbon fibers, nanofibers, carbon nanotubes, graphene and stainless steel fibers have been shown to increase the electrical conduction and the corresponding self-sensing performance [29,30,31,32]. However, they are difficult to disperse in the cement matrix [33]. Therefore, in this study, the nano-stainless steel powders applied in the RPC were proposed. The nano-stainless steel powders show the aspect ratio of higher than 100, which is advantageous to its uniform dispersion [34]. Moreover, the nano-stainless steel powders possess strong corrosion resistance. Furthermore, these nano-stainless steel powders show high electric conduction. Additionally, stainless steel presents excellent mechanical performance [35]. Based on these reasons, RPC with nano-stainless steel powders may show high mechanical strength, perfect durability and self-sensing performance. However, little attention has been paid to the development of this self-sensing ultra-high performance concrete material.
The main purpose of this article was to develop an ultra-high performance self-sensing concrete material filled with nano-stainless steel powders. In this paper, the mechanical strengths (flexural and compressive strengths) of RPC were investigated. The flexural toughness was obtained. The electrical resistance and alternating current (AC) impedance spectroscopy curves were measured. Additionally, the strain-sensing curves of the RPC were acquired. The scanning electron microscope (SEM) was applied in observing the microstructures of the RPC. By adjusting the dosages of nano-stainless steel fibers, the optimal nano-stainless steel fiber RPC mix ratio could be determined based on the mechanical properties, durability and piezoresistive properties. This research will provide a basis for a special high-performance concrete material with a self-sensing property in the future. Simultaneously, the nano-stainless steel powders show high cost, and the economical production methods need to be further developed.

2. Experimental Methods

2.1. Raw Materials

The ordinary Portland cement (OPC) provided by Henan Bangbei Trading Co., Ltd., Zhengzhou, China was used in this experiment. The mineral admixture fine silica fume with a specific surface area of 14.8 m2/g and 97.6% SiO2 was applied in this research. The density of fine silica fume (SF) was 2.18 g/cm3. Blast furnace slag powder (BFS) showing the density of 2.9 g/cm3 and the specific surface area of 428.3 m2/kg was used as another mineral admixture. Quartz sand with the particle sizes of 0.95~0.73, 0.58~0.37 and 0.13~0.299 mm, showing the mass ratios of 1:1.5:1 was used as an aggregate for manufacturing the RPC. The quartz sand contained 98.9% SiO2 and 1.1% Fe2O3. Nano-stainless steel powder (NSP) provided by Yi’an Metal Materials Co., Ltd., Dongguan, China, was manufactured by 316 L stainless steel and possessed the average aspect ratio of 256. Table 1 and Table 2 show the chemical compositions and particle sizes of the raw materials.

2.2. The Manufacturing Process of the RPC Specimens

The RPC specimens with the mixing proportions in Table 3 were prepared using the following steps. All the powder raw materials were mixed in the UJZ-15 mortar mixer and stirred with the mixing speed of 140 r/min for the first 1 min. Then, the solution with water and the water-reducing agent was added and mixed with the same speed for another 3 min. After mixing, all the fresh samples were poured into the moulds with the sizes of 40 mm × 40 mm × 160 mm, 50 mm × 50 mm × 50 mm and 100 mm × 100 mm × 300 mm. When the preparation of fresh RPC was finished, the fresh sample was applied in the test of the slump flow by the jump table test method according to the Chinese standard GB/T2419-2005 [36].

2.3. The Measuring Process

2.3.1. The Mechanical Strengths

The mechanical strengths were determined by the TYE-300F flexural and compressive testing machine, which was provided by Wuxi Jianyi Instrument Machinery Co., Ltd., Wuxi, China. The loading speed for the flexural and compressive strengths were 0.1 kN/s and 2.4 kN/s, respectively. The measuring equipment and process are shown in Figure 1. The mechanical strengths were obtained following the Chinese standard GB/T17671-1999 [37].

2.3.2. The Dry Shrinkage Rate

The dry shrinkage of specimens were measured by the shrinkage rod. Before the measurement, one end of the specimens was supported by the dial indicator. The value of the length change was read out by the dial indicator during the curing time. The dry shrinkage rate (DSR) was calculated by Equation (1).
D S R = L 0 L L 0
where L0 is the initial length of the specimen and L is the length of specimen during curing. Through this method, the dry shrinkage rate was measured. The measurement of the DSR is shown in Figure 2.

2.3.3. The Electrical Parameters

Specimens with the size of 50 mm × 50 mm × 50 mm were used for the measurements of electrical resistance and the AC impedance spectrum. The two-electrode method was used to determine the electrical parameters of the specimen. Two pieces of 304 stainless steel mesh with the square hole diameter of 4.75 mm were used as the electrodes. The stainless steel mesh electrode showed a length of 65 mm, a width of 48 mm and a thickness of 0.8 mm. The Changzhou Tonghui TH2838H LCR digital meter with the testing voltage of 2 V–5 V and testing frequencies of 20 Hz–1 MHz was used for testing the electrical resistance. The measuring voltage and the voltage’s corresponding frequency in this study were 3 V and 105 Hz, respectively. The sampling frequency in this experiment was 100 Hz.
The Zennium Pro Electrochemical Workstation provided by Beijing Huanyu Ruihui Science and Trade Co., Ltd., Beijing, China was used for obtaining the AC impedance spectrum. The measuring frequency ranged from 105 Hz to 1 Hz. The voltage in this experiment was −10 mV–10 mV. In the measurement of electrical parameters, the distance between two electrodes was 40 mm. The measuring process of electrical resistance and the AC impedance spectrum is shown in Figure 3.

2.4. The Strain-Sensing Performance

The 300 kN microcomputer-controlled electronic universal testing machine was used for the research of compressive strain-sensing properties. The size of specimen was 50 mm × 50 mm × 50 mm. The loading speed of the strain-sensing properties was 0.5 mm/min. During the compressive loading, the compressive strain was obtained by the YSV8316 static strain-testing system. The compressive strain and the electrical resistance were collected simultaneously. The curves of compressive strain and the electrical resistance were the strain-sensing curves. The variation rate of the electrical resistance (VRE) was used to characterize the sensitivity of the strain-sensing property. The VRE can be calculated by Equation (2).
V R E = R R 0 R 0
where R is the electrical resistance during loading and R0 is the initial electrical resistance before loading. All the electrical parameters and the strain-sensing properties were carried out by consulting [35,38].

2.5. Scanning Electron Microscope Photos

The samples removed from the inner core of the specimen were used for the measurement of the SEM photos. The samples were sprayed with gold in the vacuum spraying chamber and then moved to the ZEISS Sigma 300/500 Field Emission Scanning Electron Microscope (Wuxi Lingen Electromechanical Equipment Co., Ltd., Wuxi, China) for obtaining SEM images.

3. Results and Discussions

3.1. The Slump Flow of Fresh RPC

The slump flow of fresh RPC with different dosages of NSP is shown in Figure 4. It can be seen that the slump flow of fresh RPC decreased with the addition of NSP. This was ascribed to the fact that the NSP exhibited higher specific surface area than the cement, which can absorb more free water, leading to a decrease in the slump flow of fresh RPC [39]. The values of the error bars were lower than 10% of the slump flow. Therefore, the results of the slump flow was accurate.

3.2. The Mechanical Strengths of RPC with NSP

Figure 5 shows the mechanical strengths of RPC with different dosages of NSP. The mechanical strengths were tested after the specimens were cured for 28 days. As depicted in Figure 5, the flexural and compressive strengths increased with the increasing volume ratios of the NSP. The maximum increasing rates of flexural and compressive strengths by adding 1.2% NSP were 16.1% and 14.2%, respectively. When the volume ratio of NSP increased from 0% to 1.0%, the increasing rates of flexural and compressive strengths were 14.9% and 13.9%. This was attributed to the fact that the NSP can fill the pores inside the RPC; thus, increasing the mechanical strength [12,40]. Moreover, the NSP can restrict the inner cracks in the RPC; thus, improving the mechanical strength. Finally, as shown in Figure 5, the values of the error bars were lower than 0.5% of the mechanical strengths, which ensured the accuracy of the mechanical strengths.

3.3. The Drying Shrinkage Rate of RPC

The drying shrinkage rates of the RPC standard that were cured for 3 days, 7 days, 14 days and 28 days are shown in Figure 6. The drying shrinkage rates increased with the increasing curing ages and decreased with the increasing volume ratio of the NSP. This was due to the fact that the cement hydration increases with the increased curing age [41]. Therefore, the drying shrinkage rates showed an increasing trend with the increasing curing age. Moreover, the addition of the NSP can fill the pores of the RPC and restrict the RPC’s drying shrinkage rate, which results in a decrease in the drying shrinkage rates. The relationship between the drying shrinkage rate and the volume ratio of the NSP conformed to a cubic function. The drying shrinkage rates were decreased by 12.1%–39.8% by mixing with the NSP. The fitting degree of the functions were higher than 0.98, indicating the reasonability of fitting function.

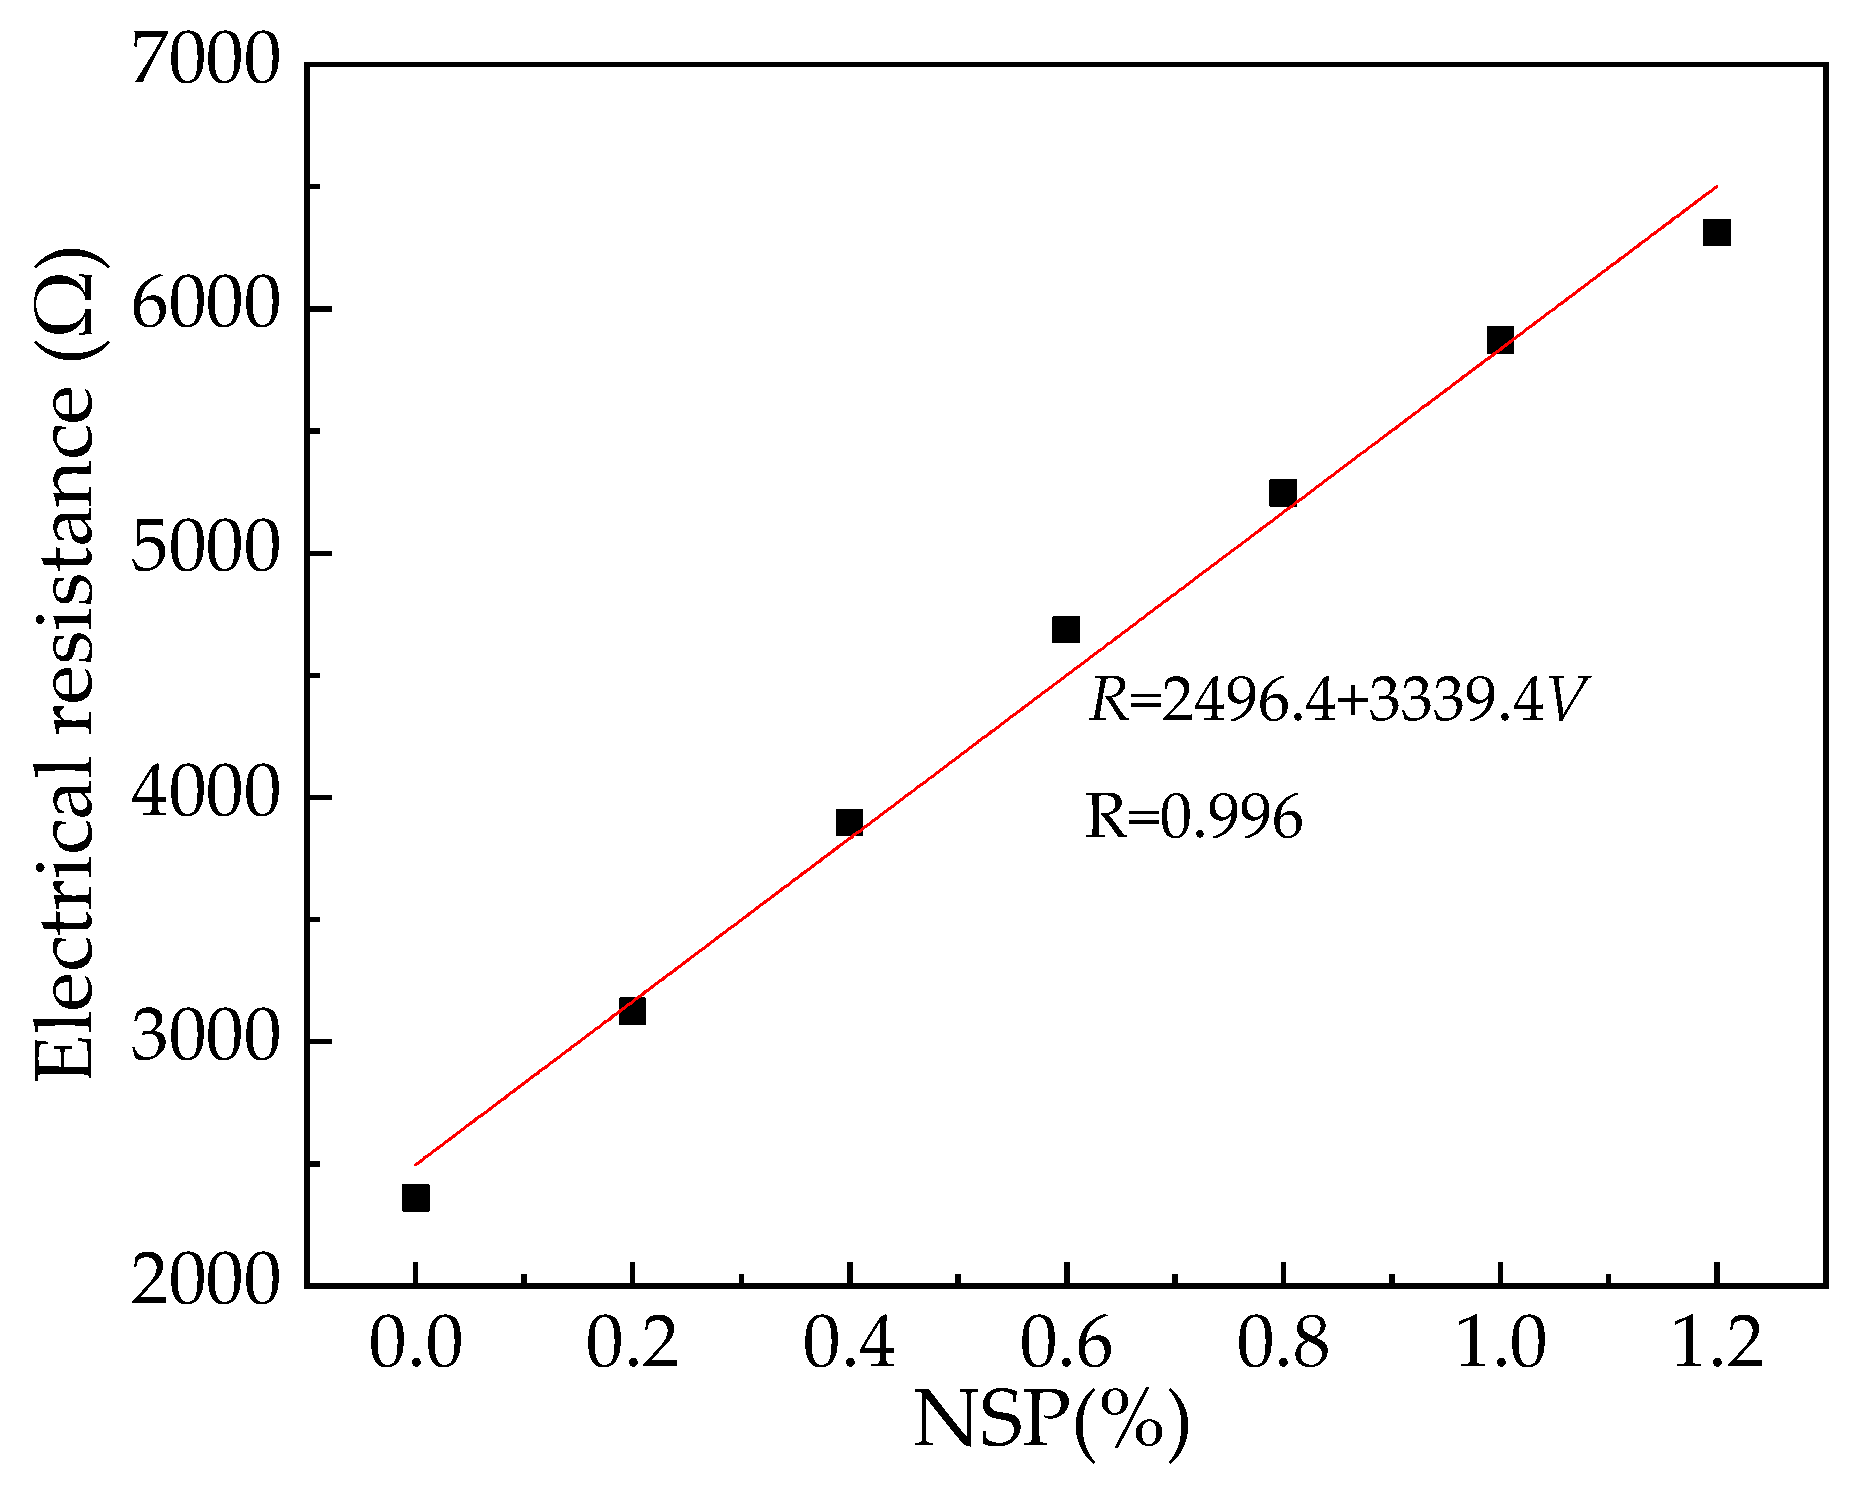
3.4. The Electrical Resistance of RPC

The electrical resistance of RPC with different dosages of NSP is shown in Figure 7. As observed from Figure 7, the electrical resistance of the RPC decreased with the volume ratios of the NSP. The varying function between the electrical resistance and the volume ratios accorded with the cubic function. This can be explained as follows. The conductive path was quite isolated in the RPC with low dosages of NSP. When the volume ratio of the NSP reached a certain level, the conductive network began to connect. Therefore, the electrical resistance reduced significantly with the increasing volume ratio of the NSP. As obtained from Figure 7, the electrical resistance decreased in the form of the cubic function with the volume ratio. This can be ascribed to the fact that the electrical conductivity of conductive cement-based material shows the cubic function with the volume ratio of conductive fillers [42].

3.5. AC Impedance Spectrum

The AC impedance spectrum curves of the RPC are illustrated in Figure 8. In Figure 8, Zr(Ω) and Zi(Ω) represent the AC electrical resistance and electrical reactance of the RPC. The horizontal coordinate values represent the electrical resistance, while the longitudinal coordinates represent the electrical reactance of the RPC. Table 4 shows the fitting results of the relationship between Zi(Ω) and Zr(Ω). In Table 4, a, b,c and R2 are the constant parts and the fitting degree of the quadratic fitting equation. The electrical reactance shows the quadratic function with the volume ratios of the NSP. Moreover, the addition of the NSP was able to reduce the extreme points of the AC impedance spectrum curves, indicating that the NSP could decrease the electrical resistance of the AC impedance spectrum curves.
The equivalent circuits of the RPC obtained by the AC impedance spectrum curves are shown in Figure 9. The equivalent circuit of the RPC consisted of three parallel electrical components, which were the parallel electrical resistance and reactance of pore solution, the RPC matrix and the NSP. The last electrical component was the electrical resistance of the interface electrical resistance between the electrode and the specimen. The Chi of the equivalent circuits was lower than 0.017, showing the rationality of the equivalent circuit diagrams.
The electrical resistance of the pore solution of the RPC with the NSP is shown in Figure 10. The electrical resistance of the pore solution of the RPC increased with the addition of the NSP. This signified that the NSP could decrease the pore volume and the number of the RPC. Therefore, this result confirmed that NSP can enhance the mechanical properties of RPC.

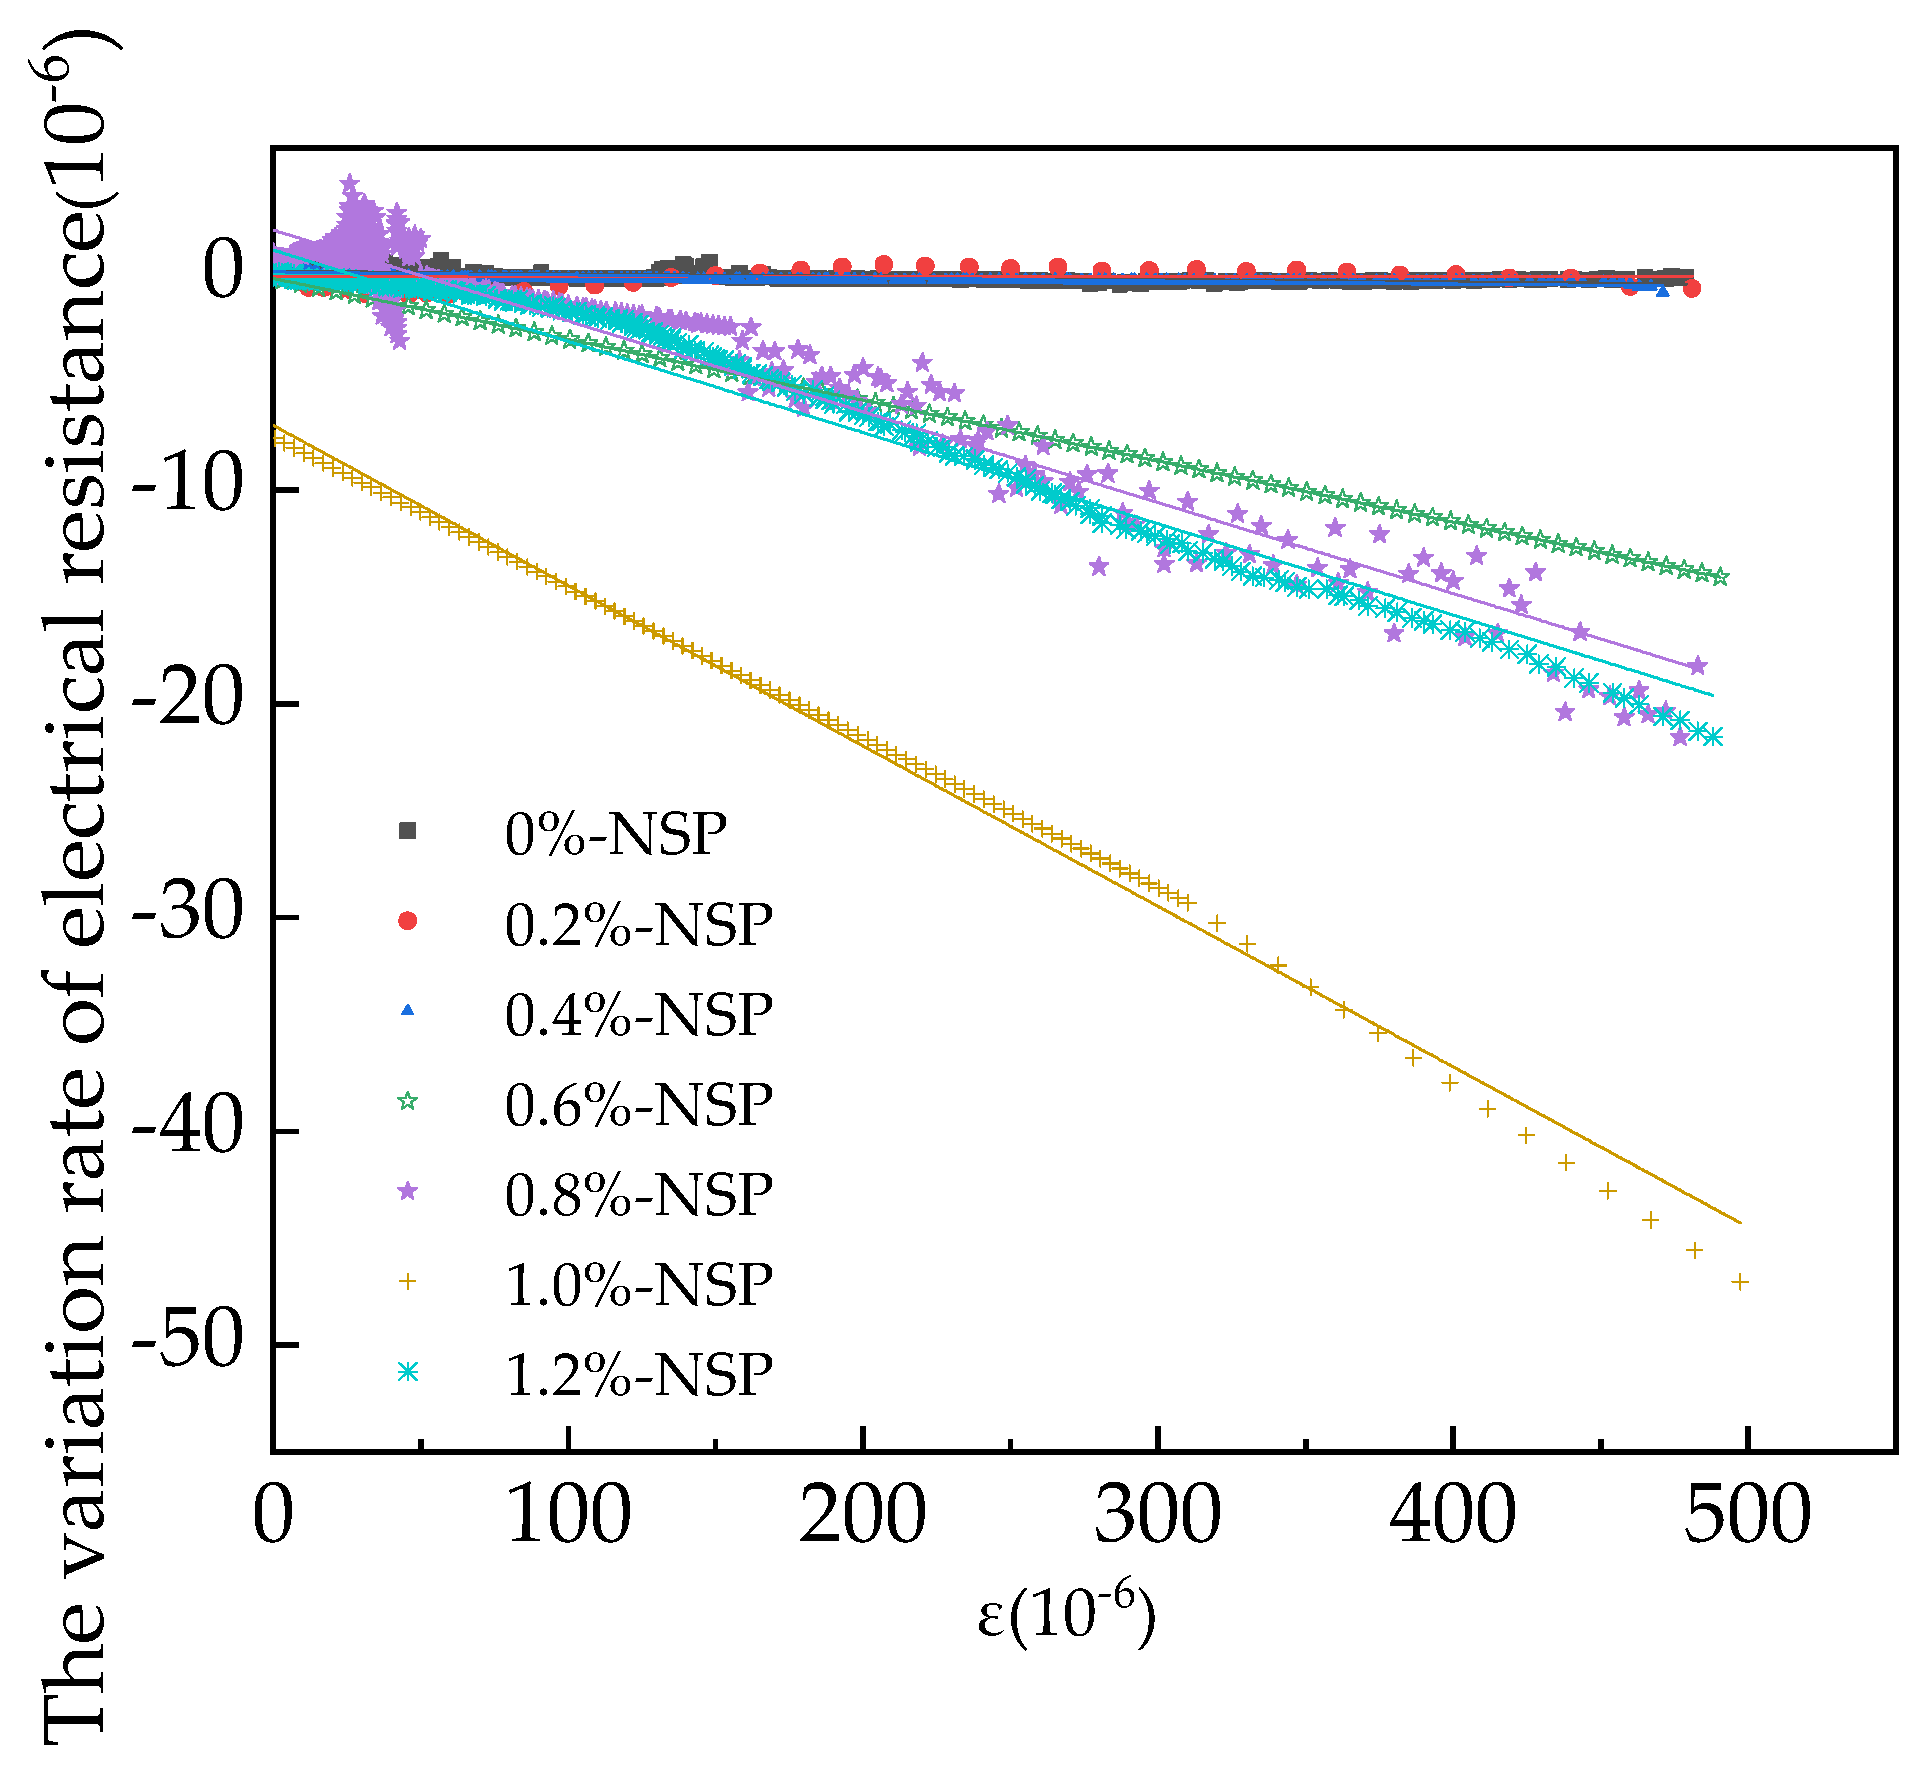
3.6. The Strain-Sensing Properties of RPC
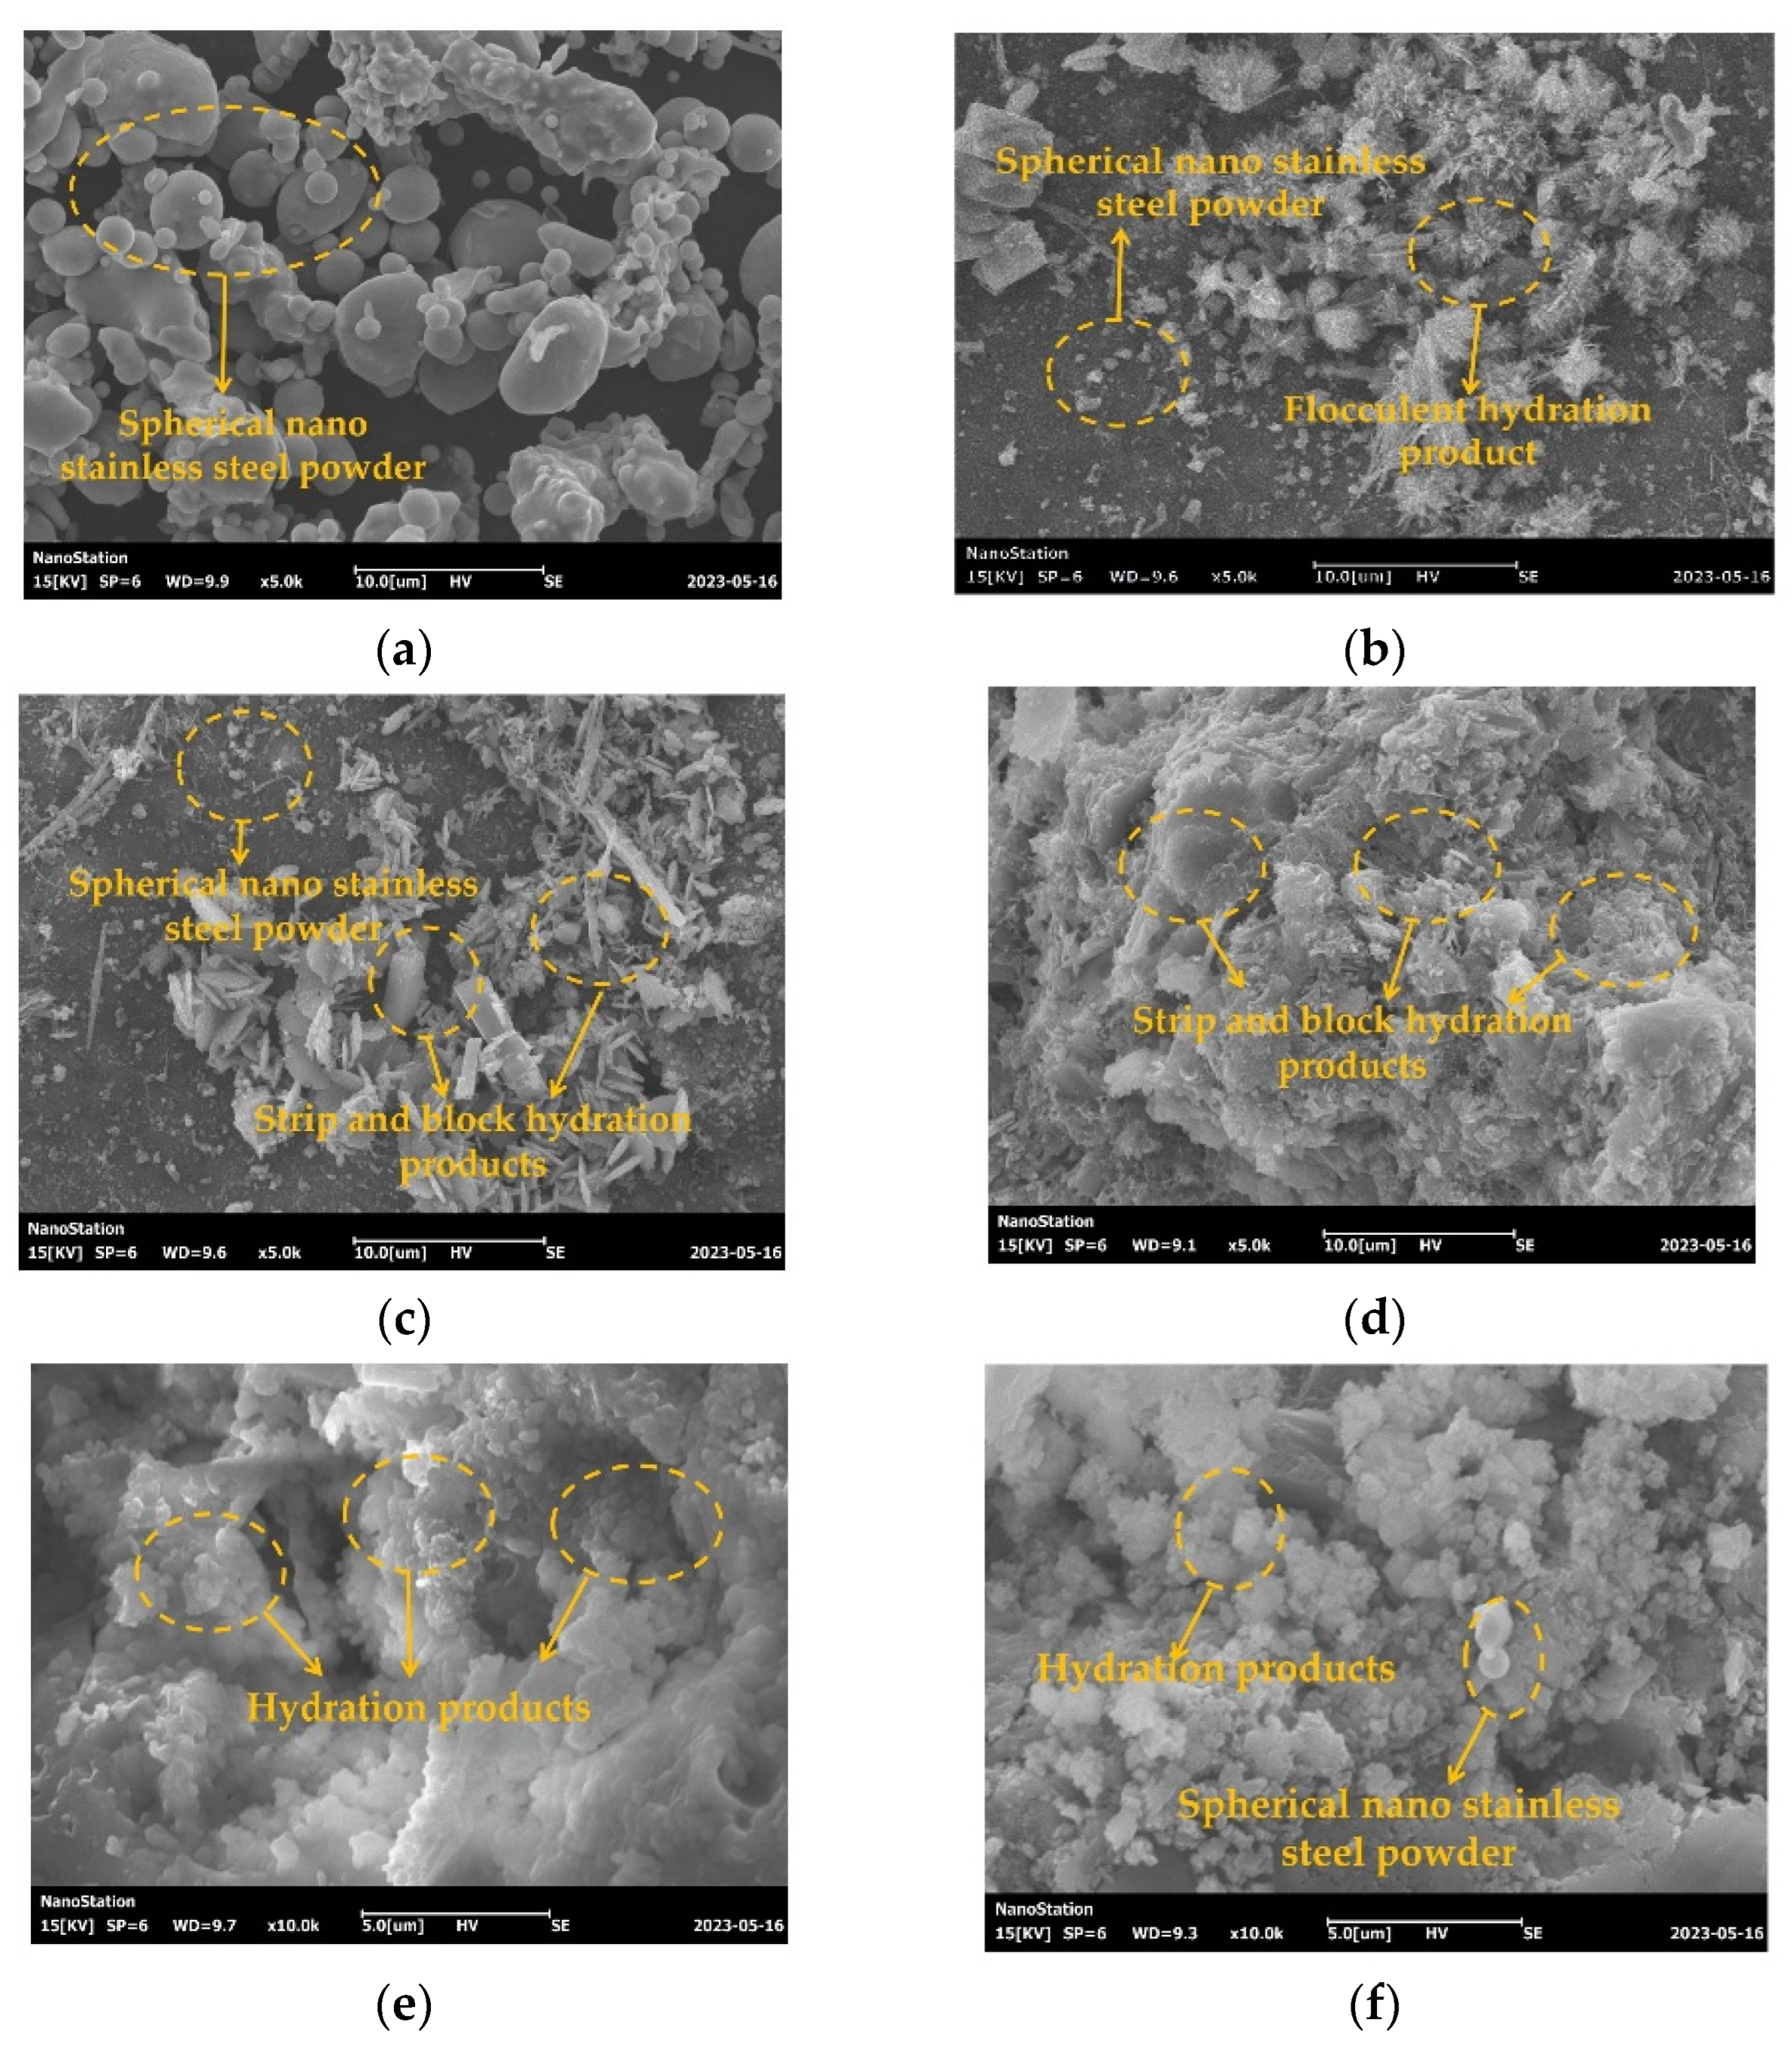
The compressive strain-sensing curves of the RPC are shown in Figure 11. ε is the compressive strain during the compressive loading, whose unit is 10−6. Table 5 is the fitting results between the variation rate of the electrical resistance (△R/R) and the ε. The sensitivity of the strain-sensing properties of the RPC increased with the dosages of NSP increasing from 0% to 1.0%. However, when the volume ratio of NSP was 1.2%, the sensitivity of the strain-sensing properties of the RPC was lower than that of the RPC with 1.0% NSP. The RPC showed obvious strain-sensing performance when the dosages of the NSP reached 0.8% by volume ratio of the RPC. This was ascribed to the fact that when the volume ratio of the NSP was lower than 0.8%, most of the NSP was isolated dispersed in the RPC [43]. No obvious tunnel current was generated during loading. When the dosage of NSP reached 0.8%, the conductive channels gradually formed and the tunnel current was generated. Therefore, the RPC with NSP higher than or equal to 0.8% performed obvious strain-sensing property. Finally, when the volume ratio of the NSP was higher than 1.0%, the contact electrical conductivity was increased by the NSP, leading to a decrease in the sensitivity of the strain-sensing performance.

3.7. The SEM of RPC

The SEM of the NSP and the RPC with NSP is shown in Figure 12. As illustrated in Figure 12a, the spherical stainless steel powder was found. Stainless steel powder with different particle sizes could be observed, which could fill the pores with various diameters. Additionally, the flocculent hydration products were observed in the SEM photos. The strip and block hydration products were discovered. As shown in Figure 12, the addition of NSP could improve the compactness of the RPC, which confirmed the fact that the addition of NSP could help increase the mechanical strength of the RPC.

4. Conclusions

In this study, a high-performance and high-durability self-sensing reactive powder concrete with nano-stainless steel powder was developed. The fluidity of fresh RPC, the mechanical strength and the self-sensing performance were investigated. The conclusions can be summarized as follows:
The addition of NSP was able to decrease the slump flow of the fresh RPC. Moreover, the addition of NSP was able to increase the flexural strength from 0% to 14.2% and increase the compressive strength from 0% to 16.1% with the NSP volume ratio ranging from 0% to 1.2%.
The electrical resistance and the drying shrinkage rate of RPC decreased in the form of the cubic function with the volume ratio of the NSP.
The AC impedance spectrum curves of RPC with NSP were obtained in this study. The electrical resistance conformed to the quadratic function with the NSP volume ratio. The addition of NSP was able to increase the electrical resistance of the pore solution, which confirmed that the NSP could effectively improve the mechanical strength of the RPC by decreasing the volume of the pores inner RPC.
The RPC with NSP showed no strain-sensing property when the NSP was less than 0.8%. The RPC with 1.0% NSP showed the optimal sensitivity of strain-sensing performance. As obtained from the SEM results, the addition of NSP was able to improve the pore structure and reduced porosity; thus, increasing the mechanical strength of the RPC.

Author Contributions

Conceptualization, F.X.; Software, J.Z.; Validation, F.X.; Formal analysis, F.X. and J.Z.; Investigation, F.X., J.Z. and H.W.; Resources, H.W.; Data curation, F.X.; Writing—original draft, F.X.; Writing—review and editing, F.X., R.C., D.Z. and H.W.; Visualization, F.X.; Supervision, H.W.; Project administration, H.W. (Hui Wang); Funding acquisition, X.T. and H.W. All authors have read and agreed to the published version of the manuscript.

Funding

This research was funded by the Natural Science Foundation of Zhejiang Province, China (No. LY22E080005), Ningbo Natural Science Foundation Project (2023J086), and the National Natural Science Foundation of China (52008215).

Institutional Review Board Statement

Not applicable.

Informed Consent Statement

Not applicable.

Data Availability Statement

The data used to support the findings of this study are available upon request.

Conflicts of Interest

The authors declare no conflict of interest.

References

  1. Huang, G.; Wang, H.; Shi, F. Coupling Effect of Salt Freeze-Thaw Cycles and Carbonation on the Mechanical Performance of Quick Hardening Sulphoaluminate Cement-Based Reactive Powder Concrete with Basalt Fibers. Coatings 2021, 11, 1142. [Google Scholar] [CrossRef]
  2. Cai, Z.; Wang, H. Research on the mechanical performance and NaCl freeze-thaw resistance of reactive powder concrete with assembly unit of sulphoaluminate cement and ordinart Portland cement. Coatings 2021, 11, 1238. [Google Scholar] [CrossRef]
  3. Cui, L.; Wang, H. Influence of Waste Fly Ash on the Rheological Properties of Fresh Cement Paste and the Following Electrical Performances and Mechanical Strengths of Hardened Specimens. Coatings 2021, 11, 1558. [Google Scholar] [CrossRef]
  4. Khan, R.I.; Ashraf, W.; Olek, J. Amino acids as performance-controlling additives in carbonation-activated cementitious materials. Cem. Concr. Res. 2021, 147, 106501. [Google Scholar] [CrossRef]
  5. Jiang, W.; Shen, X.; Xia, J.; Mao, L.; Yang, J.; Liu, Q. A numerical study on chloride diffusion in freeze-thaw affected concrete. Constr. Build. Mater. 2018, 179, 553–565. [Google Scholar] [CrossRef]
  6. Wang, Y.; Ye, J.; Liu, Y.; Qiang, X.; Feng, L. Influence of freeze–thaw cycles on properties of asphalt-modified epoxy repair materials. Constr. Build. Mater. 2013, 41, 580–585. [Google Scholar] [CrossRef]
  7. AL-Ameeri, A.S.; ImranRafifiq, M.; Tsioulou, O.; Rybdylova, O. Impact of climate change on the carbonation in concrete due to carbon dioxide ingress: Experimental investigation and modelling. J. Build. Eng. 2021, 44, 102594. [Google Scholar] [CrossRef]
  8. Cao, Z.; Lu, F.; Qiu, P.; Yang, F.; Liu, G.; Wang, S.; Zhong, H. Formation of a hydrophobic and corrosion resistant coating on manganese surface via stearic acid and oleic acid diethanolamide. Colloids Surf. A 2018, 555, 372–380. [Google Scholar] [CrossRef]
  9. Hong, X.; Wang, H.; Shi, F. Influence of NaCl freeze thaw cycles and cyclic loading on the mechanical performance and permeability of sulphoaluminate cement reactive powder concrete. Coatings 2020, 10, 1227. [Google Scholar] [CrossRef]
  10. Du, Y.; Hao, W.; Shi, F.; Wang, H.; Xu, F.; Du, T. Investigations of the Mechanical Properties and Durability of Reactive Powder Concrete Containing Waste Fly Ash. Buildings 2022, 12, 560. [Google Scholar] [CrossRef]
  11. Wang, H.; Shen, J.; Liu, J.; Lu, S.; He, G. Influence of carbon nanofiber content and sodium chloride solution on the stability of resistance and the following self-sensing performance of carbon nanofiber cement paste. Case Stud. Constr. Mater. 2019, 11, e00247. [Google Scholar] [CrossRef]
  12. Wang, H.; Shi, F.; Shen, J.; Zhang, A.; Zhang, L.; Huang, H.; Liu, J.; Jin, K.; Feng, L.; Tang, Z. Research on the self-sensing and mechanical properties of aligned stainless steel fifiber reinforced reactive powder concrete. Cem. Concr. Compos. 2021, 119, 104001. [Google Scholar] [CrossRef]
  13. Dong, S.; Han, B.; Ou, J.; Li, Z.; Han, L.; Yu, X.; Li, Z.; Han, L.; Yu, X. Electrically conductive behaviors and mechanisms of short-cut super-fine stainless wire reinforced reactive powder concrete. Cem. Concr. Compos. 2016, 72, 48–65. [Google Scholar] [CrossRef]
  14. Zhang, W.F.; Gu, X.W.; Qiu, J.P.; Liu, J.P.; Zhao, Y.Q.; Li, X.H. Effects of iron ore tailings on the compressive strength and permeability of ultra-high performance concrete. Constr. Build. Mater. 2020, 260, 119917. [Google Scholar] [CrossRef]
  15. Ju, Y.; Zhao, J.; Wang, D.; Song, Y. Experimental study on flexural behaviour of reinforced reactive powder concrete pole. Constr. Build. Mater. 2021, 312, 125399. [Google Scholar] [CrossRef]
  16. Rajasekar, A.; Arunachalam, K.; Kottaisamy, M. Durability of ultra-high strength concrete with waste granite sand as partial substitute for aggregate. J. Comput. Theor. Nanosci. 2018, 15, 446–452. [Google Scholar] [CrossRef]
  17. Shen, W.G.; Liu, Y.; Cao, L.G.; Huo, X.J.; Yang, Z.G.; Zhou, C.C.; He, P.T.; Lu, Z.L. Mixing design and microstructure of ultra-high strength concrete with manufactured sand. Constr. Build. Mater. 2017, 143, 312–321. [Google Scholar] [CrossRef]
  18. Shan, B.; Lai, D.D.; Xiao, Y.; Luo, X.B. Experimental research on concrete-filled RPC tubes under axial compression load. Eng. Struct. 2018, 155, 358–370. [Google Scholar] [CrossRef]
  19. Yoo, D.Y.; Banthia, N.; Lee, J.Y.; Yoon, Y.S. Effect of fiber geometric property on rate dependent flexural behavior of ultra-high-performance cementitious composite. Cem. Concr. Compos. 2018, 86, 57–71. [Google Scholar] [CrossRef]
  20. Tan, C.J.; Zhang, Y.F.; Zhao, H.; Zhang, B.; Du, T. Study on Shear-Lag Effect of Steel–UHPC Ribbed Slab Composite Structures Using Bar Simulation Method. Buildings 2022, 12, 1884. [Google Scholar] [CrossRef]
  21. Wang, H.; Liu, X.; Yue, Q.; Wang, N.; Zheng, M.Z. Longitudinal shear behavior and design method of UHPC connection for prefabricated slabs in composite beams. Eng. Struct. 2023, 277, 115386. [Google Scholar] [CrossRef]
  22. Zhang, Y.; Li, X.L.; Zhu, Y.P.; Shao, X.D. Experimental study on flexural behavior of damaged reinforced concrete (RC) beam strengthened by toughness-improved ultra-high performance concrete (UHPC) layer. Compos. Part B 2020, 186, 107834. [Google Scholar] [CrossRef]
  23. Mishra, O.; Singh, S.P. An overview of microstructural and material properties of ultra-high-performance concrete. J. Sustain. Cem.-Based 2019, 8, 97–143. [Google Scholar] [CrossRef]
  24. Liang, R.; Zhu, C. Study on basic mechanical properties of hybrid fiber recycled concrete for rapid pavement repair. Jilin Water Resour. 2021, 6, 38–41. [Google Scholar]
  25. Liu, H.; Liu, K.; Mardirossian, A.; Heider, D. Carbon nanotube-based structural health monitoring for fiber reinforced composite materials. Nondestruct. Charact. Monit. Adv. Mater. 2017, 10169, 129–138. [Google Scholar]
  26. Christian, S.; Omid, S.D.; Lisa, M.F.; Hubert, Z. Piezocapacitive sensing for structural health monitoring in adhesive joints. In Proceedings of the 2019 IEEE International Instrumentation and Measurement Technology Conference (I2MTC), Auckland, New Zealand, 20–23 May 2019. [Google Scholar]
  27. Li, X.D.; Li, X.; Liu, T.; Lu, Y.; Shang, C.S.; Ding, X.K. Wearable, washable, and highly sensitive piezoresistive pressure sensor based on a 3D sponge network for real-time monitoring human body activities. ACS Appl. Mater. Interfaces 2021, 13, 46848–46857. [Google Scholar] [CrossRef]
  28. Dong, S.F.; Li, L.W.; Ashour, A.; Dong, X.F.; Han, B.G. Self-assembled 0D/2D nano carbon materials engineered smart and multifunctional cement-based composites. Constr. Build. Mater. 2021, 272, 121632. [Google Scholar] [CrossRef]
  29. Le, J.L.; Du, H.J.; Shi, D.B. Use of 2D Graphene Nanoplatelets (GNP) in cement composites for structural health evaluation. Compos. B Eng. 2014, 67, 555–563. [Google Scholar] [CrossRef]
  30. Kaleb, B.; Sagar, D.; Amit, C. Estimating ground reaction force with novel carbon nanotube-based textile insole pressure sensors. Wearable Technol. 2023, 4, e8. [Google Scholar]
  31. Omid, S.D.; Mohammadreza, F.; Alireza, A.; Majid, B. Impedance analysis for condition monitoring of single lap CNT-epoxy adhesive joint. Int. J. Adhes. Adhes. 2019, 88, 59–65. [Google Scholar]
  32. Wang, H.; Gao, X.; Liu, J. Effects of salt freeze-thaw cycles and cyclic loading on the piezoresistive properties of carbon nano-fibers mortar. Constr. Build. Mater. 2018, 177, 192–201. [Google Scholar] [CrossRef]
  33. Wang, H.; Gao, X.; Liu, J. Coupling effect of salt freeze-thaw cycles and cyclic loading on performance degradation of carbon nanofiber mortar. Cold Reg. Sci. Technol. 2018, 154, 95–102. [Google Scholar] [CrossRef]
  34. Cao, H.; Liang, Z.; Peng, X.; Cai, X.; Wang, K.; Wang, H.; Lyu, Z. Research of Carbon Dioxide Curing on the Properties of Reactive Powder Concrete with Assembly Unit of Sulphoaluminate Cement and Ordinary Portland Cement. Coatings 2022, 12, 209. [Google Scholar] [CrossRef]
  35. Wang, H.; Jin, K.; Zhang, A.; Zhang, L.; Han, Y.; Liu, J.; Shi, F.; Feng, L. External erosion of sodium chloride on the degradation of self-sensing and mechanical properties of aligned stainless steel fiber reinforced reactive powder concrete. Constr. Build. Mater. 2021, 287, 123028. [Google Scholar] [CrossRef]
  36. GB/T2419-2005; Test Method for Fluidity of Cement Mortar. The State Bureau of Quality and Technical Supervision: Beijing, China, 2005.
  37. GB/T17671-1999; Method of Testing Cements-Determination of Strength. The State Bureau of Quality and Technical Supervision: Beijing, China, 1999.
  38. Zhou, R.; Jin, Y. Study on Mechanical Properties of Concrete with Different Steel Fiber Content. Int. J. Multiphys. 2021, 15, 87–99. [Google Scholar]
  39. Wu, Z.; Shi, C.; He, W.; Wu, L. Effects of steel fiber content and shape on mechanical properties of ultra high performance concrete. Constr. Build. Mater. 2016, 103, 8–14. [Google Scholar] [CrossRef]
  40. Wang, H.; Gao, X.; Liu, J.; Ren, M.; Lu, A. Multi-functional properties of carbon nanofiber reinforced reactive powder concrete. Constr. Build. Mater. 2018, 187, 699–707. [Google Scholar] [CrossRef]
  41. Aghaee, K.; Farzadnia, N.; Khayat, K. Coupled effect of expansive agent and curing on mechanical and shrinkage properties of fiber-reinforced Eco-Crete. Constr. Build. Mater. 2021, 310, 125285. [Google Scholar] [CrossRef]
  42. Wang, H.; Cai, X.; Rao, C.; Wang, J. Mechanical and Electrical Properties of Rapid-Strength Reactive Powder Concrete with Assembly Unit of Sulphoaluminate Cement and Ordinary Portland Cement. Materials 2022, 15, 3371. [Google Scholar] [CrossRef]
  43. Han, B.; Zhang, L.; Zhang, C.; Wang, Y.; Yu, X.; Ou, J. Reinforcement effect and mechanism of carbon fibers tomechanical and electrically conductive properties of cement-based materials. Constr. Build. Mater. 2016, 125, 479–489. [Google Scholar] [CrossRef]
Figure 1. The mechanical strengths of RPC with NSP. (a) The flexural strength (b) The compressive strength.
Coatings 13 01153 g001
Figure 2. The measurement of the dry shrinkage rate.
Coatings 13 01153 g002
Figure 3. The equipment of electrical parameters. (a) Measurement of electrical resistance (b) Measurement of AC impedance spectrum.
Coatings 13 01153 g003
Figure 4. The slump flow of fresh RPC.
Coatings 13 01153 g004
Figure 5. The mechanical strengths of RPC with NSP.
Coatings 13 01153 g005
Figure 6. The drying shrinkage rate of RPC with NSP.
Coatings 13 01153 g006
Figure 7. The electrical resistance of RPC with NSP.
Coatings 13 01153 g007
Figure 8. The AC impedance spectrum of RPC with NSP.
Coatings 13 01153 g008
Figure 9. The AC impedance spectrum of the RPC with NSP.
Coatings 13 01153 g009
Figure 10. The electrical resistance of pore solution inner RPC.
Coatings 13 01153 g010
Figure 11. The strain−sensing property of RPC with NSP.
Coatings 13 01153 g011
Figure 12. The SEM photos of NSP and RPC with NSP. (a) The NSP (b) The RPC with 0% NSP (c) The RPC with 0.2% NSP (d) The RPC with 0.4% NSP (e) The RPC with 1.0% NSP (f) The RPC with 1.2% NSP.
Coatings 13 01153 g012
Table 1. The chemical compositions of raw materials (%).
Type
Compositions
SiO2Al2O3FexOyMgOCaOSO3K2ONa2OTi2OFeNiLoss on Ignition
OPC21.15.33.81.862.32.8-----2.9
BFS33.815.00.39.635.70.33.6-----
Sand99.6-0.02---------
SF97.60.20.20.20.401.4-----
NSP00000000099.950.05-
Table 2. Particle passing percentage of raw materials (%).
Particle Size (%)0.3 μm0.6 μm1 μm4 μm8 μm64 μm360 μm
Types
OPC00.53.114.533.292.1100
BFS0.050.133.318.634.397.2100
Sand0.020.030.040.050.0619.8100
SF35.259.183.695.799.399.5100
NSP00.432.413.227.687.6100
Table 3. Mixture design of RPC per one cubic meter (kg).
WaterOPCSFGGBSQuartz Sand NSPWater-Reducer
244.4740.7370.3111.1977.9016.3
244.4740.7277.7111.1977.915.716.3
244.4740.7185.2111.1977.931.416.3
244.4740.792.6111.1977.947.116.3
244.4740.70111.1977.962.816.3
244.4740.70111.1977.978.516.3
244.4740.70111.1977.994.216.3
Table 4. The fitting results between the real and imaginary parts of the AC impedance spectrum.
EquationTypesabcR2
Z i = a Z r 2 + b Z r + c 1.0%NSP1,720,182.95−158.850.0040.99
0% NSP300,673.39−75.020.002160.99
1.2% NSP−31,174.88−23.266.47 × 10−40.99
0.2% NSP−25,499.32−46.090.0010.99
0.4% NSP829,947.91−87.270.0010.99
0.6% NSP1,937,829.91−89.179.92 × 10−40.99
0.8% NSP1,150,300.24−53.715.84 × 10−40.99
Table 5. The fitting results between the variation rate of electrical resistance (ΔR/R) and the compressive strain (ε).
Equation TypesabR2
Δ R R = a ε + b 1.0%NSP−0.00130.230.91
0% NSP−0.0000011−7.86 × 10−70.86
1.2% NSP−0.00140.200.88
0.2% NSP−0.028−0.110.93
0.4% NSP−0.0422.150.94
0.6% NSP−0.075−6.980.92
0.8% NSP−0.0431.220.89
Disclaimer/Publisher’s Note: The statements, opinions and data contained in all publications are solely those of the individual author(s) and contributor(s) and not of MDPI and/or the editor(s). MDPI and/or the editor(s) disclaim responsibility for any injury to people or property resulting from any ideas, methods, instructions or products referred to in the content.

