Abstract
We investigate the corrosion behavior on the microstructure of CoCrFeMnNi high-entropy thin film potentiodynamic alloys electrodeposited on aluminum support. Using electrolytes based on dimethyformamide (DMF), (HCON(CH₃)₂), dimethylsulfoxide (DMSO, (CH3)2SO), an acetonitrile (AN, CH3CN) organic system (4:1 vol. ratio), LiClO4 in different concentrations and CoCl2, CrCl3 × 6H2O, FeCl2 × 4H2O, MnCl2 × 4H2O and NiCl2 × 6H2O in different conditions, the HEA components were co-deposited on an aluminum foil substrate. Using the CALPHAD method and the MatCalc PC software, the structure of the HEA system under study was investigated by calculating the characteristic kinetic and thermodynamic criteria. The influence of each metal from HEA inside the solid solution zone and over the formation of the solid solution phase were obtained from the ratio between the derived parameters. The electrochemical measurements, which demonstrate that on an aluminum support the HEA thin films have lower corrosion resistance, were performed at ambient temperature in an aerated artificial solution. Scanning electron microscopy (SEM) and atomic force microscopy (AFM) were used to investigate the microstructure of HEA thin films before and after corrosion in artificial seawater. This complex study demonstrates that the electrodeposition of HEA thin films on an aluminum support is more difficult and that the resistance to corrosion is much lower compared to that in the previous work on HEA deposits on a copper support.
1. Introduction
Due to their simple crystal structures and extraordinary properties such as high strength, anti-corrosion and excellent magneto-electric capability, high-entropy alloys (HEA) of five or more principal elements in different ratios are potentially suitable for many applications [1,2,3,4,5,6,7].
The basic principle behind HEAs is that significantly high mixing entropies of solid-solution (SS) phases enhance their stability compared to those of intermetallic compounds, especially at high temperatures.
The processes and compositional combinations for the production of HEA are numerous. The microstructure and properties of each HEA are different, which complicates and greatly limits the research work [8]. High-entropy alloys are usually prepared using physical methods such as arc melting and magnetron sputtering [9,10]. However, the methods require special equipment and the cost is very high. One of the most efficient methods for the growth of metal particles/nanoparticles is electrochemical deposition (ECD) [11,12]. This is a powerful technique for the deposition of many metals and it allows the easy control of the nucleation and growth of metal nanoparticles with different shapes and sizes [13]. The production process is simple and the composition can be adjusted by changing the ECD parameters when HEA is prepared by this method. Electrodeposition exhibits a series of advantages, such as reducing raw material and energy consumption, low-temperature processing, a short synthesis duration, simplified equipment design, and a high potential of technological scalability, are the big advantages of ECD [14,15,16]. Thin film refers to a layer of materials ranging from several atomic layers to several micrometers thick and thick film from tens of micrometers to millimeters and it represents a part of surface engineering. Most conventional coatings are still confined to binary, ternary, or quaternary compositions so HEA is most suitable for thin film coatings [17]. As there are few works known so far in the scientific literature, obtaining high-entropy alloy thin films via electrochemical synthesis still remains a pioneering effort. Non-aqueous solvents are used for the electrodeposition of metal alloys due to their good thermal and chemical stability. The solvent being non-aqueous does not release hydrogen and therefore the deposition will not be porous [18]. Thin films of NdFeCoNiMn were successfully obtained via electrodeposition at room temperature in DMF-AN organic system [19]. By changing the electrodeposition parameters, the style and morphology of the thin films were proven to be controlled, the films became more compact with a longer deposition time and uniform particles with a triangular cone shape were shown via SEM. The recent research and development of HEA films and coatings discussed preparation technologies, microstructures, and design criteria for achieving excellent properties. Finally, the suggested future research work for the HEA films and coatings is outlined [20]. Our group has conducted a lot of work to prepare CoCrCuFeMnNi and AlCrCuFeNi HEA thin films on copper support via ECD in organic media based on DMF/DMSO and AN [18,21,22,23]. A promising potential for application as anti-corrosive HEA coatings was achieved after the corrosion study conducted in artificial seawater.
Some new research about AlCoCrFeNi multicomponent alloy obtained via ECD in a DMF-AN electrolyte on a Cu substrate shows that the corrosion properties of the thin films in a 3.5 wt. % NaCl solution were better than those of the copper substrate [24]. Taking into account all of this research, we asked ourself the question of whether or not the non-aqueous ECD of HEA can be better performed on an aluminum support than on a copper one.
In this work, we continue our investigations [22,23] of the electrodeposition of CoCrFeMnNi but using an aluminum support and looking for superior corrosion resistance. The modeling along was carried along with establishing the thermodynamic and kinetic criteria using the CALPHAD method. We followed the behavior of the alloys obtained on an Al support during corrosion in synthetic seawater, and corroborated the microstructure of the samples and of the aluminum support.
2. Materials and Methods
2.1. Obtaining of HEA Thin Film
The HEA thin films were electrodeposited from a non-aqueous organic electrolyte based on dimethyformamide (DMF), HCON(CH₃)₂, or dimethyldi-methylsulfoxide (DMSO), (CH3)2SO and acetonitrile (AN), CH3CN, and 4:1 (by volume) system containing LiClO4 and CoCl2, CrCl3 × 6H2O, FeCl2 × 4H2O, MnCl2 × 4H2O and NiCl2 × 6H2O in concentrations of 0.01 mol·L−1, which is similar to the solution composition in the previous study [20]. We performed the electrode positioning of HEA thin films on Al foil substrates (thickness of 1 mm) at room temperature (295 K) using a potentiostat-galvanostat electrochemical workstation, PAR263A (Princeton Applied Research, Oak Ridge, TN, USA) [22].
All the solutions were prepared using commercially available P.A. reagents from Sigma Aldrich (Sigma Aldrich Inc., St. Louis, MO, USA). Abrasive paper of various granulations was used to prepare the Al support for electrodeposition.
After that, the samples were cleaned ultrasonically in C2H5OH for 10 min, then etched in a 4M HNO3 solution, rinsed with distilled water and finally immediately placed in the electrodeposition bath in order to prevent the rapid oxidation of aluminum. For this study we used four samples, notably A1, A2, A3, A4, obtained under the conditions presented in Table 1.

Table 1.
Chemical composition of the electrolytes and conditions of deposition for the four specimens used.
Looking for an Al support with superior corrosion resistance of, we studied the composition of pentavalent HEA alloy thin films, of the CoCrFeMnNi kind, in order to continue our previous studies [22,23]. For this purpose, we varied the time, temperature and deposition potential (fixed/variable) of these HEA alloys.
2.2. Modeling Kinetic and Thermodynamic Criteria Calculation
High-entropy alloys have a complex internal structure, so it is suggested to use modeling instruments to obtain the characteristics needed in corrosion media.
MatCalc Pro edition software, version 6.02 (MatCalc Engineering GmbH, Vienna, Austria), was used to obtain thermodynamic data and got kinetic simulation calculation. Criteria simulation was performed by means of the multi-objective module from MATLAB software (MathWorks, Natick, MA, USA, version R2019a). The CALPHAD (Calculation of Phase Diagrams) method, which allows relevant thermodynamic calculations (Gibs free energy, equilibrium calculus, kinetics of the deposition mode, as well as microstructure simulations) for multicomponent systems, was used to model the structure of the studied HEA films. In order to analyze the SS redistribution process during solidification, we simulated the variation of the available phase’s proportions. Using kinetic and thermodynamic criteria [25] and the equations presented in our previous paper [23], we could identify the most appropriate HEA composition.
2.3. Corrosion Behavior
In our previous paper [23], we presented the corrosion tests and the electrochemical cell used. The working temperature was room temperature and the corrosive medium was synthetic seawater. Impedance experiments were performed at open-circuit potential to the frequency range from 100,000 to 0.04 Hz with an AC wave of ±10 mV (peak-to-peak) and the impedance measurements were performed at a rate of 10 points per decade amend in frequency.
2.4. Surface Characterization of the Alloys
Using a Quanta 3D (SEM, Quanta, Hillsboro, OR, USA) field emission scanning electron microscope (SEM) equipped with an energy dispersive X-ray spectrometer (EDS) (FEI Company, Hillsboro, OR, USA) (gallium ion source), as presented in our previous investigation [21], we evaluated the morphology and chemical composition of the HEA alloy thin films under study.
Atomic force microscopy (AFM) (Park Systems Corp., Suwon, Republic of Korea) was performed using an XE-100 microscope from Park Systems (Park Systems Corp., Suwon, Republic of Korea). All AFM scans were performed in non-contact mode with NCHR sharp tips from Nanosensors™ (Neuchatel, Switzerland), with a tip radius of less than 8 nm, ~125 μm length, ~30 μm width and ~42 N/m spring constant, and ~330 kHz resonance frequency. AFM images were recorded at the scale of (5 × 5)μm2.. For processing the AFM images, display purposes (1st order tilt correction), roughness evaluation, determining the root means square roughness (Rq) and peak-to-valley (Rpv), we used the image processing program XEI-v.1.8.0 (Park Systems Corp., Suwon, Republic of Korea).
3. Results and Discussion
3.1. Modeling
The kinetic and thermodynamic criteria of the HEA system under consideration were determined in order to obtain the best composition and to be able to identify all the components of the HEA alloy (Figure 1).
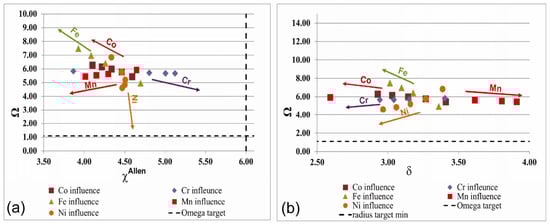
Figure 1.
The influence of the proportion of constituents on the ratio between (a) Ω and χAllen; (b) Ω and δ.
The constituent elements were obtained using following the above criteria and HEA structure.
The ratio between the derived parameters omega, Ω, and Allen electronegativity, χAllen, are presented in Figure 1a. Ni and Mn have a positive effect on the formation of the SS, while Fe, Co and Cr lead the alloy outside the optimal domain.
The derived parameter omega, Ω, with the atomic radius difference, δ, is presented in Figure 1b. It was determined that Ni and Co are favorable for the formation of the SS phase.
The influence of the density on the variation in the parameter Λ with the density is presented in Figure 2a.
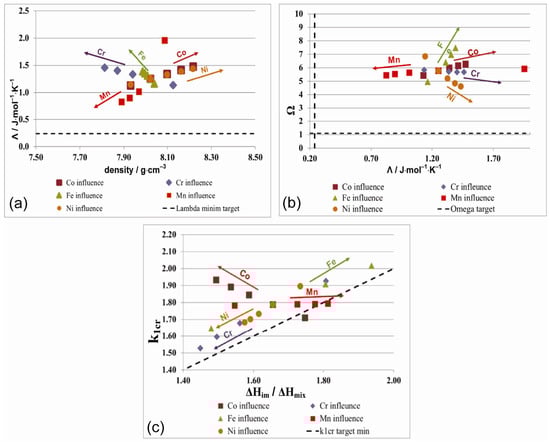
Figure 2.
The influence of the proportion of constituents on the ratio between (a) Λ vs. density, (b) Ω vs. Λ, (c) k1cr vs. ΔHim/ΔHmix.
The variation of the parameter Λ with the density is presented in Figure 2a. The concentration of the SS phases increases with increasing Co, Ni and Cr content. The density of the HEA alloy increases as well with the Co and Ni content. On the other hand, Fe and Mn leads to the exit of the alloy from the SS zone.
Figure 2b presents the ratio between the derived parameters omega, Ω, and lambda. As can be observed, Fe, and Co have a positive effect on the structure of the alloy, while Mn has a negative effect on the formation of SS. Figure 2c shows the ratio between the derived factor k1cr (selective factor-indicates the presence of a significant amount of intermetallic compounds in the alloy) and (ΔHim/ΔHmix; enthalpy of formation of intermetallic compounds respectively the enthalpy of mixing) which indicates the influence of individual metals on the composition of the alloy
The difference in the atomic radius can also be reduced by increasing the Fe content in the alloy, which facilitates the formation of SS.
The echilibrium diagrams of the CoCrFeMnNi electrodeposited on Al are presented in Figure 3.
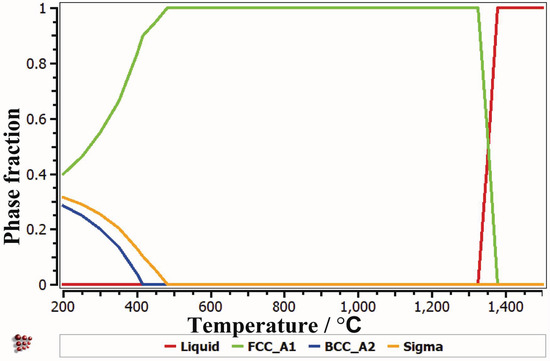
Figure 3.
Equilibrium diagrams for the CoCrFeMnN deposited on Al support.
3.2. Corrosion of HEA Alloys
Using the following electrochemical techniques: open circuit potential (OCP), linear polarization resistance (LPR), potentiodynamic polarization tests (Tafel plots) and EIS, we test the corrosion behavior of HEA thin films on Al support in artificial seawater [26]. Figure 4 presents the polarization curves for the samples of Al and Al covered with HEA thin films. For the samples A1 and A3, Figure 4 indicates a lower current density from the cathodic and anodic polarization curves in the presence of protective films, which cannot be said about samples A2 and A4. This behavior assumes that some films had small defects or larger pores that allowed the aggressive agent, the Cl– ion, to penetrate the thin film, reach the substrate of the aluminum electrode and initiate the corrosion process. In these conditions, we can say that some HEA thin films did not have a protective effect throughout the corrosion process.
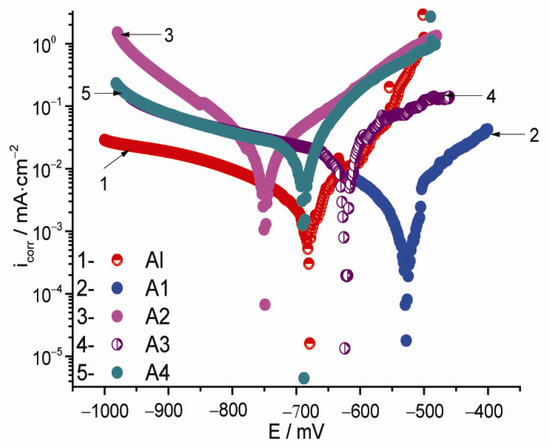
Figure 4.
Polarization Tafel curves of the Al support along with the studied HEA samples.
Corrosion parameters (polarization resistance, corrosion potential (Ecorr), corrosion current density (icorr), polarization resistance (Rp), Tafel slopes (bc, ba), corrosion speed (R), penetration index (P) and efficiency (E)) were calculated from Tafel curves and are presented in Table 2. Analyzing those parameters, one can see the differences from the Al substrate and the HEA thin films deposited. Observing the polarization curves, it is found that the deposition of thin HEA films from sample A1 represented the best protection, having a beneficial influence on the cathodic and anodic reactions of the electrochemical corrosion process. Thus, we can conclude that the deposits on sample A1 prevent the attack of chlorine ions. Sample A3 had a weaker influence on the electrochemical processes and samples A2 and A4 did not have a satisfactory protective effect, which makes us assume that these films had small defects in the protective films or were too thin, which means that these films were not sufficiently resistant on the aluminum surface and determined the migration of aggressive ions through the barrier film. We can conclude that only sample A1 has an acceptable corrosion resistance in artificial seawater, but even this sample has a lower corrosion resistance compared to the same sample electrodeposited on copper support [20,21]. The protective effect of HEA films deposited on the aluminum substrate, the study of corrosion mechanisms and the adsorption phenomena of HEA films electrodeposited on the surface of aluminum electrodes in an aggressive environment such as seawater were investigated also via electrochemical impedance spectroscopy (EIS). The experimental data show the electrochemical properties of the HEA protective thin films at the electrode/electrolyte interface. The Nyquist diagrams for the aluminum electrode covered and not covered with HEA thin films in seawater as a corrosive medium are shown in Figure 5.
Table 2.
Kinetic corrosion parameters obtained in synthetic artificial seawater at room temperature, for the Al support and studied HEA samples.
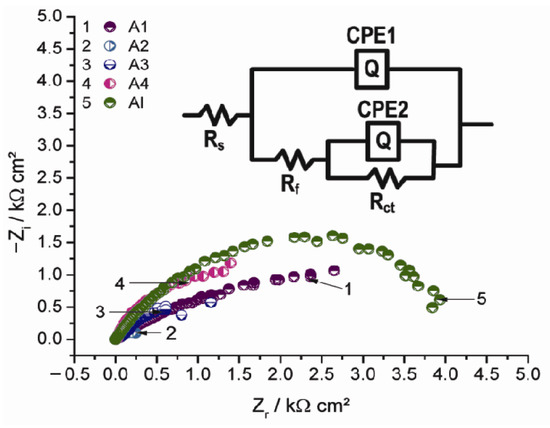
Figure 5.
Nyquist plots obtained for the samples A1–A4 and the Al support in the inset, the equivalent electrical circuit model used to fit the experimental data (for uncoated Al and Al/HEA thin films and in artificial seawater).
Analyzing Figure 5, it can be seen that the impedance diagram of the covered and uncovered electrode can be described by a capacitive semicircle at high frequencies, followed by a capacitive loop at lower frequencies. For the uncovered electrode, the first semicircle is attributed to the formation of the film of oxides and corrosion products resulting from the breakdown of the oxide-hydroxide film due to the aggressive attack of Cl– ions and is represented by the thin layer’s resistance. The diffusion of aluminum cations in the solution characterized by the charge transfer resistance (Rct) and the double-layer capacitance (Cct) is presented by the second semicircle. Two semicircles, a smaller one at high frequency followed by a larger one at medium and lower frequencies, characterize the impedance diagram of the aluminum substrate covered with HEA film. The formation of the coating film/electrolyte interface established by the resistance and capacitance of the coating film is attributed to the first semicircle. The HEA thin film/aluminum substrate interface and the reactions occurring under the coating film are attributed to the second semicircle. This can be attributed to the charge transfer resistance and the double-layer capacitance. The Nyquist diagram of electrodes covered with protective films was modeled using approximately the same equivalent circuit model (ECM). The parameters obtained after assessing the ECM of the coated/uncoated electrodes are presented in Table 3. The EIS results were analyzed and it was proposed to use the ECM shown in Figure 5 (inset). An ECM for aluminum in a seawater environment was proposed to match the impedance spectra of bare aluminum as shown in Figure 5; the parameter component is electrolyte resistance (Rs), CPEf (CPE1), the constant of the phase element is related to the capacity of corrosion products, Rf represents the resistance of the oxide film that is attacked by aggressive ions and corrosion products, CPEct (CPE2) is the constant of the phase element that is related to the electrochemical reaction, namely the capacity of the double layer, and Rct represents the charge transfer resistance. Additionally, the parameter values showed the good fit of the impedance data and were distinctive compared to those obtained for the coated substrate. In the case of the aluminum sample with a HEA coating, Rs is the electrolyte resistance, Rf represents the resistance of the HEA coating film at the interface with the electrolyte and CPEf (CPE1), the constant of the phase element which is associated with the capacity of the HEA coating film, Rct establishes the charge transfer resistance of the coating film, the actions occur under the coating film and CPEct (CPE2) is the phase element constant that is connected with the electrochemical reaction, specifically the capacity of the double layer. From fitting and exploring the experimental EIS data, we proposed an ECM (Figure 6). In this circuit, the phase element constant, CPE (which is used to describe the deformation of the semicircle capacitive which corresponds to the heterogeneity of the surface due to the presence of roughness and impurities on the electrode surface), is introduced instead of a pure double-layer capacitor (Cdl) to provide a more accurate fit: Cdl = Y0 (ωmax)n–1. The CPE impedance can be defined as ZCPE = Y0–1 (jω)–n, where ω is the angular frequency (ω = 2πf), j is the imaginary number (j2 = –1), Y0 is the amplitude compared to the capacitance and n is the phase shift. The value of n gives details about the degree of inhomogeneity of the metal surface. A higher value of n is associated with a lower surface roughness (reduced inhomogeneity). The constant of the phase element can be considered the resistance (when n = 0, Y0 = R), capacitance (when n = 1, Y0 = C), inductance (when n = –1, Y0 = 1/L) or a Warburg impedance (n = 0.5; Y0 = W), depending on the value of n. For studies in a corrosive environment, higher values of Rct for the coating films are attributed to the barrier effect with high efficiency, while the lower value of CPE ensures the greater anti-corrosion protection of the HEA thin film on the aluminum support. This ECM gave a good fit for all the EIS data in good agreement with the data obtained from the potentiodynamic bias tests. For sample A1, the higher values of Rct and lower values of Cdl denote that this sample gave to the aluminum support the best anti-corrosion protection in the studied environment.
Table 3.
Electrochemical parameters of the thin films with uncoated Al and those coated with HEA in a synthetic seawater solution.
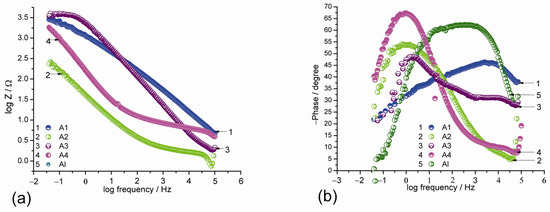
Figure 6.
Bode plots for the A1–A4 samples of CoCuCrFeMnNi electrodeposited on Al; (a) log freq. vs. log Z and (b) log freq. vs.–Phase angle.
We can appreciate that the response to the impedance of the HEA-coated aluminum support was modified by the deposition of the protective film, which implies that the presence of the protective film was highlighted.
The good corrosion protection of sample A1 is demonstrated by the fact that this sample has the larger diameter of the impedance loop.
For the sample A3, lower protection efficiencies were observed, while sample A2 and A4 did not have good protective behavior.
This behavior may be caused by some existing defects on the HEA coating film, defects that allow the penetration of corrosive ions at the aluminum electrode/HEA interface. From the analysis of the EIS data (Table 3 and Figure 5 and Figure 6), one can say that some of the HEA-coated aluminum supports had much better behavior in electrochemical processes, providing good corrosion protection. For example, sample A1 had a very good protective behavior compared to the uncoated aluminum electrode, while sample A3 had a less-good protective capacity and samples A2 and A4 did not have a good protective capacity (Table 3 and Figure 5 and Figure 6), because, during the electrochemical corrosion process, the aggressive chlorine ions partially destroyed the HEA thin film and penetrated the surface of the aluminum support. The Bode plots shown in Figure 6 and the Bode and Nyquist plots for Al support in Figure S1 (Supplementary Materials) are consistent. For the samples of aluminum covered with HEA thin films, we observed higher values of the impedance modulus (Zmod) at low-frequency values. The protective film on the surface of sample A1 and A3 stopped the corrosion process and acted as a barrier through the charge transfer phenomenon as suggested by the Nyquist and Bode plots. On the surfaces of samples A2 and A4, the protective films were destroyed and attacked by aggressive ions (Cl−), which in time led to with them being covered with corrosion products (they have quite large phase angles). Results obtained by potentiodynamic polarization are supported by the EIS data obtained.
3.3. Microstructure of HEA Alloys
3.3.1. SEM Analysis
SEM measurements were used to study the microscopic structure of the HEA thin films electrodeposited on the Al substrate, before and after the corrosion process. The SEM images are presented in Figure 7, Figure 8, Figure 9 and Figure 10. As for the Al support, SEM images are shown in Figure S2. The Al support showed a smooth surface before corrosion. After corrosion, surface cracks and irregularly shaped deposits could be observed.
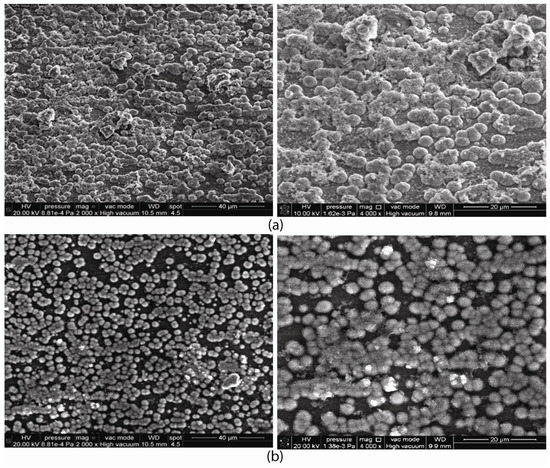
Figure 7.
SEM for A1 sample in initial stage (a) and after corrosion (b), at magnification of ×2000 and ×4000.
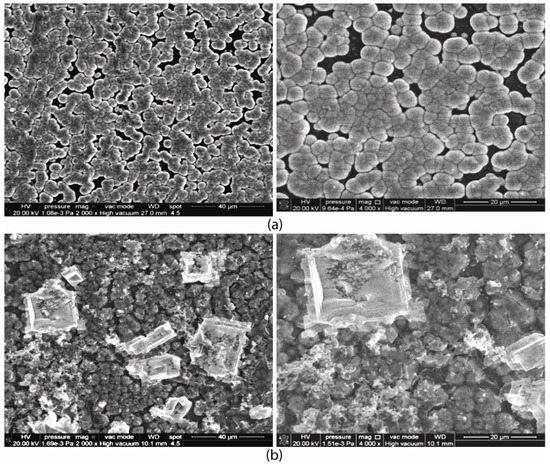
Figure 8.
SEM for A2 sample in initial stage (a) and after corrosion (b), at magnification of ×2000 and ×4000.
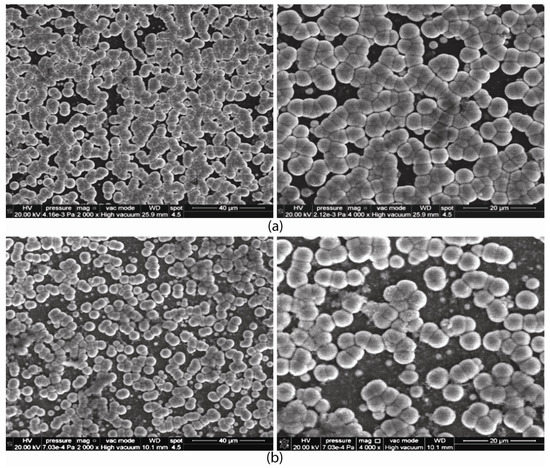
Figure 9.
SEM images for A3 sample before (a) and after corrosion (b), at magnification of ×2000 and ×4000.
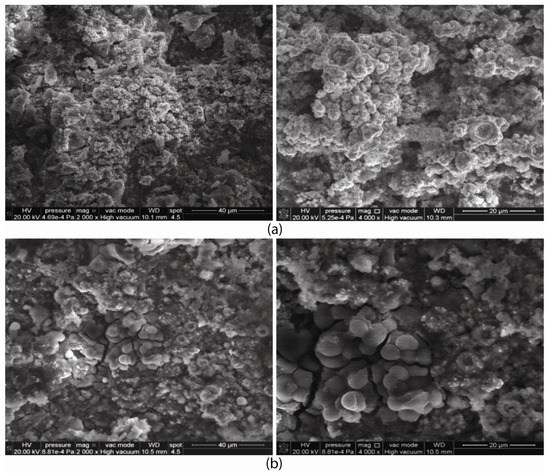
Figure 10.
SEM images for A4 sample before (a) and after corrosion (b), at magnification of ×2000 and ×4000.
Films A2 and A3 are similar and very homogeneous, consisting of globular units, 4–5 microns in diameter and some inter-globular porosity The A1 film, deposited on a thin sheet, is also similar, but there are inhomogeneous areas, possibly due to the higher roughness of the substrate. The A4 film is different from the others and quite hard with more irregular deposits. After corrosion, films A1 and A3 appear with similar globular morphology, the only difference being an increase in porosity, some empty spaces are observed not covered by the globular film can be observed. The morphology of the A2 film surface is clearly the most affected, the main differences observed after corrosion are the presence of cubic shapes, which can be attributed to the deposition of NaCl crystals from the synthetic seawater, and smaller particles, sized several hundreds of nm, forming porous aggregates above the film. The surface of the A4 film becomes less irregular and with coarser surface features. Cubic crystal deposits and surface cracks are observed in the film-free substrate.
EDS analysis and chemical compositions of the HEA thin films on Al support before the corrosion process are presented in Figure S3 and Table 4, confirming that for all the studied samples the deposits contain all five elements but with different compositions. The EDS spectra highlighted the existence of all five metals and of O of the HEA deposited on the Al support.
Table 4.
CoCrFeMnNi HEA thin films deposited on aluminum support.
The chemical composition of the deposit is relatively constant from the bottom to the top of the samples if we are looking at the depth profile of the EDS spectra. Both SEM and EDS data confirm the results obtained using Tafel and EIS study data.
The depth profile of the EDS spectrum suggests that the chemical composition of the deposit is relatively constant from the bottom to the top of the samples. SEM and EDS data are in good agreement with the results obtained by potential dynamic polarization and EIS study data. The SEM/EDS data confirm that sample A1 has the best anticorrosive properties and we suspect that this is due to the high concentration of Cr, Co and Fe and the low concentration of Mn in this sample, which is in good agreement with the modeling study. The modeling part revealed that (a) Co, Cr, Fe and Ni have a positive effect on the formation of the SS phases and Co and Ni have a positive effect on the density of the HEA alloy; (b) Fe and Mn tend to lead the alloy outside the SS area, while Mn has a negative effect on the formation of SS. (c) The difference in atomic radius can be reduced by increasing the content of Fe.
Sample A4 is a good example of the negative effect a too-high Mn content has on the corrosion resistance. As for sample A3, this is the case even if it has good contents of Co, Fe and Ni, has a poor the corrosion resistance due to a low content of Cr and a high content of Mn.
Corrosion behavior during a long period of immersion in this aggressive electrolyte of artificial seawater could be influenced by the imperfections in the structure of the HEA thin films. Only long-term corrosion studies can demonstrate this along with some XPS studies of the surface of the samples if these imperfections become wider to allow penetration inside the HEA protective layer. However, due to the fact that in our samples the HEA thin films were very thin we could not perform long-term corrosion studies.
3.3.2. AFM Analysis
Figure 11 and Figure 12 present the morphology of the HEA thin film samples (A1–A4) deposited on Al, before (left column) and after (right column) corrosion experiments, resulting from 2D topographic AFM images, taken in the enhanced-contrast view mode recorded at the scale of (5 µm × 5 µm).
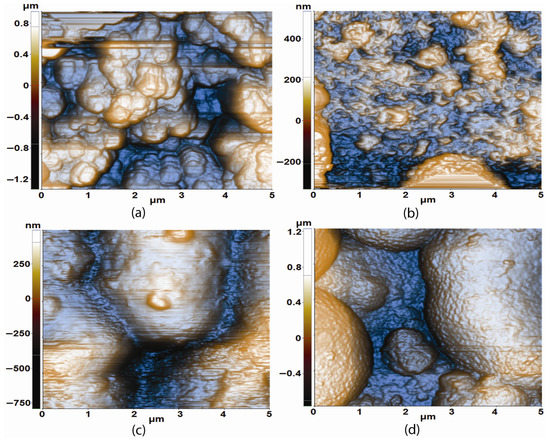
Figure 11.
Enhanced-contrast 2D AFM images (topography) recorded at the scale of 5 µm × 5 µm for the alloy samples A1 (a,b) and A2 (c,d) deposited on Al, before (left column) and after (right column) corrosion experiments.
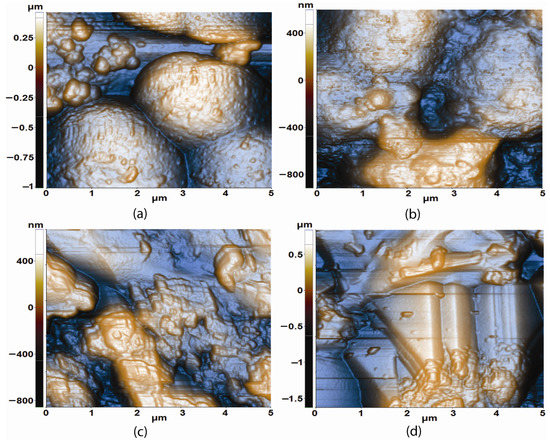
Figure 12.
Enhanced-contrast 2D AFM images (topography) recorded at the scale of (5 µm × 5 µm) for the alloy and samples A3 (a,b) and A4 (c,d) deposited on Al, before (left column) and after (right column) corrosion experiments.
The same images for Al support (reference) are presented in Figure S4. The native bare Al substrate is relatively flat (height difference of ~40 nm as estimated from line scans), and exhibits random protruding particles (visible as bright spots). The root mean square (RMS) roughness is ~10.5 nm and the peak-to-valley parameter (the height difference between the highest and lowest points in the scanned area) is ~119 nm. After corrosion, the formation of deep pits/cavities (down to a few hundreds of nm) can be observed (see the dark zones in Figure S4b). The visibility of the formerly observed protruding particles is diminished due to the surface restructuring imposed by corrosion. The RMS roughness increases to ~75.2 nm, while the peak-to-valley parameter strongly increases up to ~700 nm. Figure 11 shows the morphology of the A1 alloy, before (left) and after the corrosion test (right). The A1 alloy consists of stacks of particles (bright/white zones) with heights of hundreds of nm, that are non-homogeneously disposed on the substrate, and which leave between them some deep (down to one micron) cavities (dark areas); see Figure 11a. The non-homogeneous topography of the A1 alloy leads to large values of the corrugation parameters, a RMS roughness of ~382.9 nm and the peak-to-valley parameter of ~2.3 µm, which are the largest parameters in the A1–A4 series before corrosion. Figure 11b presents the A1 sample after corrosion tests, highlighting the presence of small particles, that are flattened, having a non-isotropic aspect probably formed (or deposited from the solution) during the corrosion process, in addition to the remaining massive material blocks visible as white massive areas in the bottom and left part of the image. Due to the partial dissolution of part of the massive stacks, the roughness decreases to ~107.6 nm, and the peak-to-valley parameter decreases to ~868 nm (the only sample in the series with decreasing corrugation after corrosion tests).
Samples A2 (Figure 11c,d) and A3 (Figure 12a,b) exhibit a similar morphology, consisting of large particles with a globular aspect, with dimensions (diameters) of a few microns, and some difference in the texture of the particles: sample A2 exhibit relatively smooth particles (Figure 11c), while sample A3 (Figure 12a) shows a structure of a small particles (70–200 nm) on-top of the large ones (2–3 microns), and with random medium particles, placed in the inter-granular space. Following the corrosion process, there is an increase in roughness parameters, which are higher for sample A2 in comparison with those of sample A3. Before the corrosion tests, we evaluated the roughness parameters, obtaining results of Rq ~ 206.7 nm and Rpv ~ 1.28 µm (sample A2), and, Rq ~ 210.3 nm and Rpv ~ 1.46 µm (sample A3). After the corrosion experiments, these values were Rq ~ 359.9 nm and Rpv ~ 1.99 µm (sample A2) and, Rq ~ 241.7 nm and Rpv ~ 1.51 µm (sample A3). Sample A4 is less uniform, as its morphology consists of large and compact blocks, with well-defined edges intercalated with small particles that are non-homogeneously distributed on the surface (Figure 12c,d). Before the corrosion tests, the Rq values were Rq ~ 233.3 nm and Rpv ~1.52 µm, while after corrosion, they were Rq ~ 323.7 nm and Rpv ~ 2.47 µm.
The corrugation histograms of all investigated samples are presented in Figure 13, including the RMS roughness (a) and peak-to-valley (b), evaluated from the whole scanned areas of (5 µm × 5 µm). It is interesting to note that the same parameters, evaluated along random-line scans exhibit the same tendency. For all samples A2–A4 and the Al support, the roughness increases after corrosion, and only for A1 does this parameter decrease, which reconfirms the good resistance to corrosion.
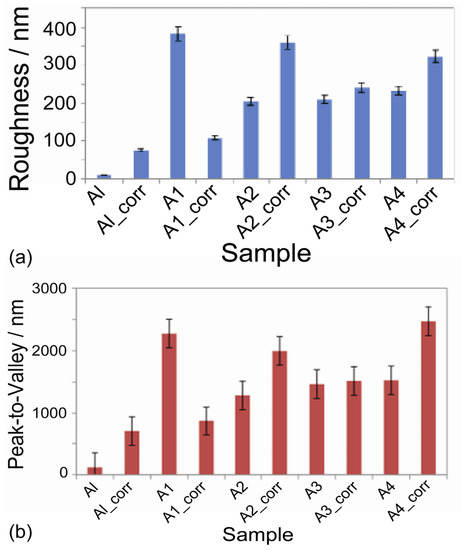
Figure 13.
Roughness histograms assessed from AFM images; RMS roughness (a) and peak-to-Valley (b) of the bare Al sample (reference) and for the alloy samples (A1–A4) before and after corrosion experiments.
All AFM experiments and calculated data confirm the polarization and SEM/EDS data, proving that that the best corrosion resistance of all alloy samples is in the A1 sample.
Even during the electrodeposition experiments, we noticed that the HEA thin films had a reduced adhesion to Al, probably due to the fact that the Al was covered with a thin film of oxide, even if they were immediately stripped, degreased, dried quickly and put in the bath. Some reactions between Al and the components of the electrolyte may also occur. This is to be studied in the future.
We also notice that on Al support the HEA thin films were deposited at higher voltages compared to those with the deposition on Cu [19,20].
In order to increase the adhesion of HEA films on Al, we propose for the future studies to deposit double or multiple layers of alloy.
4. Conclusions
Potentiostatic electrodeposition was used for the preparation of high-entropy alloy (CoCrFeMnNi) thin films on aluminum support.
The microstructure and corrosion resistance were the two directions on which the present study was focused. Additionally, simulation results of the alloy structure performed using CALPHAD were also presented and compared to the experimental findings.
For the HEA CoCrFeMnNi thin films electrodeposited on an Al support, the best results were obtained in terms of the appearance of the deposition and corrosion resistance in synthetic seawater, for the sample obtained from DMF-AN with the addition of 0.1 M/l LiClO4, at room temperature and with voltages of 2.5 V (significantly higher than deposits on Cu support). However, the efficiency of corrosion resistance was only of 65%, which means it is much more lower than that on a Cu support [21,22]. The same good corrosion resistance was also identified via the impedance SEM/EDS tests.
As a final conclusion of this study, we propose increasing the corrosion resistance of the electrodeposition of pentavalent HEA thin films on an aluminum support in the future, to perform the deposition of double or multiple HEA thin layers.
Supplementary Materials
The following supporting information can be downloaded at: https://www.mdpi.com/article/10.3390/coatings13060980/s1, Figure S1: Bode plots for the aluminum; Figure S2: SEM for Al support; (a) initial stage; (b) corroded in artificial seawater; Figure S3: EDS spectra for the initial A1–A4 samples of HEA thin films deposited on Al: (a) A1; (b) A2; (c) A3; (d) A4; Figure S4: 2D AFM images (topography) recorded at the scale of (5 µm × 5 µm) for the Al support (a) before and (b) after corrosion experiment.
Author Contributions
Conceptualization, A.-M.J.P.; methodology, F.B.; software and modeling, I.A., M.B. and M.T.O.; validation, M.B. and V.C.; formal analysis, F.B. and V.C.; investigation, F.B., J.C.M., M.A. and M.B.; resources, A.-M.J.P., writing—original draft preparation, A.-M.J.P.; writing—review and editing, A.-M.J.P. and V.C.; visualization, F.B.; supervision, V.C.; project administration, A.-M.J.P. and M.B.; funding acquisition, A.-M.J.P. and M.B. All authors have read and agreed to the published version of the manuscript.
Funding
This research received no external funding.
Institutional Review Board Statement
Not applicable.
Informed Consent Statement
Not applicable.
Data Availability Statement
Not applicable.
Conflicts of Interest
The authors declare no conflict of interest.
References
- Hsu, U.S.; Hung, U.D.; Yeh, J.W.; Chen, S.K.; Huang, Y.S.; Yang, C.C. Alloying behavior of iron, gold and silver in AlCoCrCuNi-based equimolar high-entropy alloys. Mater. Sci. Eng. A 2007, 460–461, 403–408. [Google Scholar] [CrossRef]
- Yang, J.H.; Feng, B.; Liu, Y.; Zhang, Y.J.; Yang, L.L.; Wang, Y.X.; Lang, J.H.; Wang, D.D. Synthesis and Soft Magnetic Properties of Mg-doped Ni Nanoparticles. Chem. Res. Chin. Univ. 2008, 24, 534–536. [Google Scholar] [CrossRef]
- Fan, H.G.; Ming, X.; Hu, F.; Wang, C.Z.; Huang, Z.F.; Chen, G. Bonding Characteristics and Magnetic Coupling Interactions in One-dimensional α’-NaV2O5. Chem. Res. Chin. Univ. 2009, 25, 243–246. [Google Scholar]
- Lin, C.M.; Tsai, H.L. Equilibrium phase of high-entropy FeCoNiCrCu0.5 alloy at elevated temperature. J. Alloys Compd. 2010, 489, 30–35. [Google Scholar] [CrossRef]
- Hu, Z.; Zhan, Y.; Zhang, G.; She, J.; Li, C. Effect of rare earth Y addition on the microstructure and mechanical properties of high entropy AlCoCrCuNiTi alloys. Mater. Design 2010, 31, 1599–1602. [Google Scholar] [CrossRef]
- Murty, B.S.; Yeh, J.W.; Ranganathan, S. High-Entropy Alloys, 1st. ed.; Butterworth-Heinemann: London, UK, 2014; ISBN 9780367356330. [Google Scholar]
- Srivatsan, T.S.; Gupta, M. (Eds.) High Entropy Alloys, Innovations, Advances, and Applications; CRC Press Taylor & Francis Group: Boca Raton, FL, USA, 2020; ISBN 9781000046977. [Google Scholar]
- Zhang, Y.; Zuo, T.T.; Tang, Z.; Gao, M.C.; Dahmen, K.A.; Liaw, P.K.; Lu, Z.P. Microstructures and Properties of High Entropy Alloys. Progr. Mater. Sci. 2014, 61, 1–93. [Google Scholar] [CrossRef]
- Lai, C.H.; Lin, S.J.; Yeh, J.W.; Chang, S.Y. Preparation and characterization of AlCrTaTiZr multi-element nitride coatings. Surf. Coat. Technol. 2006, 201, 3275–3280. [Google Scholar] [CrossRef]
- Chen, Y.Y.; Hong, U.T.; Yeh, J.W.; Shih, H.C. Mechanical properties of a bulk Cu0.5NiAlCoCrFeSi glassy alloy in 288 °C high-purity water. Appl. Phys. Lett. 2005, 87, 261918–261920. [Google Scholar] [CrossRef]
- Wei, Z.D.; Chan, S.H. Electrochemical deposition of PtRu on an uncatalyzed carbon electrode for methanol electrooxidation. J. Electroanal. Chem. 2004, 569, 23–33. [Google Scholar] [CrossRef]
- Ji, X.B.; Banks, C.E.; Holloway, A.F.; Jurkschat, K.; Thorogood, C.A.; Wildgoose, G.G.; Compton, R.G. Palladium sub-nanoparticle decorated ‘bamboo’ multi-walled carbon nanotubes exhibit electrochemical metastability: Voltammetric sensing in otherwise inaccessible pH ranges. Electroanalysis 2006, 18, 2481–2485. [Google Scholar] [CrossRef]
- Welch, C.M.; Compton, R.G. The use of nanoparticles in electroanalysis: A review. Anal. Bioanal. Chem. 2006, 384, 601–619. [Google Scholar] [CrossRef] [PubMed]
- Simka, W.; Puszczyk, D.; Nawrat, G. Electrodeposition of metals from non-aqueous solutions. Electrochim. Acta 2009, 54, 5307–5319. [Google Scholar] [CrossRef]
- Wang, S.; Guo, X.; Yang, H.; Dai, J.; Zhu, R.; Gong, J.; Peng, L.; Ding, W. Electrodeposition mechanism and characterization of Ni-Cu alloy coatings from a eutectic-based ionic liquid. Appl. Surf. Sci. 2014, 288, 530–536. [Google Scholar] [CrossRef]
- Abbott, A.P.; McKenzie, K.J. Application of ionic liquids to the electrodeposition of metals. Phys. Chem. Chem. Phys. 2006, 8, 4265–4279. [Google Scholar] [CrossRef] [PubMed]
- Murty, B.S.; Yeh, J.W.; Ranganathan, S.; Bhattacharjee, P.P. High Entropy Alloys, 2nd. ed.; Elsevier Inc.: Cambridge, MA, USA, 2019; ISBN 978-0-12-816067-1. [Google Scholar]
- Soare, V.; Burada, M.; Constantin, I.; Mitrica, D.; Badilita, V.; Caragea, A.; Tarcolea, M. Electrochemical deposition and microstructural characterization of AlCrFeMnNi and AlCrCuFeMnNi high entropy alloy thin films. Appl. Surf. Sci. 2015, 358, 533–539. [Google Scholar] [CrossRef]
- Chenzhong, Y.A.O.; Huixuan, M.A.; Yexiang, T. Electrochemical Preparation and Magnetic Study of Amorphous Nanostructural Nd-Fe-Co-Ni-Mn High Entropy Alloy Film. Chin. J. Appl. Chem. 2011, 28, 1189–1194. [Google Scholar]
- Li, W.; Liu, P.; Liau, P.K. Microstructures and properties of high-entropy alloy films and coatings: A review. Mater. Res. Lett. 2018, 6, 199–229. [Google Scholar] [CrossRef]
- Popescu, A.M.J.; Branzoi, F.; Constantin, I.; Anastasescu, M.; Burada, M.; Mitrica, D.; Anasiei, I.; Olaru, M.T.; Constantin, V. Electrodeposition, Characterization, and Corrosion Behavior of CoCrFeMnNi High-Entropy AlloyThin Films. Coatings 2021, 11, 1367. [Google Scholar] [CrossRef]
- Popescu, A.M.J.; Branzoi, F.; Burada, M.; Atkinson, I.; Constantin, I.; Calderon Moreno, J.M.; Miculescu, F.; Mitrica, D.; Badea, I.C.; Olaru, M.T.; et al. Influence of Heat Treatment on the Corrosion Behavior of Electrodeposited CoCrFeMnNi High-Entropy Alloy Thin Films. Coatings 2022, 12, 1108. [Google Scholar] [CrossRef]
- Serban, B.A.; Olaru, M.T.; Badea, I.C.; Mitrica, D.; Burada, M.; Anasiei, I.; Ghita, M.; Tudor, A.I.; Matei, C.A.; Popescu, A.M.J.; et al. Non-Aqueous Electrodeposition and Characterization of AlCrCuFeNi High Entropy Alloy Thin Films. Materials 2022, 15, 6007. [Google Scholar] [CrossRef]
- Kemeny, D.M.; Palfi, N.M.; Fazakas, E. Examination of microstructure and corrosion properties of novel AlCoCrFeNi multicomponent alloy. Mater. Today Proc. 2021, 45, 4250–4253. [Google Scholar] [CrossRef]
- Troparevsky, M.C.; Morris, J.R.; Kent, P.R.C.; Lupini, A.R.; Stocks, G.M. Criteria for predicting the formation of single-phase high-entropy alloys. Phys. Rev. X 2015, 5, 011041. [Google Scholar] [CrossRef]
- Yang, L. (Ed.) Techniques for Corrosion Monitoring, 2nd ed.; Elsevier-Woodhead Publishing: Oxford, UK, 2021; ISBN 978-0-08-103004. [Google Scholar]
Disclaimer/Publisher’s Note: The statements, opinions and data contained in all publications are solely those of the individual author(s) and contributor(s) and not of MDPI and/or the editor(s). MDPI and/or the editor(s) disclaim responsibility for any injury to people or property resulting from any ideas, methods, instructions or products referred to in the content. |
© 2023 by the authors. Licensee MDPI, Basel, Switzerland. This article is an open access article distributed under the terms and conditions of the Creative Commons Attribution (CC BY) license (https://creativecommons.org/licenses/by/4.0/).