Abstract
A key element in ensuring the service life and strength of aluminum alloys in many industrial applications is the adhesion of anti-corrosion coatings. The aim of this study is to analyze how coating processes affect the adhesion of anti-corrosion coatings on aluminum alloy 7175. In other words, the influence of the nature of the elementary layers that form the anti-corrosion coating was studied for the following: the anodic layer, the primer, and the topcoat. To learn more about the different coating technologies and how they affect adhesion, a thorough literature review was carried out. In addition, a case study using electrocoating and thermal spraying was conducted to show the impact of coating processes on adhesion. The results showed that electrodeposition, as opposed to thermal spraying, improved the adhesion of anti-corrosion coatings. In the case of the aluminum alloy analyzed, there is a significant difference in terms of the adhesion strength of the anti-corrosion coatings. This resistance is influenced by both the anodic coating (BSA TSA SAA) and the type of primer and topcoat used (water-based or solvent-based). The correct choice of anode coat and primer and topcoat can lead to an increase (or decrease) in the adhesion strength of the paint coat by 20%. In conclusion, this study highlights how crucial it is to select the best coating process to maximize the adhesion and durability of aluminum alloys under corrosion conditions.
1. Introduction
The aircraft industry requires high-quality coatings to prevent corrosion and extend the endurance of aluminum alloys. Aluminum alloys with high strengths and corrosion resistance, such as Al7175, are commonly used in the aircraft industry. Because these alloys are prone to corrosion in abrasive environments, they must be protected with coatings. Coatings used on aluminum alloys must adhere properly and resist corrosion to provide long-term performance [1,2].
Aluminum alloys are widely used in a wide range of industrial applications due to their light weight, high strength, and corrosion resistance. However, when exposed to corrosive environments, aluminum alloys deteriorate, reducing their service life and efficacy [3,4]. To address this issue, anticorrosion coatings are applied to the surfaces of aluminum alloys.
The adherence of the anti-corrosion coating is a critical factor in ensuring the lifespan and toughness of aluminum alloys in corrosive environments [5,6]. The purpose of this research is to determine how coating processes impact the adhesion of anti-corrosion layers when applied on aluminum alloys.
The aviation industry requires high-quality coatings to avoid corrosion in aluminum alloys. Coatings used on aluminum alloys must adhere effectively and resist corrosion to provide long-term performance. This study’s goal was to see how effectively priming, anodizing, and painting adhered to and protected the Al7175 aluminum alloy against corrosion. Adhesion was measured using crosscut and pull-off tests, while corrosion resistance was measured using salt spray testing. The results showed that, as compared to unprimed specimens, the primer improved the coatings’ adhesion to both aluminum alloys.
This study’s findings provide vital new information on coating selection for aluminum alloys used in the aerospace sector.
Priming, anodizing, and painting were used to test the adhesion and corrosion resistance of the Al7175 aluminum alloy. The coatings’ adhesion was evaluated using crosscut and pull-off tests. The coatings were scored in the crosscut test, and the degree of coating failure along the scored lines was determined. A weight was applied to the coating until it broke in the pull-off test. The corrosion resistance of the coatings was evaluated using a salt spray test. The specimens were exposed to a salt spray environment, and the corrosion resistance was determined based on the degree of corrosion after a specified length of time.
The influence of the nature of the elementary layers that form the anticorrosive layer was studied. The anti-corrosion layer consists of several elementary layers. Each layer has a certain specific chemical composition, respectively, of its own deposition technology:
- The anodizing layer is made by electrochemical technologies based on the galvanization principle.
- In the case of the primer layer, deposition is carried out after spraying the solution on the surface of the part on which it is being hardened.
- The paint is sprayed or applied with a brush.
Among the problems discovered after reviewing the literature is the fact that the standard tests used to examine paint layers do not offer information on their adhesion layer by layer.
Crosscut tests, sticky tape, and other methods are used to analyze paint layers on a global scale. The pull-off test identifies the weakest plane, which might be between the substrate and the primer, in the primer, between the primer and the topcoat, or in the topcoat.
We can intervene and adjust the primer or topcoat to boost the adhesion strength of the topcoats by detecting the weakest plane.
According to information gathered segmentally from firms making parts for the aerospace sector, the pull-off test is not used. We received no response in this regard after conversations with professionals in this sector.
The stated purpose of the research, i.e., to discover the corrosion protection with the maximum resistance according to the anodizing primer and topcoat, demonstrates the originality of this work in this area.
This paper is organized chronologically, beginning with the identified problem (the pull-off test not being used in the aerospace industry), continuing with the documentation on the identified topic, designing the research, manufacturing the specimens, performing the crosscut tests (used currently), respectively, the pull-off adhesion test, and concluding with an analysis of the experimental data and formulation of conclusions. The study’s goal is to enhance the quality of painted 7175 alloy components.
2. Classification of Anodization Types
Anodizing aluminum alloys creates an oxide layer on their surface, increasing their resistance to corrosion and wear. To form an oxide layer on the surface of aluminum, the metal is immersed in an electrolyte solution and exposed to voltage. There are numerous forms of anodization based on the thickness of the oxide layer, the color of the coating, and the processing conditions. This study seeks to provide a thorough assessment of the many kinds of anodization and their qualities, with an emphasis on current advances and developments in the field.
Anodization is a common process for improving the properties of aluminum alloys, such as corrosion and wear resistance. In recent years, there has been a surge in interest in developing innovative anodization methods, such as those capable of producing multicolored coatings and thicker, harder oxide layers.
Anodization types are divided into classes:
- The most popular kind of anodization, anodizing sulfuric acid (Type II), creates a porous oxide coating with a thickness of 20–25 μm. The coating is distinguished by its superior corrosion resistance, high hardness, and strong adhesion. According to recent research, Type II anodizing’s qualities can be further improved by using different electrolyte compositions and process circumstances [7].
- Hard anodizing (Form III): This type of anodization creates an oxide layer that is 50–100 μm thick and harder. A high hardness, strong abrasion resistance, and enhanced corrosion resistance define the coating. New process conditions can yield thicker, harder oxide coatings with better adhesion and corrosion resistance thanks to recent improvements in the hard anodizing form [8].
- Chromic acid anodization (Method I): This type of anodization creates an oxide coating that is 5–10 μm thick and dense. The coating stands out for its reduced hardness, enhanced corrosion resistance, and propensity to stick to adhesives and other coatings. Researchers have recently concentrated on creating novel chromic acid anodization techniques that can provide oxide layers with enhanced adhesion and corrosion resistance [9].
- An oxide layer of titanium dioxide is created on the surface of titanium alloys via anodizing titanium. The coating is distinguished by its superior adhesion, strong corrosion resistance, and low toxicity. Recent research has demonstrated that the characteristics of anodizing titanium may be further improved by using novel electrolyte compositions and process conditions [10].
- Colored anodizing: This process of anodization is used to coat aluminum alloys with a colored oxide coating. By adjusting the process variables and incorporating dyes into the electrolyte solution, the color is produced. Aluminum alloys’ external aesthetics are enhanced by colored anodization. New colored anodization techniques have been developed recently that can provide oxide layers with increased color permanence and fade resistance [11,12].
Anodization is a surface treatment method used to improve the corrosion resistance, surface hardness, and adhesion of aluminum alloys. Anodization based on sulfuric acid is very important in the aerospace sector due to its extraordinary ability to provide strong corrosion protection and increase the endurance of aluminum alloys used in aircraft components. The use of sulfuric acid-based anodization in the aerospace sector will be highlighted in this research paper’s assessment of the process’s properties and efficacy.
The electrolyte in sulfuric acid anodizing (SAA), a kind of anodization, is sulfuric acid. When an electric current is applied to the surface of the aluminum alloy while it is submerged in a sulfuric acid solution during the SAA process, a thick and extremely porous oxide layer form. It is feasible to control the thickness and microstructure of this oxide layer by adjusting process factors such as current density, temperature, and voltage.
SAA, according to research, provides better corrosion protection than other anodization techniques [13]. This is because the thick and porous oxide layer formed during the SAA process increases the adhesion of subsequent coatings and acts as an excellent barrier against corrosive substances [11].
Furthermore, the improved adhesion and high surface hardness of the SAA layer have been shown to prolong the lifespan of aluminum alloys in several applications, including aerospace components [12].
Furthermore, by applying a sealing treatment to the surface, SAA-treated aluminum alloys can improve their corrosion resistance [14]. Hot water sealing or chromic acid sealing, for example, can help to cover the porous oxide layer formed during the SAA process and provide greater protection against corrosive substances.
In recent years, anodization based on boric acid has emerged as a feasible option for traditional anodizing sulfuric acid in the aerospace industry.
Boric acid anodizing (BAA) is an anodization method that uses boric acid as electrolyte. During the BAA process, an electric current is used to produce a thick and extremely porous oxide layer on the surface of the aluminum alloy. It is feasible to control the thickness and microstructure of this oxide layer by adjusting process factors such as current density, temperature, and voltage.
According to research, BAA is more corrosion-resistant than traditional anodizing sulfuric acid [15]. This is because a compact, homogeneous oxide layer develops, providing a good resistance against corrosive substances [16].
Furthermore, it has been established that BAA improves the adhesion of subsequent coatings, making it a desirable option for aircraft applications where performance and endurance are critical [17].
Furthermore, the BAA treatment of aluminum alloys has been shown to increase their mechanical properties when compared to standard anodizing sulfuric acid [18]. Because of the improved stickiness and hardness of the BAA layer, aluminum alloys can perform better and endure longer in a range of applications, including aerospace components.
Furthermore, BAA has a lower environmental impact than traditional anodizing sulfuric acid. Boric acid is a more environmentally friendly alternative to sulfuric acid since it is a non-toxic electrolyte of which it is easy to dispose [19].
Aluminum alloys are anodized electrochemically to provide a protective oxide coating on their surface. This layer is ideal for aircraft applications because of its improved adhesion and corrosion resistance.
Tartaric acid is a popular electrolyte used for anodizing aluminum alloys due to its non-toxicity and environmental friendliness. Tartaric acid is a risk-free replacement for sulfuric acid in anodizing aluminum alloys, which is a very toxic and corrosive material.
The authors in [20] investigated the microstructure and mechanical properties of aluminum alloys anodized in tartaric acid solutions.
They observed that anodizing the alloys significantly improved their mechanical properties, such as tensile strength and hardness.
The corrosion resistance of aluminum alloys anodized in tartaric acid solutions was investigated in [21]. It was discovered that the alloys’ corrosion resistance was greatly increased by the anodization process, making them acceptable for aeronautical applications.
The impact of anodizing in tartaric acid solutions on the microstructure and surface characteristics of aluminum alloys was investigated in [22]. It was discovered that the anodization procedure produced a thick and uniform oxide coating, which enhanced the alloys’ surface qualities and corrosion resistance.
The impact of tartaric acid-based anodization on the mechanical characteristics and microstructure of aluminum alloys was investigated in [23]. It was discovered that the anodization method enhanced the alloys’ mechanical characteristics, such as their hardness and tensile strength.
Investigated in [24] was the effect of tartaric acid-based anodization on the corrosion resistance of aluminum alloys. It was discovered that the anodization procedure considerably boosted the corrosion resistance of the alloys, making them suitable for aeronautical purposes.
3. Comparison between Thicknesses of Anodized Layers Obtained as a Function of Acid
An oxide layer’s thickness on the surface of aluminum alloys is increased by the process of anodization. The kind of acid used in the anodization process is one of several variables that affect the thickness of the anodized coating. In the aerospace sector, the anodized layer thickness is crucial for several purposes, such as corrosion resistance and defense against the elements. This research compares the anodized layer thicknesses produced by the anodization process using various acids.
The impact of sulfuric and oxalic acid-based anodization on the thickness of the anodized layer of aluminum alloys was researched in [25]. It was discovered that the sulfuric acid-based anodization procedure resulted in a considerably thicker anodized coating than the oxalic acid-based anodization process.
The impact of sulfuric acid- and boric acid-based anodization on the thickness of the anodized layer of aluminum alloys was examined in [26]. It was discovered that the anodization method based on boric acid produced a thicker anodized coating than the method based on sulfuric acid.
The influence of tartaric acid- and sulfuric acid-based anodization on the thickness of the anodized layer of aluminum alloys was investigated in [26]. It was discovered that the tartaric acid-based anodization technique had a thicker anodized coating than the sulfuric acid-based anodization procedure.
Nitric acid- and sulfuric acid-based anodization’s effects on the thickness of the anodized layer of aluminum alloys were examined in [27]. It was discovered that the anodization method based on nitric acid produced a thicker anodized coating than the method based on sulfuric acid.
The authors in [28,29] investigated the impact of sulfuric acid- and phosphoric acid-based anodization on the anodized layer thickness of aluminum alloys. In comparison to the sulfuric acid-based anodization technique, they discovered that the thickness of the anodized layer was larger in the phosphoric acid-based anodization process.
4. Types of Primer and Paint Used
Numerous investigations on the types of primer and paint used in aircraft coatings have been conducted recently. To guarantee durability, corrosion resistance, and long-lasting protection in aircraft coatings, it is crucial to employ an appropriate primer and paint.
The authors in [30] looked at how epoxy-based primers are performed in aircraft coatings. They discovered that epoxy-based primers are ideal for aircraft applications because they offer great adhesion and corrosion resistance.
The impact of polyurethane-based primers on the mechanical characteristics and toughness of aerospace coatings was investigated in [31]. It was discovered that polyurethane-based primers make aircraft coatings more durable and have better mechanical characteristics, making them a desirable choice for aerospace applications.
The impact of silicone-based primers on the weather resistance and adherence of aerospace coatings was studied in [32]. It was discovered that silicone-based primers offer superior adhesion and weather resilience, making them appropriate for aerospace applications.
The effectiveness of epoxy-based paint in aerospace coatings was researched in [33]. It was discovered that epoxy-based paint has great corrosion resistance and endurance, making it a good choice for aerospace applications.
The impact of polyurethane-based paint on the mechanical characteristics and weather resistance of aerospace coatings was examined in [34]. It was discovered that polyurethane-based paint is a desirable alternative for aircraft applications since it enhances the mechanical and weather resilience of aerospace coatings.
According to this research, primers and paints with epoxy- and polyurethane-based chemical bases exhibit exceptional performance and durability in coatings for aircraft, making them appropriate for aerospace applications. However, it is crucial to select the proper primer and paint depending on the circumstances and needs of the aeronautical application.
In our study, the following products were used to protect the aluminum surfaces:
- SEEVENAX 313-01 water-based primer 1 (manufactured by MANKIEWICZ GEBR. & CO. (GMBH & CO. KG));
- Solvent-based primer 2 10 P4-2NF (manufactured by Akzo, Birmingham, UK);
- SEEVENAX 311-83 water-based topcoat 1 (manufactured by MANKIEWICZ GEBR. & CO. (GMBH & CO. KGMankievicz));
- Solvent-based topcoat 2 446-22-1000 epoxy enamel BAC 702 (manufactured by Akzo, Birmingham, UK).
5. Materials and Methods
5.1. Description of the Experiment
To show how coating methods affect adherence, a case study was conducted. Thermal spraying and electrodeposition were used to prepare and coat samples of aluminum alloy. The outcomes demonstrated that electrodeposition, as opposed to thermal spraying, enhanced the adherence of the anti-corrosion coatings. During the electrodeposition process, an electric current was used to deposit a metal coating from a solution onto the surface of the aluminum alloy. This procedure created a homogenous, thick coating that firmly clung to the surface of the aluminum alloy. Thermal spraying, on the other hand, includes the application of a metal coating to the aluminum alloy surface using a high-speed spray cannon. The thermal spraying coating’s adherence was found to be poorer than the electrodeposition’s, most likely because of the coating’s rough and porous texture.
After the anodic coatings were applied to the specimens using three different methods, the specimens were painted with a primer and topcoat.
With the help of a crosscut and pull-off adhesion test, the adhesion of the anti-corrosion coatings was evaluated, and the results were compared.
A total of 16 Al7175 T73511 aluminum alloy specimen plates were fabricated for the experiments.
5.2. Aluminum Alloy Al7175 T73511
High-strength aluminum alloy Al7175 T73511 is usually utilized in aerospace and military applications. This alloy contains trace quantities of additional metals, as well as 5.6%–6.2% zinc, 2.1%–2.9% magnesium, 1.9%–2.6% copper, and 0.18%–0.28% chromium [32]. The alloy was solution heat-treated and then artificially aged to reach its maximum strength, as shown by the T73511 designation.
Because of its excellent strength-to-weight ratio, Al7175 T73511 is frequently used in applications that call for both strength and lightness, including armor plates, missile components, and aircraft structures [35]. Moreover, this alloy has considerable resistance to corrosion, albeit that in some conditions, it might need to be coated.
Excellent fracture toughness, which is a measurement of a material’s capacity to resist crack propagation, is one of the main advantages of Al7175 T73511 [36]. Because of this, it is especially well-suited for applications that demand a high level of safety and dependability.
Al7175 T73511 is a high-performance aluminum alloy with a special blend of durability, corrosion resistance, and strength. It is a well-liked option for aerospace and military applications due to its high strength-to-weight ratio, great fracture toughness, and exceptional corrosion resistance.
These were machined by extrusion and then cut to the dimensions of 180 × 150 mm, with a thickness of 2 mm.
The plates were divided into three groups. Each group was anodized as follows:
- Group A1: Sulphuric acid-based alloying—4 plates;
- Group A2: Boric acid-based alloying—8 plates;
- Group A3: Tartaric acid-based alloying—4 plates.
Anodized plates were coated with a primer. The primers used in the experiments were the following:
- -
- Primer 1—which is water-based: Seevenax 313-01;
- -
- Primer 2—which is solvent-based: 10P4-2NF.
The paint coating was applied with the following:
- -
- Topcoat 1—which is water-based: Seevenax 311-83;
- -
- Topcoat 2—which is solvent-based: 446-22-1000.
The primer and topcoat were carried out according to the manufacturer’s recommendations on the data sheet.
Two experiments were performed as follows:
In the case of Experiment 1, combining the parameters resulted in a total number of 1 × 3 × (2 + 2) = 12 specimen types, as follows:
- -
- 1 material;
- -
- 3 anodizations;
- -
- 1 primer (2 specimens);
- -
- 1 primer + topcoats (2 specimens).
In the case of Experiment 2, combining the parameters resulted in a total number of 1 × 1 × 2 × (2 + 2) = 8 specimen types, as follows:
- -
- 1 material;
- -
- 1 anodization;
- -
- 2 primers (2 specimens);
- -
- 2 primers + topcoats (2 specimens).
For Experiment 2, it should be noted that 50% of the experimental results were obtained from Experiment 1. Thus, for Experiment 2, only four specimens were needed (one material; one anodizing; one primer (2 specimens); one primer + topcoat (2 specimens).
Following the preparation of the specimens, crosscut tests were then performed. In the following paragraph, the whole working procedure is presented.
5.3. Performing Crosscut Tests
The aerospace industry frequently uses crosscut testing, also commonly referred to as crosshatch testing, to evaluate the coating and adhesion quality of aerospace materials. In the crosscut test, the coating is sliced into a grid pattern, and the length of coating failure at each cut is measured. This technique is used to evaluate the coating’s adherence qualities and is regarded as a crucial sign of the coating’s overall effectiveness.
Aluminum, composites, and painted surfaces are just a few of the materials used in crosscut testing for the aerospace industry. The ASTM D3359 Standard Test Methods for Measuring Adhesion by Tape Test, which offers guidance on the interpretation of crosscut test findings, is one standard rating system that is used to evaluate crosscut test results [37].
Using the crosscut test method, researchers in [38] investigated the adhesion characteristics of coatings on aeronautical materials. They discovered that the findings of the crosscut test were a trustworthy predictor of the coating’s adhesive qualities and could be applied to foretell the coating’s general performance under real-world circumstances.
The impact of surface preparation on the outcomes of the crosscut test of aerospace coatings was examined in [39]. According to the findings of the crosscut test, it was discovered that good surface preparation considerably increased the adhesive qualities of the coatings.
The relationship between the outcomes of crosscut tests and the performance of aerospace coatings in actual use was investigated in [40]. It was discovered that the coatings’ real-world performance, including their resistance to corrosion, abrasion, and environmental exposure, could be predicted quite well from the results of crosscut tests.
The authors in [41] investigated how various coating materials affected the outcomes of crosscut tests on aerospace materials. They discovered that the crosscut test findings, which showed that various coating materials had differing levels of adhesion, might be utilized to improve coating selection for certain aeronautical applications.
The authors in [42] looked at how aircraft coating thickness affected the outcomes of crosscut tests. According to the findings of the crosscut test, they discovered that the coating thickness had a substantial influence on adhesive qualities and that thicker coatings typically had greater adhesion properties than thinner coatings.
When performing the crosscut test, whose result is greatly influenced by the operator, to obtain accurate experimental data on the same surface, three crosscuts are made independently, each one is evaluated, and the lower value is considered the result obtained. The calculation of averages is not used.
On each specimen, the test is performed three times. In this context, a total of 16 × 3 pull-off measurements were performed in the second experiment.
5.4. Measurement of Paint Thickness Layers
The measurement of the thickness of the paint layers and the thickness of the anodic layer was made with an Isoscope FMP30.
The Isoscope FMP30 is a surface roughness measurement instrument designed and manufactured by Fischer Measurement Technologies (Fischer MT, Windsor/United States). It is used to measure the surface roughness of various materials, including metals, plastics, ceramics, and composites. The technical details related to the Isoscope FMP30’s capabilities for measuring paint and anodic layer thicknesses are presented below [43,44,45,46]:
- Measurement principle: In addition to measuring surface roughness, the Isoscope FMP30 can also be used to measure coating thickness. The instrument uses a non-destructive eddy current method to measure the thickness of non-conductive coatings on conductive substrates.
- Measurement range: The Isoscope FMP30 can measure coating thicknesses ranging from 0.1 µm to 3 mm, with a resolution of 0.01 µm.
- Measurement modes: The instrument has several measurement modes, including a single-point mode for spot measurements and scan mode for measuring larger areas.
- Calibration: The Isoscope FMP30 requires calibration using a known standard of the same material and thickness as the coating being measured.
- Coating types: The instrument can measure a wide range of coatings, including paint, anodized coatings on aluminum, and coatings on steel and other metals.
- Statistics: The instrument can calculate statistical values for the measured coating thickness, including minimum, maximum, and average values.
- Display: The instrument features a large, high-resolution color display that shows measurement results, measurement parameters, and instrument settings.
- Data storage: The Isoscope FMP30 can store up to 20,000 measurement results, which can be transferred to a computer for further analysis.
- Accessories: The Isoscope FMP30 comes with several accessories, including a carrying case, calibration standards, a probe stand, and a USB cable for data transfer.
- Additional capabilities: The Isoscope FMP30 also has additional capabilities, including the ability to measure the thickness of anodic coatings on aluminum substrates, as well as the ability to measure the electrical conductivity of materials.
6. Experimental Data Processing
The experimental data obtained during the research are presented in Table 1.

Table 1.
Experimental data.
6.1. Study of the Influence of the Nature of the Anode Layer on the Resistance of Paint Coatings
In the first experiment, the influence of the anode layer on the adhesion of the primer and the primer and topcoat assembly on these surfaces was studied. Through this study, it was possible to identify an assembly of protective layers consisting of an anode layer + primer + topcoat which has the highest resistance to breakage. The higher the breaking strength of the protective layer, the longer the corrosion protection applied to the part will last.
The pull-off force data for the first experiment are shown in Table 1, rows 1–12.
To determine the influence of the nature of the anode layer on the resistance of paint coatings, the experimentally acquired data were also subjected to statistical analysis.
Multi-sample comparison is a statistical method used to compare several groups or samples in a single analysis. This method is often used in research studies to determine if there are significant differences between the means or other statistics of multiple groups. For this purpose, the method was used to analyze the coating thickness of the anode + topcoat (CTA + TC) (nm), coating thickness of the anode (CTA) (nm) and topcoat thickness (TCT) (nm) (Figure 1).
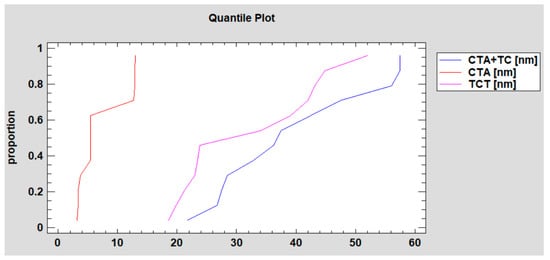
Figure 1.
The quantile plots.
The visual method called the quantile plot is used to determine if a piece of data fits into a certain distribution, such the normal distribution.
In Figure 1, the quantity deposited along the abscissa axis represents the cumulative distribution function (CDF) of a variable. The CDF provides information about the probability distribution of the variable and shows how the values are distributed across the dataset. The abscissa axis typically represents the range of values of the variable, while the ordinate axis represents the corresponding cumulative probabilities. By plotting the quantiles of the variable against their expected values, the quantile plot provides insights into the distributional characteristics of the data, such as skewness, kurtosis, or departures from normality.
In the graph, the quantiles of the data that were seen are compared to the quantiles that would be anticipated if the data had followed the predicted distribution. The quantile plot not only identifies deviations from a certain distribution but includes outliers and other characteristics of the data, such as skewness or kurtosis. As a result, it is a helpful tool for exploratory data analysis and can reveal the fundamental structure of the data.
In Table 2, the summary statistics are presented.

Table 2.
Summary Statistics.
Using summary statistics, three types of measurements were analyzed as follows: CTA + TC, CTA, and TCT. Each type had a count of 12 measurements, making a total of 36 measurements in the analysis. The average (mean) CTA + TC measurement was 39.3292 nanometers (nm) with a standard deviation of 12.7815 nm. The coefficient of variation (CV), which measures the relative variability of the data, was 32.4988%. The smallest CTA + TC measurement was 21.7 nm. The average CTA measurement was 7.22333 nm with a standard deviation of 4.2354 nm. The CV for the CTA was relatively high at 58.635%, indicating a high degree of variability in the data. The smallest CTA measurement was 3.19 nm. The average TCT measurement was 32.1058 nm with a standard deviation of 11.721 nm. The CV for the TCT was 36.5073%. The smallest TCT measurement was 18.51 nm. When considering all 36 measurements together, the average was 26.2194 nm with a standard deviation of 17.1664 nm. The overall CV was 65.4719%. The smallest measurement across all types was 3.19 nm. In general, the data show considerable variability with high coefficients of variation for the CTA and total measurements.
For the three separate measurement types (CTA + TC, CTA, and TCT) as well as for all measurements combined, the summary statistics additionally include data on the maximum value, range, standardized skewness, and standardized kurtosis (total). The range of results for CTA + TC was 35.81 nm, with a maximum measurement value of 57.51 nm, showing that there is a sizable degree of variance in the data. The data are somewhat positively skewed, with a normalized skewness score of 0.478018, implying that there may be lower values than higher ones, but the skewness is not excessive. The data’s distribution is marginally platykurtic, or flatter at the peak than a normal distribution, according to the standardized kurtosis value of −0.944209. The greatest value for CTA measurements was 12.95 nm, while the range was 9.76 nm. The data are positively skewed, as shown by the standardized skewness value of 0.938441, and the distribution is leptokurtic, having a larger peak and heavier tails than a normal distribution, as indicated by the standardized kurtosis value of −1.16315. TCT readings had a maximum value of 52.02 nm and a range of 33.51 nm. The data are somewhat positively skewed, as indicated by the standardized skewness value of 0.486809, and the platykurtic distribution is indicated by the standardized kurtosis value of −1.09239. When all measurements were considered, the range was 54.32 nm, with the highest value being 57.51 nm. The data are positively skewed, as shown by the standardized skewness value of 0.664417, and the distribution is leptokurtic, as indicated by the standardized kurtosis value of −1.28016. The kurtosis values indicate that the data have non-normal distributions with either a flatter peak (platykurtic) or a higher peak and heavier tails. Overall, the data appears to be somewhat positively skewed (leptokurtic). To ascertain if the variations between the measurement kinds are statistically significant, these attributes will be further investigated using graphical analysis or hypothesis testing.
The ANOVA table (Table 3) and the plot (Figure 2) present the results of an analysis of variance (ANOVA) test, which compares the variation between groups to the variation within groups. The purpose of the test is to assess whether there is a significant difference between the means of two or more groups. A low p-value of 0.0000 for the “Between groups” row of results shows that there is a significant difference between the means of the three groups. The F ratio of 32.05 also implies that the variance between the groups is significantly bigger than the variation within the groups, indicating that the variations between groups are not likely to be attributable to random chance.

Table 3.
ANOVA Table.
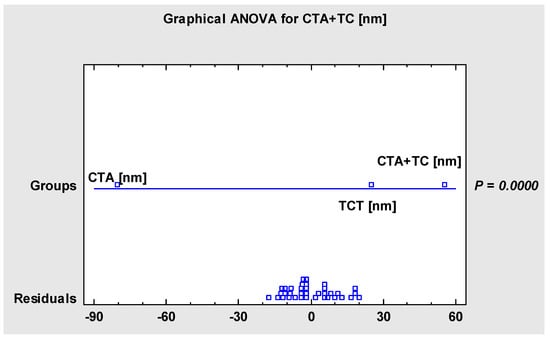
Figure 2.
Graphical ANOVA for CTA + TC.
Table 4 and Figure 3 and Figure 4 provide means for the three separate measurement types-CTA + TC, CTA, and TCT-as well as the sum of the three means. The means are accompanied by standard errors, lower and upper bounds, and 95% LSD intervals. Overall, these numbers may be used to compare the means of the various measurement kinds and ascertain whether they deviate from one another considerably. To evaluate if any detected differences are statistically significant, one might utilize the LSD intervals.

Table 4.
Table of means with 95% LSD intervals.
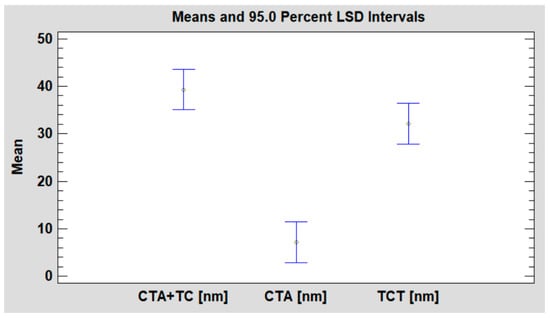
Figure 3.
The means plot.
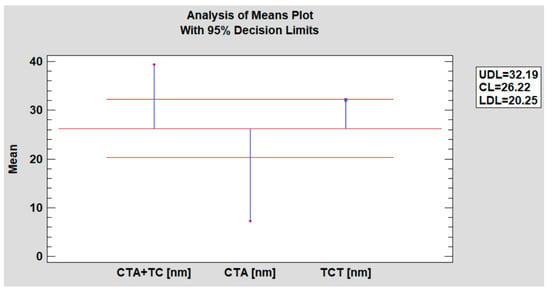
Figure 4.
Analysis of means plot.
Table 5 displays the outcomes of multiple range tests using the 95% LSD approach for three different measurement types: CTA, TCT, and CTA + TC. The homogenous groups, significant differences, and limitations for the various contrasts are also shown in the table. The homogenous groups are represented in the table by the letter “X”, signifying that, at a 95% confidence level, there are no significant variations between the group means. The comparisons in the table highlight the notable variations in each group’s mean values. The difference is statistically significant at the 95% confidence level, according to the “*” mark next to the significance level.

Table 5.
Multiple Range Tests. Method: 95% LSD.
The first contrast displayed shows a substantial difference of 32.1058 nm: CTA + TC (nm) − CTA (nm). According to the +/− limitations, the actual distance between the means is between 8.56066 nm and 55.65094 nm. According to this, the mean of CTA + TC is noticeably greater than the mean of CTA. The second contrast, CTA + TC (nm) − TCT (nm), is not statistically different from the first. The bounds (−15.36645 nm to 29.81311 nm) suggest that the genuine difference may lie within the range where the means are not statistically different, even though the difference between the means is 7.22333 nm. CTA (nm) − TCT (nm) is the third contrast displayed, with a significant difference of –24.8825 nm. The negative sign denotes a substantial difference between the means of CTA and TCT. The bounds (+/−−8.56066 nm) suggest that the real range of the mean difference is between −33.44316 nm and −16.32184 nm.
To compare the variances of the three separate groups—CTA + TC (nm), CTA (nm), and TCT (nm), this data reflects a variance check using Levene’s test (Table 6). The alternative hypothesis in Levene’s test is that at least one variance is different, whereas the null hypothesis is that the variances of the groups are identical. As Levene’s test’s p-value in this instance is less than 0.05, it may be deduced that there is sufficient evidence to reject the null hypothesis and reach the opposite conclusion regarding the equality of the variances across the three groups. The data compare the F ratio and p-value for each pairwise combination of groups to further analyze which groups have statistically different variances. A p-value of less than 0.05 shows that the variances are substantially different and is used to determine the F ratio, which is the ratio of the bigger to the smaller variance. In this case, the variances of the CTA + TC (nm) and CTA (nm) groups differ considerably (p = 0.0010), although the variances of the other two pairwise comparisons (CTA + TC (nm)/TCT (nm) and CTA (nm)/TCT (nm)) do not differ significantly (p > 0.05).

Table 6.
Variance Check.
The Kruskal–Wallis test is a non-parametric test used to compare three or more independent groups when the assumption of normality is broken. In this instance, the test was used to compare the average rank of the three groups (Table 7). There is a statistically significant difference between the groups, as shown by the test statistic of 24.2898 and the p-value of 0.00000531544. For all conceivable pairwise comparisons between the three groups, the 95% Bonferroni intervals are shown. After accounting for multiple comparisons, the symbols (*) next to the contrast show that there is a statistically significant difference between the groups. This difference must be greater than 0.05. CTA + TC (nm), CTA (nm), and TCT (nm) all have average ranks of 26.5833, 6.5, and 22.4167, respectively. The CTA + TC (nm) group has a considerably higher rank than the CTA (nm) and TCT (nm) groups according to the Bonferroni intervals, with a difference of 20.0833 and 4.16667, respectively. Moreover, with a difference of −15.9167 and −10.2969, respectively, between the CTA (nm) group’s rank and that of the CTA + TC (nm) and TCT (nm) groups, the CTA (nm) group performs far worse. The difference in rank between the CTA + TC (nm) and TCT (nm) groups, which is 10.2969, is not, however, statistically significant.

Table 7.
Kruskal–Wallis Test.
A non-parametric test called the Mood’s Median Test may be used to evaluate if two or more samples originate from populations that have the same median (Table 8). The test statistic is 20.6667, and the associated p-value is 0.0000325305, which is below the threshold of 0.05 for significance. This shows that the null hypothesis—that the three samples originate from populations with the same median—is strongly refuted. The grand median is 23.61, while the table below displays the median for each sample. For each median, the 95% confidence intervals are also included. For each sample, the number of observations above and below the median is shown. The median for the sample CTA (nm) is 5.415, which is considerably less than the medians for the other two samples. In comparison to the medians of the other two samples, the sample CTA + TC (nm) has a median of 36.9, which is a considerable increase. The median value for the TCT (nm) sample is 28.95, which is in the middle of the median value for the other two samples but considerably different from both. The CTA + TC (nm) and CTA (nm) samples have substantially different medians, according to the results of the Mood’s Median Test, which indicates that the three samples came from populations with distinct medians.

Table 8.
Mood’s Median Test. Total n = 36, Grand median = 23.61.
The average forces (kN) were the dependent variable in the multifactorial ANOVA study, while anodizing and coating were the independent variables. The findings are shown below. The goal of the analysis is to establish if anodizing and coating have a substantial impact on the dependent variable.
Based on Table 9 and Figure 5, both variables significantly affect the average forces, according to the ANOVA table. The conventional alpha threshold for establishing statistical significance is 0.05, and the p-values for both components are less than this number. This indicates that the average pressures between the various stages of anodizing and coating varied significantly.

Table 9.
Analysis of Variance for Average Forces (kN)—Type III Sums of Squares.
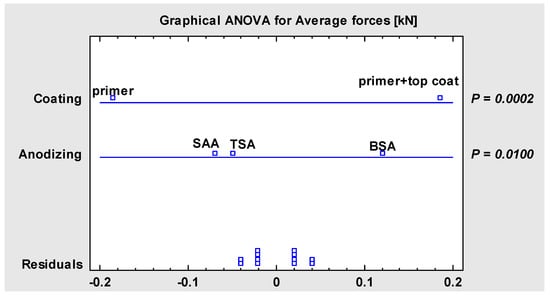
Figure 5.
Graphical ANOVA for average forces.
The mean and confidence intervals for each degree of anodizing and coating are displayed in the 10 of least squares means (Table 10). The dependent variable’s entire mean, 1.0835 kN, is the grand mean. Together with the standard error and lower and upper bounds of the confidence interval, the means of the average forces for each degree of anodizing and coating are also given (Figure 6).

Table 10.
Table of Least Squares Means for Average Forces (kN) with 95% Confidence Intervals.
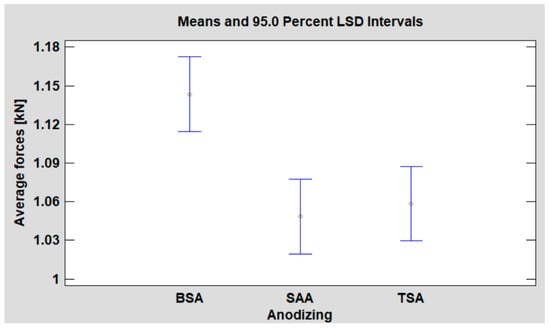
Figure 6.
Graph of Means.
The pairwise comparison of the anodizing levels using the least significant difference (LSD) technique is displayed in the multiple range tests (Table 11). The LSD procedure is a post hoc test designed to identify the groups that differ significantly from one another. At each degree of anodization, the table displays the mean, standard deviation, and homogenous groups. The contrasting table illustrates the notable variations in anodizing levels (Figure 7).

Table 11.
Multiple Range Tests for Average Forces (kN) by Anodization. Method: 95% LSD.
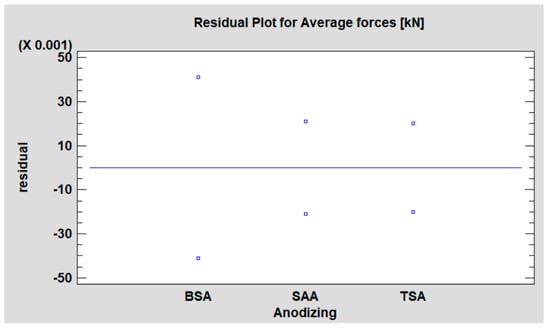
Figure 7.
Residuals versus factor levels for average forces.
Overall, this research sheds light on how anodizing and coating relate to the dependent variable, average forces (kN). The amounts of anodization differ significantly, as shown by the ANOVA and multiple range tests, and the least squares means offer a mechanism to compare the means of each group with confidence intervals.
Another multifactorial ANOVA analysis was conducted on the dependent variable “Average resistance (N/mm2)”, with two factors, “Anodizing” and “Coating”. The analysis is based on 12 complete cases (Table 12 and Figure 8).

Table 12.
Analysis of Variance for Average Resistance (N/mm2)—Type III Sums of Squares.
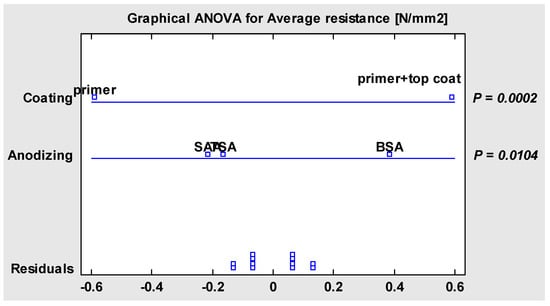
Figure 8.
Graphical ANOVA for average resistance.
With F ratios of 8.52 and 40.04, respectively, the ANOVA table demonstrates that both main effects of anodizing and coating are statistically significant at p = 0.05. Also shown is the residual mean square error.
The average resistance (N/mm2) for each degree of anodizing and coating is displayed in the table of least squares means (Table 12) along with the mean, standard error, and 95% confidence intervals. The grand mean is 3.44833 N/mm2 (Table 13). At a statistical significance level of p = 0.05, the means for the two levels of coating show that the primer plus topcoat has a stronger resistance (3.65667 N/mm2) than the primer alone (3.24 N/mm2). The BSA has the strongest resistance (3.64 N/mm2), followed by the TSA (3.365 N/mm2) and SAA (3.34 N/mm2), and the averages for the three degrees of anodizing are likewise statistically significant at p = 0.05 (Figure 9).

Table 13.
Table of Least Squares Means for Average Resistance (N/mm2) with 95% Confidence Intervals.
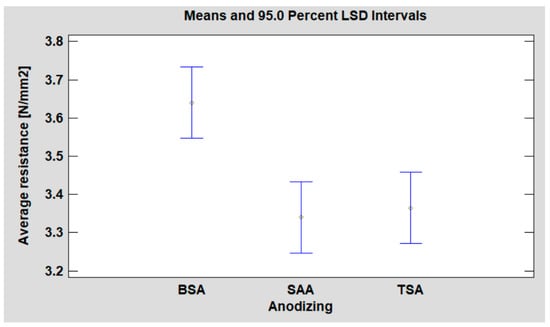
Figure 9.
Table of means for average resistance.
The three anodization levels are substantially different from one another, according to the multiple range tests for average resistance (N/mm2) by anodization, which have a p-value of 0.05 (Table 14). The homogenous groups were identified based on this test, which calculated the least significant difference between means using the LSD technique (Figure 10).

Table 14.
Multiple Range Tests for Average Resistance (N/mm2) by Anodization. Method: 95% LSD.
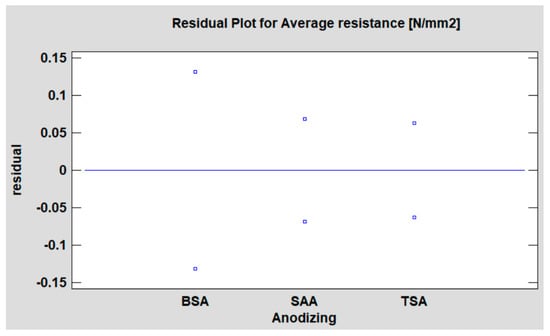
Figure 10.
Residuals versus factor levels for average resistance.
The results indicate that coating and anodizing both significantly affect average resistance (N/mm2), with primer + topcoat being the most effective amount of coating and BSA being the most effective level of anodization.
6.2. Study of the Adhesion of Primers and Coatings Depending on Their Type on the Al7075 Surface
In the second experiment, the adhesion of the primer and topcoat layers was studied according to their type. In the experiment, the adhesion to the anodic start of the BSA-type primer and solvent-based topcoat, i.e., water-based topcoat, was studied. The objective of the experiment was to determine which primer + water-based topcoat or primer + solvent-based topcoat had better adhesion to the surface of the BSA-coated 7075 alloy. The experiment used water-based primer, Seevenax 313-01; water-based topcoat, Seevenax 311-83; solvent-based primer, 10P4-2NF; and solvent-based topcoat, 446-22-1000.
For the second study, a multiple variable analysis was performed, where the relationship between five variables was explored: CTA + TC (nm), CTA (nm), TCT (nm), average forces (kN), and average resistance (N/mm2).
There were eight complete examples used, which indicated that each variable’s eight values were considered in the analysis and there were no missing values.
To investigate the link between the variables, a correlation analysis is carried out. The correlation coefficient had a range of −1 to +1, with +1 denoting a perfect positive connection and −1 denoting a perfect negative correlation. The p-value shows the likelihood of discovering such a correlation coefficient via pure chance (Figure 11).
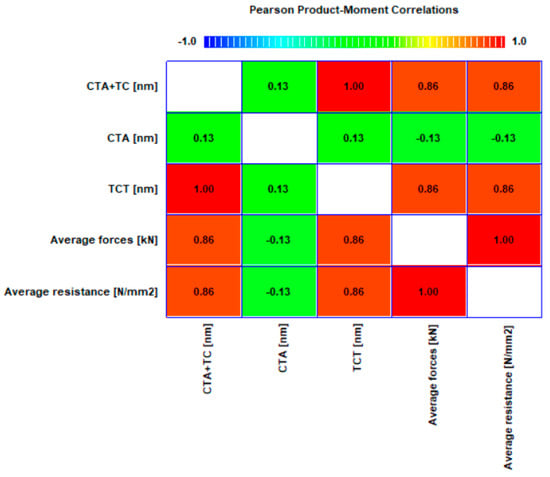
Figure 11.
Correlation Plot.
Both Spearman’s rank and Pearson’s correlation coefficients were employed. The linear relationship between variables was measured by Pearson’s correlation, while the monotonic relationship is measured by Spearman’s rank correlation.
Overall, our report offers a thorough study of the correlation between the variables and offers helpful data for additional investigation.
Next, a neural network Bayesian classifier was trained and validated on a dataset with two classes: solvent and water (Table 15 and Table 16).

Table 15.
Training Set.

Table 16.
Validation Set.
The average forces and average resistance served as the input variables, and the coating type served as the classification factor. The mistake costs were the same for all classes and prior probability provided no useful information. During training, jackknifing was employed to maximize the spacing parameter, which was set at 0.
The classifier classified both solvent and water coatings in the training set with 100% accuracy after being trained on a dataset comprising eight instances (Figure 12). To evaluate the classifier’s performance on fresh data, there was, however, no validation set available.
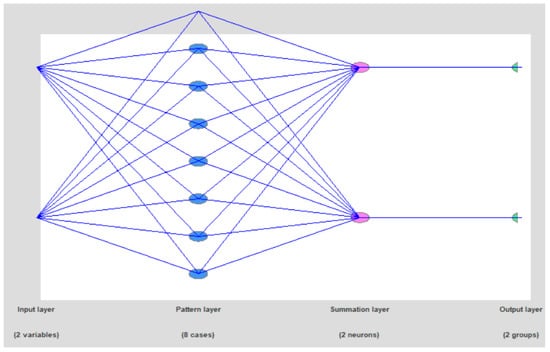
Figure 12.
Network Diagram.
The classification table revealed that all training instances—four cases of solvent and four cases of water—were accurately categorized (Table 17 and Figure 13). The mistake costs were both 1.0 and the prior probability for each class was 0.5.

Table 17.
Classification Table.
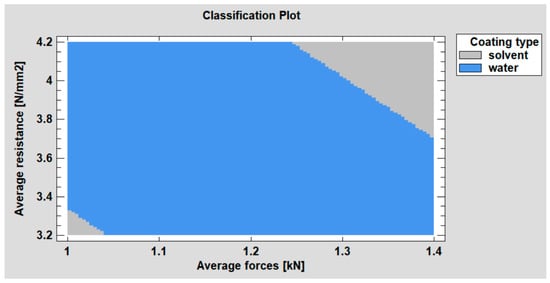
Figure 13.
Classification Plot.
The nearest and second nearest neighbors for each row in the dataset are listed in the report’s table of nearest neighbors. Cases that were misclassified are indicated with an asterisk.
This report’s findings generally imply that the neural network Bayesian classifier was successful in accurately categorizing the coating type of the training data.
Following this, the “Coating” categorization factor has two classes: “Primer” and “Primer + topcoat.” The prior probabilities are non-informative, which means that there is no previous knowledge on the likelihood of either class. The fact that all classes’ mistake costs are equivalent means that there is no penalty for misclassifying an observation (Table 18 and Table 19).

Table 18.
Training Set.

Table 19.
Validation Set.
The model was tested on a dataset with no cases after being trained on an 8-case dataset (Figure 14). The model accurately categorized each observation in the training set with a classification accuracy of 100%. The model was not evaluated for generalization performance on fresh, untested data because the validation set was likewise 0.
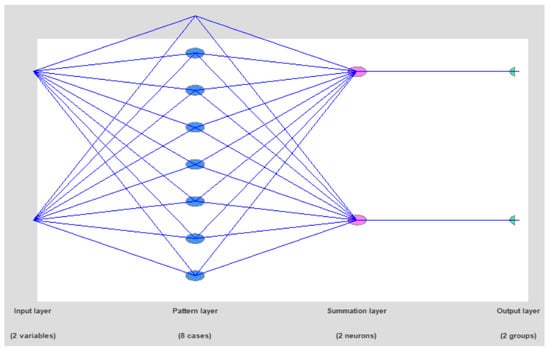
Figure 14.
Network Diagram.
The classification table and plot demonstrate that all four observations in the “Primer” class and all four observations in the “Primer + topcoat” class were correctly categorized (Table 20 and Figure 15). There were no misclassifications, as proven by the absence of the nearest neighbors and their distances.

Table 20.
Classification Table.
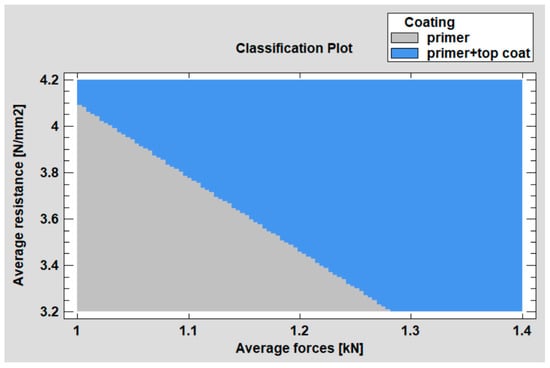
Figure 15.
Classification plot.
In conclusion, our model perfectly predicted the kind of coating based on average forces and resistance on the training set.
7. Results and Discussions
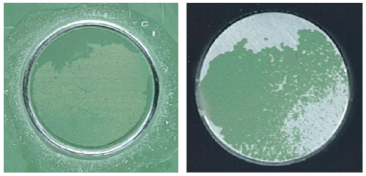
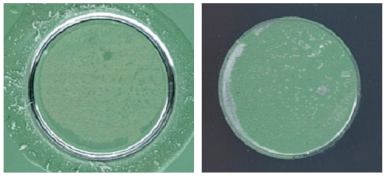
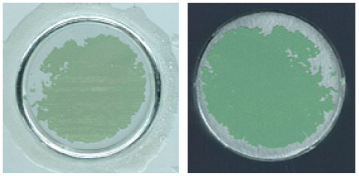
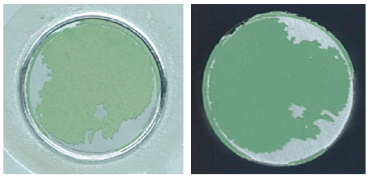
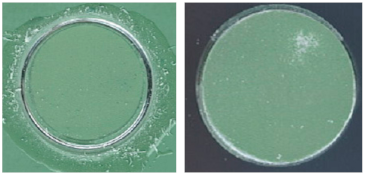
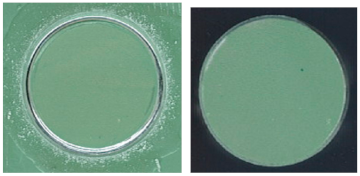
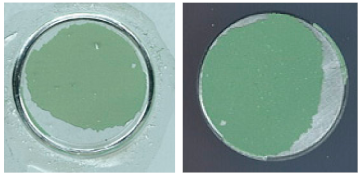
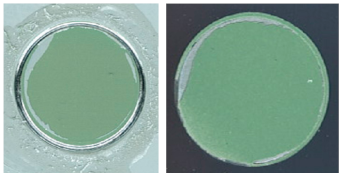
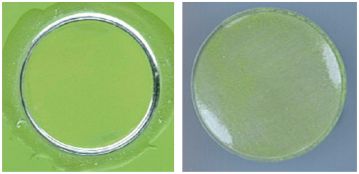
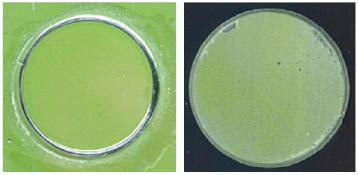
The results show that the primer improved the adhesion of the coatings on both aluminum alloys compared to unprimed specimens. Anodizing provided better adhesion and corrosion resistance compared to painting on Al7175. The results indicate that the type of coating applied plays a significant role in determining the adhesion and corrosion resistance of the coatings (Table 21 and Table 22).

Table 21.
Centralized table with results of crosscut tests of specimens used in experiments.

Table 22.
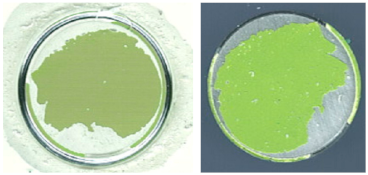
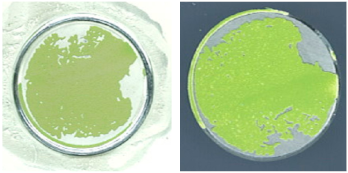
Selection table with specimens after pull-off adhesion test.
Adhesion to the anodized BSA surface: There were no differences in the adhesion to the primer between the solvent-based and water-based primers. However, the tensile strength of the solvent-based primer was 2.5% lower compared to the water-based primer.
Adhesion strength of the protective coating: Specimens painted with primer + topcoat showed an increase in adhesion strength. In all cases, breakage occurred in the primer layer, and no breakage was observed in the topcoat layer. The breakage consistently occurred in the primer or around the contact between the adhesive and the topcoat layer.
Pull-off strength after topcoat deposition: Following the deposition of the topcoat over the primer layer, the pull-off strength of the primer layer increased by 20.6% for the water-based topcoat primer and 29.8% for the solvent-based topcoat primer.
Comparison of water-based and solvent-based topcoats: The pull-off strength of the solvent-based topcoat was 10.5% higher than that of the water-based topcoat. This higher strength indicates a longer service life and improved wear resistance of the solvent-based coating.
Abrasion resistance: During the manual sanding of the topcoat, it was observed that the solvent-based topcoat exhibited higher abrasion resistance compared to the water-based topcoat. Further research will be conducted to determine the exact difference in abrasion resistance through measurements.
Overall coating quality: Based on the crosscut test, coatings with both the water-based and solvent-based primers/topcoats demonstrated superior quality.
These findings highlight the performance characteristics and comparative strengths of the different coatings and provide valuable insights for future research and practical applications.
8. Conclusions
Finally, this study gives useful insights into the performance characteristics and comparative merits of various coating processes for aluminum alloys, with a particular emphasis on the aerospace sector. The results show that using a primer greatly increases coating adherence on aluminum alloys when compared to unprimed specimens. When compared to painting on Al7175, anodizing outperforms painting in terms of adhesion and corrosion resistance.
The findings emphasize the effect of coating type on coating adherence and corrosion resistance. Adhesion to the anodized BSA surface was the same between the solvent-based and water-based primers, while the solvent-based primer had a 2.5% lower tensile strength than the water-based primer.
Furthermore, specimens painted with a primer + topcoat showed higher adhesion strength, with breakdown happening consistently in the primer layer or along the interface between the adhesive and the topcoat layer. Deposition of the topcoat layer over the primer layer increased the pull-off strength of the primer layer by 20.6% for the water-based topcoat primer and 29.8% for the solvent-based topcoat primer.
When water-based and solvent-based topcoats were compared, the solvent-based topcoat had a 10.5% greater pull-off strength, implying a longer service life and enhanced wear resistance for this coating. Furthermore, hand sanding observations showed that the solvent-based topcoat had greater abrasion resistance than the water-based topcoat, albeit more study is needed to quantify the difference in abrasion resistance.
The crosscut test results showed the better quality of coatings based on both water-based and solvent-based primers/topcoats.
Overall, this study makes a theoretical contribution by identifying and investigating several coating processes and their impact on the adhesion and corrosion resistance of aluminum alloy 7175. It also highlights the need to control process variables to improve the function and quality of anodized aluminum alloys. Furthermore, practical advice for the selection of coating processes based on the unique properties of the aluminum alloy and application requirements are presented.
Further study is suggested to expand the understanding and control of the process parameters, as well as to improve the long-term performance and reliability of various coating processes. This study emphasizes the need for continuing research into the impact of different coating techniques on the adhesion and corrosion resistance of aluminum alloys used in the aerospace industry.
Finally, this work adds to a better knowledge of the properties and performance of anodized aluminum alloys, emphasizing the need for selecting the optimum coating process to improve durability and corrosion resistance. It also emphasizes the need for more study to enhance the understanding and control of process parameters, as well as to investigate the long-term performance and dependability of various coating processes.
Author Contributions
Conceptualization, S.R.-N., A.B.P. and A.M.T.; methodology, A.M.T. and A.B.P.; software, A.B.P.; validation, A.M.T., A.B.P. and S.R.-N.; formal analysis, A.B.P.; investigation, S.R.-N.; resources, S.R.-N. and A.B.P.; data curation, A.B.P., A.M.T. and S.R.-N.; writing—original draft preparation, A.B.P., A.M.T. and S.R.-N.; writing—review and editing, A.M.T., A.B.P. and S.R.-N.; visualization, S.R.-N., A.B.P. and A.M.T.; supervision, A.M.T., A.B.P. and S.R.-N.; project administration, A.B.P. and S.R.-N. All authors have read and agreed to the published version of the manuscript.
Funding
This research received no external funding.
Institutional Review Board Statement
Not applicable.
Informed Consent Statement
Not applicable.
Data Availability Statement
Not applicable.
Conflicts of Interest
The authors declare no conflict of interest.
References
- Wang, Q.; Rui, X.; Wang, Q.J.; Bai, Y.; Du, Z.Z.; Niu, W.J.; Wang, W.; Wang, K.S.; Gao, Y. Bonding and wear behaviors of supersonic plasma sprayed Fe-based coatings on Al-Si alloy substrate. Surf. Coat. Technol. 2019, 367, 288–301. [Google Scholar] [CrossRef]
- Omar, N.i.; Yamada, M.; Yasui, T.; Fukumoto, M. Bonding Mechanism of Cold-Sprayed TiO2 Coatings on Copper and Alu-minum Substrates. Coatings 2021, 11, 1349. [Google Scholar] [CrossRef]
- Veys-Renaux, D.; Chahboun, N.; Rocca, E. Anodizing of multiphase aluminium alloys in sulfuric acid: In-situ electrochemical behaviour and oxide properties. Electrochim. Acta 2016, 211, 1056–1065. [Google Scholar] [CrossRef]
- Stavropoulos, P.; Bikas, H.; Bekiaris, T. Combining Process and Machine Modelling: A Cold Spray Additive Manufacturing Case. Procedia CIRP 2020, 95, 1015–1020. [Google Scholar] [CrossRef]
- Raghavendra, C.; Basavarajappa, S.; Sogalad, I.; Saunshi, V.K. Study on surface roughness parameters of nano composite coatings prepared by electrodeposition process. Mater. Today Proc. 2021, 38, 3110–3115. [Google Scholar] [CrossRef]
- Wang, G.; Liu, H.; Chen, T.; Zhang, X.; Li, H.; Yu, Y.; Yao, H. Comparative investigation on thermal corrosion of alloy coatings in simulated waste incinerator environment. Corros. Sci. 2021, 189, 109592. [Google Scholar] [CrossRef]
- Suzuki, Y.; Kawahara, K.; Kikuchi, T.; Suzuki, R.O.; Natsui, S. Corrosion-Resistant Porous Alumina Formed via Anodizing Aluminum in Etidronic Acid and Its Pore-Sealing Behavior in Boiling Water. J. Electrochem. Soc. 2019, 166, C261–C269. [Google Scholar] [CrossRef]
- Kaseem, M.; Fatimah, S.; Nashrah, N.; Ko, Y.G. Recent progress in surface modification of metals coated by plasma electrolytic oxidation: Principle, structure, and performance. Prog. Mater. Sci. 2021, 117, 100735. [Google Scholar] [CrossRef]
- Lv, J.; Chen, Z.-L.; Tang, J.; Chen, L.; Xie, W.-J.; Sun, M.-X.; Huang, X.-J. Study on the superhydrophilic modification and enhanced corrosion resistance method of aluminum alloy distillation desalination tubes. Surf. Coat. Technol. 2022, 446, 128770. [Google Scholar] [CrossRef]
- Başalan, E.; Erol, M.; Sancakoğlu, O.; Dikici, T.; Çelik, E. Comparison of processing parameter effects during magnetron sputtering and electrochemical anodization of TiO2 nanotubes on ITO/glass and glass substrates. Mater. Test. 2021, 63, 245–252. [Google Scholar] [CrossRef]
- İzmir, M.; Ercan, B. Anodization of titanium alloys for orthopedic applications. Front. Chem. Sci. Eng. 2019, 13, 28–45. [Google Scholar] [CrossRef]
- Guo, F.; Cao, Y.; Wang, K.; Zhang, P.; Cui, Y.; Hu, Z.; Xie, Z. Effect of the Anodizing Temperature on Microstructure and Tribological Properties of 6061 Aluminum Alloy Anodic Oxide Films. Coatings 2022, 12, 314. [Google Scholar] [CrossRef]
- Wang, R.; Wang, L.; He, C.; Lu, M.; Sun, L. Studies on the sealing processes of corrosion resistant coatings formed on 2024 aluminum alloy with tartaric-sulfuric anodizing. Surf. Coat. Technol. 2019, 360, 369–375. [Google Scholar] [CrossRef]
- Zhang, Y.; Chen, Y.; Bian, G.; Zhang, Y. Electrochemical behavior and corrosion mechanism of anodized 7B04 aluminum alloy in acid NaCl environments. J. Alloys Compd. 2021, 886, 161231. [Google Scholar] [CrossRef]
- Acar, M.T.; Kovacı, H.; Çelik, A. Improving the wettability and corrosion behavior of Cp-Ti by applying anodization surface treatment with the addition of boric acid, graphene oxide and hydroxyapatite. Mater. Today Commun. 2022, 31, 103683. [Google Scholar] [CrossRef]
- Ramirez, O.M.P.; Tunes, M.A.; Mennucci, M.M.; Starykevich, M.; Neves, C.; Ferreira, M.G.; Pogatscher, S.; De Melo, H.G. Ce post-treatment for increased corrosion resistance of AA2024-T3 anodized in tartaric-sulfuric acid. Corros. Sci. 2022, 204, 110371. [Google Scholar] [CrossRef]
- Quebbou, Z.; Chafi, M.; Omari, L.E.H. Corrosion resistance of 5005 aluminum alloy by anodizing treatment in a mixture of phosphoric and boric acids. Mater. Today Proc. 2021, 37, 3854–3859. [Google Scholar] [CrossRef]
- Musza, A.; Ugi, D.; Vida, Á.; Chinh, N.Q. Study of Anodic Film’s Surface and Hardness on A356 Aluminum Alloys, Using Scanning Electron Microscope and In-Situ Nanoindentation. Coatings 2022, 12, 1528. [Google Scholar] [CrossRef]
- Fiore, V.; Di Franco, F.; Miranda, R.; Santamaria, M.; Badagliacco, D.; Valenza, A. Effects of anodizing surface treatment on the mechanical strength of aluminum alloy 5083 to fibre reinforced composites adhesive joints. Int. J. Adhes. Adhes. 2021, 108, 102868. [Google Scholar] [CrossRef]
- Paz Martínez-Viademonte, M.; Abrahami, S.T.; Hack, T.; Burchardt, M.; Terryn, H. A review on anodizing of aerospace aluminum alloys for corrosion protection. Coatings 2020, 10, 1106. [Google Scholar] [CrossRef]
- Proença, C.S.; Serrano, B.; Correia, J.; Araújo, M.E.M. Evaluation of tannins as potential green corrosion inhibitors of aluminum alloy used in aeronautical industry. Metals 2022, 12, 508. [Google Scholar] [CrossRef]
- Miramontes, J.C.; Tiburcio, C.G.; Mata, E.G.; Alcála, M.E.; Maldonado-Bandala, E.; Lara-Banda, M.; Nieves-Mendoza, D.; Olguín-Coca, J.; Zambrano-Robledo, P.; López-León, L.D.; et al. Corrosion Resistance of Aluminum Alloy AA2024 with Hard Anodizing in Sulfuric Acid-Free Solution. Materials 2022, 15, 6401. [Google Scholar] [CrossRef] [PubMed]
- Peltier, F.; Thierry, D. Review of Cr-Free Coatings for the Corrosion Protection of Aluminum Aerospace Alloys. Coatings 2022, 12, 518. [Google Scholar] [CrossRef]
- Del Olmo, R.; Tiringer, U.; Milošev, I.; Visser, P.; Arrabal, R.; Matykina, E.; Mol, J. Hybrid sol-gel coatings applied on anodized AA2024-T3 for active corrosion protection. Surf. Coat. Technol. 2021, 419, 127251. [Google Scholar] [CrossRef]
- Dervishi, E.; McBride, M.; Edwards, R.; Gutierrez, M.; Li, N.; Buntyn, R.; Hooks, D.E. Mechanical and tribological properties of anodic Al coatings as a function of anodizing conditions. Surf. Coat. Technol. 2022, 444, 128652. [Google Scholar] [CrossRef]
- Machado, T.V.; Dick, P.A.; Knörnschild, G.H.; Dick, L.F. The effect of different carboxylic acids on the sulfuric acid anodizing of AA2024. Surf. Coat. Technol. 2020, 383, 125283. [Google Scholar] [CrossRef]
- Domagalski, J.T.; Xifre-Perez, E.; Marsal, L.F. Recent Advances in Nanoporous Anodic Alumina: Principles, Engineering, and Applications. Nanomaterials 2021, 11, 430. [Google Scholar] [CrossRef]
- Usman, B.J. Green and Effective Anodizing of AA 2024-T3 in Methionine-Sulfuric Acid Electrolyte. J. Electrochem. Soc. 2022, 169, 031503. [Google Scholar] [CrossRef]
- Sano, T.; Wakabayashi, Y.; Asoh, H. Formation of hard anodic films on the 7075-T6 aluminum alloy by anodization in sulfuric acid and ethylene glycol. Surf. Coat. Technol. 2023, 459, 129399. [Google Scholar] [CrossRef]
- Lv, X.; Jin, X.; Zhang, Z.; Bai, Y.; Guo, T.; Zhang, L.; Zhang, H.; Zhu, J.; Shao, Y.; Zhang, H.; et al. Comparative Study of Carbonaceous and Polymer Conductive Additives on Anticorrosion Performance of Epoxy Zinc-Rich Primer. Coatings 2022, 12, 1473. [Google Scholar] [CrossRef]
- Zareanshahraki, F.; Asemani, H.; Skuza, J.; Mannari, V. Synthesis of non-isocyanate polyurethanes and their application in radiation-curable aerospace coatings. Prog. Org. Coat. 2020, 138, 105394. [Google Scholar] [CrossRef]
- Hamdi, M.; Saleh, M.N.; Poulis, J.A. Improving the adhesion strength of polymers: Effect of surface treatments. J. Adhes. Sci. Technol. 2020, 34, 1853–1870. [Google Scholar] [CrossRef]
- Xu, X.; Zhao, X.; Vokhidova, N.R.; Sun, Q.; Li, Y.; Lu, Y. Aircraft coating for electromagnetic interference shielding with flame retardancy and Joule heating capability. Mater. Chem. Phys. 2023, 299, 127539. [Google Scholar] [CrossRef]
- Pickren, D.B.E. Effects of Weathering Cycles on the Mechanical Properties of Thermoplastic Polyurethane. Ph.D. Thesis, Mercer University, Atlanta, GA, USA, 2021. [Google Scholar]
- Anderson, K.; Kaufman, J.G.; Weritz, J. (Eds.) ASM Handbook: Volume 2B Properties and Selection of Aluminum Alloys; ASM International: Almere, The Netherlands, 2019. [Google Scholar]
- Vu, C.; Wern, C.; Kim, B.H.; Kim, S.K.; Choi, H.J.; Yi, S. Fatigue Behaviour of New Eco-7175 Extruded Aluminum Alloy. In Proceedings of the 8th European Conference for Aeronautics and Space Sciences (EUCASS), Madrid, Spain, 1–4 July 2019; pp. 1–4. [Google Scholar]
- Won, B.; Kim, M.O.; Park, S.; Yi, J.-H. Effects of Water Exposure on the Interfacial Bond between an Epoxy Resin Coating and a Concrete Substrate. Materials 2019, 12, 3715. [Google Scholar] [CrossRef]
- Asmatulu, R.; Erukala, K.S.; Shinde, M.; Alarifi, I.M.; Gorji, M.R. Investigating the effects of surface treatments on adhesion properties of protective coatings on carbon fiber-reinforced composite laminates. Surf. Coat. Technol. 2019, 380, 125006. [Google Scholar] [CrossRef]
- Xin, L.; Li, H.; Gao, J.; Wang, Z.; Zhou, K.; Yu, S. Large-scale fabrication of decoupling coatings with promising robustness and superhydrophobicity for antifouling, drag reduction, and organic photodegradation. Friction 2023, 11, 716–736. [Google Scholar] [CrossRef]
- Asif, A.H.; Mahajan, M.S.; Sreeharsha, N.; Gite, V.V.; Al-Dhubiab, B.E.; Kaliyadan, F.; Nanjappa, S.H.; Meravanige, G.; Aleyadhy, D.M. Enhancement of Anticorrosive Performance of Cardanol Based Polyurethane Coatings by Incorporating Magnetic Hydroxyapatite Nanoparticles. Materials 2022, 15, 2308. [Google Scholar] [CrossRef]
- Chen, B.; Xi, X.; Gu, T.; Tan, C.; Song, X. Influence of heat treatment on microstructure evolution and mechanical properties of TiB2/Al 2024 composites fabricated by directed energy deposition. J. Mater. Res. Technol. 2020, 9, 14223–14236. [Google Scholar] [CrossRef]
- Kwolek, P.; Drapała, D.; Krupa, K.; Obłój, A.; Tokarski, T.; Sieniawski, J. Mechanical properties of a pulsed anodised 5005 aluminum alloy. Surf. Coat. Technol. 2020, 383, 125233. [Google Scholar] [CrossRef]
- Zych, P.; Żywica, G. Fatigue analysis of the microturbine rotor disc made of 7075 aluminum alloy using a new hybrid calculation method. Materials 2022, 15, 834. [Google Scholar] [CrossRef]
- Wang, J. Analytical Electrochemistry; John Wiley & Sons: Hoboken, NJ, USA, 2023. [Google Scholar]
- Bikulčius, G.; Jankauskas, S.; Selskienė, A.; Staišiūnas, L.; Matijošius, T.; Asadauskas, S.J. New Insight into Adherence of Ni-P Electroless Deposited Coatings on AA6061 Alloy through Al2O3 Ceramic. Coatings 2022, 12, 594. [Google Scholar] [CrossRef]
- Carneiro JTedim, J.; Ferreira, M.G.S. Chitosan as a smart coating for corrosion protection of aluminum alloy 2024: A review. Prog. Org. Coat. 2015, 89, 348–356. [Google Scholar] [CrossRef]
Disclaimer/Publisher’s Note: The statements, opinions and data contained in all publications are solely those of the individual author(s) and contributor(s) and not of MDPI and/or the editor(s). MDPI and/or the editor(s) disclaim responsibility for any injury to people or property resulting from any ideas, methods, instructions or products referred to in the content. |
© 2023 by the authors. Licensee MDPI, Basel, Switzerland. This article is an open access article distributed under the terms and conditions of the Creative Commons Attribution (CC BY) license (https://creativecommons.org/licenses/by/4.0/).


