Figure 1.
Streamline inside the thrust chamber of pintle engines.
Figure 1.
Streamline inside the thrust chamber of pintle engines.
Figure 2.
Schematic diagram of the pintle engine equipped with thermocouples.
Figure 2.
Schematic diagram of the pintle engine equipped with thermocouples.
Figure 3.
Configuration of the pintle engine.
Figure 3.
Configuration of the pintle engine.
Figure 4.
Configuration of the test system on the LRE test stand.
Figure 4.
Configuration of the test system on the LRE test stand.
Figure 5.
Simplified model of the study’s pintle engine.
Figure 5.
Simplified model of the study’s pintle engine.
Figure 6.
Arrangement of circular injection holes on the pintle injector.
Figure 6.
Arrangement of circular injection holes on the pintle injector.
Figure 7.
Generated grids in the computational domain.
Figure 7.
Generated grids in the computational domain.
Figure 8.
Sample line and symmetries for the analysis.
Figure 8.
Sample line and symmetries for the analysis.
Figure 9.
Temperature distributions on the sample line with different grid densities.
Figure 9.
Temperature distributions on the sample line with different grid densities.
Figure 10.
Distribution of , , and against time in test #6.
Figure 10.
Distribution of , , and against time in test #6.
Figure 11.
Distribution of against time in test #5.
Figure 11.
Distribution of against time in test #5.
Figure 12.
Distribution of against time in test #5.
Figure 12.
Distribution of against time in test #5.
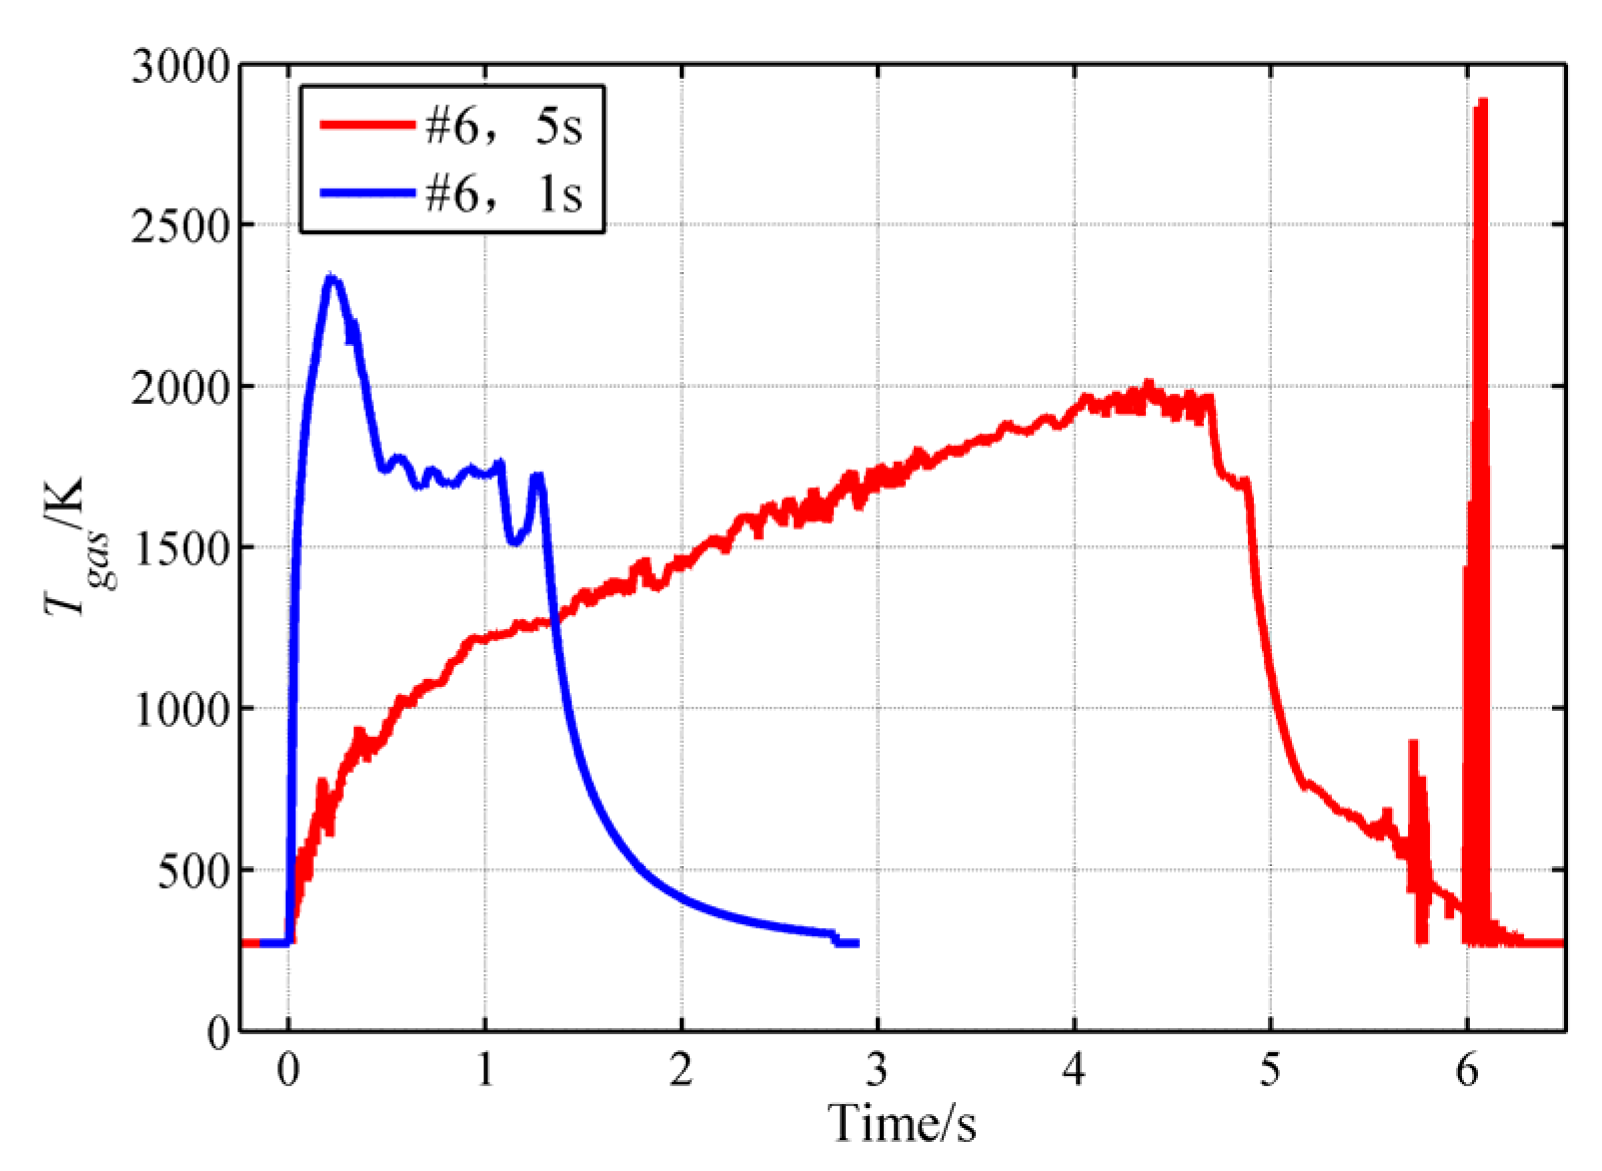
Figure 13.
Distribution of against time in test #6.
Figure 13.
Distribution of against time in test #6.
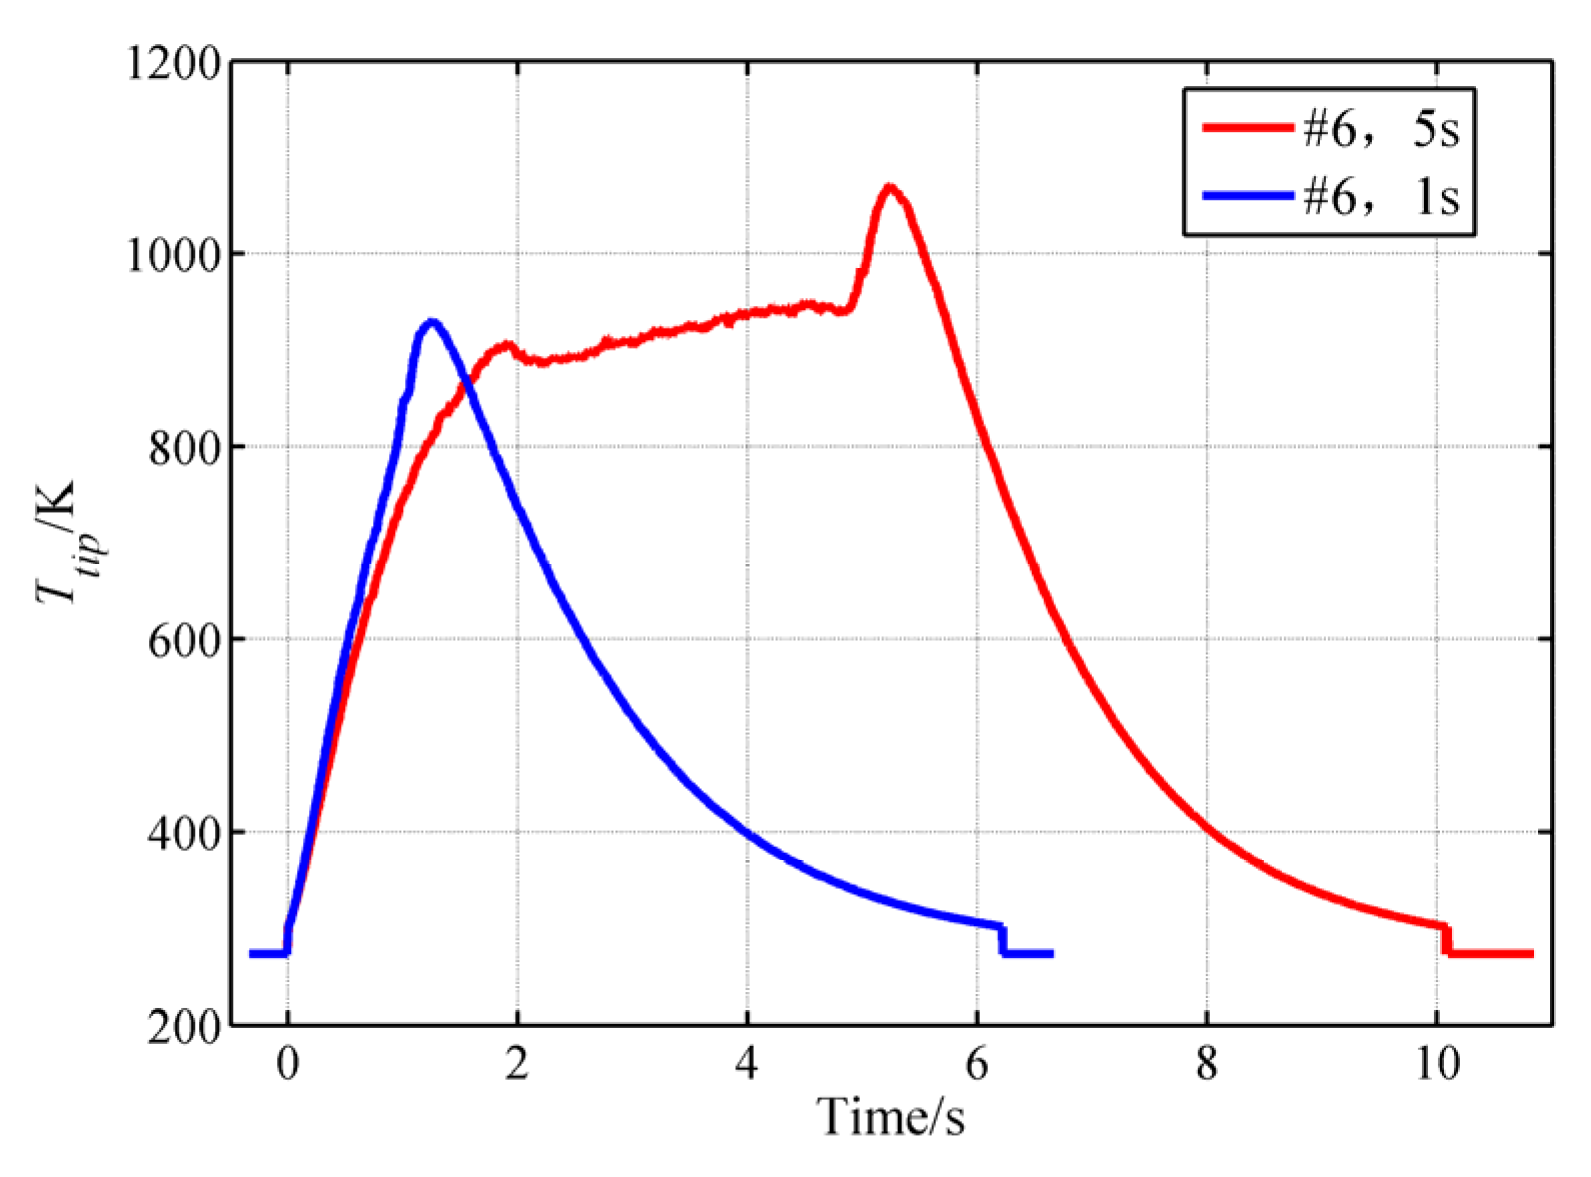
Figure 14.
Distribution of against time in test #6.
Figure 14.
Distribution of against time in test #6.
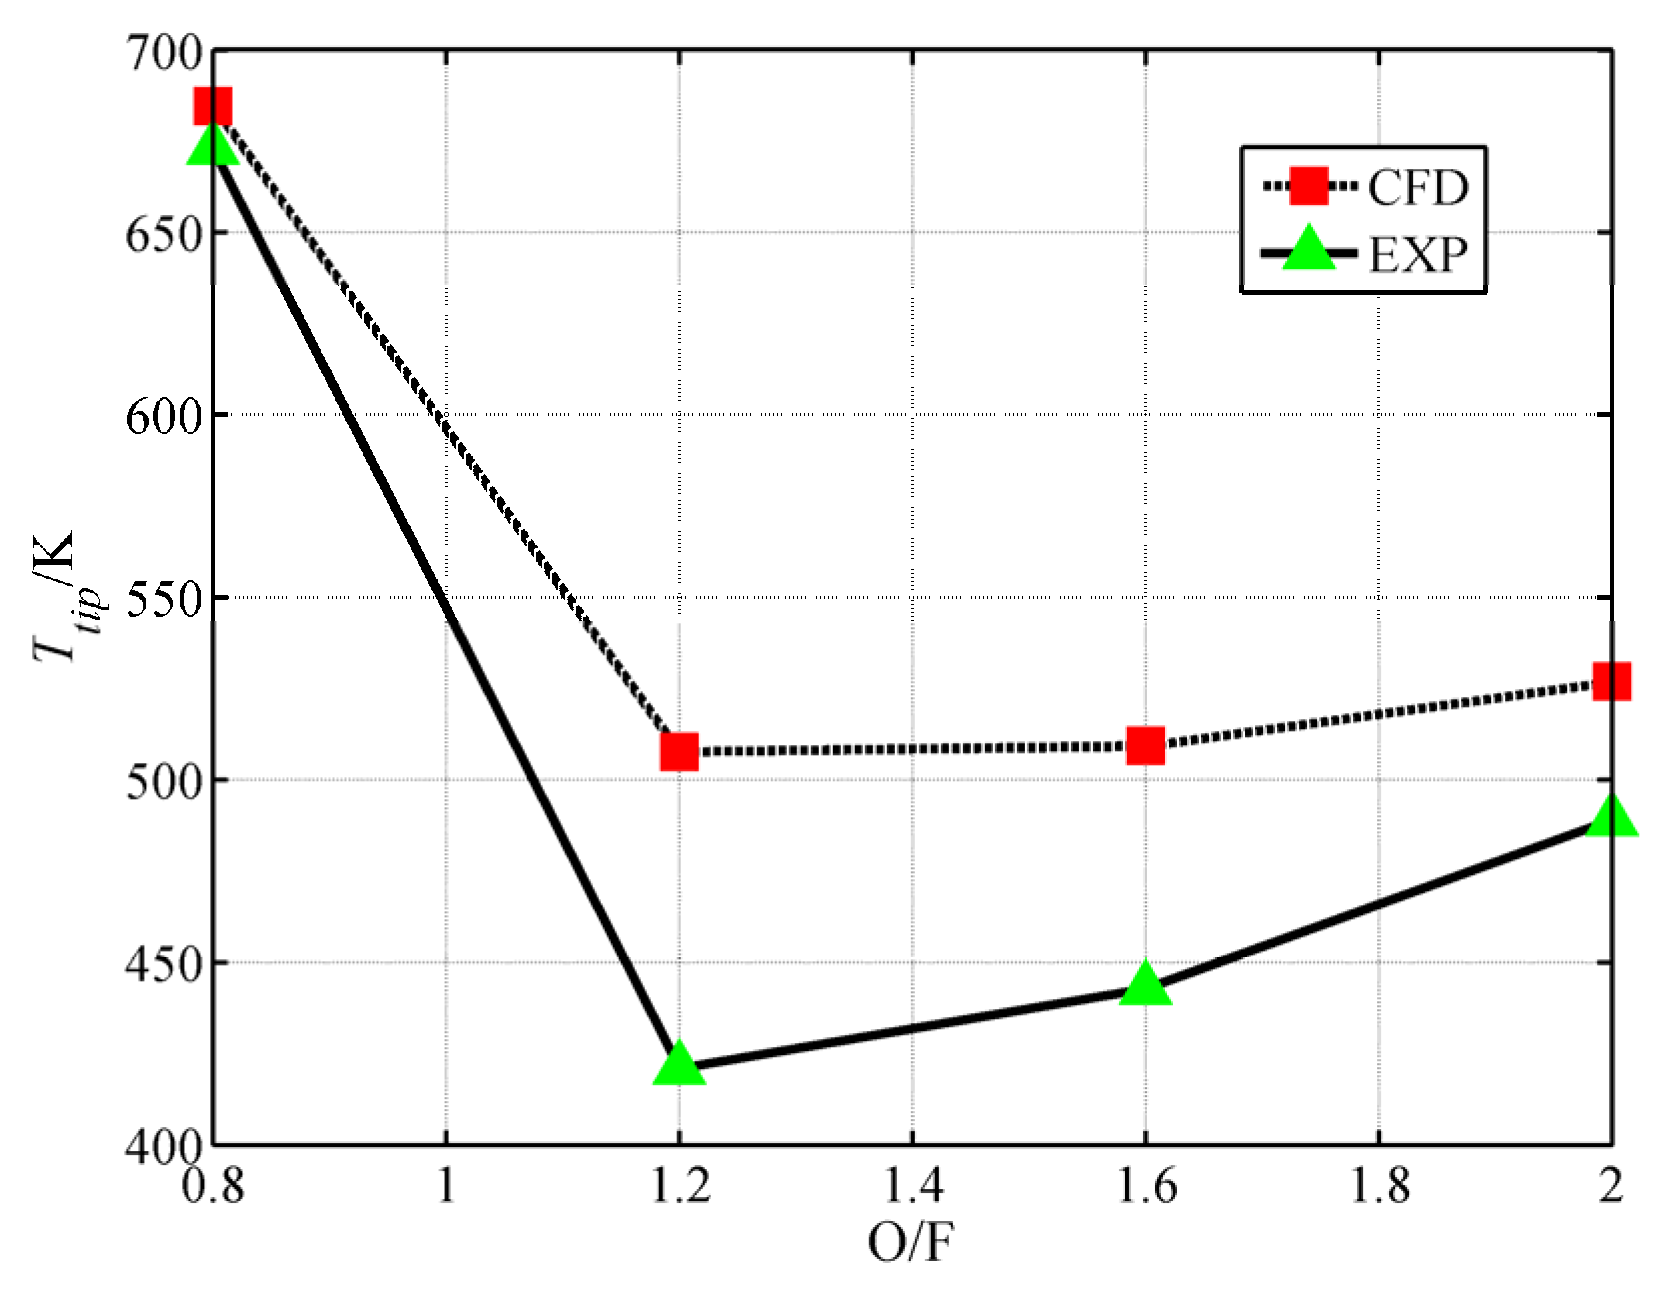
Figure 15.
for different O/F ratios.
Figure 15.
for different O/F ratios.
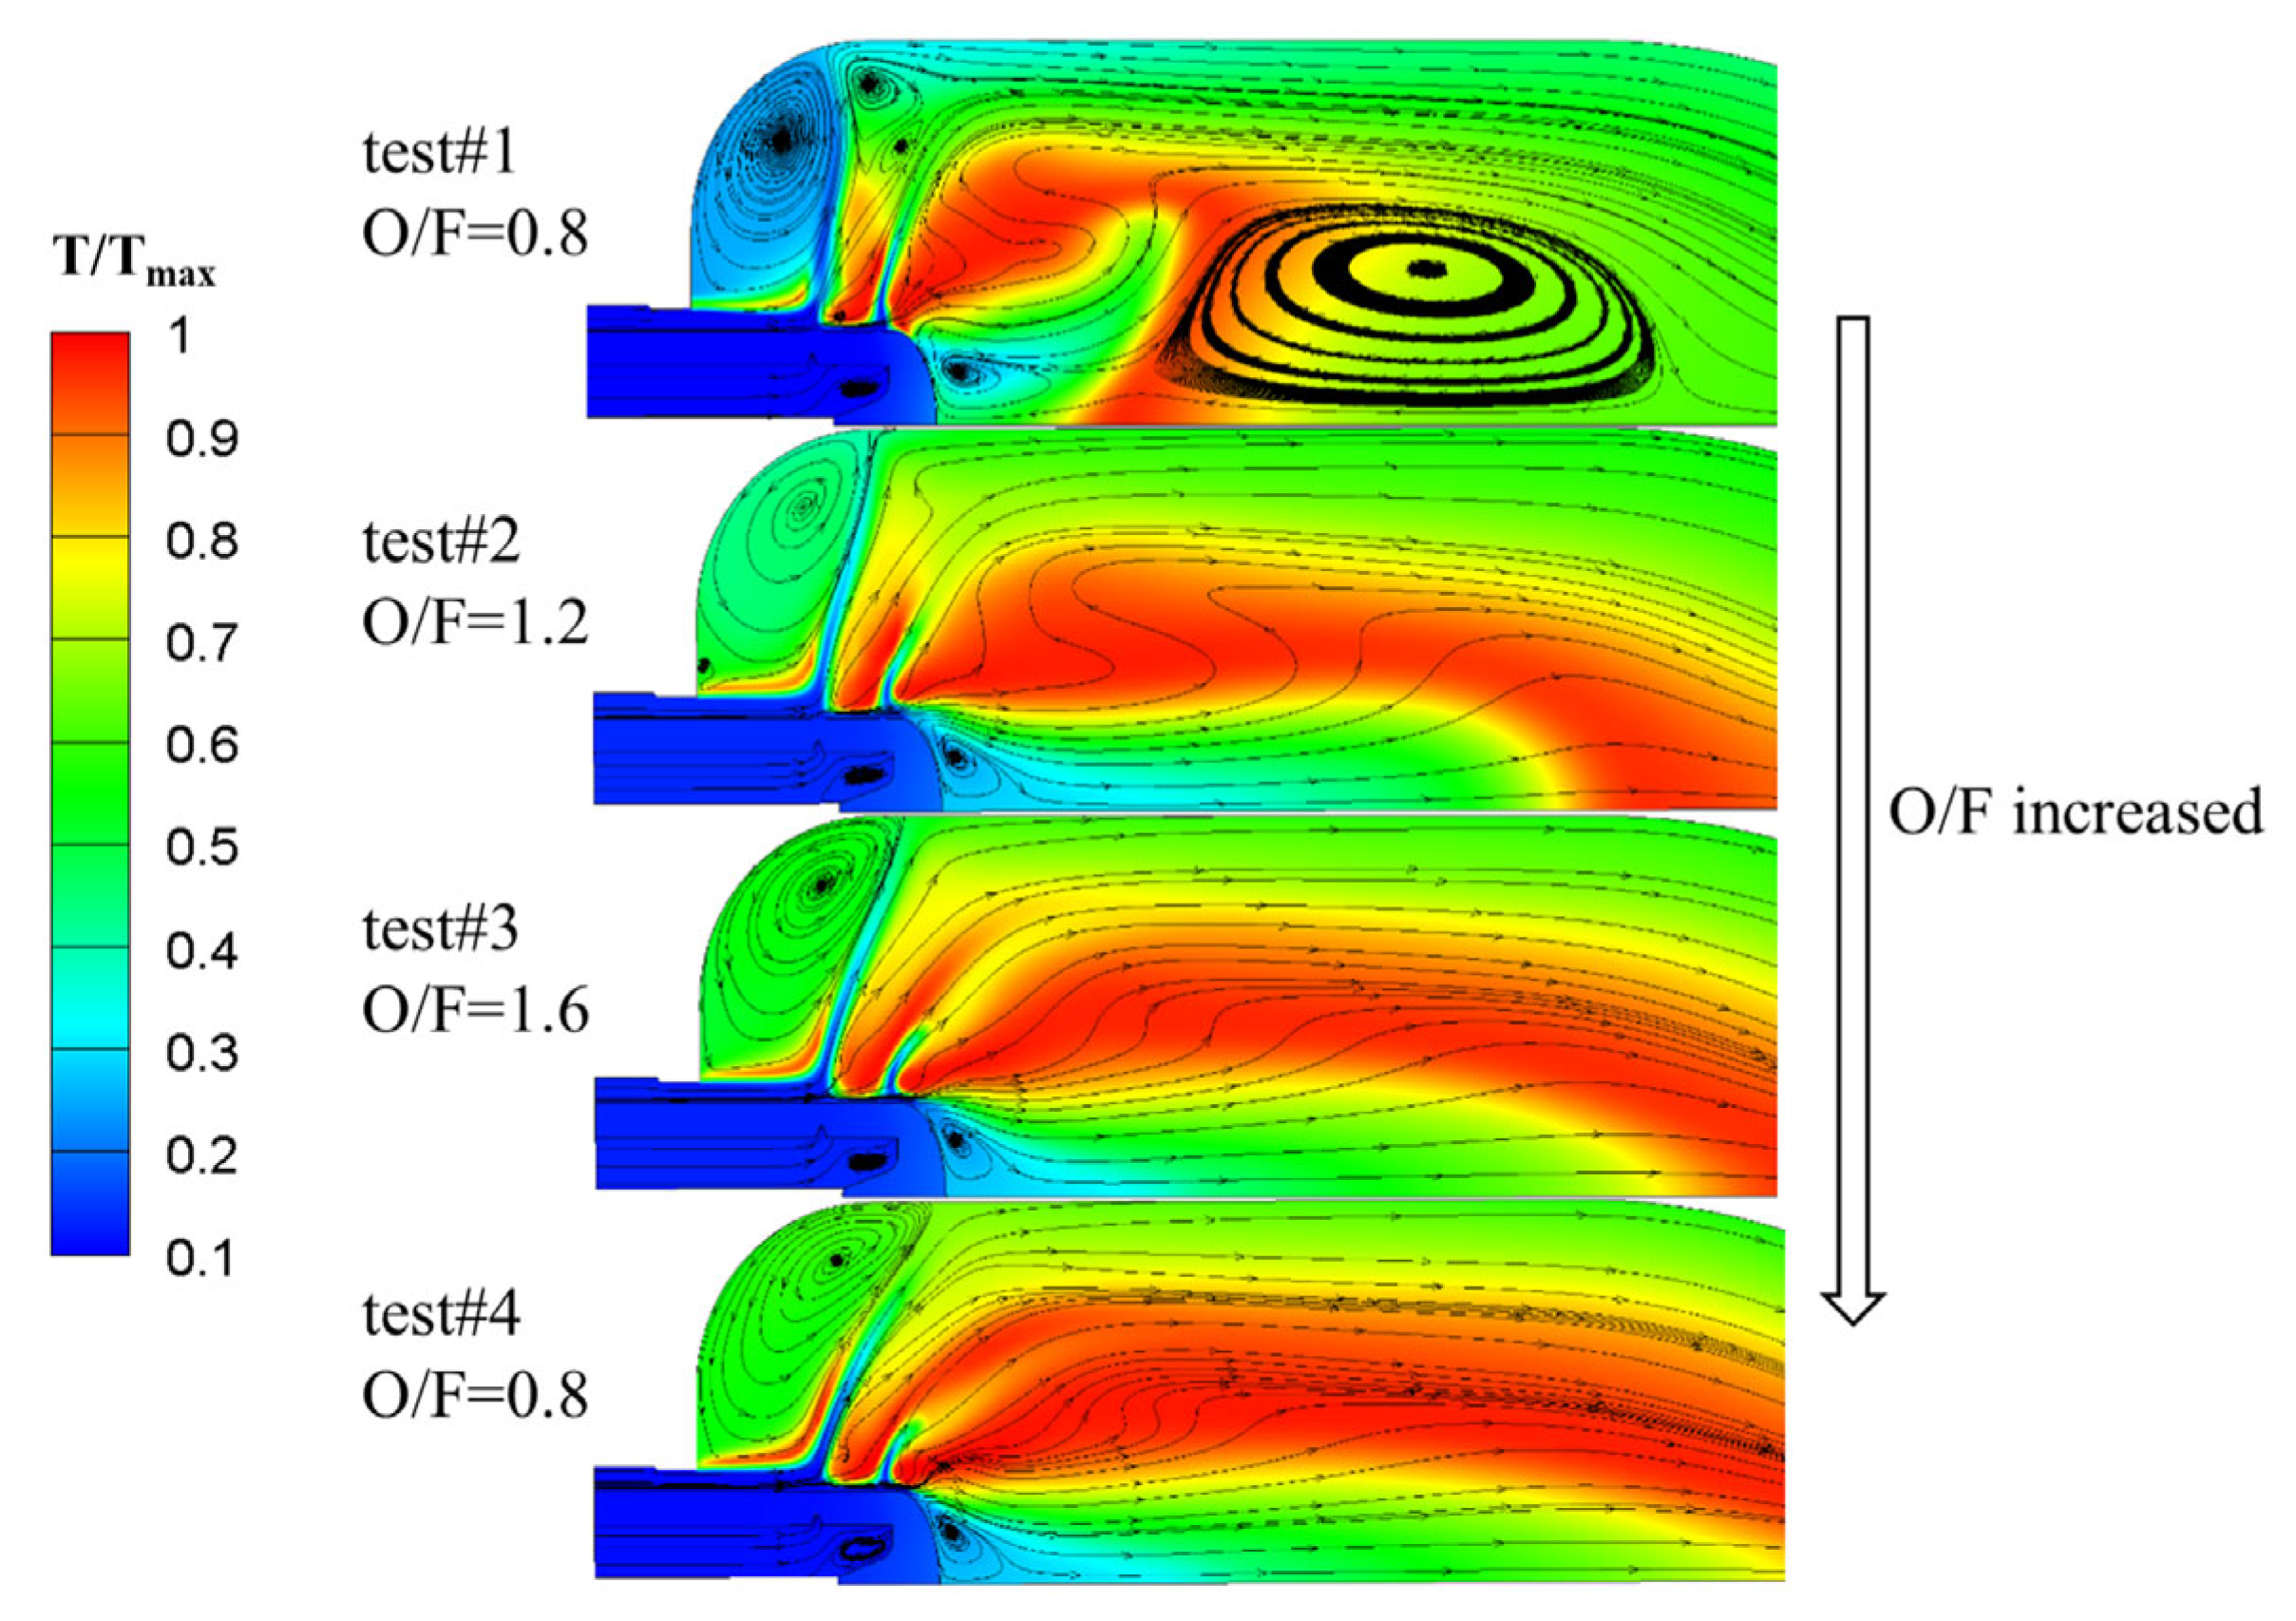
Figure 16.
Comparison of flow fields in the symmetry plane B in tests #1 to #4.
Figure 16.
Comparison of flow fields in the symmetry plane B in tests #1 to #4.
Figure 17.
Comparison of iso-surfaces in tests #1 to #4 (green: iso-surface of methane gas with a mass fraction of 0.6; puce: iso-surface of oxygen with a mass fraction of 0.9).
Figure 17.
Comparison of iso-surfaces in tests #1 to #4 (green: iso-surface of methane gas with a mass fraction of 0.6; puce: iso-surface of oxygen with a mass fraction of 0.9).
Figure 18.
Dependence of on O/F and .
Figure 18.
Dependence of on O/F and .
Figure 19.
Iso-surfaces in tests #1, #5, and #6 (green: iso-surface of methane with a mass fraction of 0.6; puce: iso-surface of oxygen with a mass fraction of 0.9).
Figure 19.
Iso-surfaces in tests #1, #5, and #6 (green: iso-surface of methane with a mass fraction of 0.6; puce: iso-surface of oxygen with a mass fraction of 0.9).
Figure 20.
The comparison of flow fields on the symmetry plane B for tests #1, #5, and #6.
Figure 20.
The comparison of flow fields on the symmetry plane B for tests #1, #5, and #6.
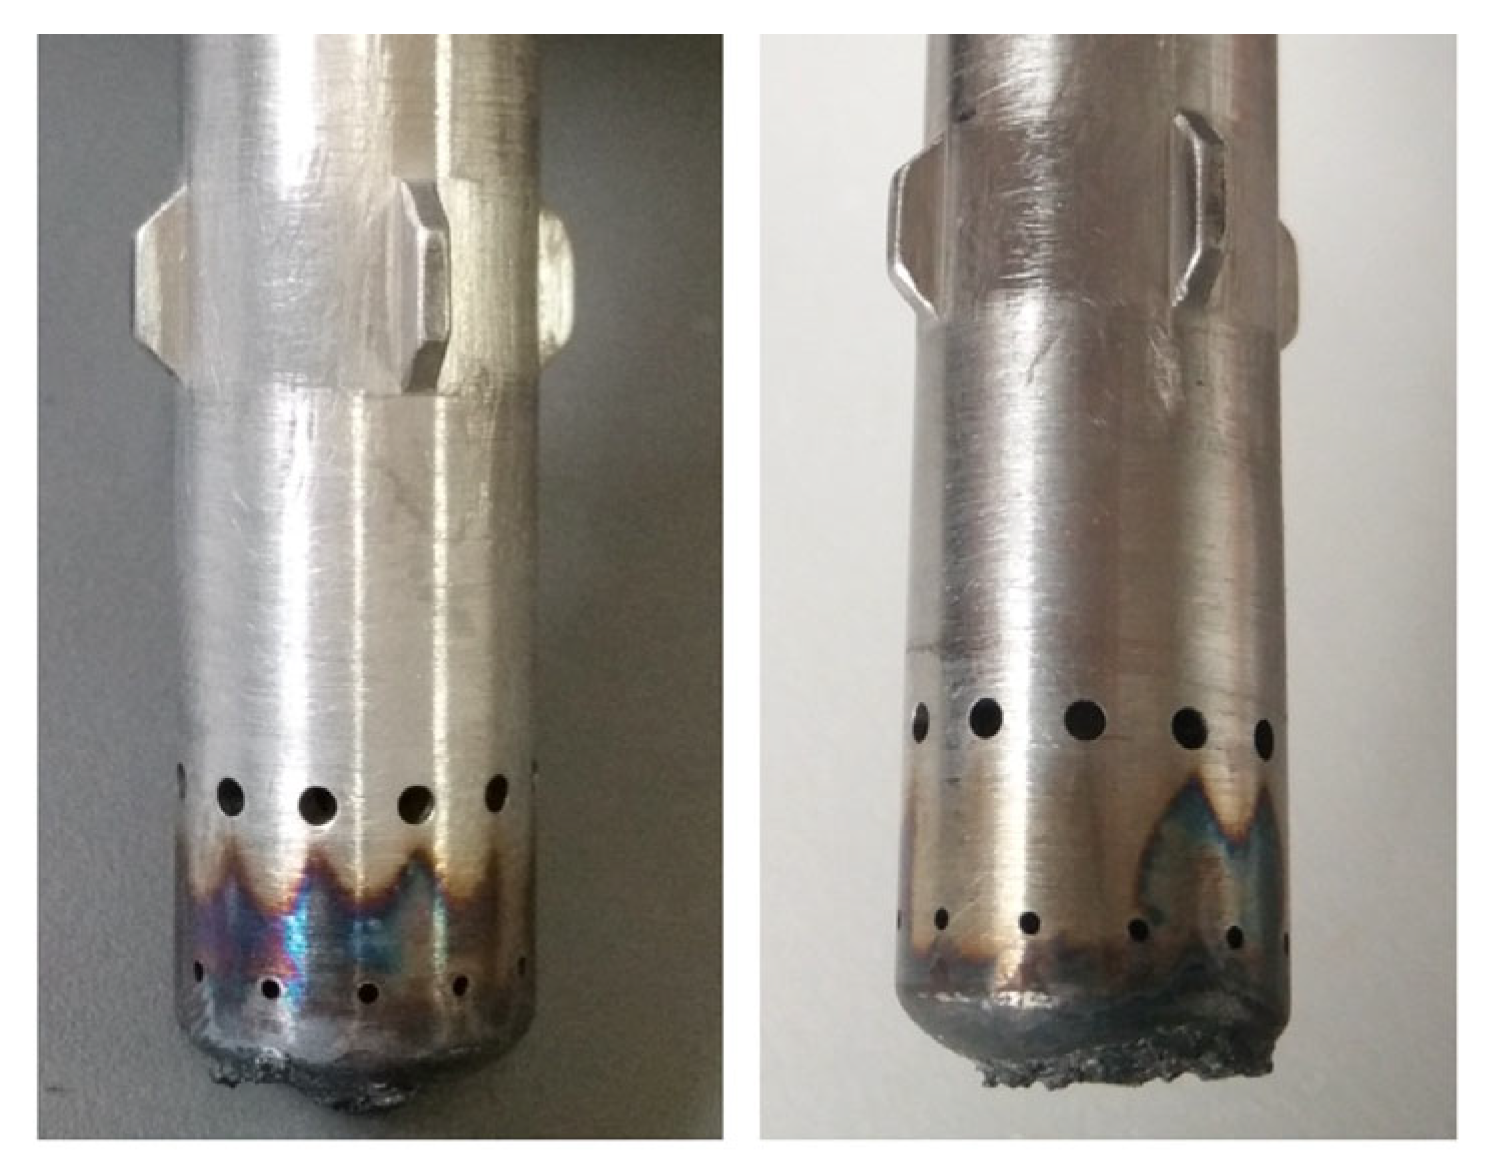
Figure 21.
Ablation feature of the pintle tip after test #6 and the sample for microscopic observation.
Figure 21.
Ablation feature of the pintle tip after test #6 and the sample for microscopic observation.
Figure 22.
Ablation change of the pintle tip with an increasing cumulative test time.
Figure 22.
Ablation change of the pintle tip with an increasing cumulative test time.
Figure 23.
Microscopic feature in the region (SE1, ×1000).
Figure 23.
Microscopic feature in the region (SE1, ×1000).
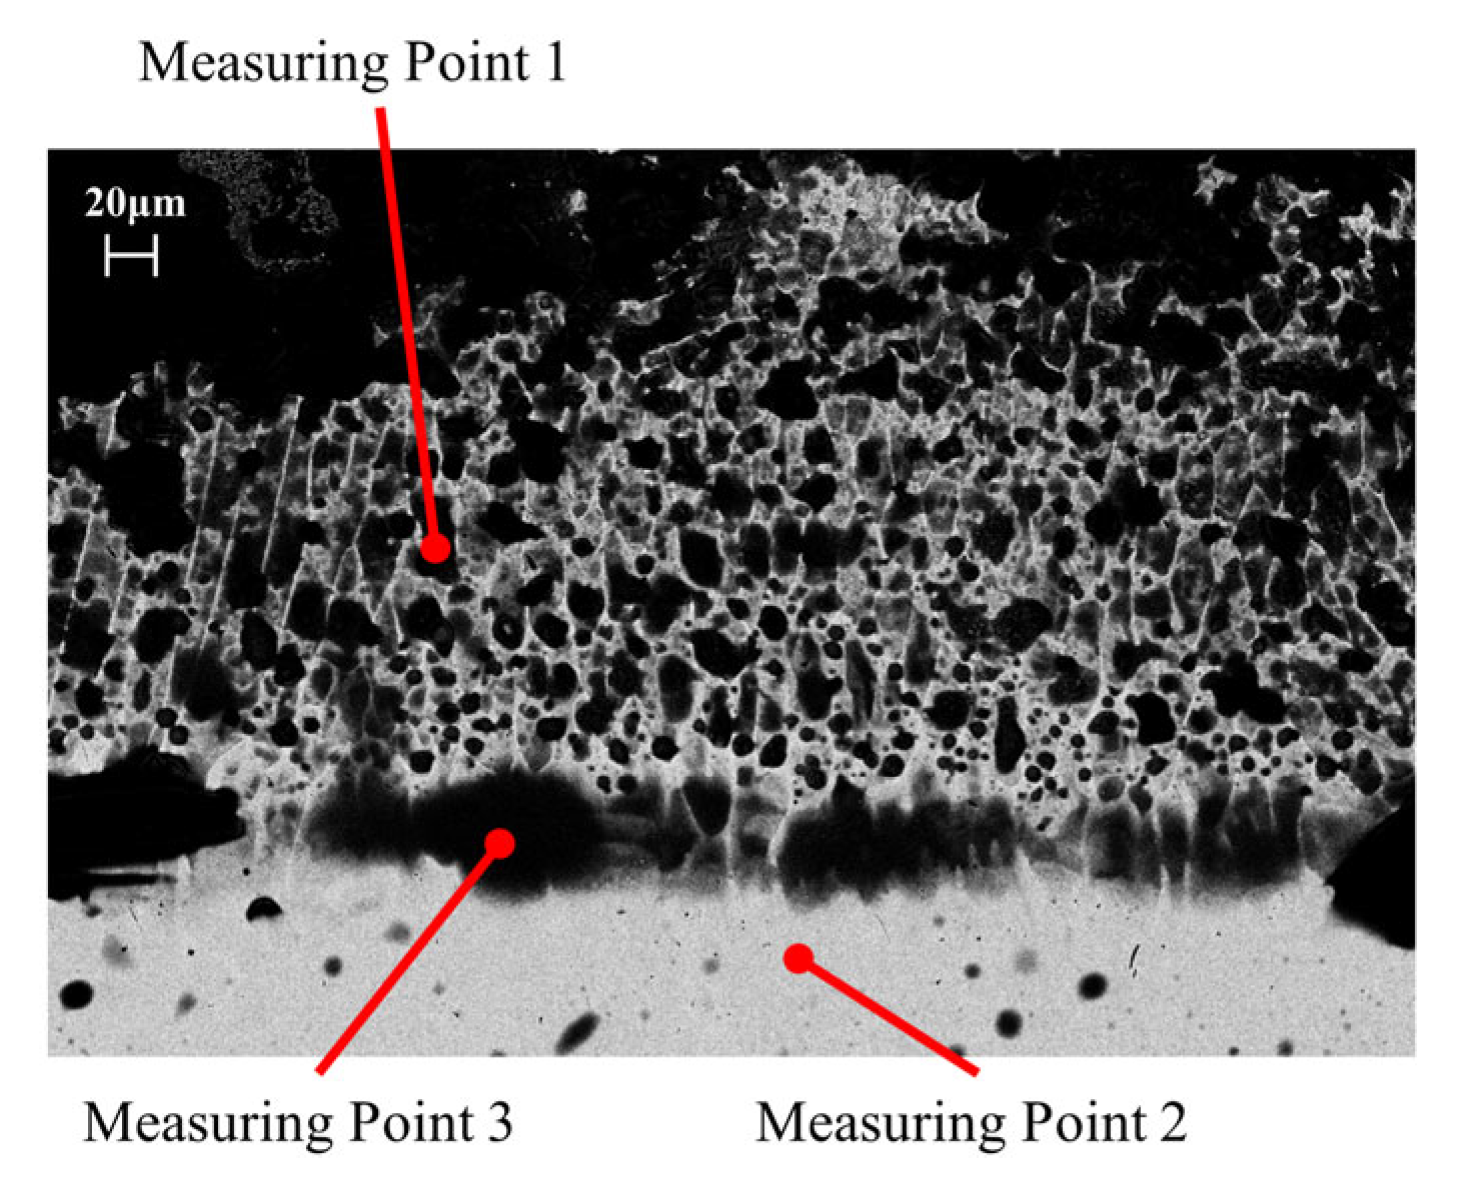
Figure 24.
Microscopic feature in the region (BSD, ×200).
Figure 24.
Microscopic feature in the region (BSD, ×200).
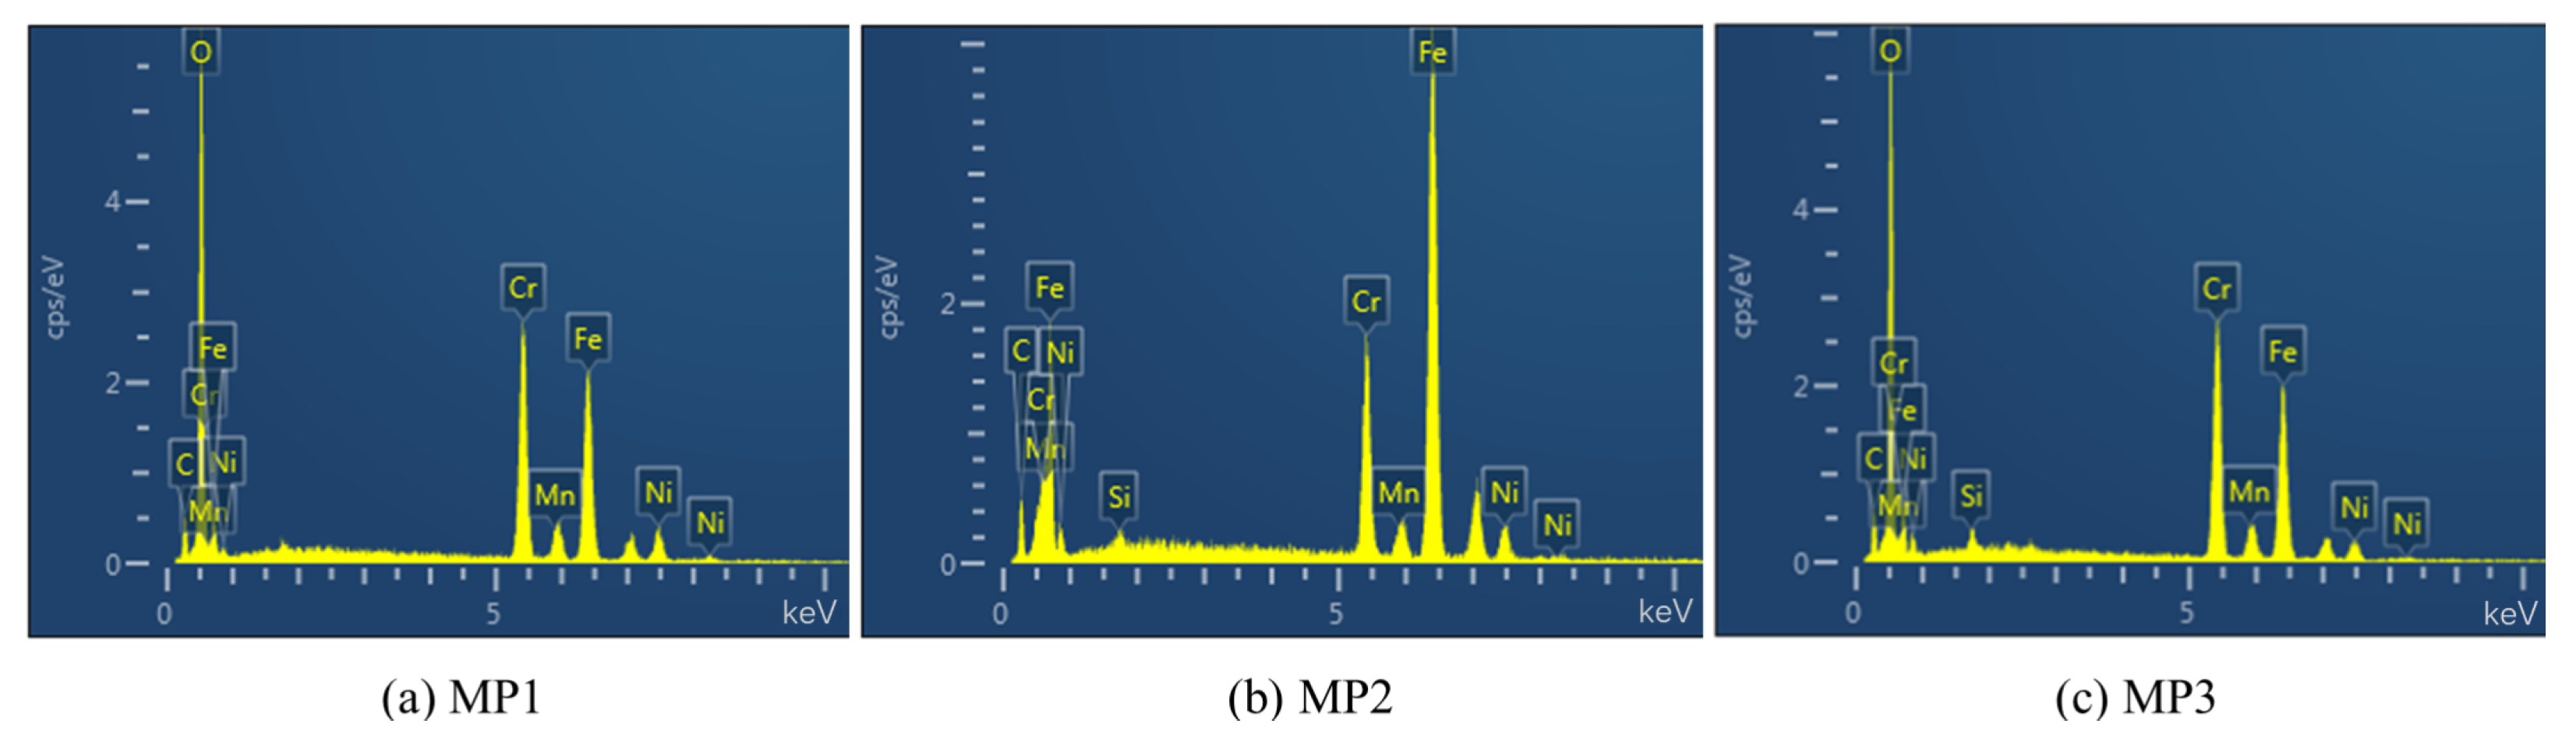
Figure 25.
Energy spectrum analysis of the MP1–MP3.
Figure 25.
Energy spectrum analysis of the MP1–MP3.
Figure 26.
Uneven distribution of oxidation and ablation feature around the injection holes.
Figure 26.
Uneven distribution of oxidation and ablation feature around the injection holes.
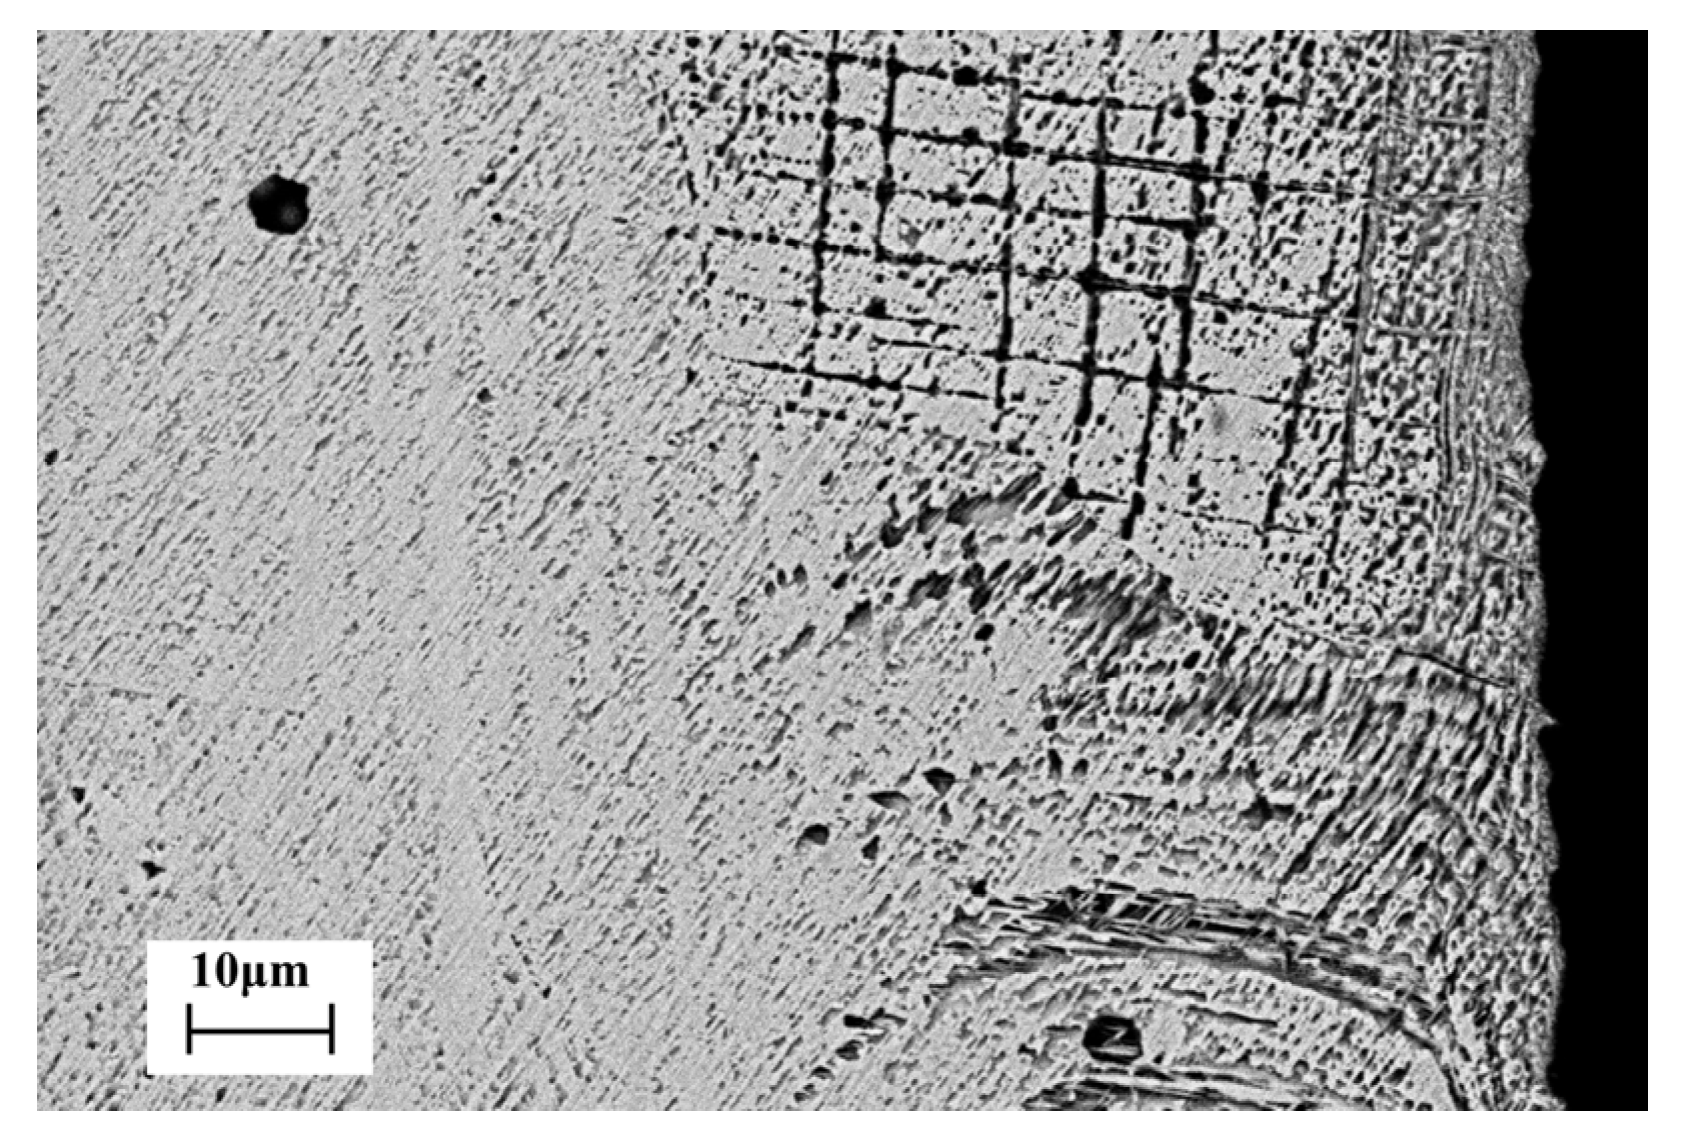
Figure 27.
Microscopic feature in the vicinity of the second row of injection holes (BSD, ×1000).
Figure 27.
Microscopic feature in the vicinity of the second row of injection holes (BSD, ×1000).
Table 1.
Parameters of a 500N GOX/GCH4 pintle engine.
Table 1.
Parameters of a 500N GOX/GCH4 pintle engine.
| Parameter | Value | Units |
|---|
| Performance parameters |
| Chamber pressure | 1.05 | MPa |
| Vacuum thrust | 477.6 | N |
| Vacuum specific impulse | 320.41 | s |
| Characteristic velocity | 1838.09 | m/s |
| Mass flow rate |
| Total | 152 | g/s |
| Oxidizer | 115.8 | g/s |
| Fuel | 36.2 | g/s |
| Mixture ratio | 3.2 | |
| Pintle injector |
| Pintle diameter Dp | | mm |
| 1st row of injection hole diameter Df | | mm |
| 2nd row of injection hole diameter Ds | | mm |
| Number of holes in each row | 12 | |
| Annular gap width Gap | | mm |
| Thrust Chamber |
| Chamber diameter Dc | | mm |
| Characteristic length | 433.30 | mm |
| Nozzle |
| Throat diameter Dt | | mm |
Table 2.
Definitions of working conditions.
Table 2.
Definitions of working conditions.
| No. | | O/F | | | | Note |
|---|
| #1 | 0.25 | 0.8 | 1004 | 31.01 | 24.8 | |
| #2 | 0.25 | 1.2 | 1147 | 23.68 | 28.41 | |
| #3 | 0.25 | 1.6 | 1950 | 16.89 | 27.03 | |
| #4 | 0.25 | 2 | 2581 | 13.34 | 26.69 | |
| #5 | 0.5 | 1.6 | 1951 | 33.79 | 54.06 | |
| #6 | 1.05 | 3.2 | 3275 | 36.2 | 115.8 | design point |
Table 3.
The imposed boundary conditions.
Table 3.
The imposed boundary conditions.
| Boundary | Type | Value |
|---|
| GOX inlet | mass flow inlet | 0.004825 kg/s, 300 K |
| methane inlet | mass flow inlet | 0.001058 kg/s, 300 K |
| outlet | pressure outlet | 10,132.5 Pa |
| interface walls | coupled wall | - |
| non-interface walls | adiabatic wall | - |
Table 4.
Deviations between numerical and experimental results for test cases #1~#4.
Table 4.
Deviations between numerical and experimental results for test cases #1~#4.
| Test | #1 | #2 | #3 | #4 |
|---|
| /K | 672.9 | 421 | 442.8 | 489.1 |
| /K | 684.7 | 507.7 | 509.3 | 526.9 |
| /K | 11.8 | 86.7 | 73.65 | 44.09 |
| 1.75% | 20.59% | 15.01% | 7.73% |
Table 5.
Deviations between simulation and experiment results for tests #1, #5, and #6.
Table 5.
Deviations between simulation and experiment results for tests #1, #5, and #6.
| Test | #1 | #5 | #6 |
|---|
| /K | 672.9 | 424.8 | 930.1 |
| /K | 684.7 | 556.8 | 1587.7 |
| /K | 11.8 | 86.7 | 73.65 |
| 1.75% | 31.07% | 70.7% |
Table 6.
Chemical compositions in measuring points.
Table 6.
Chemical compositions in measuring points.
| Element | Cr | Ni | Si | Mn |
|---|
| GB/T 20878-2007 06Cr19Ni10 standard | 18~20 | 8~11 | ≤1 | ≤2 |
| Measuring point 1 | 28.55 | 5.73 | - | - |
| Measuring point 2 | 15.33 | 6.38 | 0.43 | 1.06 |
| Measuring point 3 | 24.81 | 4.46 | 0.76 | 1.15 |


