
Multi-Objective Optimization of Dimensional Accuracy in Electric Hot Incremental Sheet Forming


Abstract
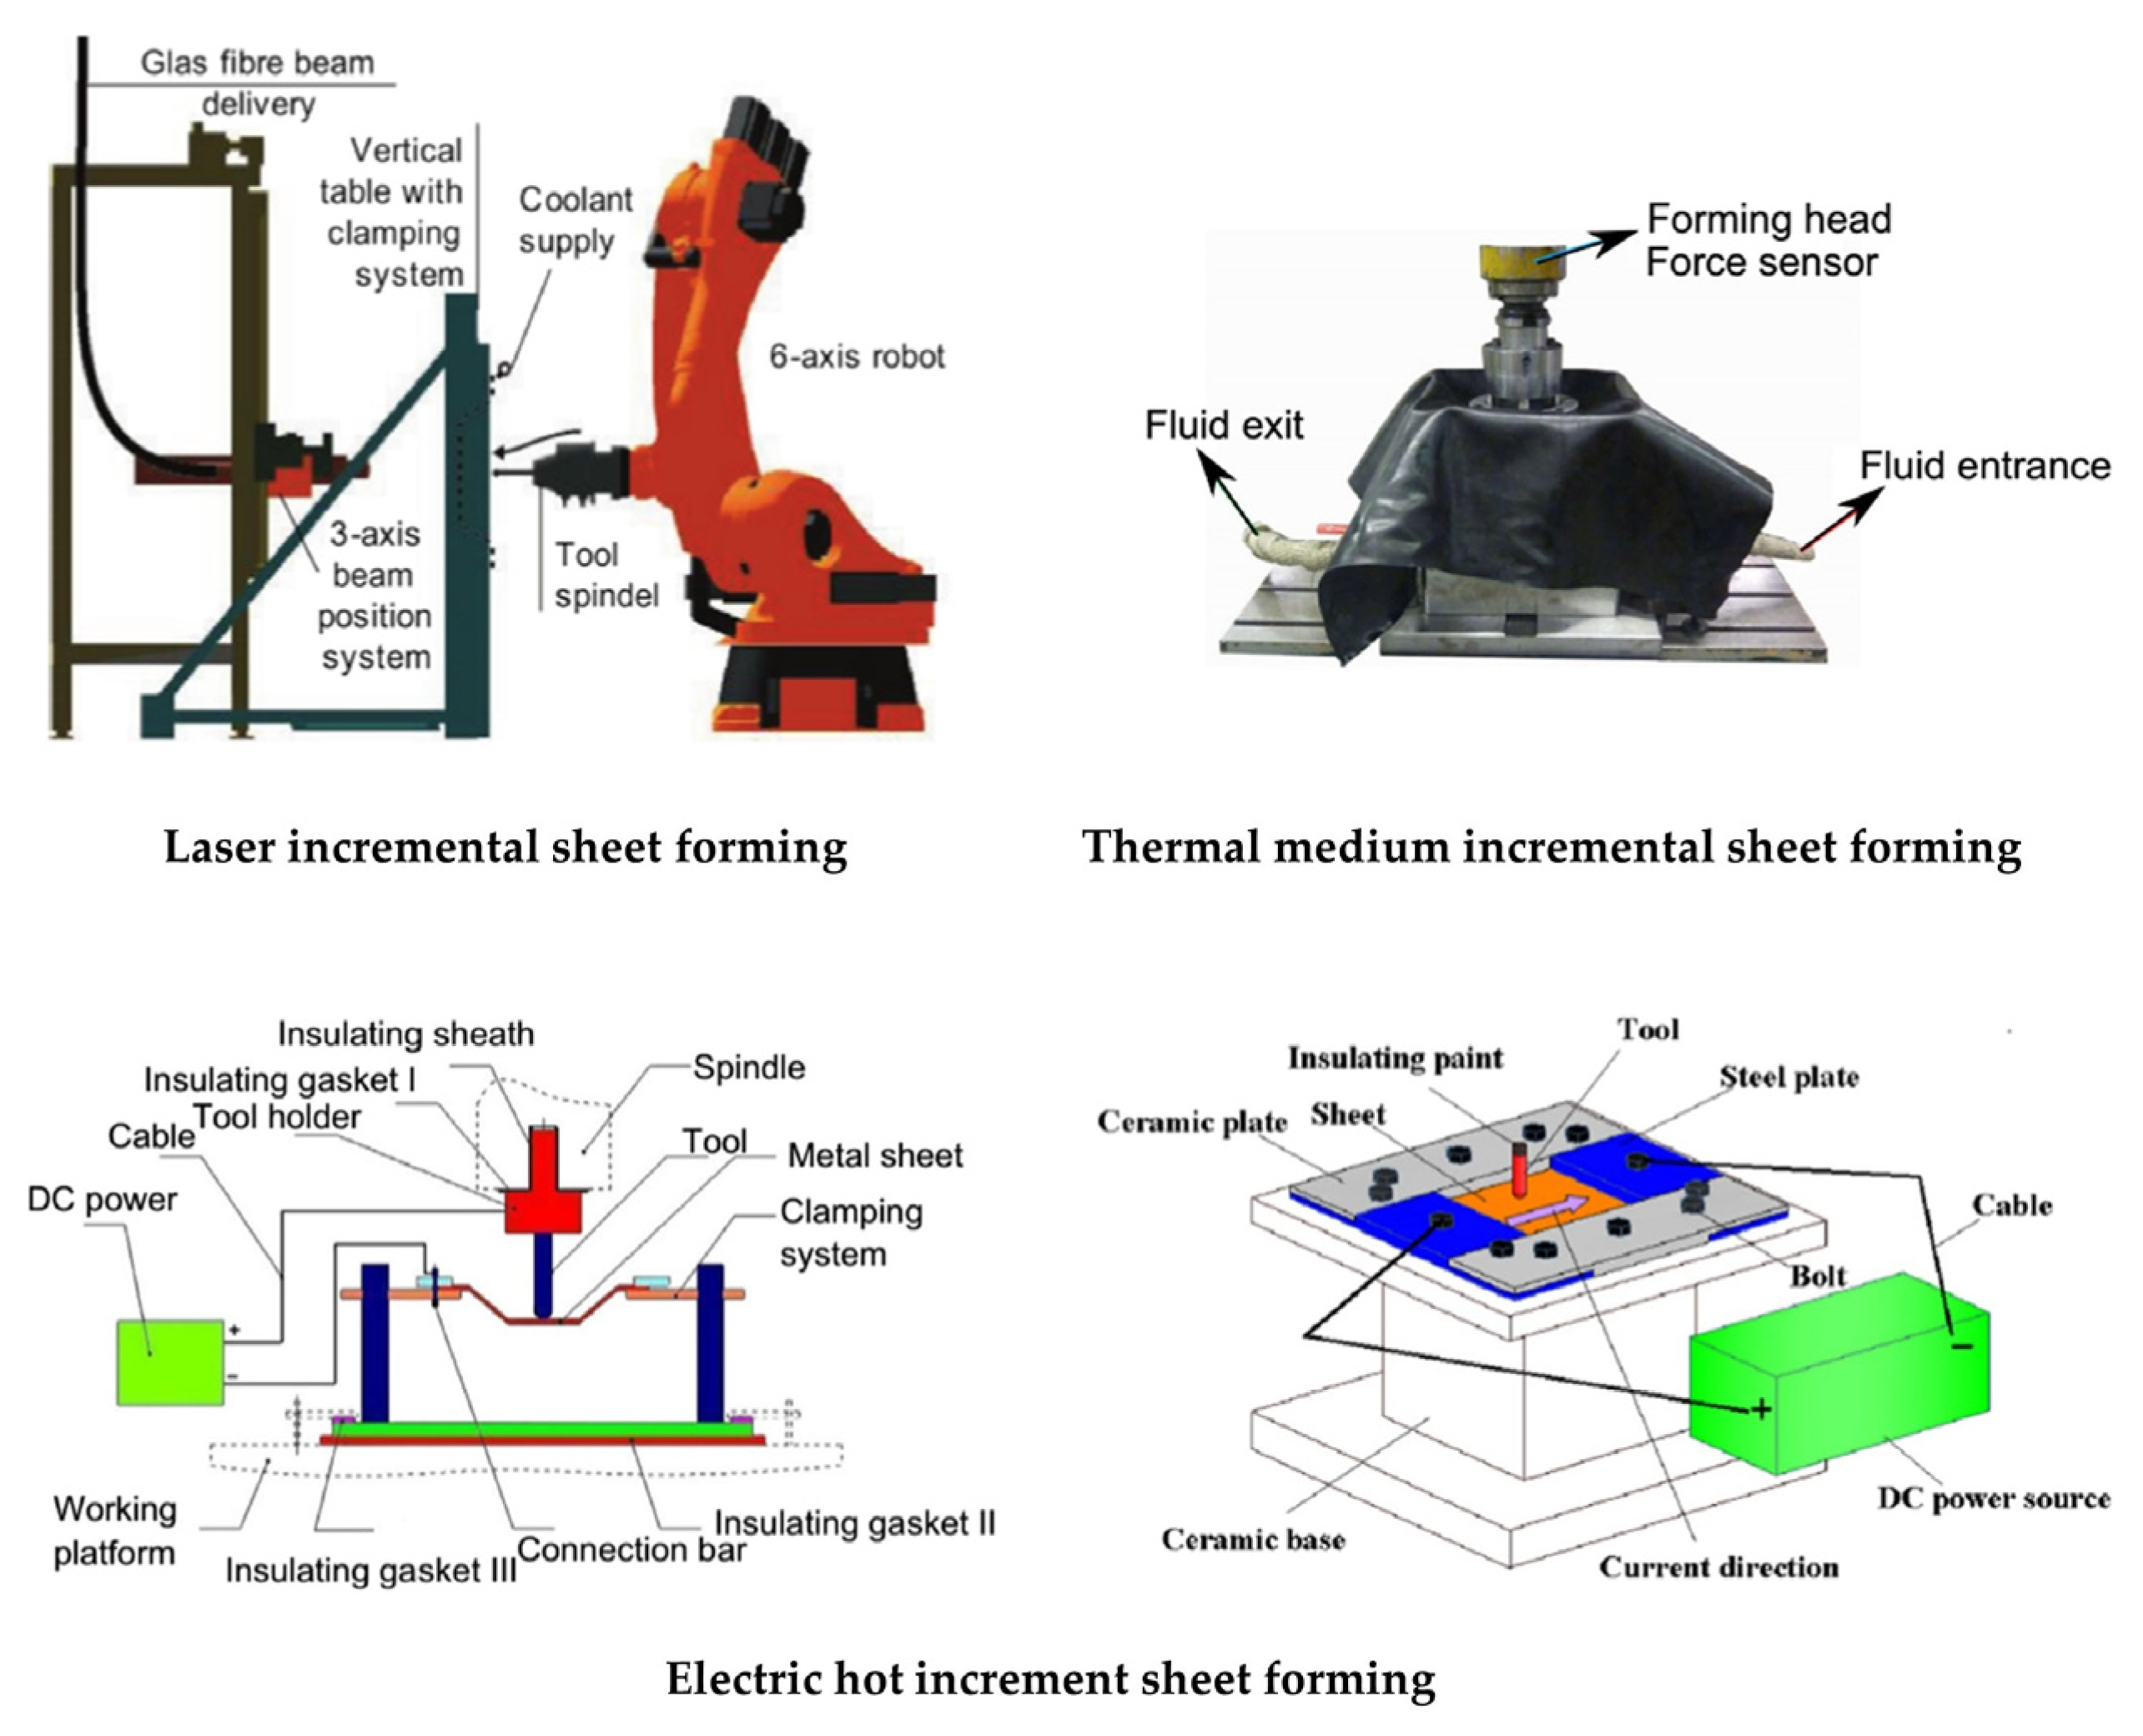
:1. Introduction
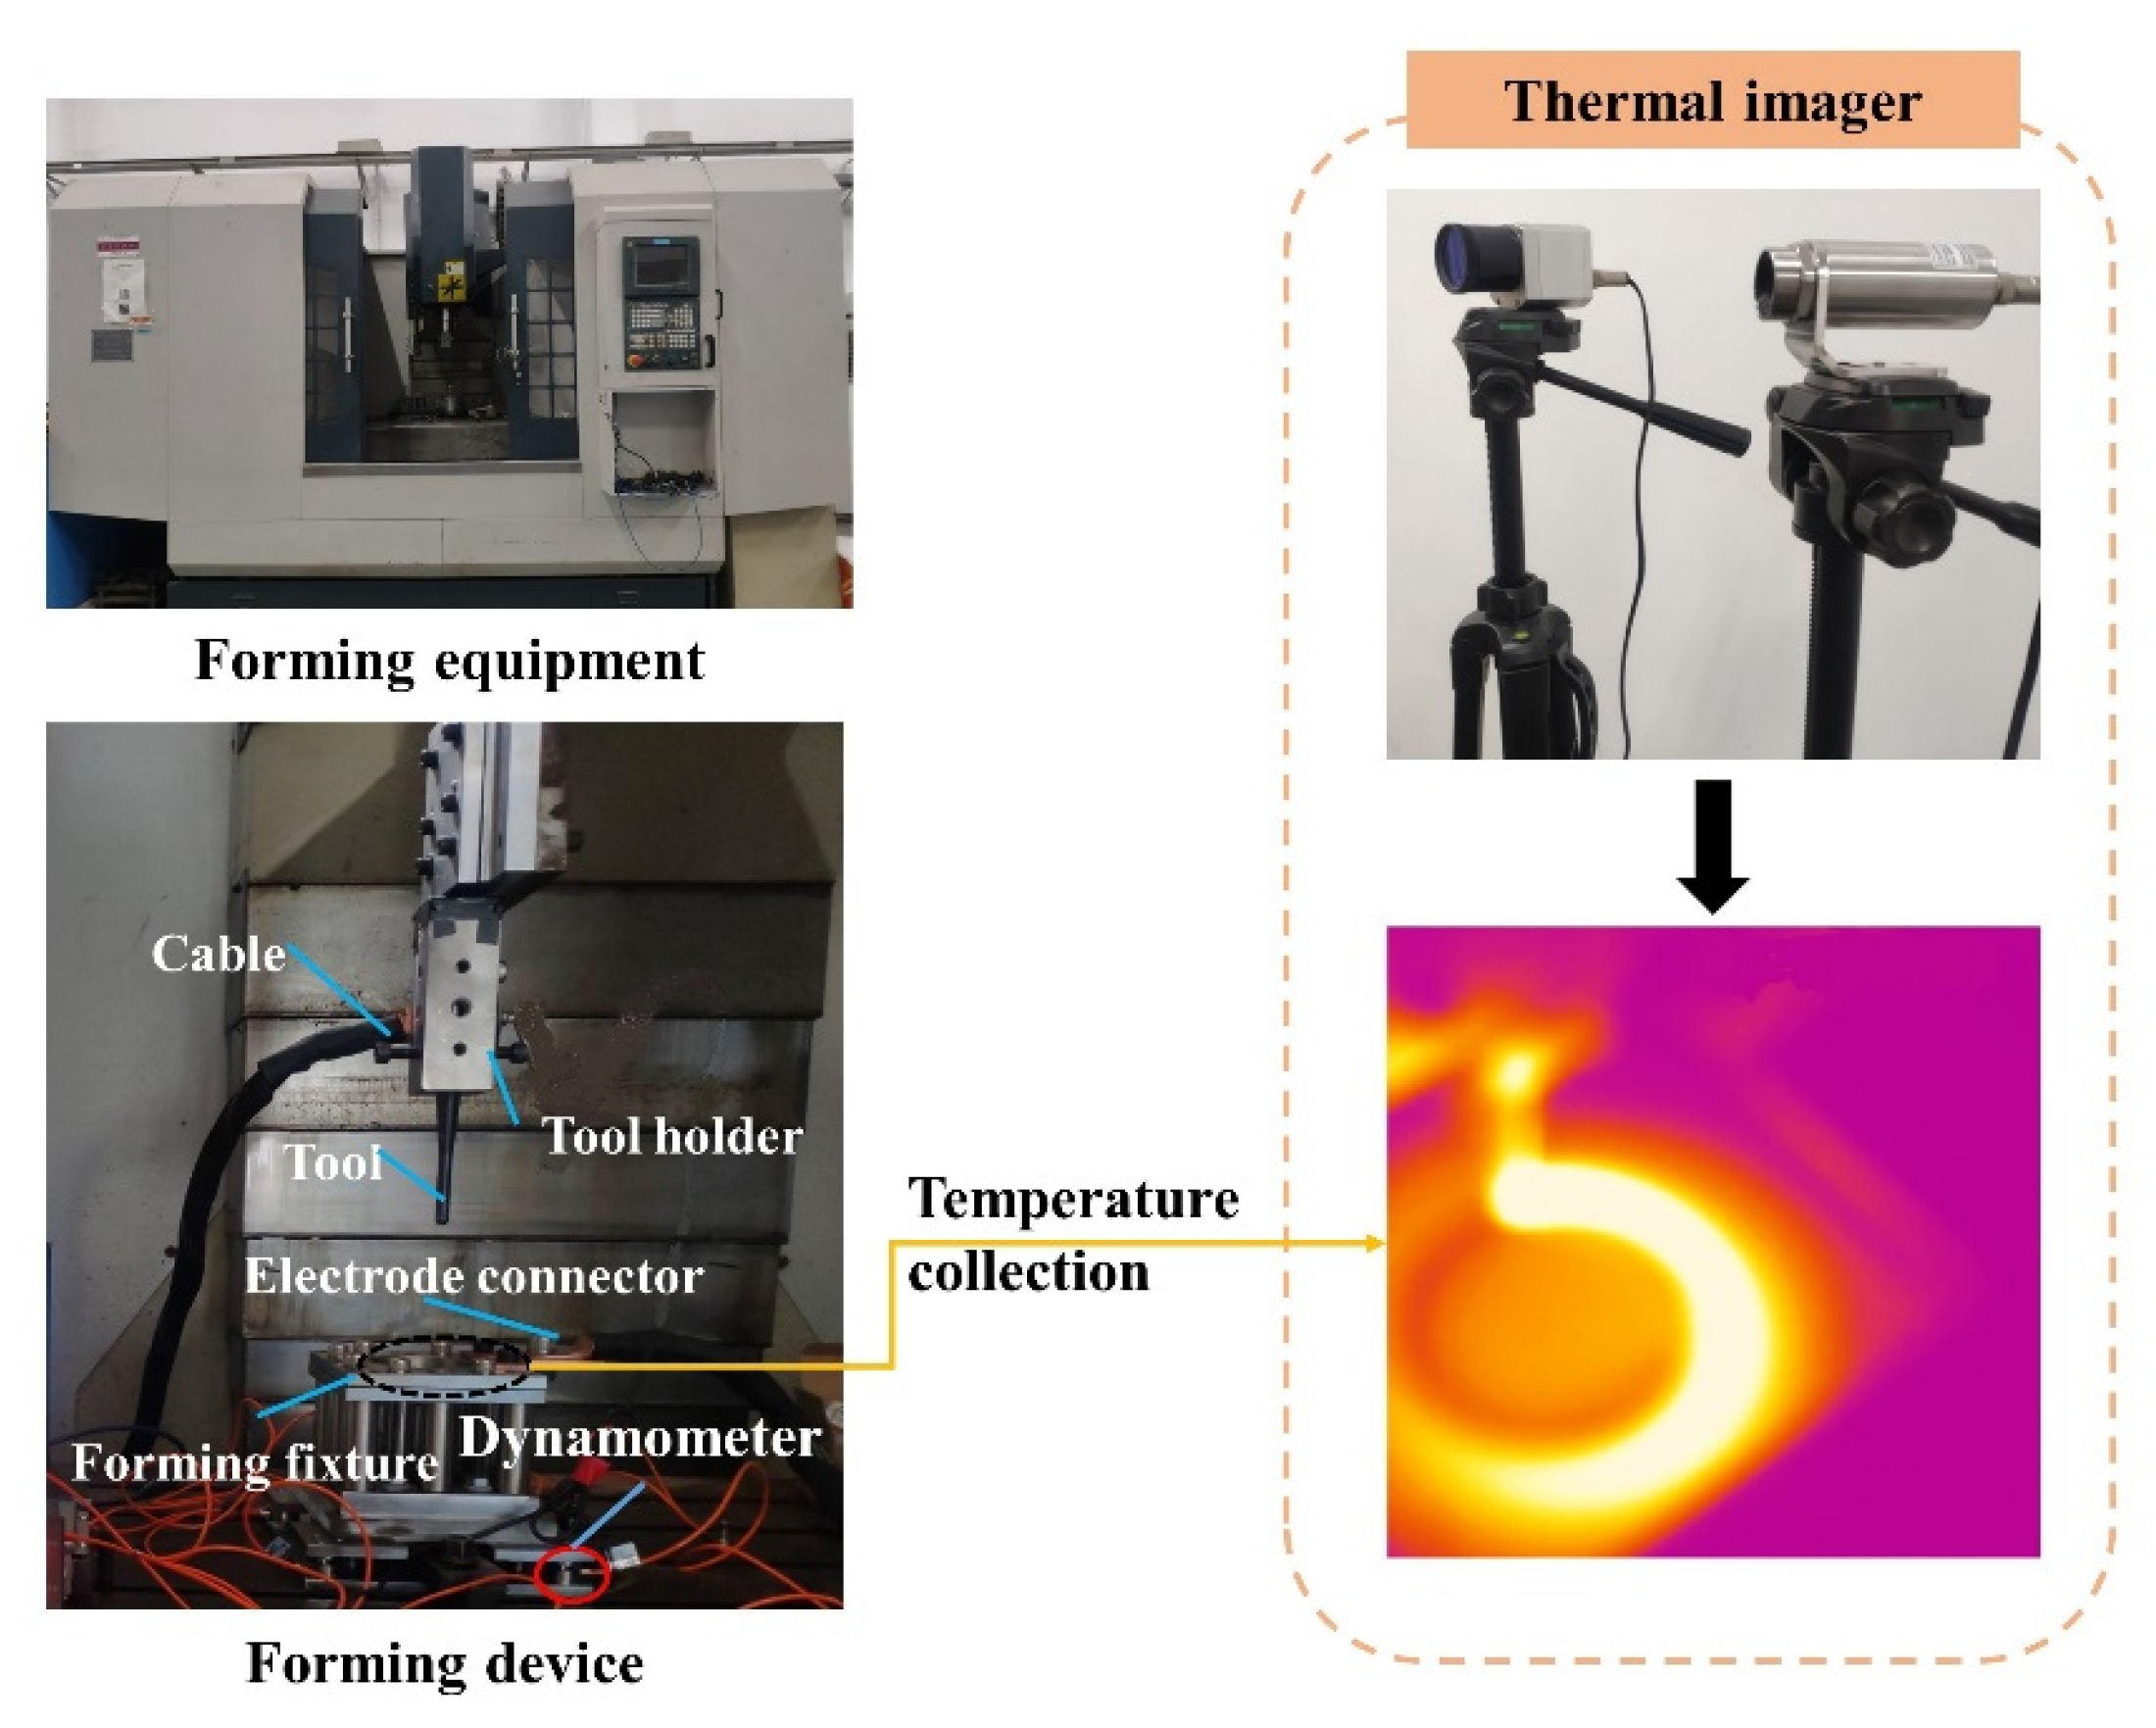
2. Materials and Methods
3. Results and Discussion
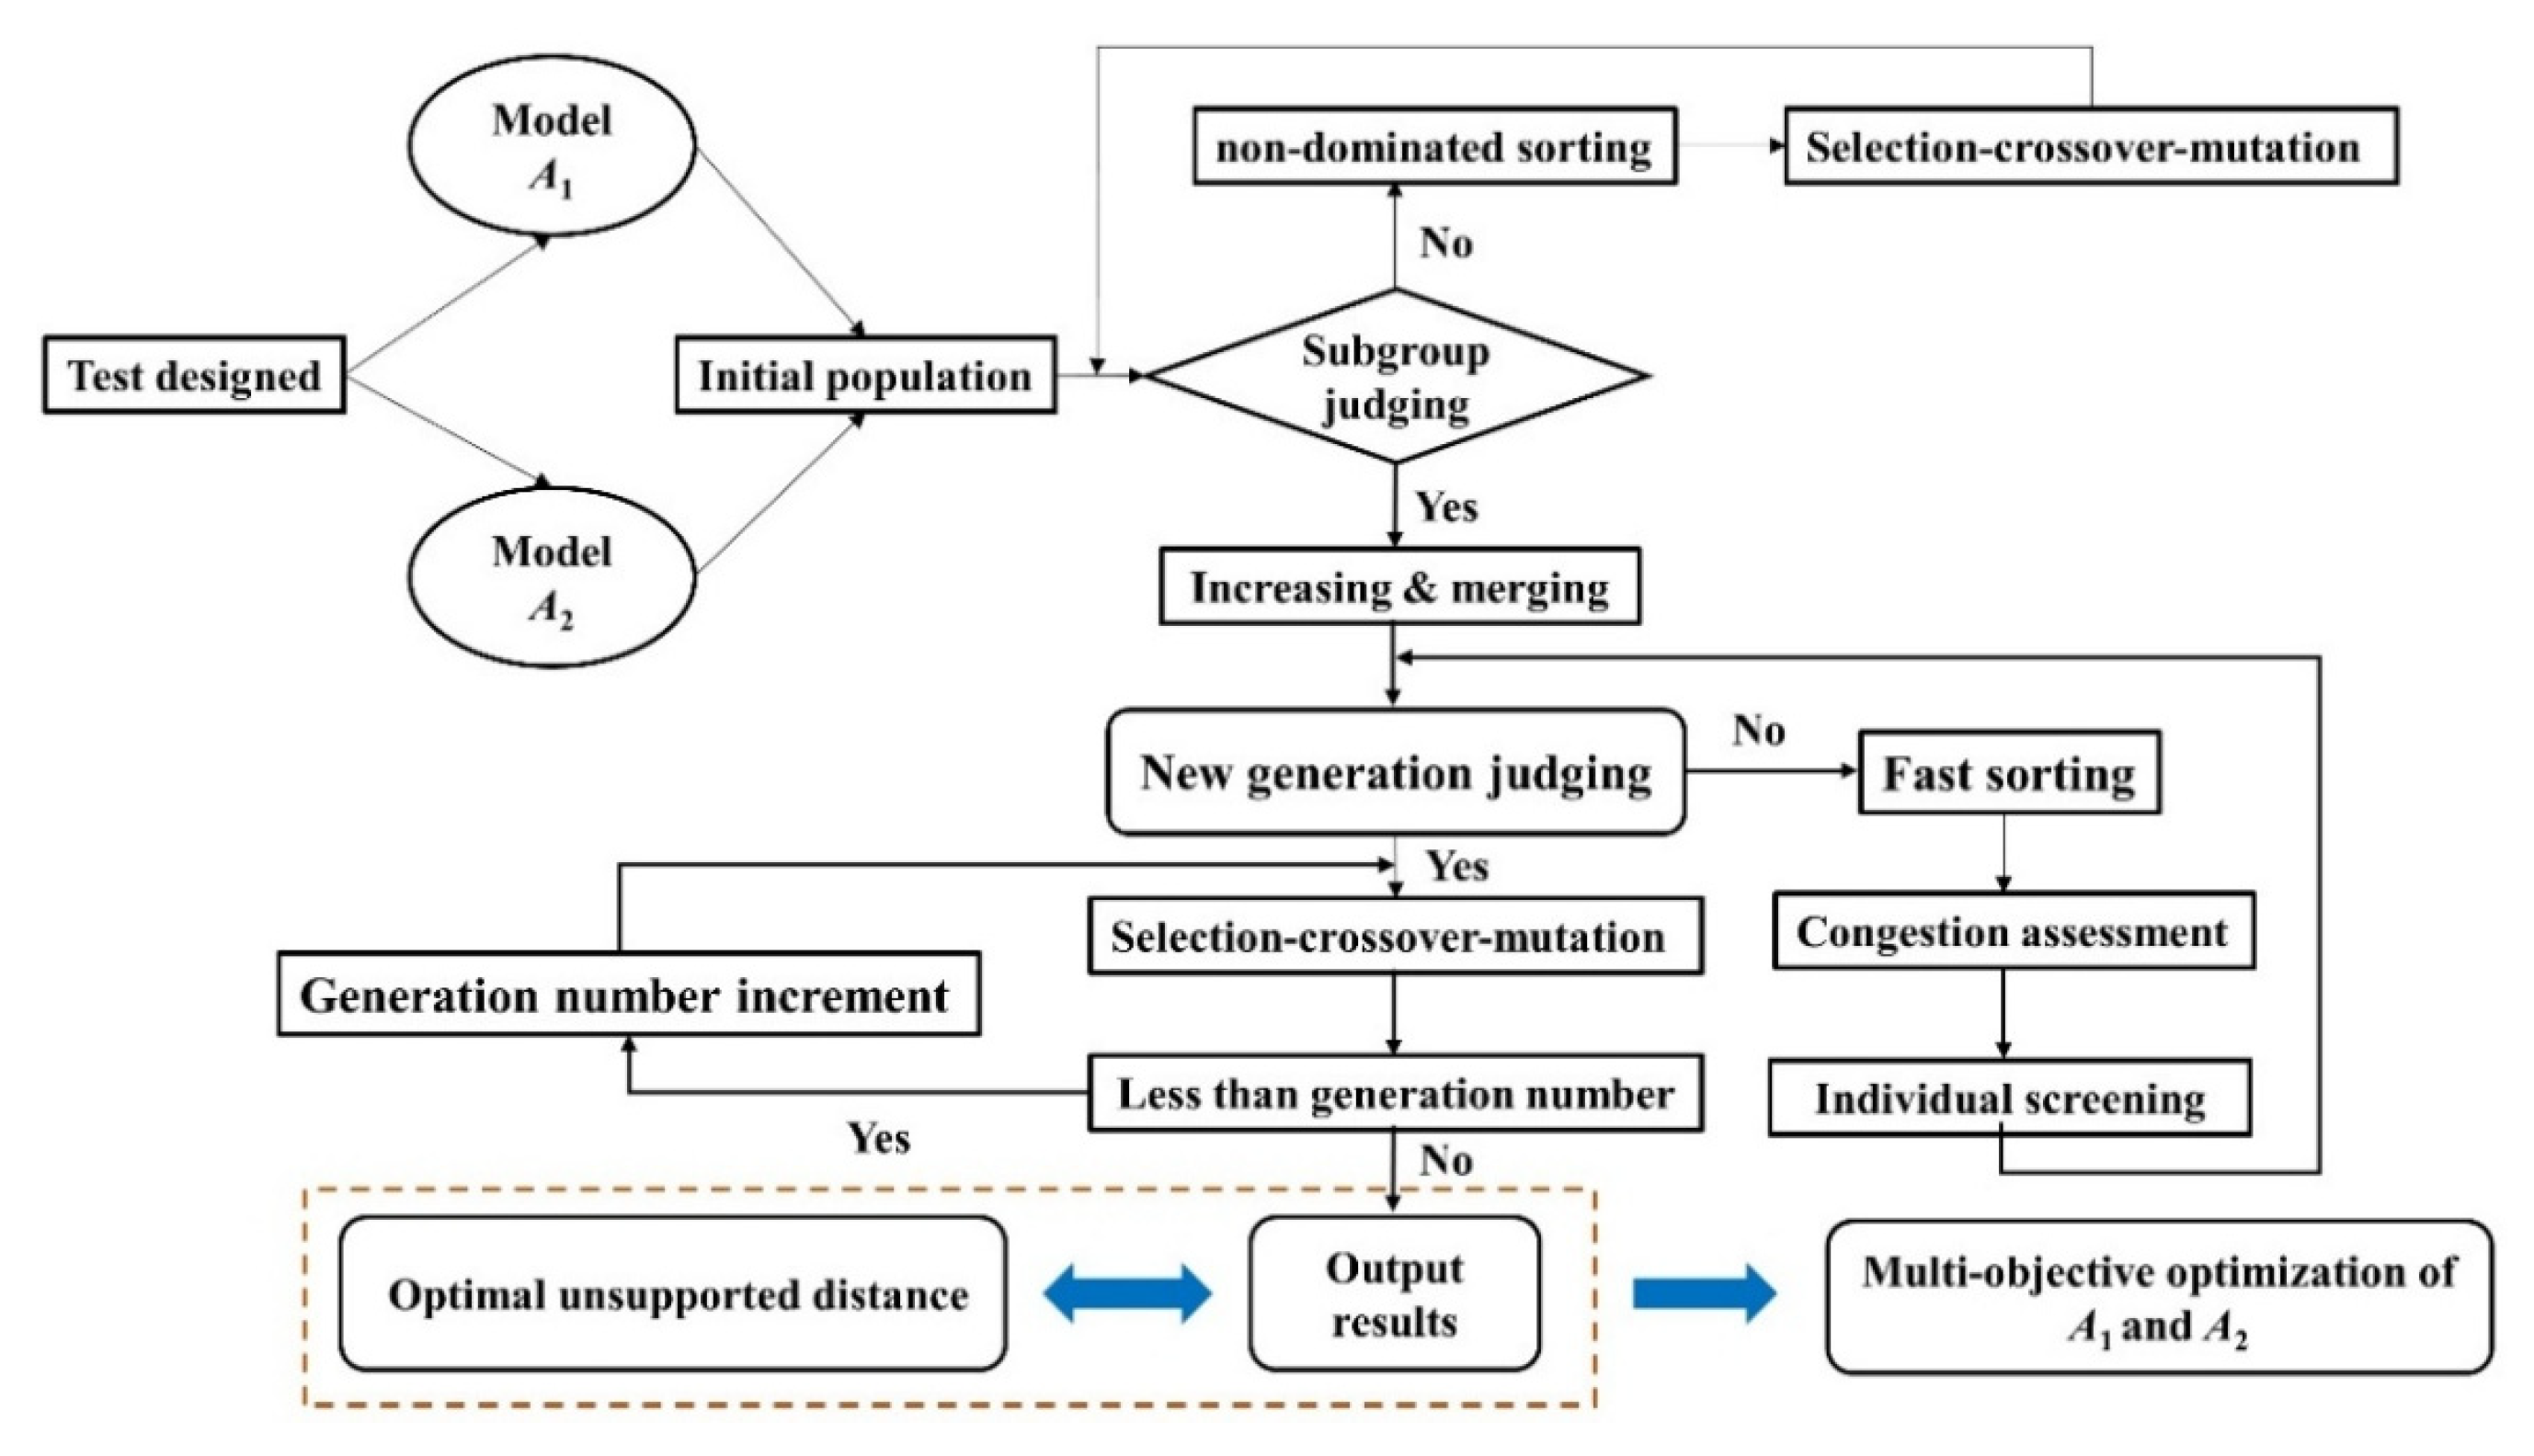
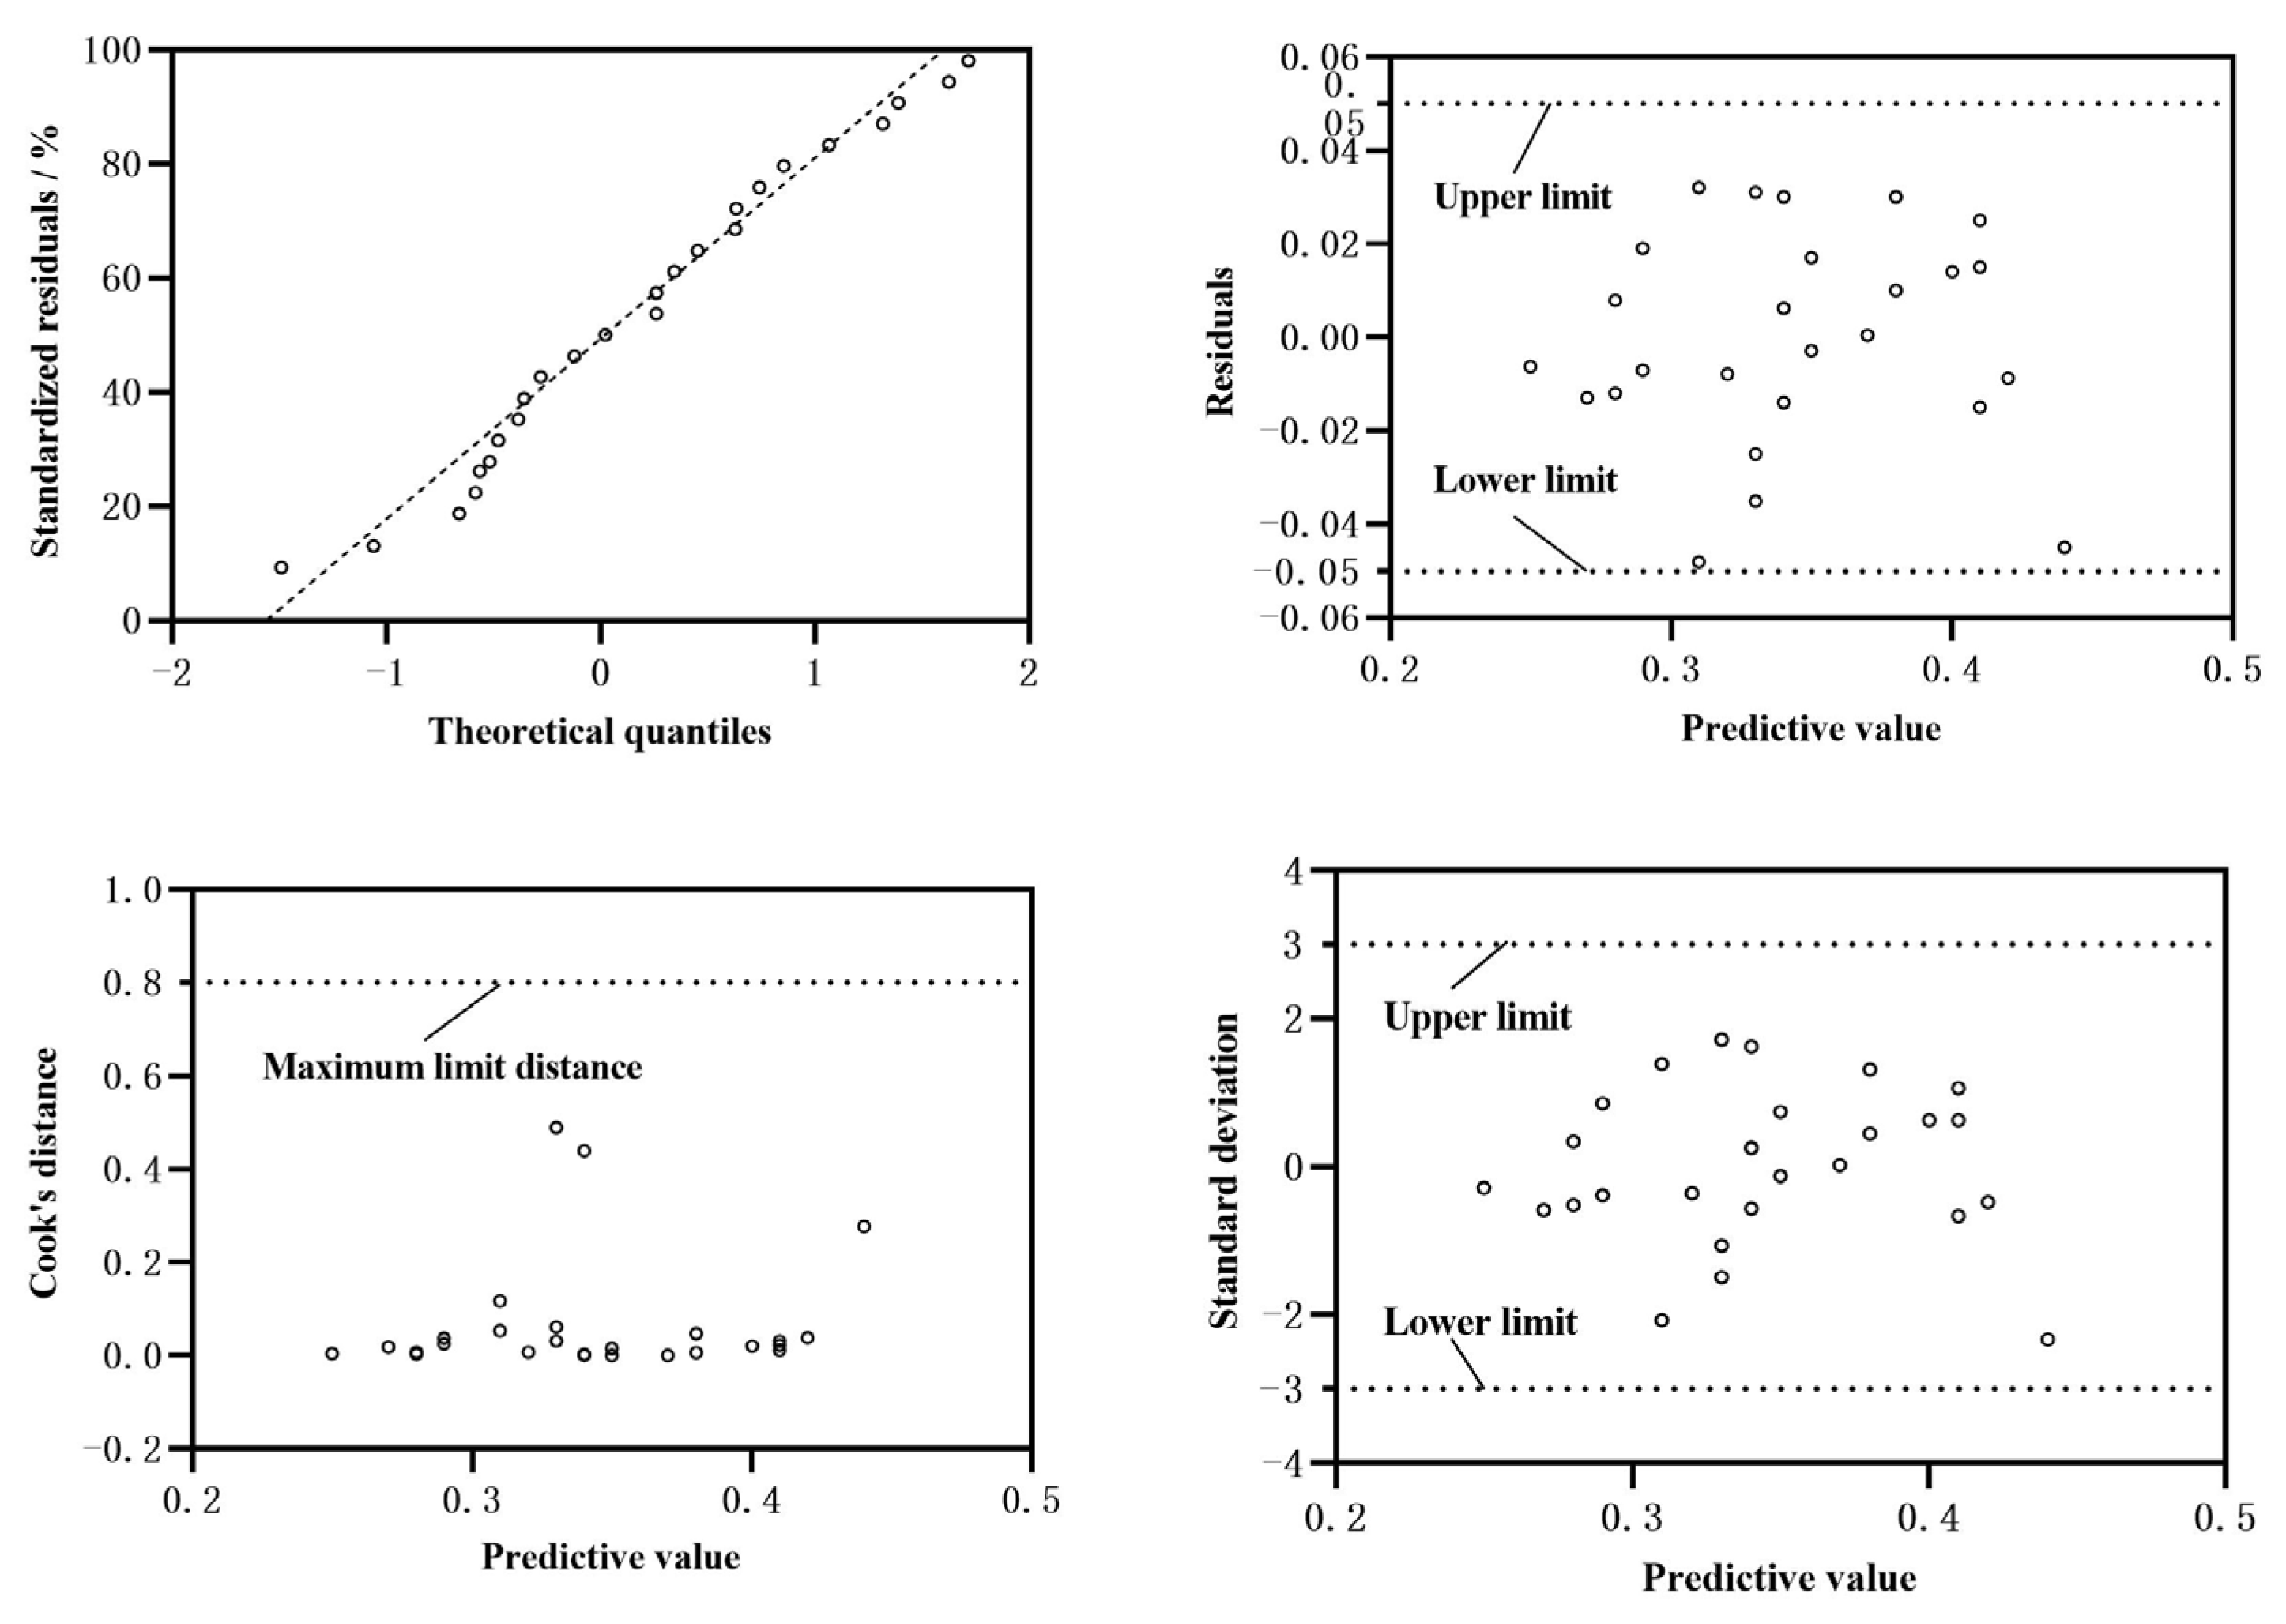
3.1. Establishment of the Prediction Model
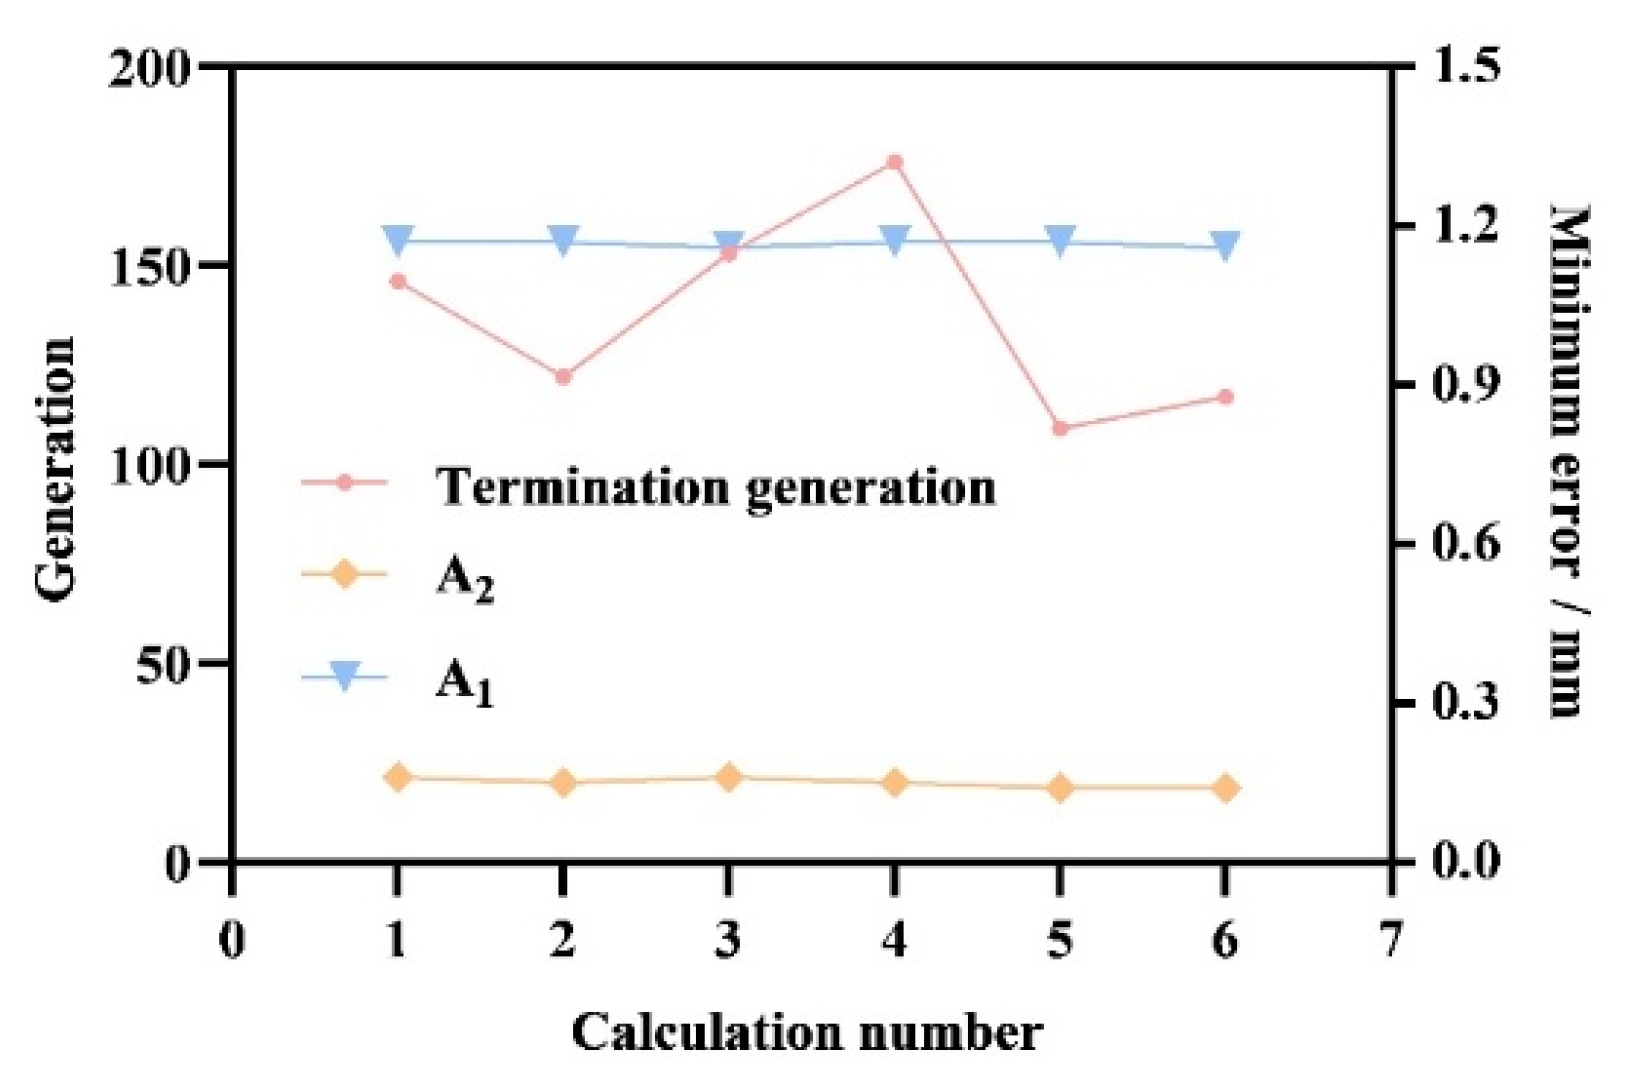
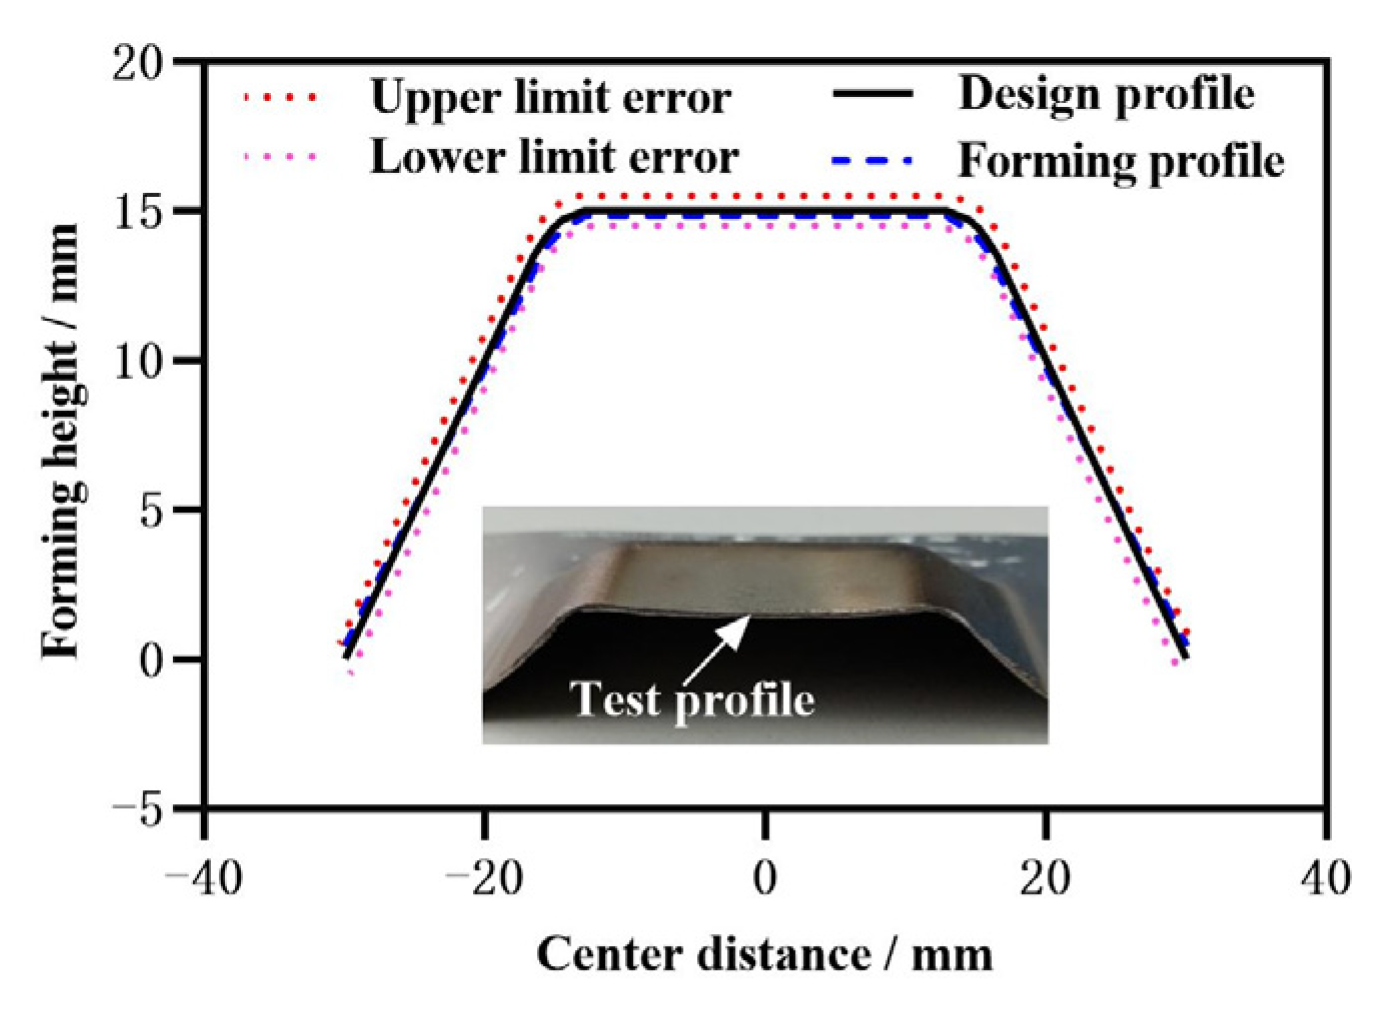
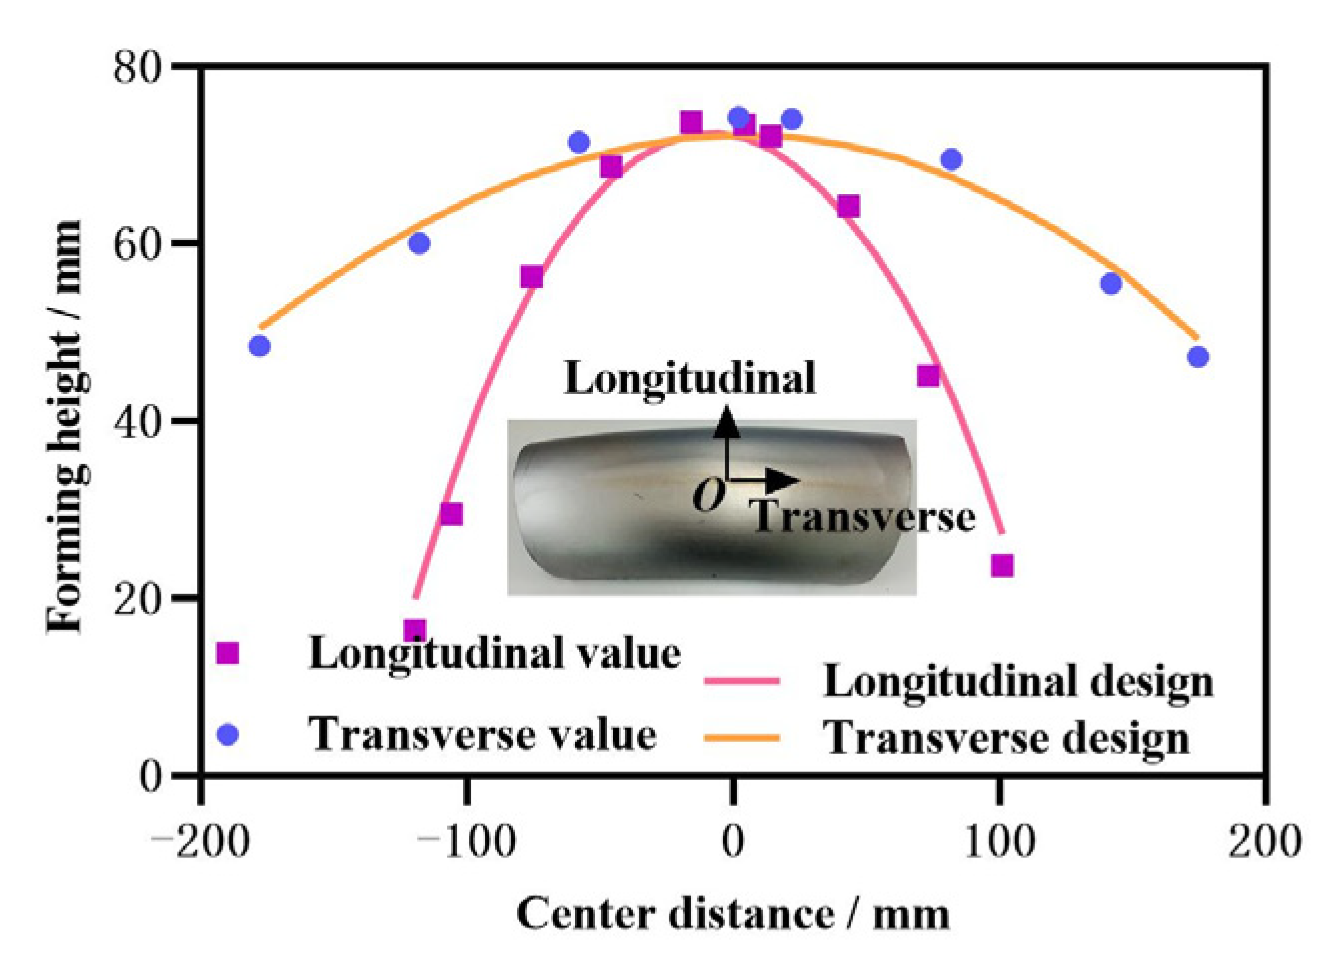
3.2. Effect of Optimal Parameters
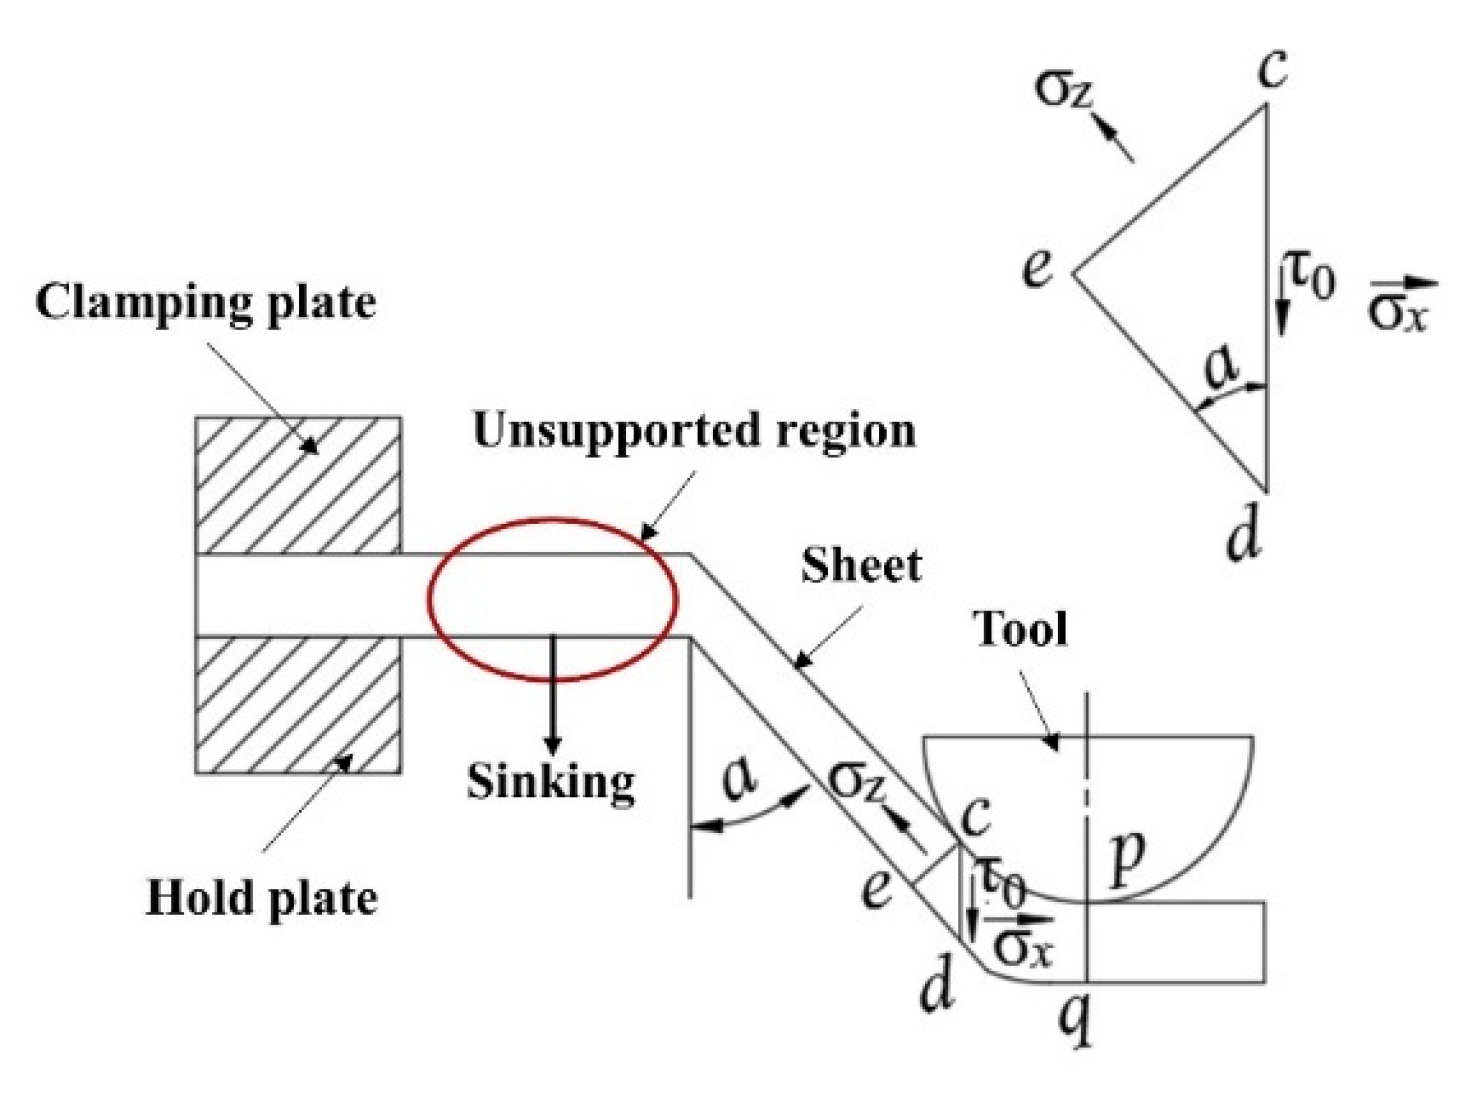
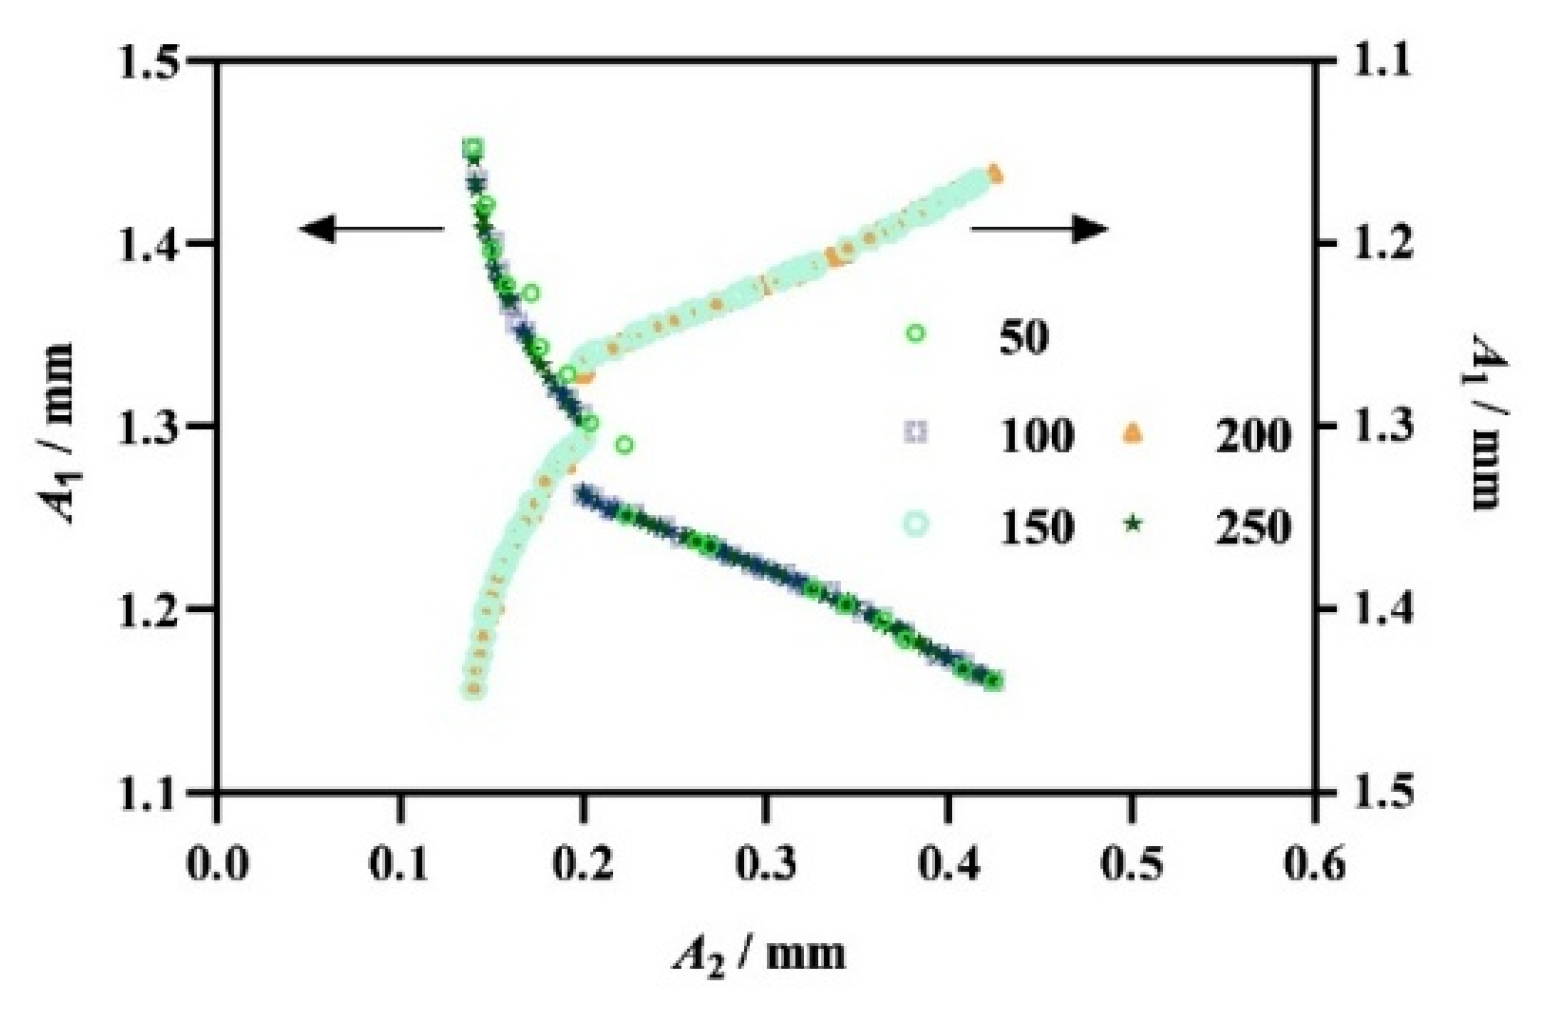
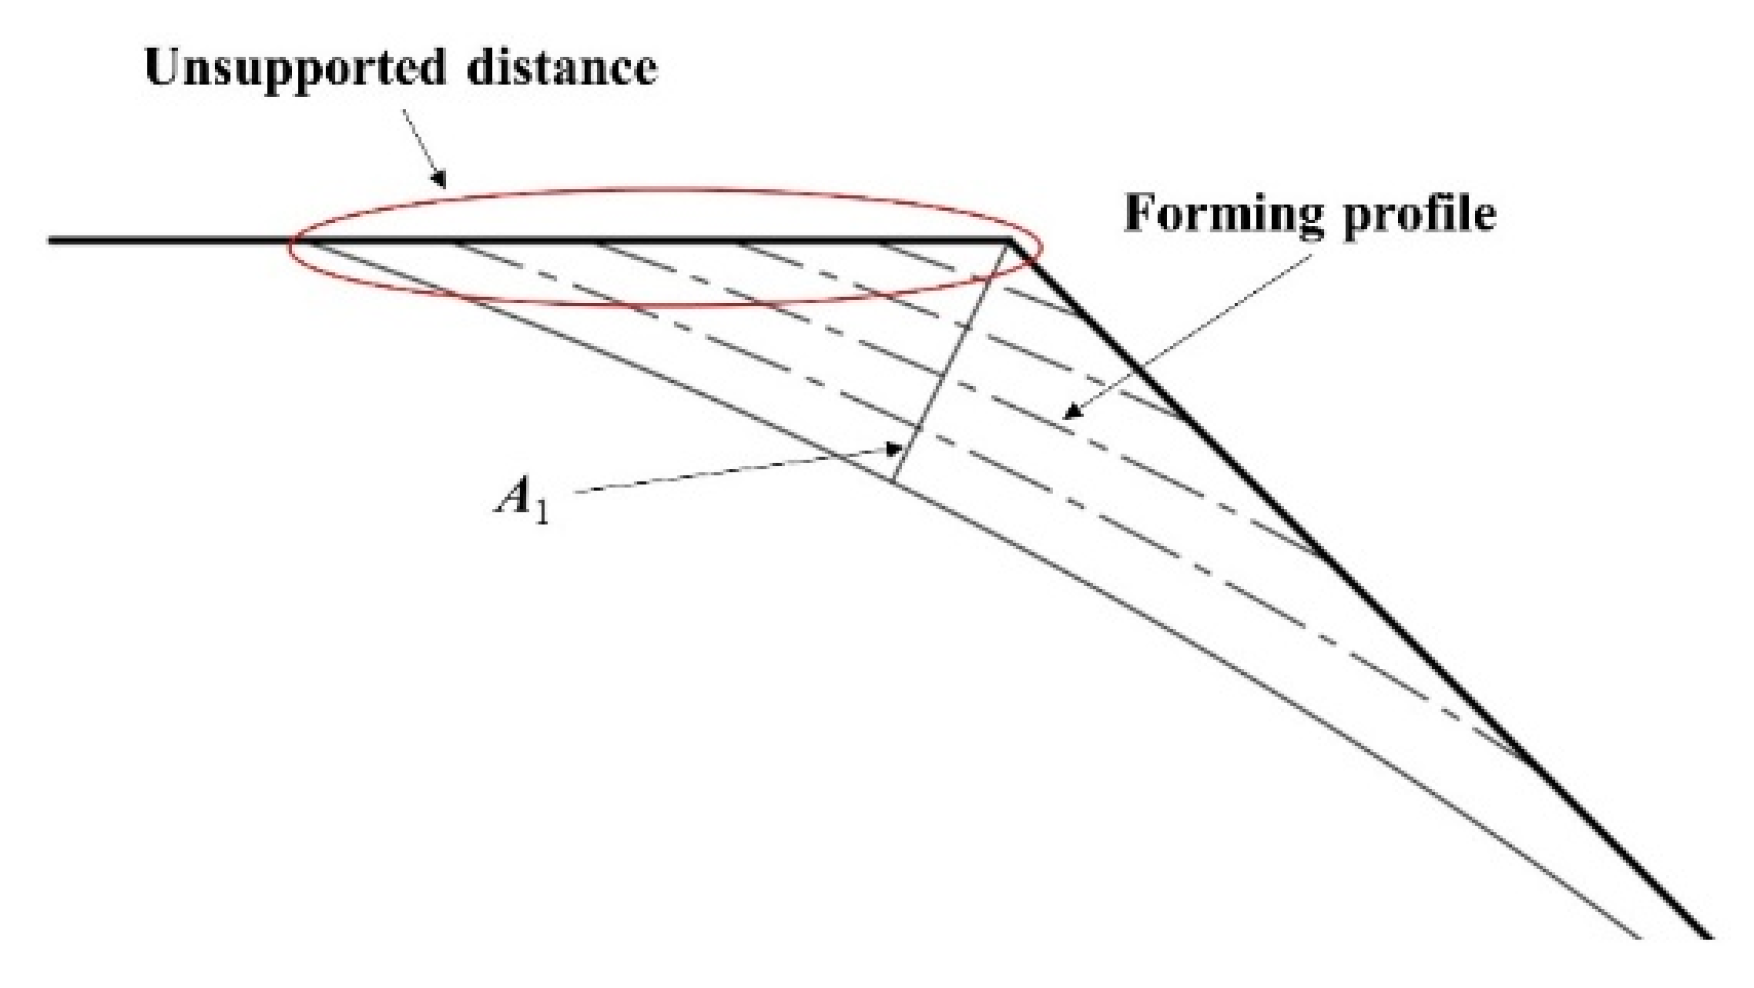
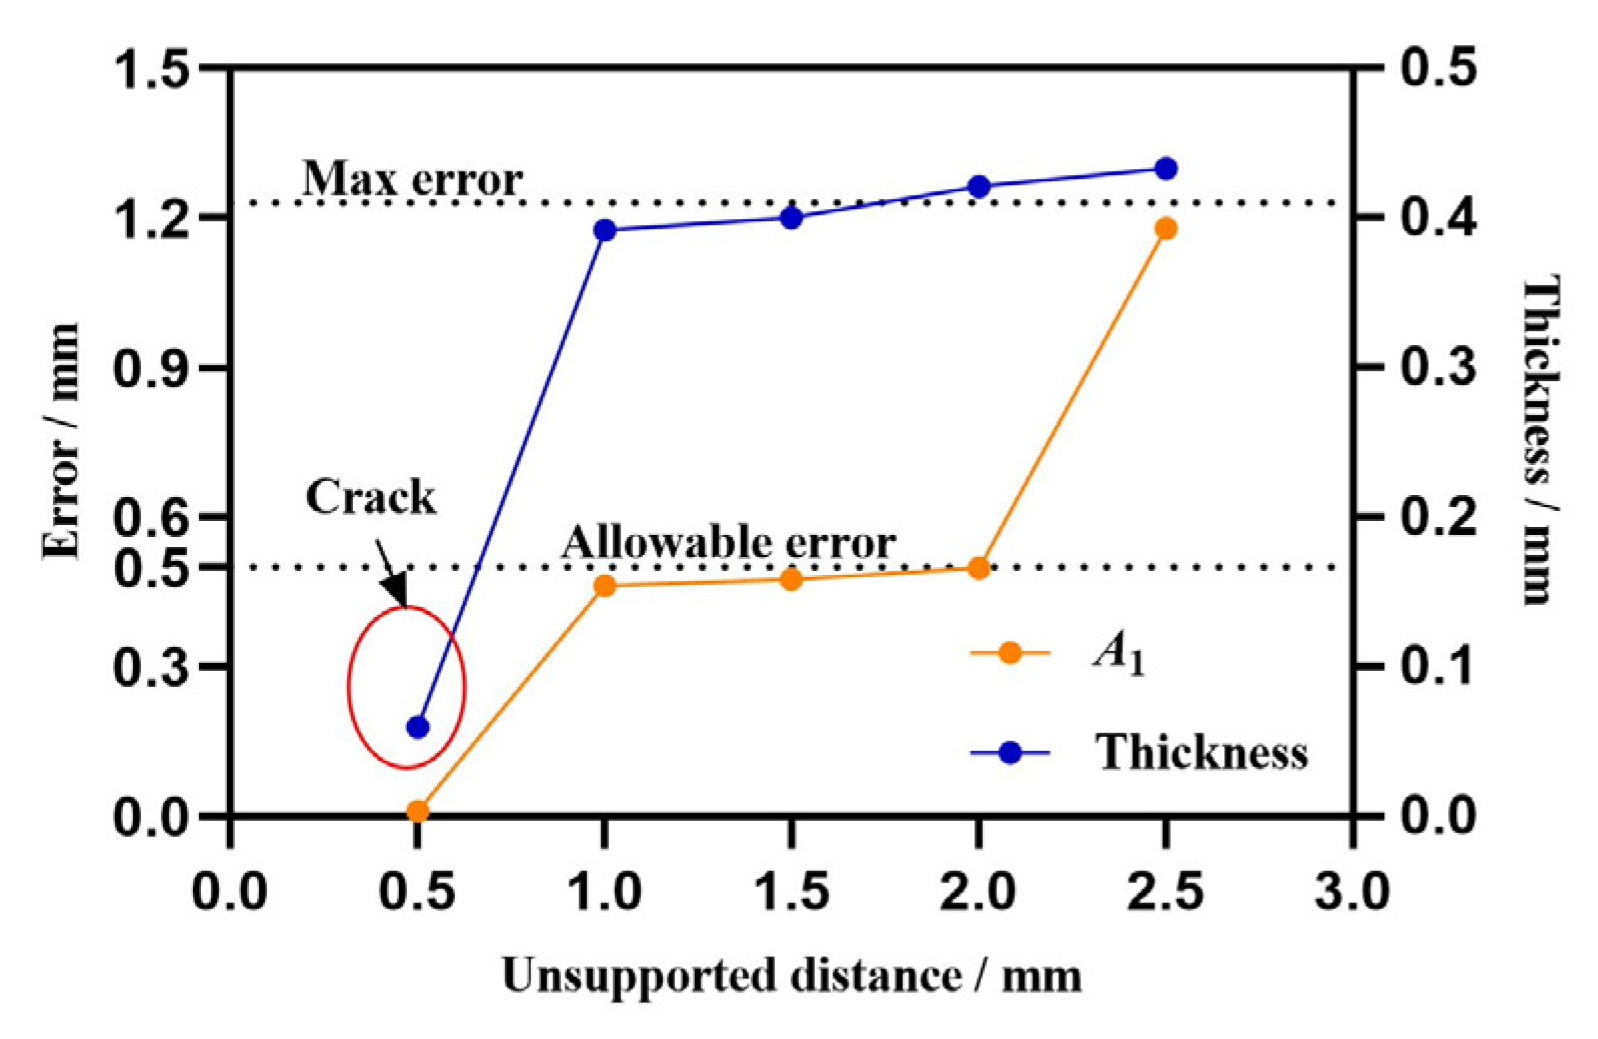
3.3. Effect of Unsupported Distances on A1
4. Conclusions
Author Contributions
Funding
Institutional Review Board Statement
Informed Consent Statement
Data Availability Statement
Conflicts of Interest
References
- Allwood, J.M.; King, G.P.F.; Duflou, J. A structured search for applications of the incremental sheet-forming process by product segmentation. Proc. Inst. Mech. Eng. B J. Eng. Manuf. 2005, 219, 239–244. [Google Scholar] [CrossRef]
- Allwood, J.M.; Braun, D.; Music, O. The effect of partially cut-out blanks on geometric accuracy in incremental sheet forming. J. Mater. Process. Technol. 2010, 210, 1501–1510. [Google Scholar] [CrossRef]
- Echrif, S.B.M.; Hrairi, M. Research and progress in incremental sheet forming processes. Mater. Manuf. Process. 2011, 26, 1404–1414. [Google Scholar] [CrossRef]
- Hu, Z.; Chang, X.; Dong, W.J. The generation of the forming path with the springback compensation in the CNC incremental forming. Int. J. Mater. Formin 2017, 1, 455–470. [Google Scholar]
- Ambrogio, G.; Palumbo, G.; Sgambitterra, E. Experimental investigation of the mechanical performances of titanium cranial prostheses manufactured by super plastic forming and single-point incremental forming. Int. J. Adv. Manuf. Technol. 2018, 98, 1489–1503. [Google Scholar] [CrossRef]
- Lu, H.; Kearney, M.; Li, Y.; Meehan, P. Model predictive control of incremental sheet forming for geometric accuracy improvement. Int. J. Adv. Manuf. Technol. 2016, 82, 1781–1794. [Google Scholar] [CrossRef]
- Lu, H.; Kearney, M.; Liu, S.; Daniel William, J.T.; Meehan Paul, A. Two directional toolpath correction in single-point incremental forming using model predictive control. Int. J. Adv. Manuf. Technol. 2016, 91, 91–106. [Google Scholar] [CrossRef]
- Ambrogio, G.; Gagliardi, F.; Filice, L. Robust design of incremental sheet forming by Taguchi’s method. Procedia CIRP 2013, 12, 270–275. [Google Scholar] [CrossRef]
- Wang, H.; Duncan, S. Optimization of tool trajectory for incremental sheet forming using closed loop control. In Proceedings of the IEEE International Conference on Automation Science and Engineering, Trieste, Italy, 24–27 August 2011; pp. 779–784. [Google Scholar]
- Zhu, H.; Han, F.; Liu, Y. The effect of the extrusion direction on the incremental forming quality considering tool deformation. Int. J. Adv. Manuf. Technol. 2018, 97, 1835–1846. [Google Scholar] [CrossRef]
- Mohammadi, A.; Vanhove, H.; Van Bael, A.; Seefeldt, M.; Duflou, J.R. Effect of laser transformation hardening on the accuracy of SPIF formed parts. J. Manuf. Sci. Eng. 2016, 139, 011007. [Google Scholar] [CrossRef]
- Galdos, L.; Argandona, E.S.D.; Ulacia, I.; Arruebarrena, G. Warm incremental forming ofmagnesium alloys using hot fluid as heating media. Key Eng. Mater. 2012, 504, 815–820. [Google Scholar] [CrossRef]
- Fan, G.; Gao, L.; Hussain, G.; Wu, Z. Electric hot incremental forming: A novel technique. Int. J. Mach. Tools Manuf. 2008, 48, 1688–1692. [Google Scholar] [CrossRef]
- Li, Z.; Lu, S.; Zhang, T.; Zhang, C.; Mao, Z. Electric assistance hot incremental sheet forming: An integral heating design. Int. J. Adv. Manuf. Technol. 2018, 96, 3209–3215. [Google Scholar] [CrossRef]
- Ao, D.; Gao, J.; Chu, X.; Lin, S.; Lin, J. Formability and deformation mechanism of Ti-6Al-4V sheet under electropulsing assisted incremental forming. Int. J. Solids Struct. 2020, 202, 357–367. [Google Scholar] [CrossRef]
- Badreddine, S.; Giraud, M.L.; Abel, C.; Rachid, N. Experimental and numerical study on warm single-point incremental sheet forming (WSPIF) of titanium alloy Ti-6Al-4V, using cartridge heaters. J. Braz. Soc. Mech. Sci. 2020, 43, 534. [Google Scholar]
- Changxu, X.; Yanle, L.; Zijian, W.; Cheng, Z.; Liu, F. The influence of self-lubricating coating during incremental sheet forming of TA1 sheet. Int. J. Adv. Manuf. Technol. 2020, 110, 2465–2477. [Google Scholar]
- Mohanraj, R.; Elangovan, S. Thermal modeling and experimental investigation on the influences of the process parameters on warm incremental sheet metal forming of titanium grade 2 using electric heating technique. Int. J. Adv. Manuf. Technol. 2020, 110, 255–274. [Google Scholar] [CrossRef]
- Renhao, W.; Meng, L.; Xinmei, L.; Cai, S.; Chen, J. Characterization of material flow in friction stir-assisted incremental forming with synchronous bonding of dissimilar sheet metals. Int. J. Adv. Manuf. Technol. 2020, 109, 2523–2534. [Google Scholar]
- Veera, A.C. Parameter optimization in incremental forming of titanium alloy material. Trans. Indian Inst. Met. 2020, 73, 2403–2413. [Google Scholar]
- Fan, G.; Gao, L. Mechanical property of Ti-6Al-4V sheet in one-sided electric hot incremental forming. Int. J. Adv. Manuf. Technol. 2014, 72, 989–994. [Google Scholar] [CrossRef]
- Ambrogio, G.; Filice, L.; Gagliardi, F. Formability of lightweight alloys by hot incremental sheet forming. Mater. Design 2012, 34, 501–508. [Google Scholar] [CrossRef]
- Skjoedt, M.; Hancock, M.H.; Bay, N. Creating helical tool paths for single point incremental forming. Key Eng. Mater. 2007, 344, 583–590. [Google Scholar] [CrossRef]
- Shi, X.; Gao, L.; Khalatbari, H.; Xu, Y.; Wang, H.; Jin, L. Electric hot incremental forming of low carbon steel sheet: Accuracy improvement. Int. J. Adv. Manuf. Technol. 2013, 68, 241–247. [Google Scholar] [CrossRef]
- Low, D.W.W.; Chaudhari, A.; Kumar, D.; Kumar, A.S. Convolutional neural networks for prediction of geometrical errors in incremental sheet metal forming. J. Intell. Manuf. 2023, 34, 2373–2386. [Google Scholar] [CrossRef]
- Honarpisheh, M.; Abdolhoseini, M.J.; Amini, S. Experimental and numerical investigation of the hot incremental forming of Ti-6Al-4V sheet using electrical current. Int. J. Adv. Manuf. Technol. 2016, 83, 2027–2037. [Google Scholar] [CrossRef]
- Li, Z.F.; Lu, S.H.; Zhang, T.; Zhang, C.; Mao, Z.X. 1060 Al electric hot incremental sheet forming process: Analysis of dimensional accuracy and temperature. Trans. Indian Inst. Met. 2018, 71, 961–970. [Google Scholar] [CrossRef]


| Code | Factor | Level | ||
|---|---|---|---|---|
| −1 | 0 | 1 | ||
| a | d/z (mm) | 8/0.1 | 10/0.15 | 12/0.2 |
| b | f (mm·min−1) | 500 | 650 | 800 |
| c | g (A) | 30 | 40 | 50 |
| No. | a | b | c | A1/mm | A2/mm |
|---|---|---|---|---|---|
| 1 | 1.00 | −1.00 | 0.00 | 1.24 | 0.28 |
| 2 | −1.00 | 1.00 | 0.00 | 1.67 | 0.14 |
| 3 | 1.00 | 1.00 | 0.00 | 1.25 | 0.34 |
| 4 | 0.00 | 0.00 | 0.00 | 1.26 | 0.31 |
| 5 | 0.00 | −1.00 | −1.00 | 1.25 | 0.18 |
| 6 | 0.00 | 0.00 | 0.00 | 1.26 | 0.31 |
| 7 | 0.00 | 0.00 | 0.00 | 1.26 | 0.31 |
| 8 | −1.00 | −1.00 | 0.00 | 1.25 | 0.13 |
| 9 | −1.00 | 0.00 | 1.00 | 1.55 | 0.27 |
| 10 | 0.00 | 0.00 | 0.00 | 1.26 | 0.31 |
| 11 | 0.00 | 0.00 | 0.00 | 1.26 | 0.31 |
| 12 | 0.00 | 1.00 | 1.00 | 1.39 | 0.44 |
| 13 | 1.00 | 0.00 | 1.00 | 1.36 | 0.14 |
| 14 | 0.00 | 1.00 | −1.00 | 1.39 | 0.44 |
| 15 | −1.00 | 0.00 | −1.00 | 1.55 | 0.27 |
| 16 | 0.00 | −1.00 | 1.00 | 1.25 | 0.18 |
| 17 | 1.00 | 0.00 | −1.00 | 1.36 | 0.14 |
| A1 | Sum Sq. | Df | Mean Sq. | F-Value | p-Value | Significance |
|---|---|---|---|---|---|---|
| a | 0.082 | 1 | 0.082 | 163.17 | 0.0001 | ** |
| b | 0.063 | 1 | 0.063 | 125.37 | 0.0001 | ** |
| ab | 0.042 | 1 | 0.042 | 83.61 | 0.0001 | ** |
| a2 | 0.054 | 1 | 0.054 | 106.56 | 0.0001 | ** |
| c2 | 0.027 | 1 | 0.027 | 53.94 | 0.0001 | ** |
| A2 | Sum Sq. | Df | Mean Sq. | F-value | p-value | Significance |
| a2 | 0.13 | 1 | 0.13 | 22.23 | 0.0005 | ** |
| b2 | 0.035 | 1 | 0.035 | 6.20 | 0.0284 | * |
Disclaimer/Publisher’s Note: The statements, opinions and data contained in all publications are solely those of the individual author(s) and contributor(s) and not of MDPI and/or the editor(s). MDPI and/or the editor(s) disclaim responsibility for any injury to people or property resulting from any ideas, methods, instructions or products referred to in the content. |
© 2023 by the authors. Licensee MDPI, Basel, Switzerland. This article is an open access article distributed under the terms and conditions of the Creative Commons Attribution (CC BY) license (https://creativecommons.org/licenses/by/4.0/).
Share and Cite
Li, Z.; He, S.; An, Z.; Gao, Z.; Lu, S. Multi-Objective Optimization of Dimensional Accuracy in Electric Hot Incremental Sheet Forming. Coatings 2023, 13, 923. https://doi.org/10.3390/coatings13050923
Li Z, He S, An Z, Gao Z, Lu S. Multi-Objective Optimization of Dimensional Accuracy in Electric Hot Incremental Sheet Forming. Coatings. 2023; 13(5):923. https://doi.org/10.3390/coatings13050923
Chicago/Turabian StyleLi, Zhengfang, Songlin He, Zhiguo An, Zhengyuan Gao, and Shihong Lu. 2023. "Multi-Objective Optimization of Dimensional Accuracy in Electric Hot Incremental Sheet Forming" Coatings 13, no. 5: 923. https://doi.org/10.3390/coatings13050923
APA StyleLi, Z., He, S., An, Z., Gao, Z., & Lu, S. (2023). Multi-Objective Optimization of Dimensional Accuracy in Electric Hot Incremental Sheet Forming. Coatings, 13(5), 923. https://doi.org/10.3390/coatings13050923