1. Introduction
Global warming was internationally recognized under the Kyoto treaty protocol signed in December 1997 urging state parties to commit to the reduction of greenhouse gasses. This imposed on all sectors the need for a net CO
2 reduction, so as to achieve the goal of keeping a global temperature rise under control. Specifically, during COP21 the Paris agreement was adopted, establishing the goal to limit global warming to “well below 2 degrees Celsius, preferably 1.5 degrees Celsius below pre-industrial levels” [
1]. During the COP26 conference in Glasgow, the Paris agreement parameters were strengthened, while recognizing that “limiting global warming to 1.5 °C requires rapid, deep, and sustained reductions in global greenhouse gas emissions, including reducing global carbon dioxide emissions by 45 per cent by 2030 relative to the 2010 level and to achieve net zero around mid-century, as well as deep reductions in other greenhouse gasses” [
2]. These targets can only be reached by a net limitation of fossil carbon, such as petrol, natural gas and coal, not only as energy resources but as raw materials for each industrial sector. Among the many emerging concepts, the “bioeconomy” is perfectly aligned to the net zero scope. In 2012 it was defined by the European Commission as “the production of renewable biological resources and their conversion and waste into products with high added value, such as food, feed, bioproducts and bioenergy” [
3]. In a more recent document, the European Commission sets the basis for a “Sustainable European bioeconomy necessary to build a carbon neutral future in line with the Climate objectives of the Paris Agreement”. The document states “the way to a more innovative, resource efficient and competitive society that reconciles food security with the sustainable use of renewable resources for industrial purposes, while ensuring environmental protection” [
4]. All these concepts can be translated into the development of biomass carbon-based fuels, food and raw materials for every single sector avoiding fossil sources. In this context, a reliable method to quantify fossil/biomass carbon proportions becomes vital to the scope of measuring the circularity of the future materials. In this regard, a decree of the French Republic [
5] “on the provision of information to consumers on the environmental qualities and characteristics of products from which waste is produced”, defines in its scope “the incorporation of recycled material, the use of renewable resources, durability, compostability, repairability, reusability, recyclability, the presence of hazardous substances, precious metals or rare earths, traceability and the presence of plastic microfibres” with special attention to the communication of a material’s and article’s characteristics towards appropriate labeling and accessibility to relevant data in network platforms. This decree recalls the need for scientifically backed analytical methods to support such claims.
If we consider sustainability in a cradle-to-cradle optic, it is fundamental to divide the environmental impact calculation in a series of circular events with the material to be analyzed as the main reference. In this context, the intrinsic contribution of an organic material gains importance as support to understand the contribution of renewable/non-renewable carbon sources. Clearly this is not the only parameter to consider. Industrial production of materials involves energy consumption, transport, chemical intermediates, solvents, waste and water treatment, etc., all events which must be precisely measured to understand the overall impact to attribute it.
The fashion materials sector took this opportunity to propose different materials, sometimes promoting them with misleading sustainability claims such as “eco”, “plant-based”, “circular”, “animal-free”, “cruelty-free”, “recycled waste”, “biobased”, “vegan”, “metal free”, etc., and frequently with scant scientific backing. In this context the fashion market has experienced the proliferation of materials said to be based on natural raw materials such as Appleskin
®, based on apple peels and cores, Desserto
®, based on cactus, Vegea
® based on grapes, Piñatex
® based on pineapple fibre, Teak Leaf
®, SnapPap
®, Kombucha and others. Recently, Meyer et al. [
6] described some of these materials in terms of composition and structure, touch and feel properties, thickness, tensile and tear strength, water vapor permeability and absorption, and presence of harmful substances. Thinking on a circularity basis, it is important to understand the intrinsic contribution of biobased/fossil carbon as a way to transparently discriminate against the most sustainable material choices.
Radiocarbon analysis is well recognized as a reliable technique to quantify biobased carbon content in terms of biomass/fossil carbon proportions. Liquid Scintillation Counting (LSC) [
7] and Accelerator Mass Spectrometry (AMS) [
8] are the usual methods for radiocarbon quantification. On the one hand, LSC instruments are cost effective but provide low precision and require long measurement time and hazardous sample preparation. On the other hand, AMS is the benchmark technique in terms of precision, but instruments are expensive and highly energy consuming. Our research team has identified the recently developed SCAR (Saturated-absorption CAvity Ring-down) spectroscopy as the most suitable technique for large-scale characterization of biobased content in materials since it meets precise and fast measurements, affordable cost and low energy consumption.
2. SCAR (Saturated-Absorption CAvity Ring-Down) Spectroscopy Analysis
2.1. Measurement Technique
In SCAR spectroscopy, infrared radiation emitted by a quantum cascade laser (QCL) is coupled to a high-finesse Fabry–Perot cavity up to a threshold level, and then it is quickly switched off at the cavity resonance. Transmitted light during the ring-down time is detected and the decay rate is measured. If a molecular species inside the cavity absorbs the coupled light, it increases the cavity loss rate, and such variation is measured. The difference with respect to conventional cavity ring-down spectroscopy (CRDS) is that saturation effects of the molecular absorption induce a deviation of the ring-down signal from the perfectly exponential behavior, as expected for linear intra-cavity losses [
9]. Starting from an ab initio theoretical model, a fitting routine was developed taking into account the transient effects due to a changing saturation level, and retrieving from each single CRD decay event both the empty-cavity and the gas-induced losses and the corresponding decay rates for the intra-cavity infrared radiation [
10].
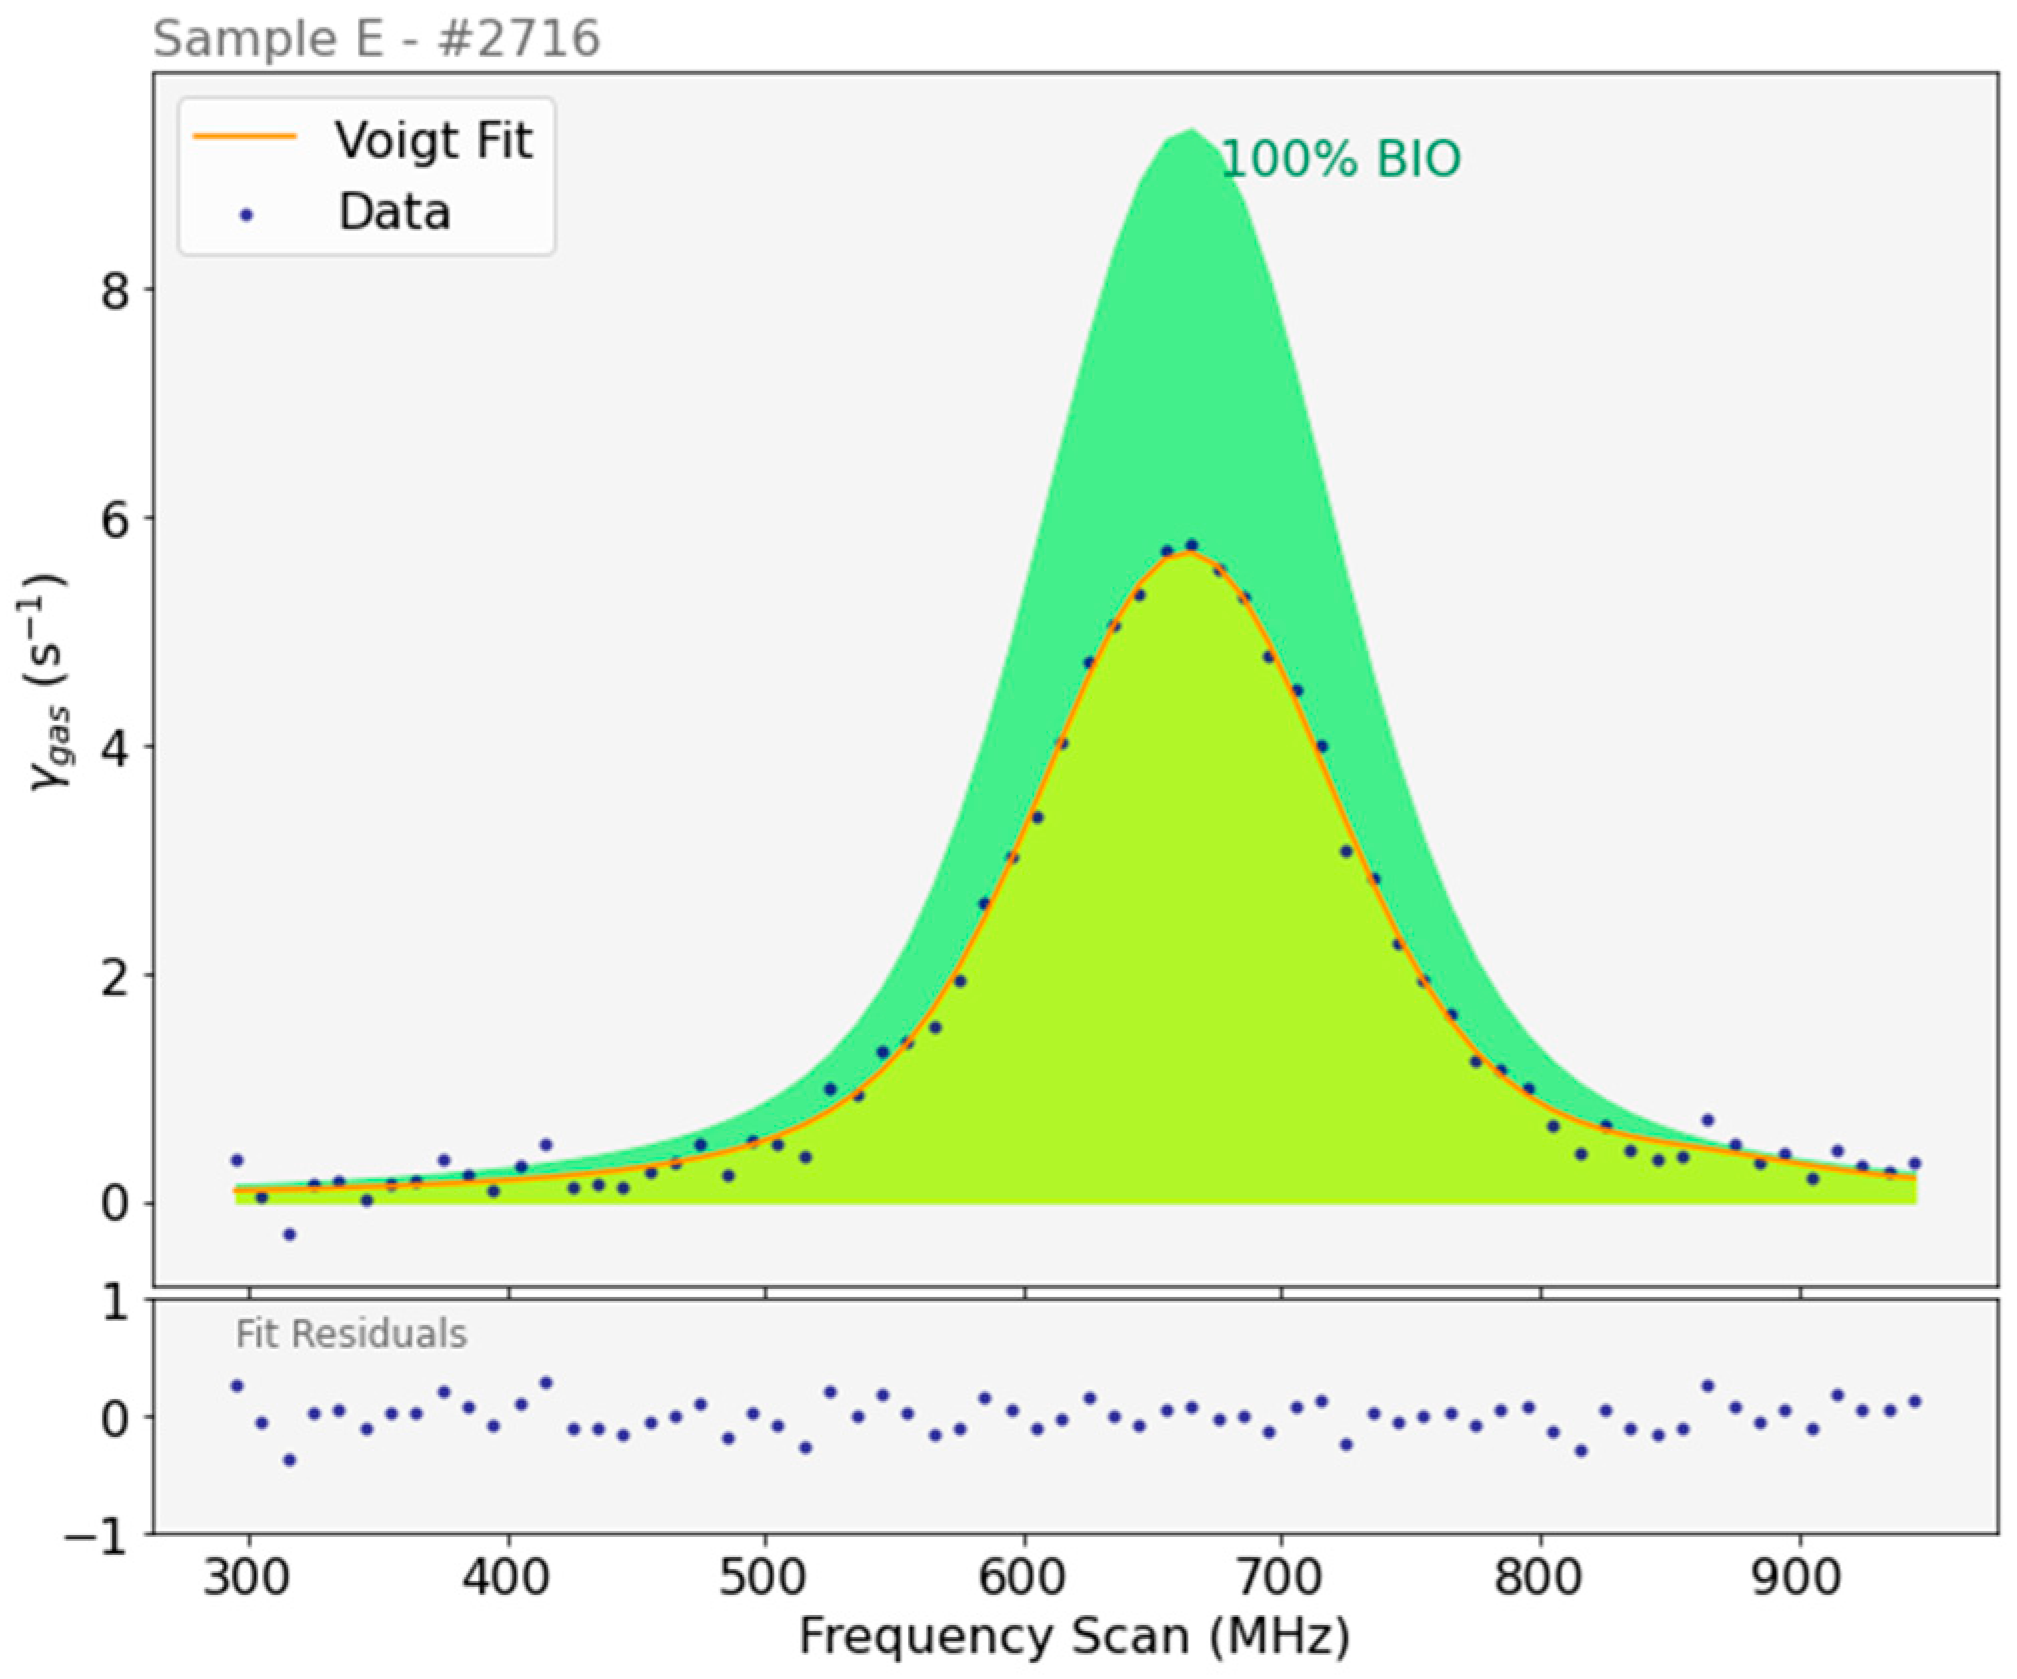
The 14C16O2 mole fraction is determined by measuring the spectral area of its (0001–0000) P(20) ro-vibrational transition, whose spectrum (gas-induced decay rate γg vs. laser frequency ν) is recorded with high spectral fidelity by scanning the laser (and cavity resonance) frequency very precisely. To this aim a second QCL, locked to a molecular absorption line of low-pressure pure N2O in a sealed cell, is used as a frequency reference. By cooling the cell down to 170 K with a Joule-Thomson cryocooler, the overall intensity of the 13C16O2 interfering doublet which lies in the investigated spectral region is greatly reduced by about 2000 times, down to 1.5% of the target line.
The shorter measurement allowed by the SCAR spectrometer consists of a single scan over the chosen molecular transition, obtained by tuning back and forth the laser frequency across the transition central frequency (2209.1077 cm
−1 corresponding to an optical wavelength of 4526.715 nm). The scan spans 650 MHz, with 66 points spaced by 10 MHz, and takes about 6 min since each point requires about 3 s for acquiring and averaging together 3000 SCAR signals. The typical appearance of a measurement scan is shown in
Figure 1.
The obtained absorption profile is fitted by a Voigt function (a convolution of a Gaussian and a Lorentzian profile, that takes into account all the broadening effects of the molecular transition) [
11,
12], and the spectral area below the curve is taken as the measurement result.
It is convenient to convert the measured spectral area to conventional 14C units, such as pMC (percent modern carbon) or F14C (fraction modern). To this aim the spectral area of the target line in the standard reference material (oxalic acid NIST SRM 4990C) must be measured with great precision (a single long-time average is enough), and the ratio between the sample and reference spectral areas must be calculated each time to get the 14C content expressed in the desired units.
Due to the so-called Suess effect [
13], the pMC value of a 100% biogenic sample is drifting towards lower and lower values at a rate of about −0.5 pMC/year. In 2021 any 100% biogenic sample reached the value of 100 pMC [
14]. Therefore, we can assume that the pMC value measured for nowadays materials nearly corresponds to their biogenic fraction in %.
2.2. Sample Preparation
For the analysis, any sample must be burnt to turn it into pure CO2 gas, and its carbon content must be enough to fill the SCAR measurement cell at the optimal thermodynamic conditions of 12 mbar pressure and 170 K temperature. Considering the cell volume of 300 mL and the additional dead volume of the filling vacuum line, at least 0.5 mmol of gas is needed, corresponding to 6 mg of C. The sample, enclosed in a tin cup, is dropped into the high-temperature furnace (900 °C) of an elemental analyzer (Elementar, mod. vario ISOTOPE cube), where it is oxidized in a pure O2 atmosphere. The gas combustion products are carried by a helium flow, while ashes are collected in a tray. Water vapor is absorbed by a SICAPENT® trap, while nitrogen oxides are reduced in a high-temperature column (550 °C) by copper powder. N2 is immediately released out of the elemental analyzer, while CO2 is selectively adsorbed using a proprietary purge-and-trap technology and released on demand into a glass ampoule (with a 50 mL volume) which has been previously evacuated. The ampoule is immersed in a liquid-N2 bath, and the CO2 is frozen. The helium carrier gas is pumped out, the liquid-N2 bath is removed and the ampoule is heated at room temperature. The final result is an ampoule containing pure CO2 gas, with a N2O residual mole fraction lower than a few ppb.
The ampoule is then connected to the inlet of the SCAR instrument and the measuring cell is filled with the CO2 gas sample. After the measurement, if a long-term storage of the gas sample is desired for possible successive investigations, the gas sample can be recovered by again immersing the ampoule in a liquid-N2 bath.
3. Validation of SCAR Radiocarbon Quantification against AMS
Considering that leather and alternative materials may contain fractions of fossil/biobased carbon which may vary from 0 to 100%, the validation of the SCAR spectrometer was conducted by analyzing materials within the whole measurement range. Preliminary measurements were conducted on several materials, analyzing nitrogen and carbon content as shown in
Table 1.
Samples of leather, artificial leather and alternative materials were taken from areas of the original piece where the distribution of different micro constituents were representative of the whole. In the case of leather samples, the ISO 4044:2017 norm recommendations were followed [
15]. Samples of artificial leathers and alternative materials were taken from areas far from the edges verifying their section uniformity under the microscope. A fine section slice was taken with a scalpel verifying under the microscope that it contained all the microstructural components. For the scope of this research, we chose materials with uniform microstructural composition to contain repeatability errors on the method’s validation phase.
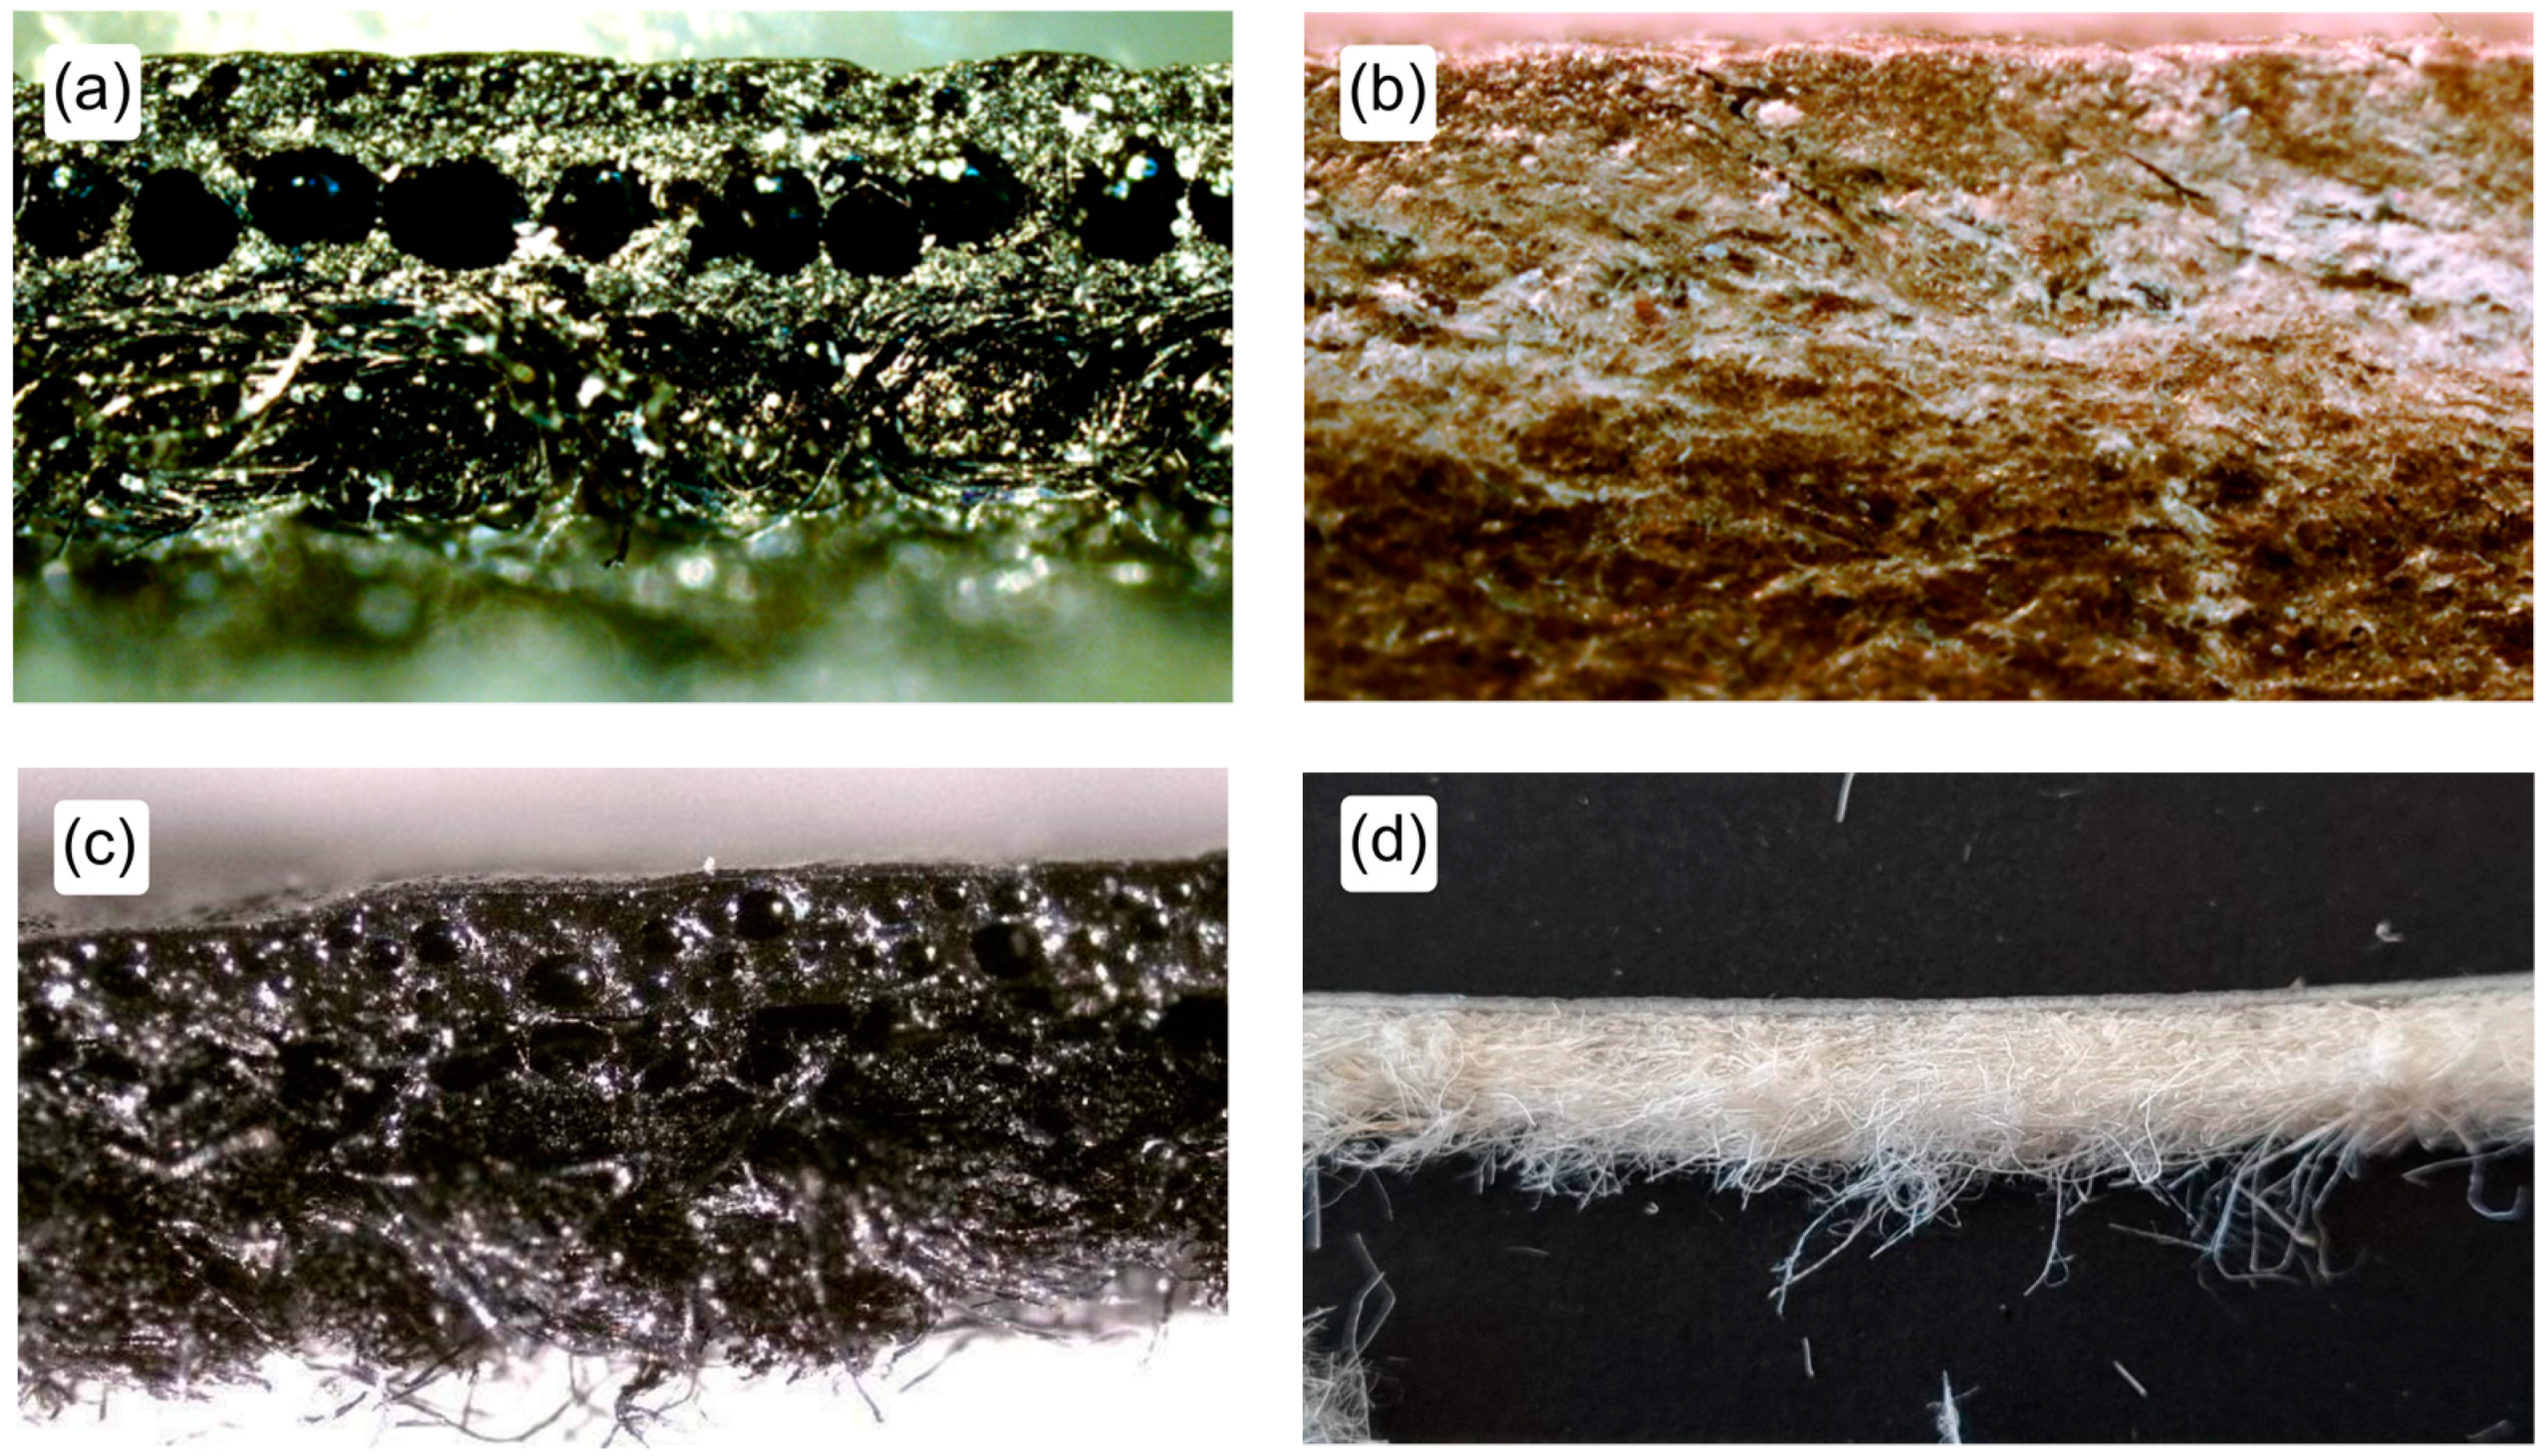
The samples of Desserto
®, chestnut traditional tanning, and Vegea
® showed a compact structure, allowing finely cut slices of the materials with a reasonably good microstructural component distribution (see
Figure 2). The Piñatex performance
® samples had a relatively loose structure which did not allow taking samples with representative microstructural proportions. This allowed for the analysis of the material in further work, defining a sampling procedure which may ensure consistent test results.
3.1. Measurement Procedure and Data Analysis
The measurement procedure has been conceived in order to both provide a comparison with the “benchmark” AMS results over the whole 0–100 pMC range and to give, for each sample, a statistical analysis for the assessment of the repeatability of the procedure and of the instrumental precision. Therefore, 7 samples were selected with expected 14C contents almost uniformly covering the 0–100 pMC range.
For each sample, 5 independent preparations were carried out, which in some cases were also performed by different operators. For each of the 5 prepared CO
2 samples, a measurement consisting of 20 consecutive scans was performed, corresponding to a 120 min total averaging time (since each single scan takes about 6 min, see below). Each set of 20 scans was independently analyzed, resulting in the mean value and the standard deviation from the mean of the single measurement. This gives an assessment of the instrumental precision, without taking into account the possible contributions of the sample preparation procedure and of other systematic errors. The procedure is described in detail in the following
Section 3.1.1.
After that, the 5 mean values obtained from the 5 independent analyses described above were averaged, thus obtaining the final result for the full set of measurements on each sample (100 scans in total, corresponding to a total averaging time of 10 h). Moreover, this allows us to assess the instrumental precision for long-averaged measurements and to study the repeatability of the whole process, including sample preparation.
Finally, in
Section 3.2, the
14C content results obtained by our SCAR spectrometer for the 7 different samples were compared with the results provided by a commercial AMS analysis service performed on the same samples, thus providing a quantitative validation of the SCAR method.
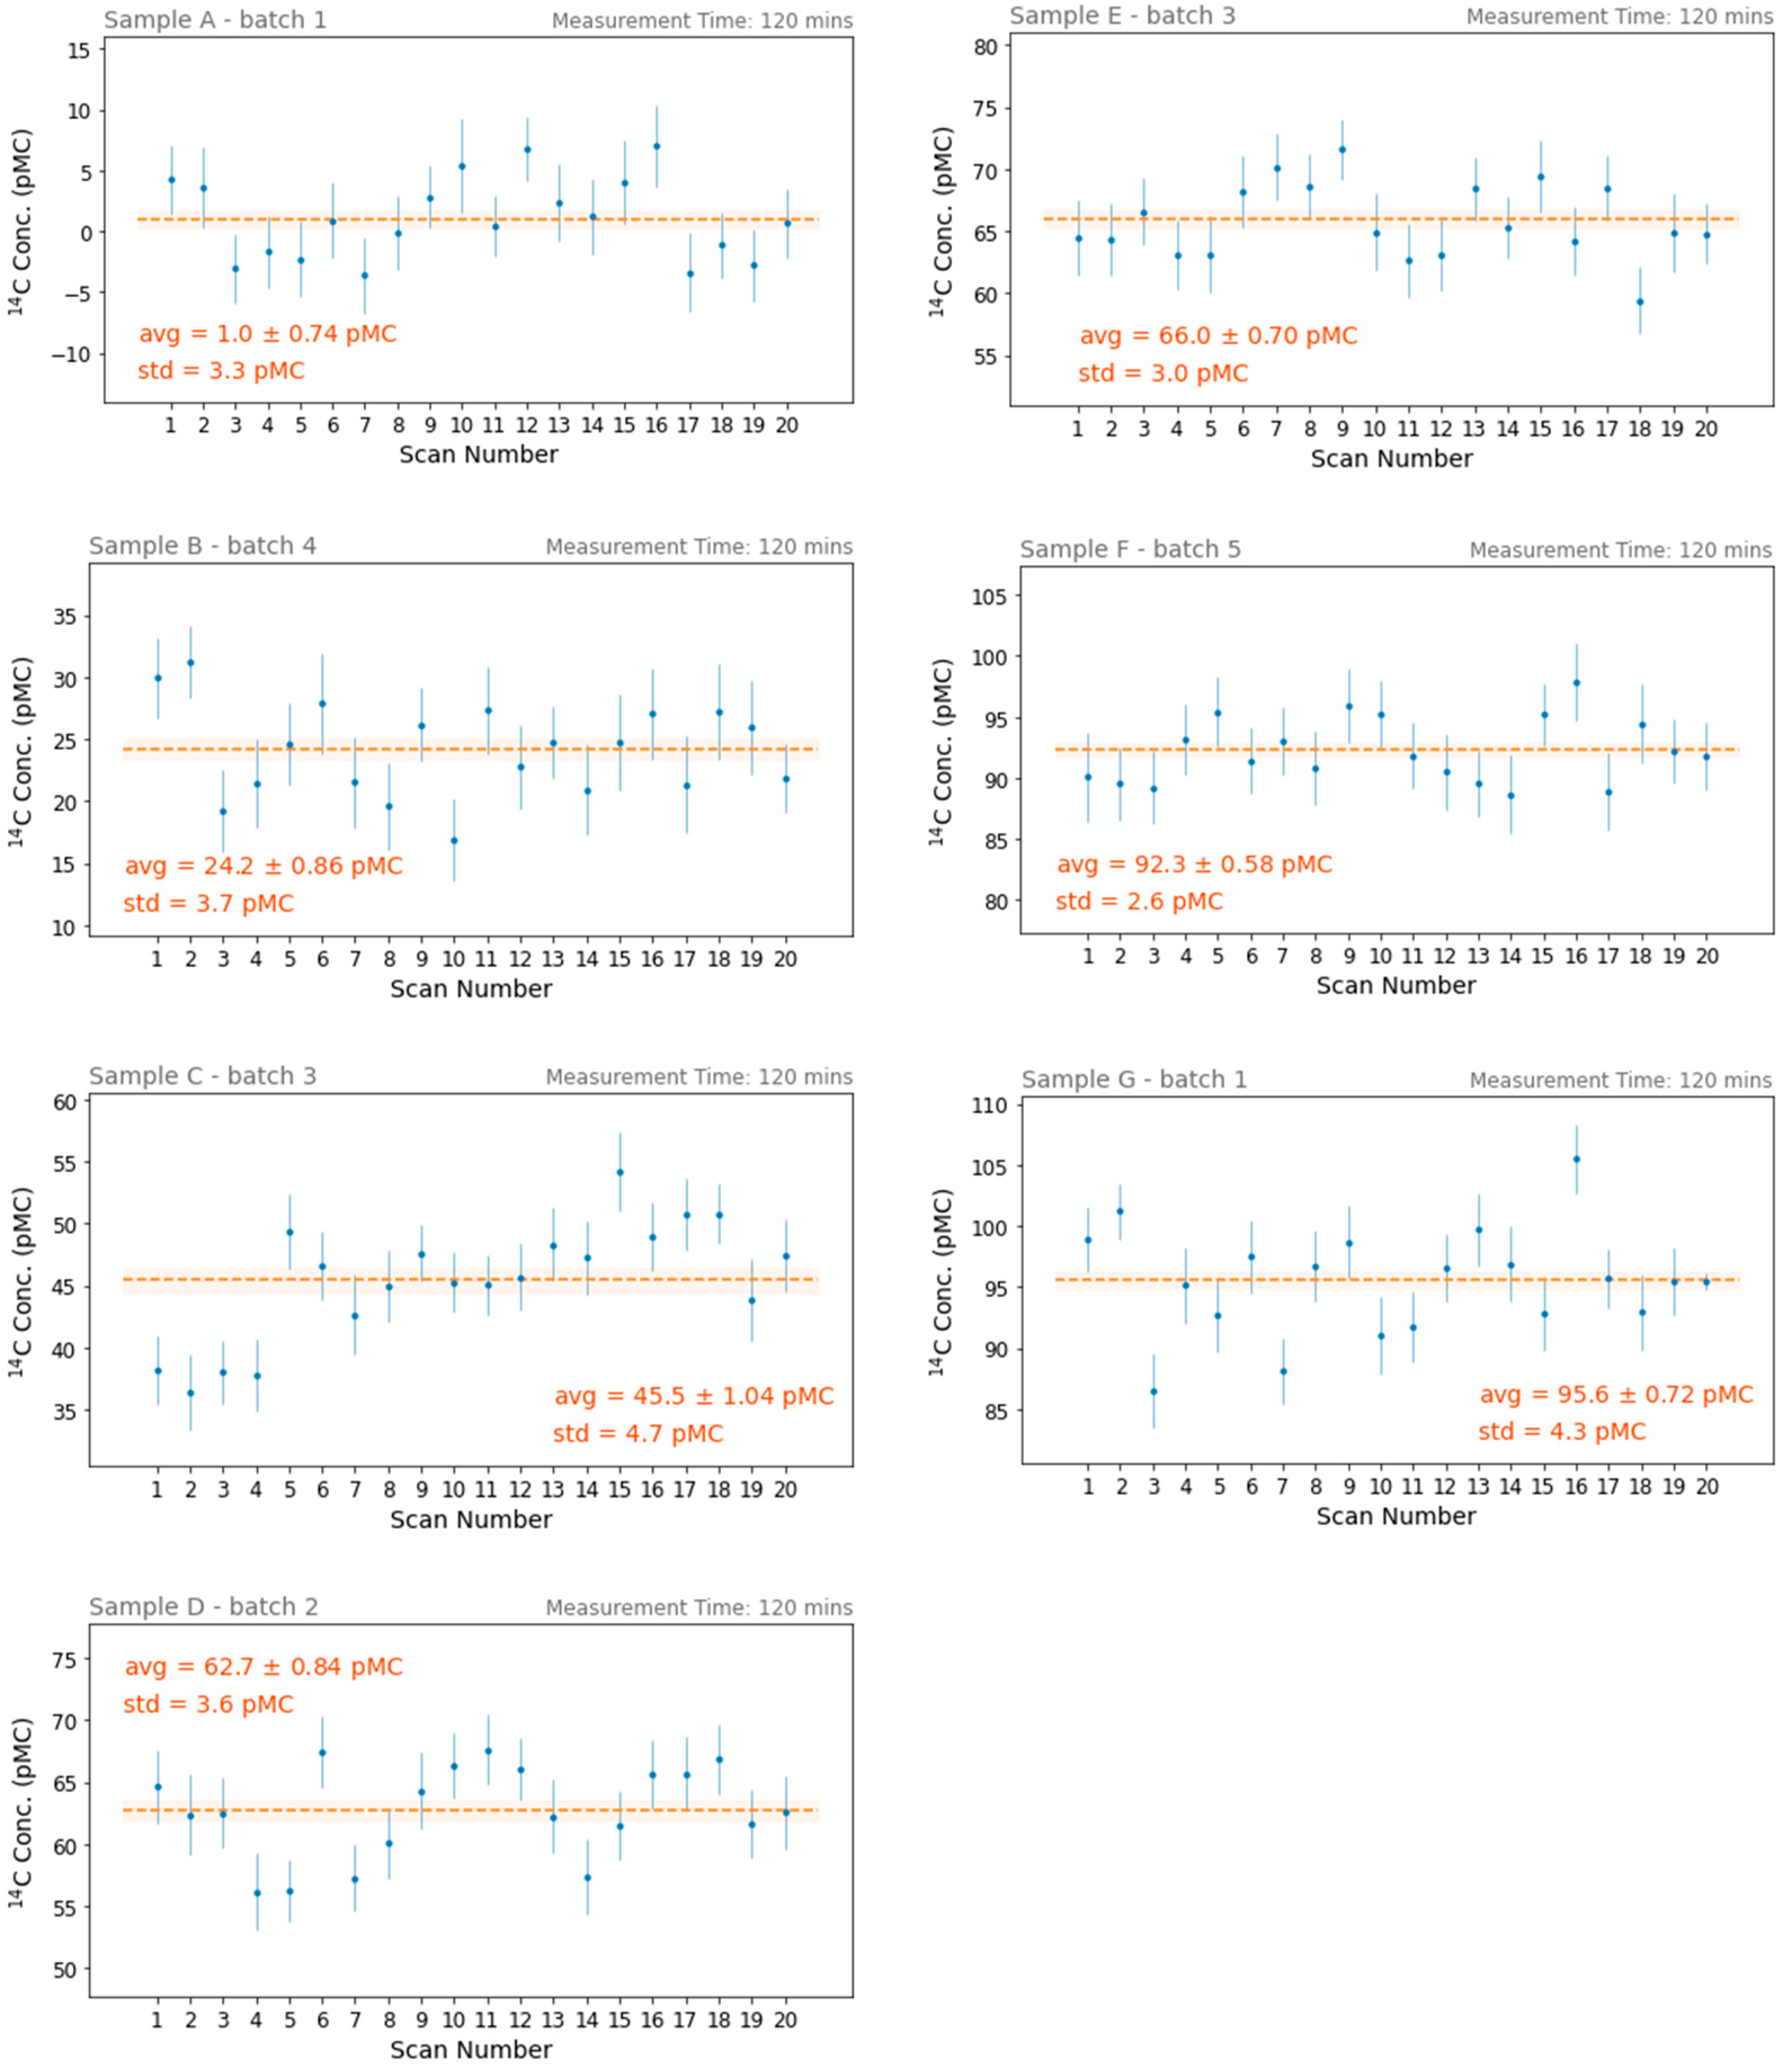
3.1.1. Measurement of Each Prepared CO2 Gas Sample
As already explained, for each sample preparation batch (5 batches per sample), a series of 20 consecutive scans is taken. In
Figure 3 the 20-scan results for one batch of each of the 7 measured samples are shown.
On the one hand, from this analysis it is possible to estimate the precision of each 6 min measurement as the standard deviation from the mean. This value varies from sample to sample, but it is always in the range 2–5 pMC. with an average value of 3.8 pMC. With a conservative approach, we can therefore assume that the precision of a 6 min long scan is about 4 pMC.
On the other hand, for each measurement batch it is possible to calculate the mean value and its error by performing a weighted average of the 20 measurements. The standard error of the mean results in the range 0.5–1.0 pMC, a factor of about √20 ≈ 4.5 lower than the mean error of each measurement, as expected for a normal statistical sample.
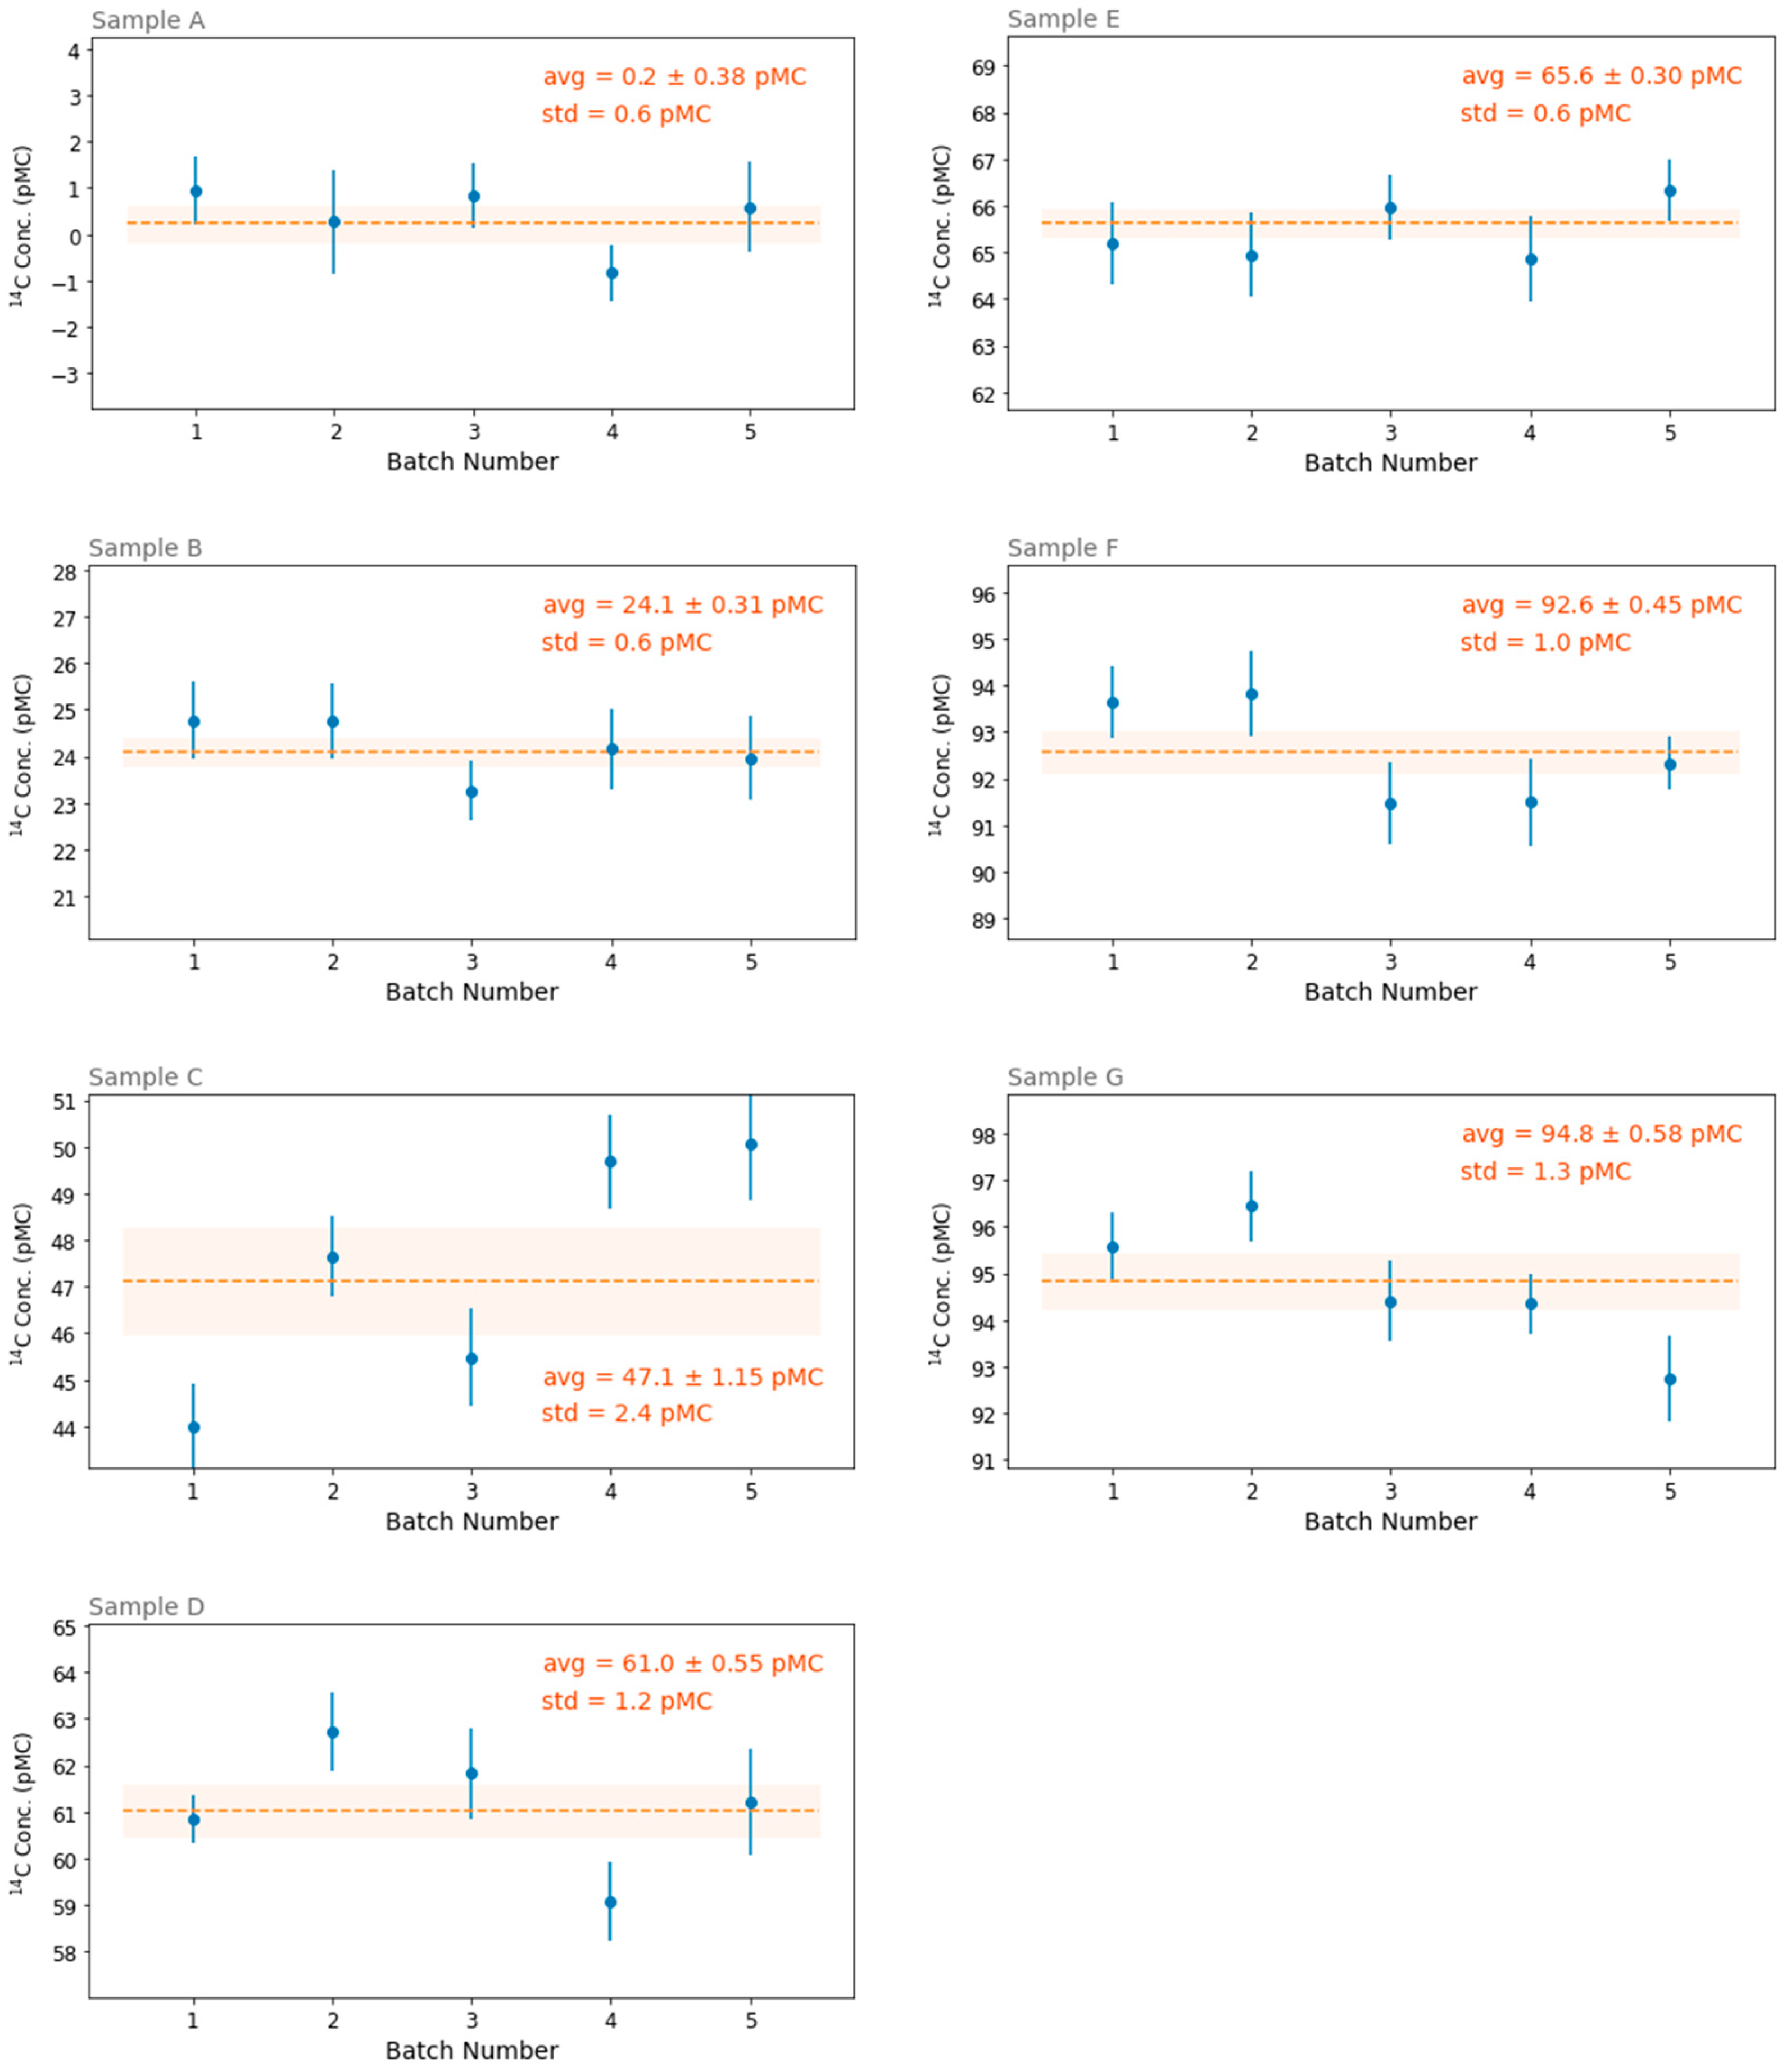
3.1.2. Averaging of the 5 Independent Preparations of Each Sample
The results of the 5 measurement batches taken for each sample can now be compared (see
Figure 4) in order to extract information about both the repeatability of the sample preparation process and, possibly, the performance of long-average acquisitions.
The standard deviations of the 5 measurements are quite different from sample to sample: for some samples (such as A, B and E) the points scattering is as low as 0.6 pMC, while for others it is up to 2.4 pMC of the sample C. This may suggest a different homogeneity of the sample material, at least at the scale of the portion of material that is taken for the measurement and that is always a small fragment of about 1 mm in size. Nevertheless, the average value of the standard deviations over all samples is about 1 pMC, and this can be taken as an estimate of the precision of each 2-h-long measurement run for a homogeneous sample.
Moreover, the weighted average over all 5 measurement batches (for each sample) can be assumed as the best estimate of the radiocarbon content in the sample, with a precision that, in the best cases, is as low as 0.3 pMC.
3.2. AMS Intercomparison
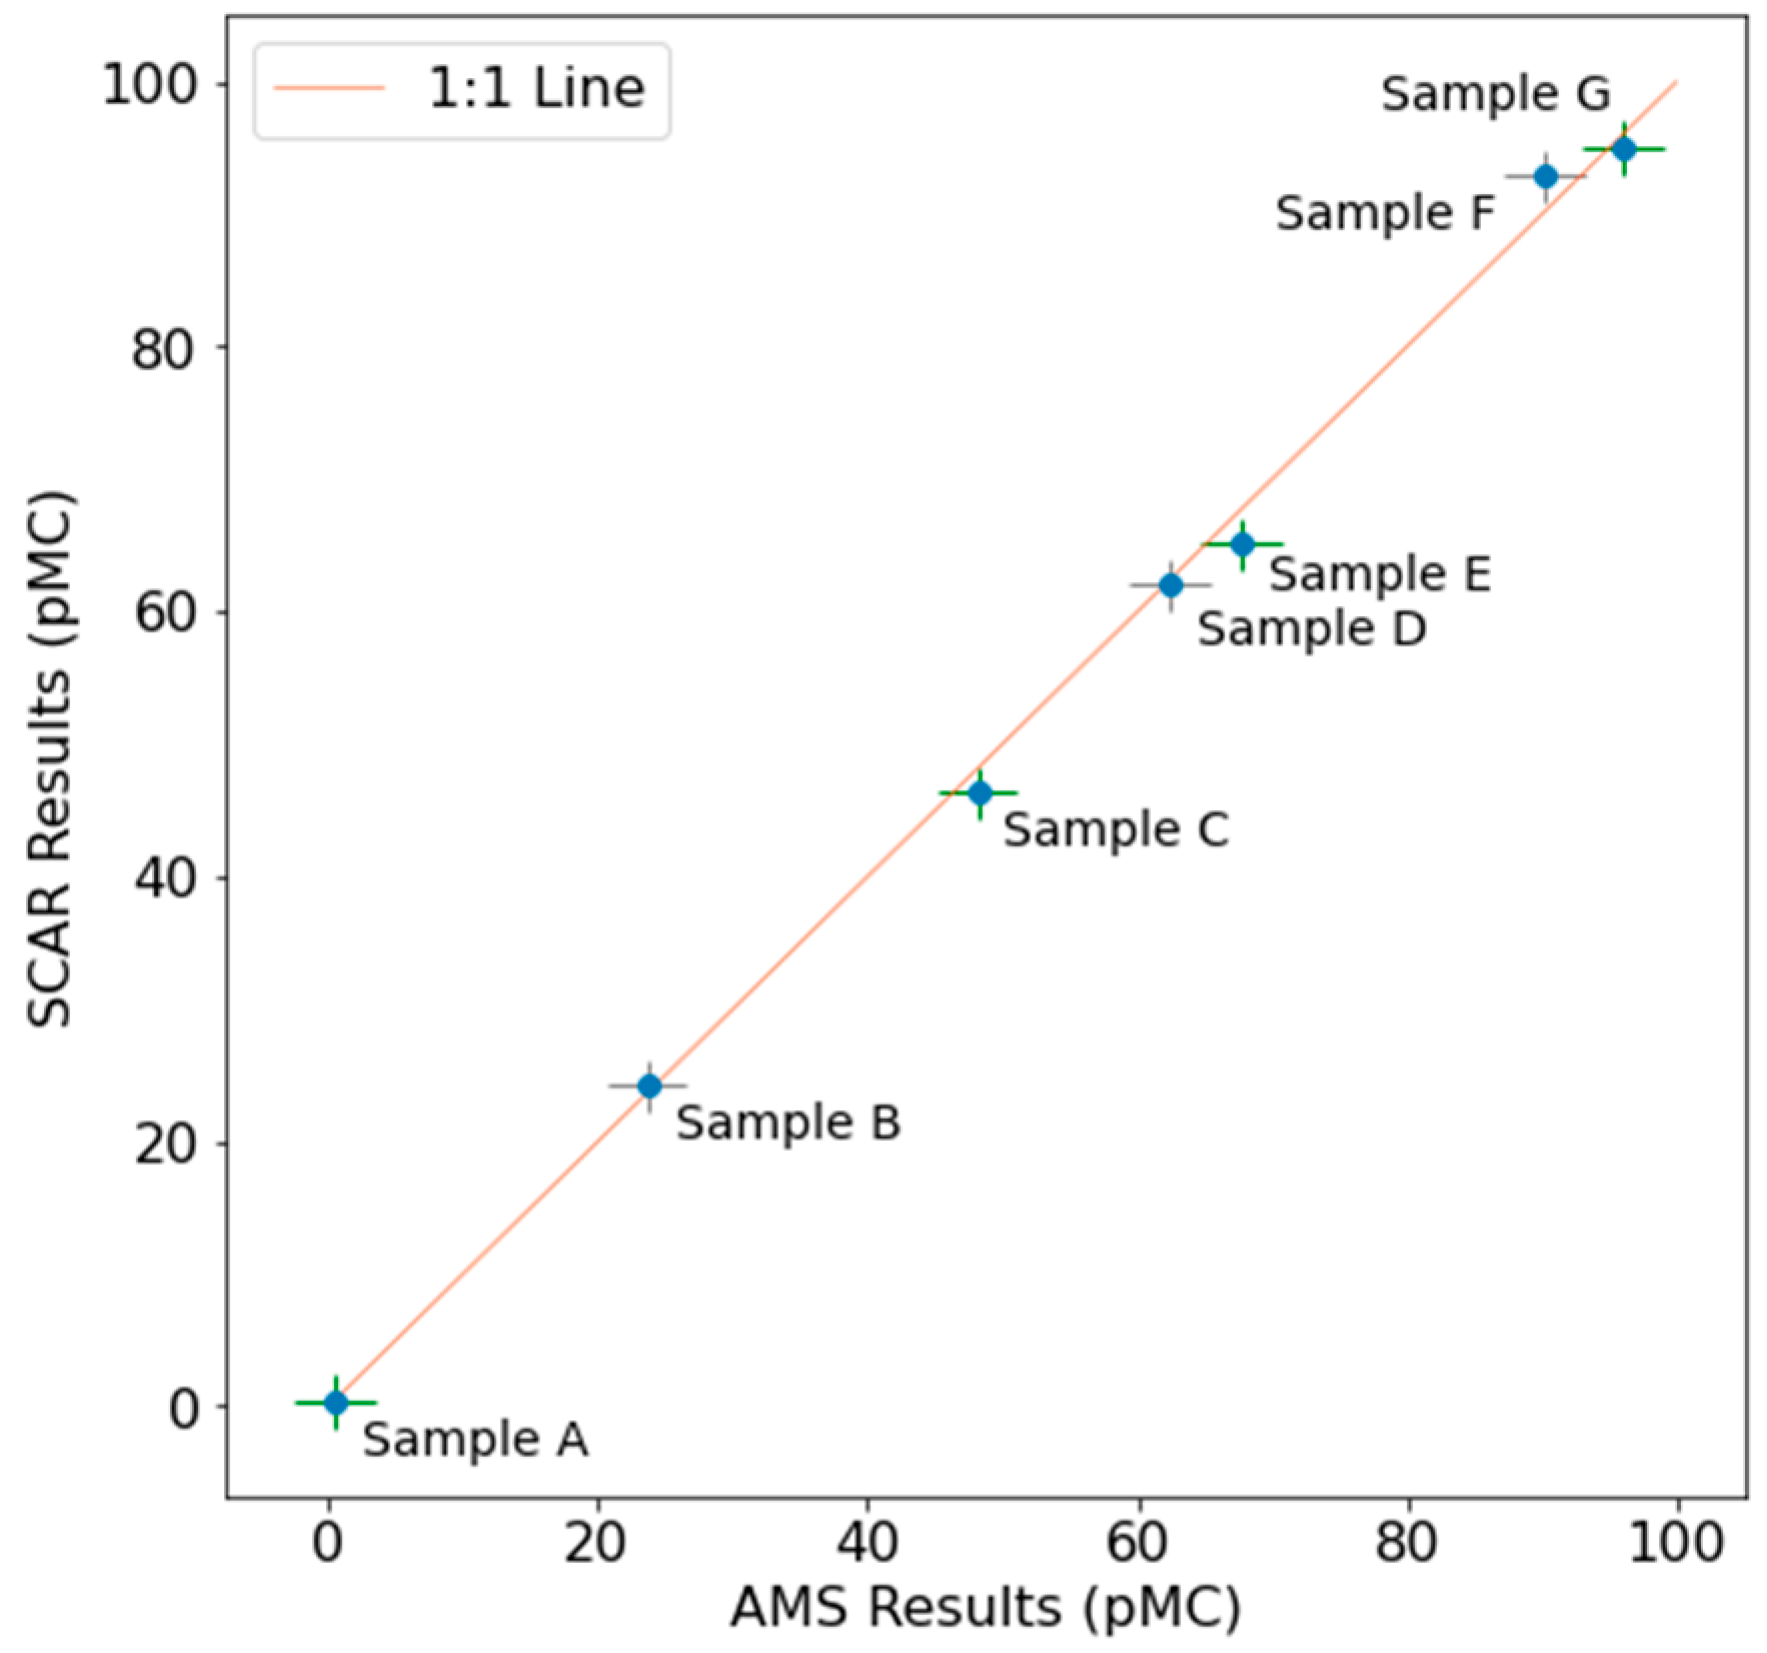
The above outcomes were finally validated by a blind comparison with the results provided by an accredited AMS testing laboratory. Great care has been taken in selecting, from each sample, two homogeneous sub-samples to be processed and measured by SCAR and AMS, respectively, but one cannot exclude that some residual dishomogeneity (also evidenced in the above paragraph) may exist. Nevertheless, the comparison between the results given by these two very different techniques (see
Table 2 and
Figure 5) shows a substantial agreement over the whole range, 0–100 pMC.
This comparison adds more evidence of the suitability of the SCAR technique for radiocarbon analysis for a wide range of materials, which has been already demonstrated for biofuels [
16] and nuclear waste [
17].
4. Measurement of Biobased Content of Different Leather Types and Alternative Materials
After the validation of the test method the authors analyzed various materials, mostly used for shoe components. Many of the materials analyzed were the same as those cited by Meyer et al. [
6], to understand if leather alternatives which claimed to be sustainable could also be a reasonable alternative in terms of circularity, intended to be based mainly on renewable sources.
Results obtained in these experiments also include different leather types: from coated leather (i.e., with a polymeric finishing thicker than 0.15 mm), wet white leathers (tanned with synthetic tanning materials), to different sorts of traditionally tanned leathers (chrome tanned and vegetable tanned). The obtained results are reported in
Table 3, sorted by increasing biobased content. The nitrogen and carbon contents (in % of mass, as measured by the elemental analyzer) are also reported as supplementary information useful to understanding the nature of the material.
The table provides several interesting insights, in particular regarding the contrast between the commercial name of a product and its true biogenic content, as given by the measured 14C molar fraction. The marketing tactic used to make a product seem more environmentally friendly than it actually is, for example by using vague or ambiguous language, making unsubstantiated claims, or by highlighting one small aspect of the product that is environmentally friendly while ignoring other aspects that are not, is commonly called greenwashing.
In the authors’ opinion, such a tendency can be found in some of the products listed in the table. For example, the term “vegan” or other keywords evoking a natural origin (such as “leaf”, “bio”, “apple”, etc.) are present (more or less explicitly) in the promotion of most of the leather alternative materials analyzed here, which resulted in most cases being on the lower edge of biobased carbon content (<50 pMC, i.e., predominantly fossil carbon). Interestingly, the authors found some leather samples in this low edge (coated and impregnated patent leathers), confirming that heavy treatments with synthetic products can eventually compromise the overall biogenic content of the material.
Another interesting consideration is that efforts in providing truly biogenic synthetic alternatives to leather often lead to a general deterioration of strength and durability performance. For example, Kombucha material has one of the highest biobased carbon contents, but the tested sample showed very low resistance to mechanical stress and became brittle one month after the sampling. On the other hand, alternative materials with acceptable performance, as described in the paper by Meyer et al. [
6], showed the lowest biobased carbon content (i.e., predominantly fossil carbon).
The intermediate range of biobased carbon content (50–80 pMC) shows many synthetic/natural mixed fiber materials, coated leathers, and leathers tanned with synthetic tanning materials (different wet white types) with relatively high finishing and/or impregnation and few leather-alternative materials.
The authors found most traditional leather articles on the highest edge of biobased carbon content (>80 pMC), with vegetable tanned leathers predominantly on the >90 pMC edge.
Finally, it is worth highlighting that the result obtained for the sample “Volar Bio Ultraleather
®” matches with the certificate shown for this article in the producers’ website [
18]. This can be considered a further validation of the presented SCAR method.
5. Conclusions
To summarize the research reported here: the authors first selected benchmark samples for validation of SCAR spectroscopy vs. AMS, with expected 14C contents covering the 0–100 pMC range almost uniformly; then, the authors measured them with SCAR and found results in good agreement with AMS; finally, the authors extended the set of samples by measuring different types of genuine leather and many trendy alternatives.
The validation of SCAR radiocarbon quantification following the guidelines of the EN 16640:2017 norm [
19] showed a high degree of correlation with the results obtained by AMS within the whole biobased carbon range. Therefore, the authors envision a future adoption of the SCAR spectroscopy as an alternative method to be included within the existing norm to assess the reliability of commercial claims about sustainability issues.
The authors faced some limitations due to the sampling procedure and dishomogeneous nature of some materials, leading to low-repeatability measurement results. The authors are studying more appropriate sampling procedures for these troublesome materials. Finally, the authors are working on a further extension of the SCAR method to textiles, processing chemicals, biosolvents, etc. included within the priorities of the European Green Deal.


 ,
, 


