Abstract
Titanium dioxide (TiO2) thin films are widely used in transparent optoelectronic devices due to their excellent properties, as well as in photocatalysis, cosmetics, and many other biomedical applications. In this work, TiO2 thin films were deposited onto AISI 304 and AISI 316L stainless steel substrates by atomic layer deposition, followed by comparative evaluation of the mixture of anatase and rutile phase by X-ray diffraction, Raman maps, morphology by SEM-FEG-AFM, and adhesion of the films on the two substrates, aiming to evaluate the scratch resistance. Raman spectroscopy mapping and X-ray diffraction with Rietveld refinement showed that the films were composed of anatase and rutile phases, in different percentages. Scratch testing using a diamond tip on the TiO2 film was employed to evaluate the film adherence and to determine the friction coefficient, with the results showing satisfactory adherence of the films on both substrates.
1. Introduction
Titanium dioxide (TiO2), or titania, is a chemically and biologically inert semiconductor that has three allotropic forms: anatase, rutile, and brookite [1]. TiO2 presents electron-hole pairs when irradiated by a light source with energy equal to or greater than its band gap (3.20 eV) [2]. At the surface, these excitons react with surrounding water molecules to form reactive species such as hydroxyl (•OH) and superoxide (•O2−) radicals, which are capable of mineralizing a wide range of organic compounds [3]. In this way, TiO2 acts as a photocatalyst. There have been some papers reporting the disinfection by destroying bacteria, viruses, and other pathogens by photoactive titania [4,5,6,7].
The photoelectrochemical activity of a TiO2 film strongly depends on the phase composition [8]. Most research on photocatalysis has focused on anatase and rutile TiO2 films. The most typical natural form of TiO2 is rutile, which is the most thermodynamically stable phase at all temperatures, but anatase TiO2 films are more efficient photocatalysts than rutile TiO2 films [1]. The triangular arrangement of the oxygen ions on the crystal surface of anatase favors the absorption of organic compounds. In contrast, the positions of the titanium ions provide suitable conditions for reactions involving the organic compounds absorbed on the surface [9]. However, the high photocatalytic efficiency of TiO2 depends on the presence of the rutile phase in the film because this phase provides mesoporosity and a broader pore size distribution, which enhances the catalytic activity of the TiO2 film [9,10]. Therefore, a TiO2 film containing anatase and rutile phases should have the optimal photocatalytic activity [11].
In addition to its ability to act as a photocatalyst, TiO2 has anti-corrosion properties that help to protect substrate surfaces [12]. For these reasons, the use of TiO2 films in medical devices is of great interest because it can not only assist in inhibiting the growth of bacteria but also protect the metal of implants against corrosion. Stainless steel is a material widely found in equipment, surgical instruments, prostheses, and implants in the hospital environment. The type 304 stainless steel offers exceptional mechanical properties, low cost, and good corrosion resistance, enabling its use in medical devices and waste systems that transport sanitary effluents [13,14]. On the other hand, type 316L stainless steel is the main material used for cardiovascular stents, orthopedic prostheses, cranial fixators, and dental implants [15,16], due to its good biocompatibility, excellent corrosion resistance, wide availability, easy processing, and high strength [17].
TiO2 films can be produced via the sol-gel method, pulsed laser deposition, magnetron sputtering, metal–organic chemical vapor deposition, and laser cladding [18,19,20,21]. TiO2 can also be used as a powder in some applications [22].
TiO2 has many modern applications ranging from, for example, cosmetics to photovoltaics. In addition, to better elucidate our processes and results, some papers and deposition processes were compared in Table 1.

Table 1.
Protocol comparison, substrates, film, and thickness achievements.
The present work describes a parametric study of TiO2 deposition on AISI 304 and AISI 316L stainless steel substrates by atomic layer deposition (ALD). The ALD is an advantageous technique that enables control of the TiO2 film thickness by regulating the number of deposition cycles, which no other deposition technique provides [7,31].
In order to evaluate the improvements obtained by the presence of the TiO2 films, comparative analyses of the AISI 304 and AISI 316L substrates were performed before and after the film deposition, considering a comparative evaluation of the mixture of anatase and rutile phase by X-ray diffraction, Raman maps, morphology by SEM-FEG-AFM, and adhesion of the films on the two substrates, aiming to evaluate crystalline structure and scratch resistance.
2. Materials and Methods
2.1. TiO2 Film Deposition
The substrates used in this work were AISI 304 and AISI 316L stainless steels. Samples with a 10 mm diameter and 1 mm thickness were cleaned in an ultrasonic bath with propanone for 15 min, then with isopropanol for 15 min, and finally with ultrapure water for 15 min. The sample surface was dried before transfer to the chamber of the ALD reactor (Oy TFS-200, Beneq, Helsinki, Finland) used to deposit the TiO2 films. The reactor was equipped with an automation system and was operated in thermal mode. Titanium tetrachloride (TiCl4, 99.95% purity, Sigma-Aldrich, Saint Louis, MO, USA) was used as the titanium precursor. Ultrapure water (H2O) was used as the oxygen precursor and oxidizing agent. The precursors were kept at a constant temperature of 24 °C, and no carrier gas was used. The deposition was performed using a set of 3000 cycles at 300 °C. In each cycle, a TiCl4 pulse of 250 ms was performed, followed by a 1 s purge, a 250 ms H2O pulse, and another 1 s purge. Nitrogen (N2, 99.998% purity) was used for the background atmosphere control and as the purge gas at a constant flow rate of 250 sccm. The cooling occurred gradually to avoid cracks in the film. The cooling occurred from 6 to 10 h until the environment temperature before the reactor was opened using N2 gas flow. The configuration of the ALD system was described in an early paper from our research group [29].
2.2. Characterization
The deposited TiO2 films were characterized considering their microstructure, morphology, chemical structure, and adhesion. The film microstructure was evaluated by field emission gun scanning electron microscopy (FEG-SEM) (Mira 3, Tescan, Brno, Czech Republic) at LAS-INPE. The surface morphology of the films was investigated by atomic force microscopy (AFM) using a silicon nitride tip in noncontact mode at LPF-UNICAMP. The AFM images were analyzed using Gwyddion v. 2.58 software to obtain the root mean square (RMS) roughness of the thin film.
The crystalline phases of the TiO2 films were studied by X-ray diffraction, and the vibrational Raman signatures were evaluated by Raman spectroscopy. The Raman spectra of the TiO2 films were acquired using a LabRAM HR system (Horiba, Kyoto, Japan) equipped with an Ar laser (λ = 514 nm) at LAS-INPE. The laser power was set at 25%, and the scan range was from 50 to 4000 cm−1. For exploratory spectra, three scans were used for each point during 15 s. For Raman mapping, an area of 22 µm2 (with 64 × 64 points) was scanned at 10% laser power, using a 500 nm grid, for the collection only two scans for each point with a duration of 5 s per point.
X-ray diffraction (XRD) analyses were performed (at LPP-ITA) using an Empyrean X-ray diffractometer (PANalytical) with a copper X-ray source and a Cu Kα (λ = 1.5406 Å) diffraction monochromator. The θ-2θ mode was used, from 10° to 90°, with a 0.013° interval and step time of 30 s. The Rietveld refinement method was used to analyze the X-ray diffraction data and establish the relationships of the crystalline phases (rutile and anatase) present in the TiO2 films. This simulation method fits a calculated diffraction pattern to the experimental data, minimizing the difference between the diffractograms using the least-squares approach [32]. Th HighScore software was used to analyze and quantify the phases [33]. To perform these refinements, the CIF (Crystallographic Information Framework) files for anatase [34], rutile [35], and austenite [36] were used without changing the atomic positions.
The films were scraped from the two AISI substrates using a blade, followed by the film thickness measurement by FEG-SEM. In addition, scratch tests were used to evaluate the adhesion of the TiO2 films to the AISI 304 and AISI 316L samples and to determine the coefficients of friction. These analyses were performed using a tribometer (Ultra Micro UMT 2, Bruker, Billerica, MA, USA) at IP&D-UNIVAP. The samples were attached to a support, and scratching was performed using a diamond tip (Rockwell C) applied to the TiO2 film in an air environment, at 40% humidity, with the load increasing from 0 to 5 N. After the completion of the test, images of the entire scratch track were obtained, and the adherence was analyzed according to the standard test method for adhesion strength and mechanical failure modes (ASTM C1624-05) [37].
3. Results
3.1. FEG-SEM and AFM
The AFM image of the AISI 304 sample (Figure 1a) indicated that the substrate surface had a roughness of 1.19 nm prior to the film deposition. The FEG-SEM image of the TiO2 thin film deposited on the AISI 304 (Figure 1b) showed that the film was composed of grains with irregular shapes and different sizes in the tenths of nanometers, resulting in a smooth surface. At an increased magnification (Figure 1c), the AFM image of the TiO2 film topography showed roughness without any curling from the substrate, in agreement with earlier work by the same research group [38]. It can be seen from Figure 1b that the film was smooth, with a roughness of 4.35 nm, and densely covered the substrate.
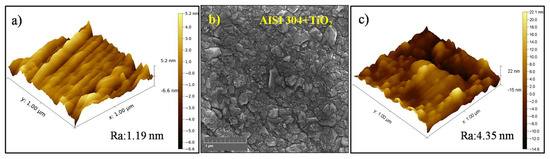
Figure 1.
(a) AFM image of the AISI 304 surface before film deposition. (b) FEG-SEM image of the TiO2 thin film deposited on AISI 304 (magnification of 80k×). (c) AFM image of the TiO2 film surface.
The initial roughness of the AISI 316L substrate was 1.09 nm, as shown in Figure 2a. The FEG-SEM image of the TiO2 thin film deposited on the AISI 316L (Figure 2b) showed that the substrate was densely covered by the nanometric film with relatively uniform sizes smaller than those on the AISI 304 substrate. The AFM image of the TiO2 film (Figure 2c) showed a roughness of 15.93 nm, which was more than three times higher than for the film deposited on the AISI 304. Nonetheless, the film on the AISI 316L substrate was also smooth. Comparing the TiO2 film topography from Figure 2 obtained via SEM-FEF and AFM, with the TiO2 film topography from Figure 3 obtained via FEG, it was possible to observe that the film presented a characteristic roughness in the topography. On the other hand, the volume of the TiO2 film was smooth and continuous.
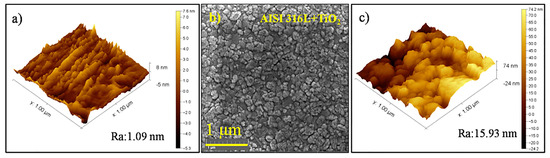
Figure 2.
(a) AFM image of the AISI 316L surface before film deposition. (b) FEG-SEM image of the TiO2 thin film deposited on AISI 316L (magnification of 80k×). (c) AFM image of the TiO2 film surface.
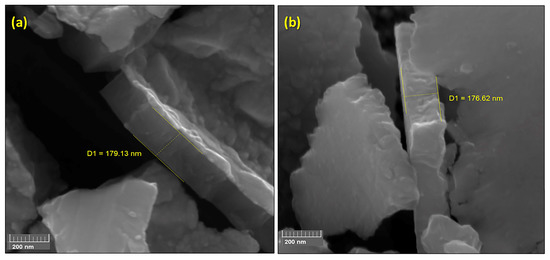
Figure 3.
FEG-SEM images (200k× magnification) of TiO2 films deposited on (a) AISI 304 (179.1 nm film thickness) and (b) AISI 316L (176.6 nm film thickness).
Figure 3 shows the FEG-SEM images obtained after a deliberate fracture of the AISI 304 (Figure 3a) and AISI 3016L (Figure 3b) substrates, for which the thicknesses of the TiO2 films were 179.1 and 176.6 nm, respectively. These thicknesses corresponded to 3000 cycles of deposition at 300 °C. Leem et al. [31] studied the correlation between the number of cycles and the TiO2 film thickness using a typical TiCl4 pulse-purge-H2O pulse-purge sequence at around 300 °C. They observed a reduction in the film thickness when HCl was inserted in the sequence. A thickness of around 135 nm was achieved at 300 °C, compared to the values obtained in the present work that were 24% higher for TiO2 on AISI 304 (179.1 nm) and 23% higher for TiO2 on AISI 316L (176.6 nm).
Other studies have also used the ALD technique to deposit TiO2 [31], ZnO [32], and Al2O3 [33] onto different substrates, such as MgCa2Zn1Gd3 alloy [34], polyvinyl chloride (PVC) tubes [35], Si(100) [36], AISI 316LVM [37,38], and others. Between 500 and 1500 cycles of atomic layer deposition of the required film were performed, at temperatures from 100 to 400 °C, resulting in film thicknesses that were usually in the range of 50 to 120 nm. In the present work, 3000 cycles at 300 °C resulted in the deposition of uniform films on both substrates (AISI 304 and AISI 316L), with no cracks or delamination, achieving higher film thicknesses (179 and 176 nm, respectively), without any requirement for annealing after the film deposition. The growth rate of the TiO2 film was calculated from the final thickness using the total cycles. Both films presented a growth of 0.6 Å/cycle. This result is consistent with the atomic layer deposition phenomenon and with previous data reported by Marques, F.C., and Jasieniak J.J., using the same precursors, temperature, and indium-tin-oxide-coated glass as a substrate. They achieved a growth rate of the TiO2 film for every layer as 0.8 Å/cycle [39].
3.2. Raman Spectroscopy
Raman spectroscopy was used to obtain the spectral signatures of the TiO2 films. Figure 4a shows exploratory Raman spectra with both anatase and rutile phases. The anatase phase was achieved after fit deconvolution from the center band of 152 cm−1, 400 cm−1, 521 cm−1, and 640 cm−1, and the rutile phase from 243 cm−1, 446 cm−1, and 605 cm−1. From this result, it is possible to observe that it was possible to estimate the concentration of rutile or anatase phases in the thin films. From this plot, it is possible to see that the first anatase band had an intensity 6 times higher than others. Zanatta A, R, described previously how to estimate the rutile and anatase phase concentration in a powder mixture [40]. From the exploratory spectra in Figure 4a, the bands from 180 to 300 cm−1 corresponded to the anatase phase (characteristic broad band centered at 144 cm−1). The Raman spectra for both films showed four bands for rutile and anatase, as also observed by Rossella et al. [11]. The broad and small bands at 449 cm−1 and at 606 cm−1 in both spectra corresponded to the rutile phase (characteristic peak centered near 450 cm−1) also observed by Rosella F., et al. [11]. From Figure 4a, the spectra show a third band, corresponding to the anatase at 521 cm−1, and a fourth band at 641 cm−1, also found by Rossella F. et al. [11]. The rutile bands were also observed at 250, 446, and 606 cm−1 by Zanatta, A.R. [40].
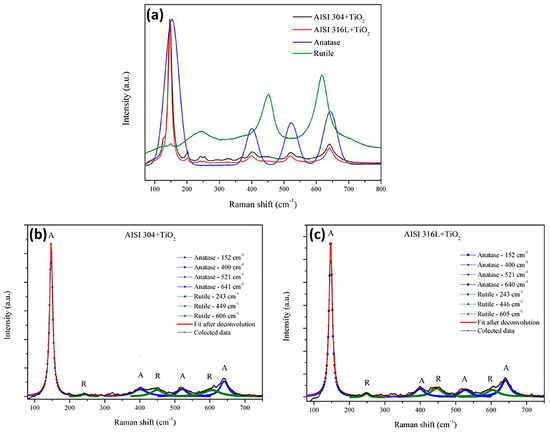
Figure 4.
(a) Comparison of the Raman spectra for anatase and rutile: the Raman spectra of the TiO2 films deposited on the AISI 304 and AISI 316L substrates. (b) deconvolution bands as reference for anatase (A) and utile (R) phases from TiO2 film deposited in AISI304. (c) deconvolution bands as reference of anatase (A) and utile (R) phases from TiO2 film deposited in AISI316L.
Figure 4b shows a zoom from 300 cm−1 to 700 cm−1. Comparing the lowest bands using the deconvolution process, it is possible to observe from the same spectra the anatase and rutile region for AISI 304. In addition, Figure 4c shows a zoom from 300 cm−1 to 700 cm−1 comparing the lowest bands using deconvolution processes for AISI 316L. The bands corresponded to a mixture of anatase and rutile phases. The anatase phase was reported by Evans and Sheel [8].
The transformation of anatase to the rutile phase depends on various factors, including temperature, pressure, and time. The phase transition temperature varies with the anatase material’s purity and crystallinity, but it converges around 600 °C at 1 atm pressure [41]. The transformation pressure required for this phase transition depends on the temperature, ranging from a few GPa to tens of GPa [41]. The exact conditions required for the phase transition from anatase to rutile depend on the specific sample of the material and can vary; in this paper, we obtained the rutile phase at 300 °C according to conditions and procedures using an ALD system and AISI 304 and AISI 316L. However, in general, high temperatures and pressures are required to induce this transformation, showing an innovation in these results due to the rutile phase being produced at low temperatures. The results contradict the literature that indicate a temperature of over 450 °C is needed. It is also suggested that the substrate morphology and heat conductions could provide reaction boundaries of phase transitions in TiO2, as explained earlier using a phase diagram of TiO2 by Hanaor D.A.H. and Sorrell, C.C. [41].
Raman mapping was used to investigate the distributions of the anatase and rutile phases in the deposited TiO2 film. Figure 5 shows the data obtained for the AISI 304 + TiO2 sample. Figure 5a shows an overlap of 20 Raman shift plots, where the main anatase and rutile bands are indicated, respectively. The color bar on the right side of the 3D images indicates the Raman intensity, corresponding to the relative concentrations of the anatase and rutile phases. Figure 5b shows the 3D Raman mapping of anatase (135 to 175 cm−1 in the Raman spectrum) in the AISI 304 + TiO2 film, while Figure 5c shows the mapping of rutile (595 to 635 cm−1 in the Raman spectrum). Raman mapping is a powerful instrument to show phase mixtures, as previously demonstrated in other research from our group, to detect terpene bands [42].
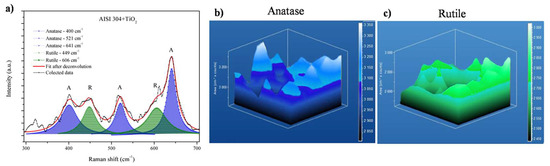
Figure 5.
Raman mapping of the AISI 304 + TiO2 film. (a) Overlap of 20 Raman shift plots, with the positions of the anatase (A) and rutile (R) bands, respectively. Three-dimensional Raman mapping of (b) the anatase band (from 135 to 175 cm−1) and (c) the rutile band (from 595 to 635 cm−1).
The 3D images showed that the anatase and rutile phases were present on the surface and within the film, as confirmed by the bands corresponding to these phases in the area of the sample analyzed. The phases were evenly distributed throughout the TiO2 film deposited on the AISI 304.
Figure 6 shows a Raman shift plot and 3D Raman mapping of anatase and rutile in the AISI 316L + TiO2 sample. The 3D Raman mapping (Figure 6b) evidenced that the anatase was evenly distributed at the surface and within the film. Figure 6a shows the anatase bands centered in the region (from 135 to 175 cm−1). The 3D Raman mapping of rutile (bands from 595 to 635 cm−1, in Figure 6a) showed that this phase was also present in the film, with a uniform distribution at the surface and at depth (Figure 6c). Since the bands corresponding to the anatase and rutile phases were identified over the entire area analyzed, these results demonstrated that the TiO2 film deposited on AISI 316L was composed of evenly distributed anatase and rutile phases.
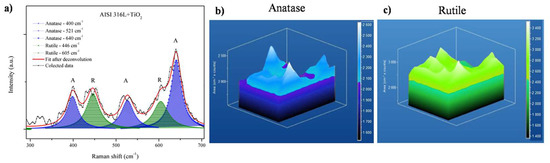
Figure 6.
Raman mapping of the AISI 316L + TiO2 film. (a) Overlap of 20 Raman shift plots, with the positions of the anatase and rutile bands indicated, respectively. Three-dimensional Raman mapping of (b) the anatase band (from 135 to 175 cm−1) and (c) the rutile band (from 595 to 635 cm−1).
3.3. X-ray Diffraction
The crystalline phases present in the TiO2 films were elucidated using X-ray diffraction (XRD). Figure 7 shows the XRD patterns of the TiO2 after the treatment of the data with the Rietveld refinement method [32]. The diffractograms showed that the TiO2 films were composed of the anatase and rutile phases, in agreement with the Raman spectroscopy results. The diffractogram in Figure 7a indicates that the film had a mixture of anatase and rutile phases that corresponded to 28.85% anatase and 71.15% rutile phase. A sharp peak was observed as austenite from both the AISI substrates. For the AISI 316L + TiO2 sample Figure 7b, the anatase phase corresponded to 44.45% of the film and the rutile phase to 55.55%. The XRD and Raman analyses did not identify any brookite phase in the TiO2 film, so it could be concluded that the structures of the TiO2 films deposited onto the AISI 304 and AISI 316L substrates were formed only by the anatase and rutile crystalline phases. In addition, Figure 7a shows sharp peaks centered at 44.51 and 75 (2θ degree) that correspond to the XRD pattern base metal AISI 316L and AISI 304 austenite.
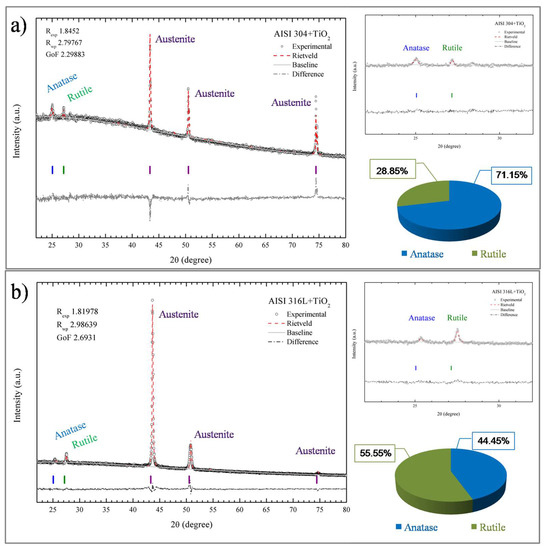
Figure 7.
X-ray diffraction patterns of the TiO2 films deposited on the AISI 304 (a) and AISI 316L (b) substrates, with refinement by the Rietveld method.
3.4. Scratch Test Evaluation of Film Adherence
Figure 8a,b shows the SEM micrographs of the start and end of the track (Figure 8c) formed after the scratch test on the AISI 304 + TiO2 sample. At the end of the track (Figure 8b), there was adhesion failure with severe spalling, according to ASTM C1624-05 [29], in part of the film. However, a more detailed analysis of the SEM image identified the presence of TiO2 particles covering the substrate in the delamination region, showing that the substrate was not exposed at the end of the scratch test.
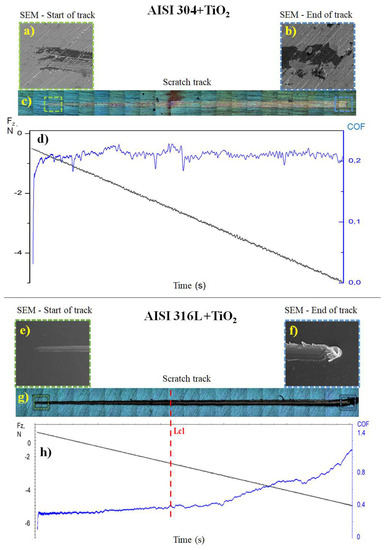
Figure 8.
Scratch test results show the friction coefficient (COF) values for the TiO2 films deposited on the AISI 304 and AISI 316L substrates. The SEM micrographs show images of the AISI 304 + TiO2 sample at (a) the start and (b) the end of the track with a total length (c) of 10 mm and (d) Graph showing the normal force (black line) from 0 to −5 N and the COF (blue line) during the scratch test on the AISI 304 + TiO2 sample. of the AISI 316L + TiO2 sample at (e) the start and (f) the end of the track with total length (g) of 10 mm. (h) Graph showing the normal force (black line) from 0 to −5 N, the COF (blue line), and the critical load (Lc1, dashed red line) during the scratch test on the AISI 316L + TiO2 sample. The negative normal force values were due to the direction of the applied force. The total test time was 100 s.
The friction coefficient of the TiO2 film deposited on AISI 304 was obtained using a diamond tip on the TiO2 film and a progressive load of up to 5 N (Figure 8d). The friction curve indicated that the film adhered well to the substrate since there was no substantial variation in the friction coefficient along the length of the track, with an average of around 0.2 ± 0.05, which was similar to the value of 0.19 ± 0.05 found in previous work by the same research group [40].
Figure 8e,f shows the SEM images of the start and end of the track (Figure 8g) formed by the diamond tip on the TiO2 film of the AISI 316L + TiO2 sample. At the end of the track, there was a cohesive failure, with plowing deformation in the TiO2 film [40]. Figure 8h shows a graph of the friction coefficient and normal force as a function of time. The friction coefficient started at around 0.30 and ended near 1.10. The adherence of the coating was obtained as the Fz value at which the film failure occurred without substrate exposure (Lc1), which was found to be 2.4 N.
The TiO2 film on the AISI 304 substrate contained greater amounts of the anatase and rutile phases than the film on AISI 316L, as indicated by the XRD results. Zalnezhad et al. [14] reported that the crystal structures of anatase (tetragonal) and rutile are very similar, except that the octahedra share four edges in rutile, instead of four corners in anatase, favoring the formation of chains and making the rutile structure more densely packed than that of anatase.
4. Conclusions
This study showed that TiO2 films produced by atomic layer deposition using a typical cycle sequence of TiCl4 pulse-purge-H2O pulse-purge, at 300 °C, with 3000 cycles, formed a film mixture composed of anatase and rutile phases. A higher crystallinity percentage was obtained for the film on the AISI 304 substrate, a mixture of anatase and rutile phases that corresponded to 71.15% of the anatase and 28.85% of the rutile phase. Raman spectra confirmed the presence of a mixture of anatase and rutile phases in both the TiO2 samples and showed that anatase and rutile were evenly distributed in the film. The best adherence was observed for TiO2 deposited on AISI 304. The scratch test results showed an average friction coefficient of around 0.2, maintained throughout the test with no evidence of cracks. On the other hand, the TiO2 deposited on AISI 316L presented a critical load (Lc1) without substrate exposure of around 2.2 N. The thicknesses of the TiO2 films produced in this work were 24% and 23% higher than those reported in the literature for TiO2 films on AISI 304 and AISI 316L, respectively. Finally, the results showed a crystallinity improvement of around 82% for TiO2 deposited on AISI 304.
Author Contributions
V.E.C.M. and L.V. conceived of the presented idea; V.E.C.M., L.A.M., A.A.V. and A.L.d.J.P. developed the theory and performed the computations; V.E.C.M. and L.V. verified the analytical methods; F.d.C.M. encouraged V.E.C.M. to investigate roughness in AFM technic and supervised the findings of this work. All authors have read and agreed to the published version of the manuscript.
Funding
The following Brazilian research agencies supported this work: São Paulo State Research Foundation (FAPESP, grant #11/50773-0), Coordenação de Aperfeiçoamento de Pessoal de Nível Superior (CAPES, Finance Code #001), and Conselho Nacional de Desenvolvimento Científico e Tecnológico (CNPq, grant #317253/2021-2).
Data Availability Statement
The data presented in this study are available on request from the corresponding author.
Acknowledgments
The authors are grateful to INPE for the use of the scanning electron microscope and the Raman system, to ITA for the use of the XRD equipment, and to UNICAMP for the use of the atomic force microscope. We also thank IP&D/UNIVAP for the provision of the ALD facilities. The following Brazilian research agencies supported this work: São Paulo State Research Foundation (FAPESP, grant #11/50773-0), Coordenação de Aperfeiçoamento de Pessoal de Nível Superior (CAPES, Finance Code #001), and Conselho Nacional de Desenvolvimento Científico e Tecnológico (CNPq, grant #317253/2021-2).
Conflicts of Interest
The authors declare no conflict of interest.
References
- Zheng, J.; Bao, S.; Guo, Y.; Jin, P. TiO2 films prepared by DC reactive magnetron sputtering at room temperature: Phase control and photocatalytic properties. Surf. Coat. Technol. 2014, 240, 293–300. [Google Scholar] [CrossRef]
- Kiarii, E.M.; Govender, K.K.; Ndung, P.G.; Govender, P.P. The generation of charge carriers in semiconductors—A theoreical study. Chem. Phys. Lett. 2017, 678, 167–176. [Google Scholar] [CrossRef]
- Grao, M.; Ratova, M.; Amorim, C.C.; Marcelino, R.B.P.; Kelly, P. Crystalline TiO2 supported on stainless steel mesh deposited in a one step process via pulsed DC magnetron sputtering for wastewater treatment applications. J. Mater. Res. Technol. 2020, 9, 5761–5773. [Google Scholar] [CrossRef]
- Ferreira, I.V.L.; Daniel, L.A. TiO2 Heterogeneous photocatalysis in secondary wastewater treatment. Eng. Sanit. Ambient. 2004, 9, 335–342. [Google Scholar] [CrossRef]
- Seul-yi, Q.; Park, S. Review of TiO2 photocatalyst for water treatment applications. J. Ind. Eng. Chem. 2013, 19, 1761–1769. [Google Scholar]
- Reid, M.; Whatley, V.; Spooner, E.; Nevill, A.M.; Cooper, M.; Ramsden, J.J.; Dancer, S.J. How Does a Photocatalytic Antimicrobial Coating Affect Environmental Bioburden in Hospitals? Infect. Control Hosp. Epidemiol. 2018, 39, 398–404. [Google Scholar] [CrossRef] [PubMed]
- Wadullah, H.M.; Ajeel, S.A.; Abbass, M.K. Synthesis and Characterization of Nanocoatings Thin films by Atomic Layer Deposition for Medical Applications. IOP Conf. Ser. Mater. Sci. Eng. 2019, 518, 032057. [Google Scholar] [CrossRef]
- Evans, P.; Sheel, D.W. Photoactive and antibacterial TiO2 thin films on stainless steel. Surf. Coat. Technol. 2007, 201, 9319–9324. [Google Scholar] [CrossRef]
- Thiruvenkatachari, R.; Vigneswaran, S.; Moon, I.S. A review on UV/TiO2 photocatalytic oxidation process. Korean J. Chem. Eng. 2008, 25, 64–72. [Google Scholar] [CrossRef]
- Feltrin, J. Estabilização a Elevadas Temperaturas da Fase Anatase com Partículas Submicrométricas de SiO2. Ph.D. Thesis, Universidade Federal de Santa Catarina, Florianópolis, Brazil, 2012. [Google Scholar]
- Rossella, F.; Galinetto, P.; Mozzati, M.C.; Malavasi, L.; Fernandez, Y.D.; Drera, G.; Sangaletti, L. TiO2 thin films for spintronics application: A Raman study. J. Raman Spectrosc. 2010, 41, 558–565. [Google Scholar] [CrossRef]
- Shan, C.X.; Hou, X.; Choy, K. Corrosion resistance of TiO2 films grown on stainless steel by atomic layer deposition. Surf. Coat. Technol. 2008, 202, 2399–2402. [Google Scholar] [CrossRef]
- Yeh, T.; Huang, Y.; Wang, M.; Tsai, C. Hydrothermal treatments of TiO2 on Type 304 stainless steels for corrosion mitigation in high temperature pure water. Nucl. Eng. Des. 2013, 254, 228–236. [Google Scholar] [CrossRef]
- Zalnezhad, E.; Hamuda, A.M.S.; Faraji, G.; Shamshirband, S. TiO2 nanotube coating on stainless steel 304 for biomedical applications. Ceram. Int. 2014, 41, 2785–2793. [Google Scholar] [CrossRef]
- Ali, S.; Irfan, M.; Niazi, U.M.; Majdi, A.; Rani, A.; Rashedi, A.; Rahman, S.; Kamal, M.; Khan, A.; Alsaiari, M.A.; et al. Microstructure and Mechanical Properties of Modified 316L Stainless Steel Alloy for Biomedical Applications Using Powder Metallurgy. Materials 2022, 15, 2822. [Google Scholar] [CrossRef]
- Cardenas, L.; Macleod, J.; Lipton-Duffin, J.; Seifu, D.G.; Popescu, F.; Siaj, M.; Mantovani, D.; Rosei, F. Reduced graphene oxide growth on 316L stainless steel for medical applications. Nanoscale 2014, 6, 8664–8670. [Google Scholar] [CrossRef] [PubMed]
- Simionescu, N.; Benea, L.; Dumitrascu, V.M. The Synergistic Effect of Proteins and Reactive Oxygen Species on Electrochemical Behaviour of 316L Stainless Steel for Biomedical Applications. IOP Conf. Ser. Mater. Sci. Eng. 2018, 374, 012058. [Google Scholar] [CrossRef]
- Zhang, H.; Banfield, J.F. Structural characteristics and mechanical and thermodynamic properties of nanocrystalline TiO2. Chem. Rev. 2014, 114, 9613–9644. [Google Scholar] [CrossRef]
- Pillis, M.F.; de Oliveira, M.C.L.; Correa, O.V.; Antunes, R.A. Efeito de filmes de TiO2 obtidos pelo processo de deposição química de organometálicos em fase vapor (MOCVD) sobre a resistência à corrosão do aço inoxidável AISI 304 Marina Fuser Pillis. In Proceedings of the Intercorr 2012, Ondina, Salvador, 14–18 May 2012; pp. 1–9. [Google Scholar]
- Brandt, I.S.; Cid, C.C.P.; Azevedo, C.G.G.; Pereira, A.L.J.; Benetti, L.C.; Ferlauto, A.S.; Pasa, A.A.; da Silva, J.H.D. Influence of substrate on the structure of predominantly anatase TiO2 films grown by reactive sputtering. R. Soc. Chem. Adv. 2018, 8, 7062–7071. [Google Scholar]
- Vieira, A.A.; Manfroi, L.A.; Lobo, L.Z.; Santos, T.B.; Silva, S.A.; De Vasconcelos, G.; Radi, P.A.; Newton, S.; Lucia, S. Tribocorrosion Susceptibility and Osseointegration Studies of Silicon-Carbon-Titanium Oxide Coatings Produced on SS316L by Laser Cladding. J. Bio- Tribo-Corros. 2020, 7, 10. [Google Scholar] [CrossRef]
- Xing, Z.; Zhang, J.; Cui, J.; Yin, J.; Zhao, T.; Kuang, J.; Xiu, Z.; Wan, N.; Zhou, W. Recent advances in floating TiO2-based photocatalysts for environmental application. Appl. Catal. B Environ. 2018, 225, 452–467. [Google Scholar] [CrossRef]
- Basiaga, M.; Walke, W.; Antonowicz, M.; Kajzer, W.; Szewczenko, J.; Domanowska, A.; Michalewicz, A.; Szindler, M.; Staszuk, M.; Czajkowski, M. Impact of surface treatment on the functional properties stainless steel for biomedical applications. Materials 2020, 13, 4767. [Google Scholar] [CrossRef] [PubMed]
- Marin, E.; Lanzutti, A.; Lekka, M.; Guzman, L.; Ensinger, W.; Fedrizzi, L. Chemical and mechanical characterization of TiO2/Al2O3 atomic layer depositions on AISI 316 L stainless steel. Surf. Coat. Technol. 2012, 211, 84–88. [Google Scholar] [CrossRef]
- Szindler, M.; Szindler, M.; Basiaga, M.; Łoński, W.; Kaim, P. Application of ALD thin films on the surface of the surgical scalpel blade. Coatings 2021, 11, 1096. [Google Scholar] [CrossRef]
- Basiaga, M.; Staszuk, M.; Walke, W.; Opilski, Z. Mechanical properties of atomic layer deposition (ALD) TiO2 layers on stainless steel substrates. Mater. Werkst. 2016, 47, 512–520. [Google Scholar] [CrossRef]
- Kania, A.; Szindler, M.M.; Szindler, M. Structure and corrosion behavior of TiO2 thin films deposited by ALD on a biomedical magnesium alloy. Coatings 2021, 11, 70. [Google Scholar] [CrossRef]
- Kang, H.; Lee, C.S.; Kim, D.Y.; Kim, J.; Choi, W.; Kim, H. Photocatalytic effect of thermal atomic layer deposition of TiO2 on stainless steel. Appl. Catal. B Environ. 2011, 104, 6–11. [Google Scholar] [CrossRef]
- Manfroi, L.A.; da Silva, M.G.P.; Vieira, A.A.; Macário, P.F.; da Silva, N.S.; Marques, F.C.; Vieira, L. Anatase Film on Orotracheal Tubes to Mitigate Staphylococcus aureus. Sci. Adv. Mater. 2023, 14, 1487–1493. [Google Scholar] [CrossRef]
- Chiappim, W.; Testoni, G.E.; Moraes, R.S.; Pessoa, R.S.; Sagás, J.C.; Origo, F.D.; Vieira, L.; MacIel, H.S. Structural, morphological, and optical properties of TiO2 thin films grown by atomic layer deposition on fluorine doped tin oxide conductive glass. Vacuum 2016, 123, 91–102. [Google Scholar] [CrossRef]
- Aarik, J.; Karlis, J.; Mändar, H.; Uustare, T.; Sammelselg, V. Influence of structure development on atomic layer deposition of TiO2 thin films. Appl. Surf. Sci. 2001, 181, 339–348. [Google Scholar] [CrossRef]
- Rietveld, H.M. The Rietveld method. Phys. Scr. 2014, 89, 098002. [Google Scholar] [CrossRef]
- Degen, T.; Sadki, M.; Bron, E.; König, U.; Nénert, G. The HighScore suite. Powder Diffr. 2014, 29, S13–S18. [Google Scholar] [CrossRef]
- Horn, M.; Schwebdtfeger, C.F.; Meagher, E.P. Refinement of the structure of anatase at several temperatures. Cryst. Mater. 1972, 136, 273–281. [Google Scholar]
- Baur, V.W.H. Über die Verfeinerung der Kristallstrukturbestimmung einiger Vertreter des Rutiltyps: TiO2, SnO2, GeO2 und MgF2. Acta Crystallogr. 1956, 9, 515–520. [Google Scholar] [CrossRef]
- Straumanis, M.E.; Kim, D.C. Lattice Constants, Thermal Expansion Coefficients, Densities and Perfection of Structure of Pure Iron and of Iron Loaded with Hydrogen. Int. J. Mater. Res. 1969, 60, 272–277. [Google Scholar] [CrossRef]
- ASTM C1624-05; Standard Test Method for Adhesion Strength and Mechanical Failure Modes of Ceramic Coatings by Quantitative Single Point Scratch Testing. ASTM International: West Conshohocken, PA, USA, 2012; pp. 1–29.
- Paula, L.O.; Sene, A.C.; Manfroi, L.A.; Vieira, A.A.; Ramos, M.A.R.; Fukumasu, N.K.; Radi, P.A.; Vieira, L. Tribo-Corrosion and Corrosion Behaviour of Titanium Alloys with and without DLC Films Immersed in Synthetic Urine. J. Bio- Tribo-Corros. 2018, 4, 51. [Google Scholar] [CrossRef]
- Marques, F.C.; Jasieniak, J.J. Ionization potential and electron attenuation length of titanium dioxide deposited by atomic layer deposition determined by photoelectron spectroscopy in air. Appl. Surf. Sci. 2017, 422, 504–508. [Google Scholar] [CrossRef]
- Zanatta, A.R. A fast-reliable methodology to estimate the concentration of rutile or anatase phases of TiO2. AIP Adv. 2017, 7, 075201. [Google Scholar] [CrossRef]
- Hanaor, D.A.H.; Sorrell, C.C. Review of the anatase to rutile phase transformation. J. Mater. Sci. 2011, 46, 855–874. [Google Scholar] [CrossRef]
- Santos, T.B.; Vieira, A.A.; Paula, L.O.; Santos, E.D.; Radi, P.A.; Khouri, S.; Maciel, H.S.; Pessoa, R.S.; Vieira, L. Flexible camphor diamond-like carbon coating on polyurethane to prevent Candida albicans biofilm growth. J. Mech. Behav. Biomed. Mater. 2017, 68, 239–246. [Google Scholar] [CrossRef]


Disclaimer/Publisher’s Note: The statements, opinions and data contained in all publications are solely those of the individual author(s) and contributor(s) and not of MDPI and/or the editor(s). MDPI and/or the editor(s) disclaim responsibility for any injury to people or property resulting from any ideas, methods, instructions or products referred to in the content. |
© 2023 by the authors. Licensee MDPI, Basel, Switzerland. This article is an open access article distributed under the terms and conditions of the Creative Commons Attribution (CC BY) license (https://creativecommons.org/licenses/by/4.0/).