Abstract
TC18 titanium alloy is an essential material for aircraft landing gear. To reveal the wear and corrosion mechanisms of landing gear in service, a WC-12Co coating on a TC18 substrate was prepared by High-Velocity Air-Fuel (HVAF) spraying based on optimized process parameters, and an analysis of the microscopic characterization results for the materials involved was performed. Based on the computational fluid dynamics (CFD) method, the combustion reaction and discrete phase models of HVAF spraying were established. The flame characteristics under compressible turbulence and the flight temperature and velocity of particles were calculated. The effect of the spraying parameters on the flight temperature and velocity of particles was evaluated based on the response surface method (RSM) through multiple groups of orthogonal experiments, and the optimized process parameters were determined. The mass flow rate of reactants was 0.051 kg/s, the oxygen/fuel ratio was 2.83, the mass flow rate of the nitrogen was 0.000325 kg/s, the pressure of oxygen and fuel inlet was 1 MPa, the pressure at the particles inlet was 0.6 MPa and the maximum temperature and velocity of spraying particles were 1572 K and 417 m/s, respectively. The coatings prepared with the optimized process were subjected to the Scanning Electron Microscope (SEM), Energy Dispersive Spectroscopy (EDS), X-Ray Diffraction (XRD), wear, hardness, artificial seawater soaking and neutral salt spray experiments. The results showed that the mean hardness of the TC18 substrate was 401.2 HV0.3, the mean hardness of the WC-12Co coating was 1121 HV0.3, the friction coefficient between the TC18 substrate and the Si3N4 ceramic ball was 0.55 and the friction coefficient between the WC-12Co coating and the Si3N4 ceramic ball was 0.4. Compared to the TC18 substrate, the hardness of the WC-12Co coating was increased by 720 HV0.3, the friction coefficient with the Si3N4 ceramic ball decreased by 0.11, the corrosion resistance significantly improved and the maximum depth of the corrosion pits was 5 μm. The properties of the TC18 titanium alloy were effectively improved by the WC-12Co coating. The results of this study provide guidance for surface protection technologies of aircraft landing gear.
1. Introduction
At present, TC18 titanium alloy is widely used in the aerospace, national defense, vehicle, ship and other industries, but problems such as low hardness and poor wear resistance often occur in practical applications [1,2]. In particular, aircraft landing gear and other components made of titanium alloys are used in sea spray and inland hygrothermal environments for long durations, which highlights the need for sufficient corrosion resistance [3]. This practice shows that thermal spraying technology is an important method to improve the surface performance, and it is widely applied in engineering [4,5].
Thermal spraying technology effectively improves the corrosion resistance, wear resistance and high temperature resistance of the part’s surface and repairs the defective areas [6,7]. Spraying materials cover almost all metal materials, ceramics, plastics and other non-metallic materials [8,9]. The gas velocity in the HVAF spraying processes is high and the gas temperature is low [10]. The particles fly at a high velocity and are heated by a high temperature and a high velocity flame flow. Most of the kinetic energy of the sprayed particles is transformed into heat energy upon impact with the substrate [11,12]. At the same time, molten and semi-molten particles are considerably deposited on the surface of the substrate and they solidify and contract instantaneously to form a coating that bonds to and piles up on the substrate [13].
At present, there are many studies on thermal spraying of WC-Co coatings, which are mainly used as the protective layer of wear-resistant parts [14]. In 2010, S.L. Liu et al. [15] investigated the effect of adding nano WC-12Co powder to WC-10Co-4Cr powder in activated combustion high-velocity air-fuel spraying (AC-HVAF) onto 304 stainless steel substrates on the coating properties. In experiments, the sample with 15% nano WC-12Co added to WC-10Co-4Cr had great wear and corrosion resistance, and the hardness of the WC-based coatings significantly improved. Alfredo Valarezo et al. [16] conducted experiments to investigate the effects of the fuel chemical composition, total gas flow and energy input on the particle state in high-velocity oxygen-fuel spraying (HVOF). Ni-20%Cr powder was deposited in situ on a curvature sensor to study the evolution of residual stress, and the coating accumulation process was tracked. In 2014, Nourouzi S. et al. [17] studied the effect of the HVOF thermal spraying process parameters on the particle characteristics and residual stress of WC–12Co coatings on an AISI1045 substrate. In 2015, H. Myalska et al. [18] studied the microstructure and properties of WC-Co coatings deposited on steel substrate using powders with different compositions, and the microstructure was characterized by the SEM method. They found that adding submicron carbides can increase the coating performance. In 2019, Sudarshan Vijay [19] et al. sprayed WC-10Co4Cr and Cr3C2-25Ni20Cr coatings on steel substrates by HVAF. Surface characterization was performed by statistics and fractals to evaluate its wettability. The results showed that the roughness was greatly correlated with the forward contact angle, and the Hausdorff dimensions of the submicron profile and contact angle are positively correlated. In 2021, Ahmed, R. [20] et al. studied the sliding wear properties of WC-Co coatings with thermal spraying and discussed the structure–property relationship and failure mode to guide the tribological design of WC-Co coatings. The dependence of coating microstructure, adhesive material, carbide size, fracture toughness, post-treatment and hardness on the sliding wear performance and test methods were evaluated. In summary, most research has focused on HVOF spraying, and research is lacking on the HVAF coating performance with optimized process parameters. The process parameters of thermal spraying directly affect the coating performance. A quantitative evaluation of the process parameters for thermal spraying is important to reveal the formation mechanism of the coating and improve the coating quality. Therefore, it is necessary to systematically study the preparation of WC-12Co coatings by HVAF spraying.
In this study, Fluent 18.2 business software was used to establish the combustion reaction and discrete phase model of the HVAF spraying process. The flame characteristics under compressible turbulence and the particle flight temperature and velocity in steady state spraying processes were calculated. Based on the RSM, the process parameters for HVAF thermal spraying were optimized. A wear-resistant and corrosion-resistant WC-12Co coating was prepared on a TC18 substrate by HVAF thermal spraying. A micro performance characterization and wear and corrosion experiments of WC-12Co coating were carried out to analyze its wear and corrosion mechanisms. The feasibility of using HVAF spraying with WC for aircraft landing gear was analyzed and verified.
2. Establishment of Numerical Model for HVAF
2.1. Calculation Area and Boundary Conditions
A 2D numerical model of the AK07 spray gun was established. The calculation area is symmetrical about the central axis. The geometric model and boundary conditions were set as shown in Figure 1a. A is the N2 and WC-12Co powder inlet, B is the cooling air inlet and C is the fuel and air inlet. The inlet type is a mass flow inlet, the outlet pressure is 1 atm, the gun body wall and substrate are standard non-slip walls and the temperature is 300 K. The spraying distance is 180 mm. To evenly mix the air and fuel, a ceramic plate was placed at inlet C. Twelve concentric circles were present on the ceramic plate, and 750 holes with 1 mm diameter were uniformly arranged on these circles, as shown in Figure 1b.
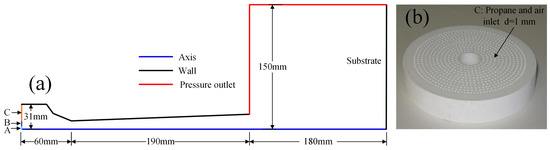
Figure 1.
AK07 spray gun: (a) schematic diagram and boundary conditions and (b) ceramic plate.
2.2. Gridding
The grid details of internal and external flow fields of the AK07 spray gun are shown in Figure 2. The spray gun is symmetrical about the central axis and only 1/2 of the unstructured grid was used for calculations. The number of elements in the calculation domain is 163,857. The combustion chamber, Laval nozzle and air domain are composed of 140, 420 and 220 axial nodes, respectively. To accurately capture the evolution of flame flow characteristics, the key area grid was locally refined, including the air-fuel inlet, nozzle throat, divergent barrel and flame flow jet area.
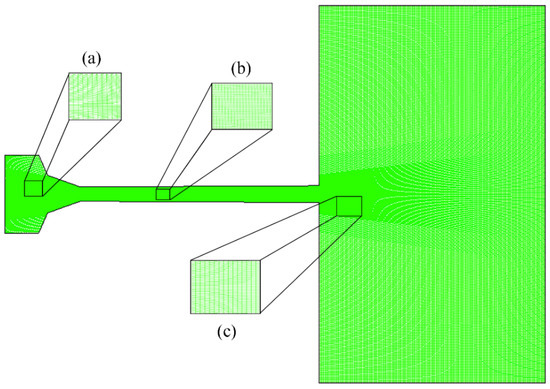
Figure 2.
Detailed grid description of the AK07 spray gun: (a) combustion chamber, (b) Laval nozzle and (c) air domain.
2.3. Gas Dynamic Model
The governing equations of the gas dynamics model in the spraying process include the mass, momentum, energy and the conservation equations of the transport for different combustion components. The control equation in the Cartesian tensor coordinate system can be written as follows [21,22]:
Continuity equation:
Momentum conservation:
Energy conservation:
where the deviatoric stress tensor, τij, and effective heat exchange coefficient, ke, are expressed as follows:
where ρ is the density, t is the turbulent environment, xi is the coordinate in direction i, vi is the velocity in direction i, xj is the coordinate in direction j, vj is the velocity in direction j, p is the pressure, E is the enthalpy, T is the temperature, SD is the energy source of the chemical reaction, μe is the effective value of viscosity turbulence and non- turbulence, δij is the Kronecker sign in the ij direction, kγ is the thermal conductivity, cp is the specific heat capacity, μt is the turbulent viscosity and σt is the turbulent Prandtl number.
Component transport:
where Yβ is the mass fraction of each species, Jβ is the mass diffusion flux, Rβ is the component net productivity and Sβ is the productivity.
2.4. Turbulence Model of Spray Flame Flow
The flame flow during AC-HVAF thermal spraying includes complex shear flow, a large pressure gradient and rapid strain. The RNG k-ε turbulence model was used, and model has the following forms [23]:
Turbulent kinetic energy:
Turbulent energy dissipation rate:
where ε is the turbulent dissipation rate, k is the turbulent kinetic energy, Qk is the production rate of turbulent kinetic energy, YM is the expansion of wave to total dissipation rate in compressible turbulence, Rε is the additional term in the ε equation, the constants used are A1 = 1.42 and A2 = 1.68 and α is the inverse adequate Prandtl number.
2.5. Combustion Reaction Model of Thermal Spraying
The Eddy dissipation model (EDM) [24] is commonly used to simulate the combustion reaction of thermal spraying. It is assumed that the reaction rate is controlled by turbulence rather than Arrhenius chemical kinetics. In this study, EDM was used to calculate the combustion reaction rate between propane and air. The net production rate, Ri, of substance i in reaction r is given by the one of the following values, whichever is smaller [25]:
where N is the number of the chemical composition, is the stoichiometric number of reactant i in reaction r, is the stoichiometric number of product j in reaction r, ε/k is the mixing time scale, Mω,i is the molecular weight of the component j, Mω,j is the molecular weight of the component i, YR is the mass fraction of component R in the combustion products, YP is the mass fraction of component P in combustion products and the empirical constants are A = 4 and B = 0.5.
In an ideal state, the final products of propane and oxygen combustion are H2O and CO2, as follows [26]:
When the temperature in the combustion chamber reaches 2000 K, the combustion products are dissociated due to strong atomic vibrations. CO2 and H2O dissociate into combustible gases (O2 and H2) and atomic gases (O, H and OH). Air is used as a combustion supporting agent. Combining this with the four-step reaction mechanism of propane combustion proposed by Jones [27], it is simplified into a one-step chemical reaction equation as follows [28]:
2.6. Discrete Phase Model of Particles
In this study, we used a decoupling method to analyze the particle behavior. The particles are assumed to have a spherical shape and to not interact with each other. They are mainly subject to drag forces during spraying, and the motion equation of a single particle can be expressed as [28]:
where mp is the mass of the particle, vp is the particle velocity, xp is the particle position, Ap is the cross-sectional area of the particle perpendicular to the gas flow direction, vg is the gas velocity, ρg is the gas density and CD is the drag coefficient.
The heat transfer equation between the solid and the continuous phases can be given as follows [12]:
where h is the heat transfer coefficient, Sp is the surface area of particle, Tg is the gas temperature and Tp is the particle temperature.
2.7. Analysis of Calculation Results
Reference [29] has discussed the modeling process in detail. The flame flow characteristics for spraying and the variation law of the flame flow along the centerline for the gun are shown in Figure 3. The combustion between propane and air in the combustion chamber produces a high temperature and pressure gas. The temperature and pressure of the gas phase peak at 2252 K and 497 kPa, respectively, which are in agreement with the numerical calculation results of Jiang Haoran et al. [30]. Figure 3a shows that the pressure of the gas phase peaks in the combustion chamber with a uniform distribution and sharply decreases in the convergence section at the Laval nozzle with slight fluctuation. A light and dark shock wave can be observed at the nozzle exit. Figure 3b shows that the gas phase temperature peaks in the combustion chamber and is distributed uniformly in addition to the gas inlet. There is a banded zone along the geometric centerline of the gun; the gas phase temperature of the banded zone is lower than that at a position far from the centerline. When the particles are injected into the combustion chamber, nitrogen covers the particles and keeps them at a low temperature, which decreases the risk of oxidation of the particles. Figure 3c shows that the gas injection velocity and flame velocity in the combustion chamber are both 10 m/s. The flame velocity rapidly increases to 730 m/s due to the convergence of the Laval nozzle, accelerates to 1482 m/s due to a shock wave at the gun exit, and then fluctuates while decreasing. Figure 3d shows that the variation in the Mach number is similar to that of the flame flow velocity. Five complete Mach cones can be clearly observed during the free jet area.
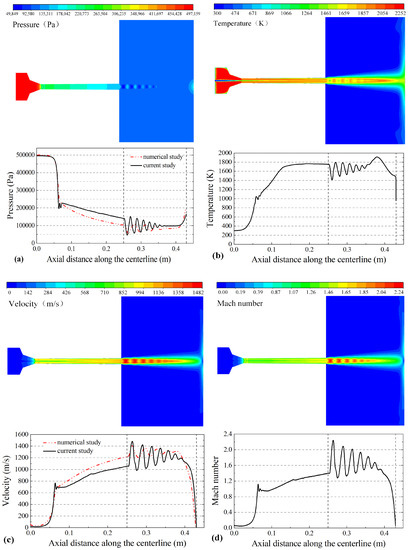
Figure 3.
The contours of the flame (top) and flame flow characteristics along the centerline (bottom): (a) gas pressure (Pa), (b) gas temperature (K), (c) gas velocity (m/s) and (d) Mach number.
The distribution curves of each component for the combustion reaction during spraying along the centerline are shown in Figure 4. In the combustion chamber, nitrogen is the main gas component on the centerline, and a large amount of the fuel and combustion aid are not observed due to the inlets that are not on the centerline. Due to the turbulent mixing of gas, the mass fraction of the nitrogen gradually decreases and the concentration of other components continuously increases. There is a small amount of oxygen in the convergent section of the nozzle, which indicates that the propane fully burns near the central axis and the mixing ratio of the air and propane is optimal.
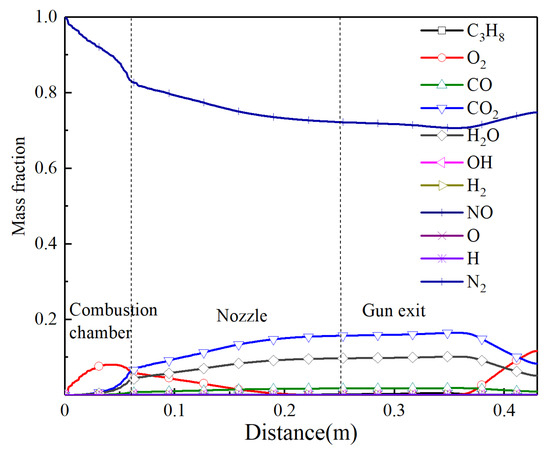
Figure 4.
The mass fraction of different gas components along the centerline.
The temperature and velocity change of the particles was extracted by calculation, as shown in Figure 5. The result shows that the temperature and velocity of particles sharply increase at the convergence section of the Laval nozzle, and the growth gradually slows down after entering the barrel, reaching a peak near the substrate. The maximum temperature and velocity of the particles are 1572 K and 417 m/s, respectively.
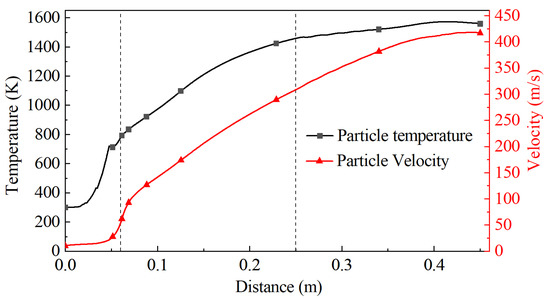
Figure 5.
Change curve of the particle temperature and velocity along the central axis.
3. Optimization Design of Spraying Process Parameters Based on RSM
Based on the above numerical calculation results and reliability theory, the response surface equation was established between the process parameters (reactant mass flow rate, oxygen/fuel ratio and nitrogen mass flow rate) and the particle temperature and velocity, which will optimize the spraying process and improve the coating quality.
The RSM is based on a complex nonlinear relationship between the polynomial fitting function and the dependent variable. The influence of various influencing factors is directly expressed by images [31] and then the optimal value is determined. The expression is:
where x is the influencing factor variable, I and j are the types of influencing factors, n is the number of influencing factors, Y is the predicted response value and β0, βi, βj and βij represent the offset term, linear offset, second-order offset coefficient and interaction coefficient, respectively.
In this study, the Box–Behnken design (BBD) method was selected to design the experimental scheme. It assigns the influencing factors to three levels, and codes them with (−1, 0, +1), where ‘‘0” represents a center level, ‘‘1” represents a high level and ‘‘−1” represents a low level. The level value and code of the influencing factors for the BBD method test are shown in Table 1. The random scheme and calculation results are shown in Table 2.

Table 1.
Coding and level of influencing factors.
Table 2.
Random plan and calculation results.
The calculation results in Table 2 were fitted with multiple regression equations. The RSM fitting regression equations of the particle deposition temperature (Pt) and velocity (Pv) were obtained as follows, respectively.
where C1 is the mass flow rate of the reactant, C2 is the oxygen/fuel ratio, C3 is the mass flow of the cooling gas, Pt is the particle deposition temperature and Pv is the particle deposition velocity.
A variance analysis was used to analyze the significance of the linear term, interaction term and quadratic term of the RSM, which tests the rationality of the model.
Table 3 shows the results of the variance analysis for the Pv model. Table 4 shows the results of the variance analysis for the Pt model. The values of adj. R-squared (98.36%) and pred. R-squared (96.48%) are relatively large and close, and the difference between the two is less than 0.2, indicating that the model has a powerful predictive ability. Through the above data, the optimal combination of process parameters was calculated, as shown in Table 5. The prediction curve of the RSM is shown in Figure 6.
Table 3.
Variance analysis of the response for Pv.
Table 4.
Variance analysis of the response value for Pt.
Table 5.
Results of process parameter optimization.
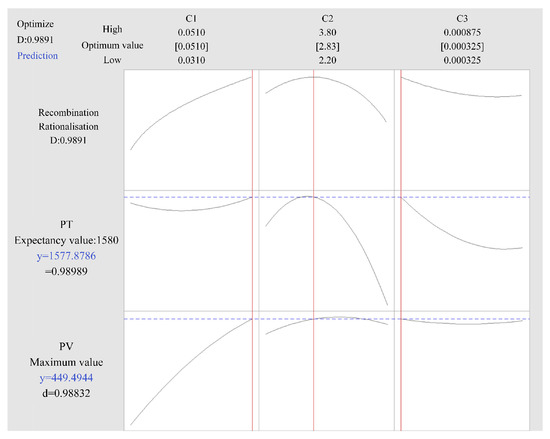
Figure 6.
Prediction curves of process parameters.
4. Experimental Characterization of HVAF
4.1. Experimental Materials
Based on the HVAF spraying system for an AK07 spray gun made by the Kermetico company, Benicia, CA, USA, a WC-12Co coating was prepared on a TC18 titanium alloy substrate. The process parameters used in the spraying process were obtained by a numerical analysis and the RSM. The mass flow rate of reactants was set to 0.051 kg/s, the oxygen/fuel ratio was set to 2.83 and the mass flow rate of the nitrogen was set to 0.000325 kg/s. The WC-12Co powder used in this study was provided by Kennametal Stellite, and the preparation method of powders was agglomeration and sintering. The product brand is JK112, the hardness is 1110 HV and the particle size range is 10–53 μm. Figure 7 shows the microstructure of the WC-12Co powder. Table 6 shows the chemical composition of the TC18 substrate. Before spraying, the substrate was ultrasonically cleaned with acetone, the surface was sandblasted with a 46 mesh Si3N4 ceramic ball abrasive and the grit embedded on the surface of the substrate was removed by compressed air. The coating was prepared by the optimized process and was characterized by relevant experiments.
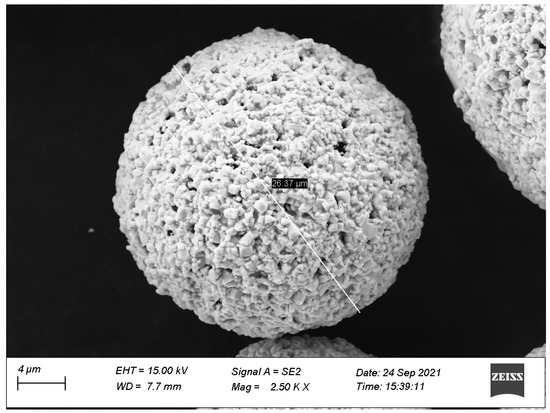
Figure 7.
Morphology of the WC-12Co powder.
Table 6.
Chemical composition of WC-12Co and the TC18 substrate wt.%.
4.2. Experimental Method
The coating micro-morphology was characterized by field emission scanning electron microscopy (Apreo 2S). XRD analyses of the powder and coating were performed on a X’Pert Powder X-ray diffraction instrument produced by Panako, Almelo, Netherlands. The X-ray diffractometer used a Cu target for phase detection with continuous scanning; the scanning velocity was 4°/min, the scan range was between 10° and 90°, the step size was 0.02°, the voltage was 40 kV and the current was 30 mA.
The Q10M Micro Vickers hardness tester produced by QNESS, Salzburg, Austria, was used for hardness testing. Before the test, the piece was ground and polished and the sample was cleaned with alcohol, which removed the dust and impurities on the surface. The experimental process consisted of randomly selecting 5 points of the substrate and coating to measure at room temperature. The indentation distance should be large enough to prevent measurement data inaccuracies due to micro-cracks caused by pressing the indenter. The unit is HV0.3, the pressure is 15 s and the average value was selected as the hardness of the coating and substrate.
The JB-8E stylus surface roughness measuring instrument was used to measure the surface roughness of the TC18 substrate and WC-12Co coating. A total of 9600 points were sampled in the measurement area with a sampling interval of 0.5 μm, and the resolution of 16 bit allowed an effective sensitivity of 0.001 μm. The surface roughness of the substrate before spraying was measured as Ra 7.688 μm, and that of the coating before testing was Ra 1.5 μm.
The improvement in wear resistance of the WC-12Co coating on the TC18 substrate was evaluated by a domestic MS-T3001 rotary ball disc wear testing machine (Lanzhou HuaHui Instrument Technology Co., Ltd, Lanzhou, China.). Before the wear test, the surface of the sample was ground and polished, which ensured all samples had the same roughness, and each test was repeated three times. The unidirectional rolling wear experiment was conducted on the TC18 substrate and WC-12Co coatings under the conditions of dry friction and room temperature. The specific parameters were a load of 300 g, a diameter of 3 mm, a hardness of 1700 HV, a rotational velocity against the Si3N4 ceramic ball of 200 r/min, a test time of 60 min and a sample friction radius of 1.5 mm. The material of the ceramic ball is Si3N4. A D-100 step meter was used to measure the wear cross-section profile. The specific parameters were a scanning velocity of 0.07 mm/s, a scan length of 2.0 mm and a tip pressure of 10.0 mg. The wear morphology was observed by a Kearns VH-Z100R 3D hypnotic electroscope (Keyence, Itasca, IL, USA).
The corrosion resistance of the coating is the ability of the coating material to resist corrosion behavior. It is one of the essential indicators of the coating performance as it protects the substrate materials or delays corrosion. Therefore, the corrosion resistance of the WC-12Co coating was tested to investigate the service life of the protected TC18 substrate. It is dependent on the corrosion rate, which is the loss of weight per unit area within the unit time. Common methods of evaluation are the weight method and surface observation method.
The weight method: The experimental material was corroded under certain conditions. After a while, the weight changed from before to after corrosion. The measurement results of this method are trustworthy and reliable, and it has been widely used. The calculation formula is as follows:
where R is the corrosive velocity, mg·cm−2·h−1; m0 is the weight before experiment, mg; m1 is the weight of the sample after the experiment, mg; A is the surface area of the test sample, cm2; and t is the time of corrosion, h.
The surface observation method: This method details macroscopic and microscopic observations, and is easily operated and applies the study of micro-corrosion characteristics and corrosion behavior.
The corrosion resistance of the TC18 substrate and WC-12Co coating was studied by artificial seawater immersion and neutral salt spray tests. Since corrosion and wear heavily depend on surface morphology, the difference in initial roughness between the substrate and coating affects the judging criteria of the experimental results. Relying on the weight loss method and surface observation method, the corrosion resistances of the substrate and coating were further assessed. The artificial seawater full immersion corrosion experimental standard is the GB/T10124-1988 “Metal Material Laboratory Uniform Corrosion Metal Rehabilitation Experiment Method”. The experimental solution was prepared in deionized water to form a 3.5 wt% NaCl solution. Before experiments, high purity alcohol and distilled water were used to clean the TC18 substrate and WC-12Co coating, which were then dried. Epoxy resin was used to wrap the surface of the test piece, reserving a 3 cm2 working area. The original weight was weighed by an electronic analytical balance. The sample was placed in a constant temperature water bath, which ensured that the water temperature was 35 ± 2 °C during the experiment. The sample was taken out to clean and weigh at different corrosion times (3 d, 5 d, 10 d, 15 d, 20 d and 25 d) and the artificial seawater solution was replaced.
At the same time, the corrosion resistances of the substrate and coating were investigated by a precision salt spray tester. The original shapes of the substrate and coating were preserved without grinding and polishing to ensure its consistency with the actual application. The sample was wrapped in epoxy resin, reserving a 3 cm2 working area. The experimental conditions were a 3.5 wt% NaCl solution salt spray corrosion medium, a laboratory temperature of 35 ± 2 °C and a pressure barrel temperature of 47 ± 2 °C. The sample was placed in the sample tank for 24 h of continuous spraying. The experimental time was set to 3 d, 5 d, 10 d, 15 d, 20 d or 25 d. The sample was taken out to clean and weigh, and the surface morphology of the coating was analyzed after 25 days.
5. Experimental Results and Analysis
5.1. Microstructure Analysis of Powder and Coatings
The WC-12Co powder morphology and its EDS element analysis are shown in Figure 8.
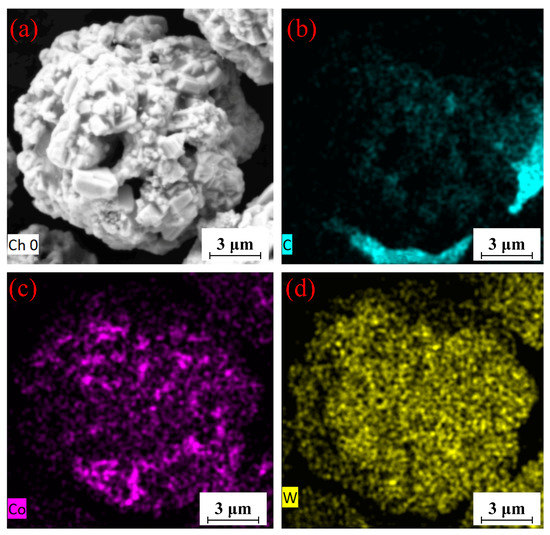
Figure 8.
EDS maps of WC-12Co powder. (a) Plane scanned position; (b) C content; (c), Co content; (d), W content.
WC-12Co powder was prepared by the agglomeration sintering method with an excellent spherical structure on the surface and a rough, porous inside. The porous structure of the powder increases the porosity of coating and consequently the risk of the powder being oxidized. A proper pore structure promotes heat exchange between the flame flow and powder, which increases the temperature of the powder core and obtains a high-quality coating. After heating and accelerating, the powder is deposited on the substrate and flattens, forming a high strength bond with the substrate. The elemental composition of the powder is consistent with the nominal component, indicating that the powder is not oxidized and does not contain impurities. The Co in the powder evenly distributes on the spherical surface, indicating that Co uniformly diffuses during sintering. The duration of temperature control and the thermal temperature are appropriate. The distribution of C and W is relatively uniform, indicating that the preparation of WC-12Co powder is reliable, as it has a high quality without impurities.
Figure 9 shows the XRD phase pattern of the WC-12Co powder. The sprayed powder only contains WC and Co phases, without any other phase structure. The powder preparation process is short and protected by argon, and the risk of oxidative decarburization is vastly reduced. The intensity of the diffraction peak for the Co phase is small due to the strong masking effect of the diffraction peak for the WC phase.
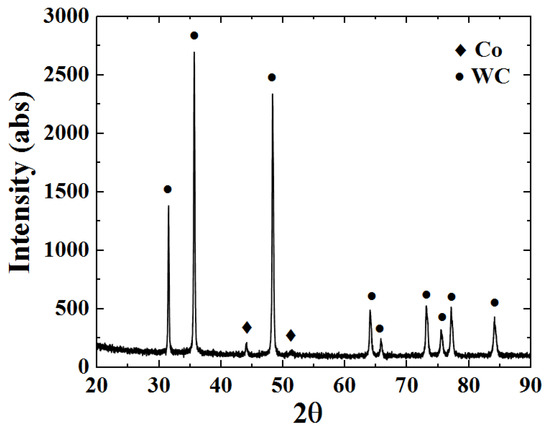
Figure 9.
The XRD phase pattern of the WC-12Co powder.
The microscopic morphology of the WC-12Co coating surface is shown in Figure 10. WC-12Co particles spread out after impacting with the substrate, roughly in a cauliflower shape. This is due to the flattening behavior of semi molten particles after impacting with the substrate at a higher flight velocity. Their behavior is affected by their own kinetic energy, overcoming the effect of surface tension. The combined action of the two directly determines the flattening degree of the particles. It has been shown that during spraying, the powders are fully heated and deformed in the flame flow, the deformed particles accumulate and the coating surface is relatively flat.
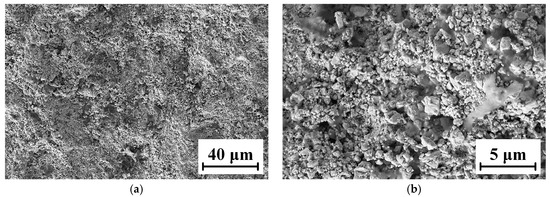
Figure 10.
Micro-morphology of the WC-12Co coating surface. (a) The surface morphology of the coating at 1 K times magnification; (b) The surface morphology of the coating at 5 K times magnification.
The micro-morphology of the WC-12Co coating is shown in Figure 11. Figure 11a shows that the coating thickness is approximately 50 μm, the microstructure presents a layered structure and the bonding boundary fluctuates to a certain extent. The surface is uneven due to the coarsening of the substrate after sandblasting, and there are a few pore defects at the junction. The coating bonded well with the substrate, without large holes and cracks. The Co phase as the bonding phase increases the coating density. Figure 11b shows that the particles and the substrate are mechanically combined, particles impact and invade the substrate with a high kinetic energy. The WC particles are off-white and vary in size, and are covered by the darker bonded phase Co, resulting in the high hardness of the coatings. At the same time, the Co phase and WC microparticles are bonded, leading to an excellent toughness. The spraying particles impact the substrate surface at a high velocity and accumulate, resulting in an “interlock” phenomenon. This improves the binding strength of the coatings, which is derived from the excellent characteristics of the WC-12Co powder and the great spray process parameters.
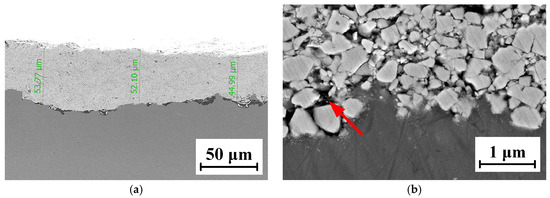
Figure 11.
The SEM micro-morphology of the WC-12Co coating. (a) Cross-sectional morphology of the coating at 0.5 K times magnification; (b) Cross-sectional morphology of the coating at 20 K times magnification.
The EDS analysis of the WC-12Co coating surface is shown in Figure 12. The block scanning area of the coating surface was subjected to component detection, and the detection results are shown in Table 7. The main components of the selected area are W, C and Co. The C content accounts for 8.63%, the Co content accounts for 5.12% and the W content accounts for 86.25%, without other impurity elements. The results show that the WC-12Co spray powder is pure, and no impurities are introduced in the preparation process. C is one of the main components of WC-12Co powder, and a large amount of carbon at peak C indicates that there is not a large amount of C powder precipitation during spraying. The decarburization of WC can form a large amount of W2C, but the XRD only contains the WC phase further proves that.
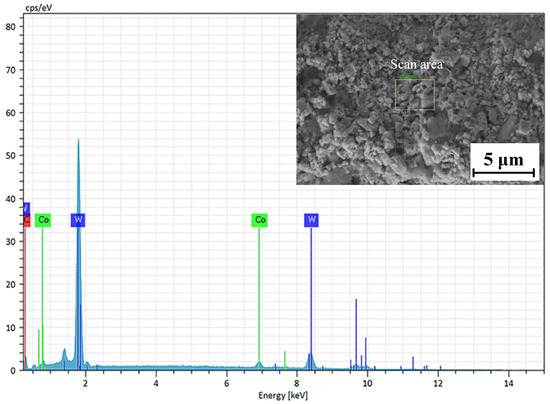
Figure 12.
EDS analysis of the WC-12Co coating surface.
Table 7.
EDS analysis of the WC-12Co coating surface.
The XRD phase atlas of the WC-12Co coating is shown in Figure 13. The XRD phase map contains WC and Co phases, where WC is the main phase. The masking effect of WC peaks on the Co peaks causes their weak diffraction peak intensity. A large amount of the hard WC phase in the coating is the main reason behind the improvement in the hardness and wear resistance of the coating. In a study by Hui et al. [32], a small W2C peak was found in the XRD atlas of the WC-12Co coating, indicating that the decarbonization reaction of WC occurs in HVOF spraying. No new WC phase was found in this study, indicating that the coating was not oxidized or decarburized and the coating quality is great.
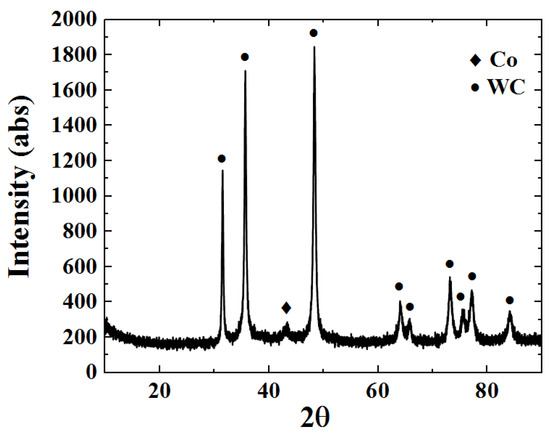
Figure 13.
WC-12Co coating XRD phase map.
5.2. Micro-Hardness Detection
Hardness is a crucial mechanical performance indicator for coatings. The hardness test results can reflect the binding strength, wear resistance performance and service life of the coatings. The hardness detection results of the substrate and coating are shown in Figure 14 (standard deviation of substrate hardness is 23.56 and standard deviation of coating hardness is 147.38). The hardness of the TC18 substrate is between 395 and 429 HV0.3, and the average hardness is 401.2 HV0.3. The hardness of the WC-12Co coating is between 1018 and 1213 HV0.3, with an average hardness value of 1121 HV0.3. The results show that the WC-12Co coating hardness value is 2.8 times that of the TC18 substrate, which is caused by large amount of the hard WC phase in the coating. Compared with HVOF spraying, the AC-HVAF spraying technology has a lower temperature and higher velocity, which ensures that the particles have sufficient impacting kinetic energy, which significantly reduces the decarburization and oxidation of WC compounds. At the same time, small WC particles fill the gaps between the large ones to enhance the consistency and density of the coating.
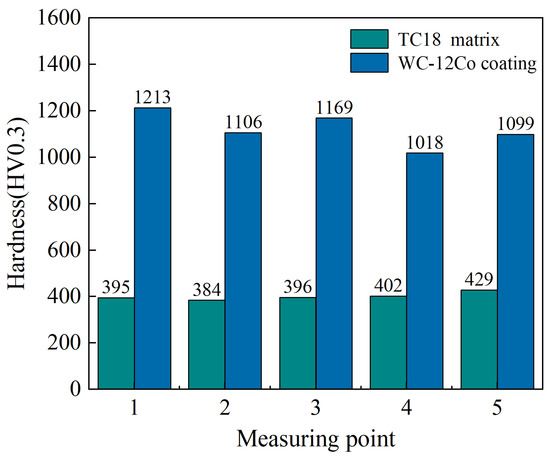
Figure 14.
The hardness values of the TC18 substrate and the WC-12Co coating.
5.3. Wear Performance Research
The phenomenon of losing material on working surface due to the surface relative movements is called wear. WC-12Co coatings are widely used for their high wear resistance. The variation curves of the friction coefficients of the TC18 substrate and the WC-12Co coating are shown in Figure 15. The friction coefficient of the TC18 substrate increases rapidly at the beginning of the friction process (i.e., the first 5 min). This is caused by the temperature increase of the specimen and ball surface due to the frictional heat generated by initial friction, which promotes adhesion between the friction pairs. Subsequently, an oxide film forms on the surface of the substrate and the friction coefficient decreases slightly. As the friction time increases, the contact area between the Si3N4 ceramic ball and the substrate surface increases and the frictional heat effect also increases. The friction coefficient increases to approximately 0.55 and gradually stabilizes. The friction coefficient of the WC-12Co coating in the initial stage increases rapidly to 0.4. It has small fluctuations in the stable wear stage, in which the variation is relatively stable.
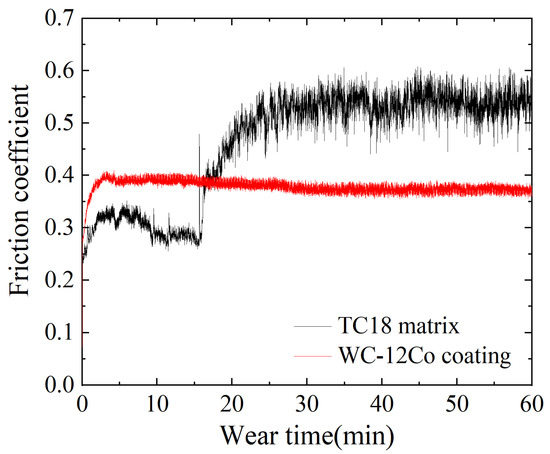
Figure 15.
The friction coefficients of the TC18 substrate and the WC-12Co coating.
As shown in Table 8, the average friction coefficient of the WC-12Co coating is 0.084 smaller than that of the TC18 substrate. The above results show that the hardness of the WC-12Co coating is high and the friction coefficient is relatively stable compared to the TC18 substrate which has a stronger anti-sheer ability. The WC phase in the powder significantly enhances the performance of the coating [33].
Table 8.
Friction coefficients of the substrate and the coating sample.
The wear profile curves of the TC18 substrate and the WC-12Co coating are shown in Figure 16. Under the same test conditions, the width and depth of the abrasion marks on the WC-12Co coating are significantly smaller than those of the TC18 substrate. The maximum depth of TC18 substrate wear marks is 25 μm and the maximum width is 0.75 mm. The depth curve of the WC-12Co coating fluctuates significantly and its grinding width is relatively small due to the coating surface which has a certain roughness. The experiments show that compared with the TC18 substrate, the WC-12Co coating has a great hardness with excellent and stable wear resistance.
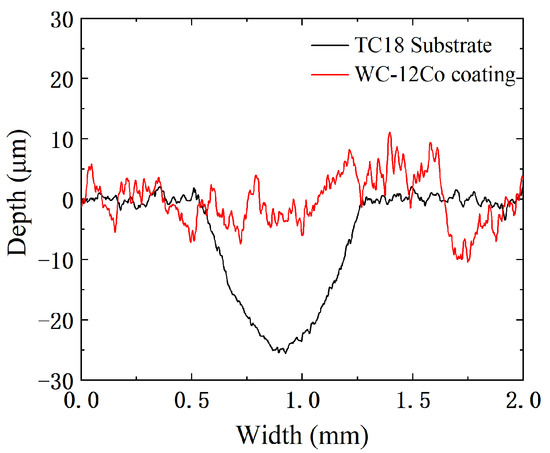
Figure 16.
Abrasion contour lines of the TC18 substrate and the WC-12Co coating.
The wear morphology is a significant basis for judging the wear resistance of a specimen. Combined with wear theory, the wear mechanisms of the TC18 substrate and the WC-12Co coating were analyzed microscopically. The wear morphologies of the TC18 substrate and WC-12Co coating under different magnifications are shown in Figure 17. Figure 17a,b shows that the wear tracks of the TC18 substrate are significant and deep and exhibit a plow pattern. This is accompanied by the falling of the material during wear. The friction surface of the substrate presents typical plastic flow characteristics and the phenomenon of superposition migration for friction films, accompanied by a large number of grooves, indicating that the wear mechanism of the substrate is mainly adhesive wear and abrasive wear is secondary. Figure 17c,d shows that the wear tracks of the WC-12Co coating appear on the rough coating surface bumps, which are randomly distributed with a few shallow tracks. During spraying, a large amount of bonded phase Co and the hardness phase WC combine to induce the excellent wear resistance of the coating. During wear, there is a superior binding force between the particles in the coating due to that the particles do not easily fall off and the wear is minor. The hardness of the WC-12Co coating is higher than that of the TC18 substrate, which corresponds to an excellent wear resistance.
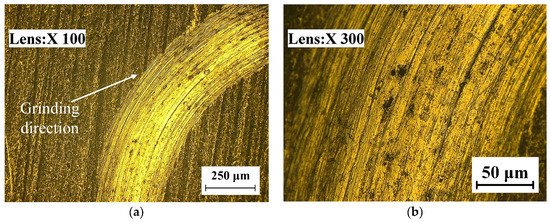
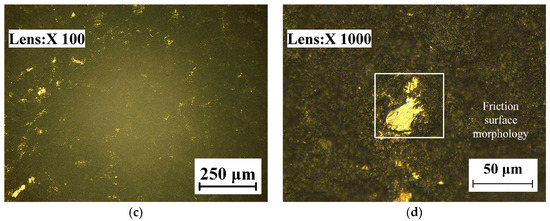
Figure 17.
The wear morphology of TC18 substrate and WC-12Co coating. (a) The substrate wear morphology at 100 times magnification; (b) The substrate wear morphology at 300 times magnification; (c) The coating wear morphology at 100 times magnification; (d) The coating wear morphology at 1000 times magnification.
The 3D wear morphology of the TC18 substrate is shown in Figure 18. The center of the wear tracks on the substrate surface is the deepest point, spreading from the center to both sides and gradually decreasing. The overall widths of the wear tracks are large. The 3D wear morphology of the WC-12Co coating is shown in Figure 19. The wear tracks on the surface of the coating are mainly concentrated in the raised areas. The Si3N4 ceramic ball does not come into contact with the craters in the coating surface, and the depths of the wear tracks are small.
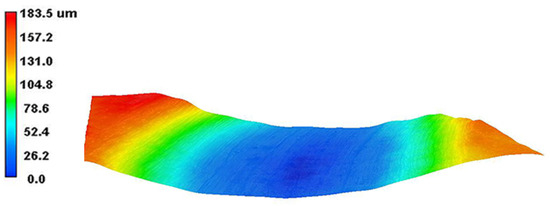
Figure 18.
The 3D wear morphology of the TC18 substrate.
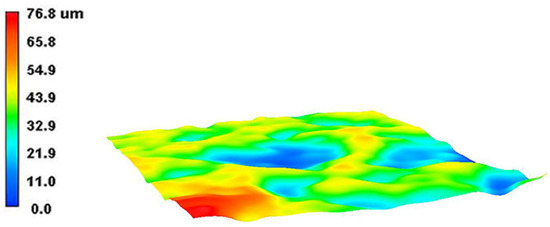
Figure 19.
The 3D wear morphology of the WC-12Co coating.
5.4. Artificial Seawater Soaking Corrosion Experiment
The variation curves of the corrosion weight loss for the TC18 substrate and WC-12Co coating in artificial seawater are shown in Figure 20. The differences in the weight loss between the two specimens immersed in artificial seawater are significant, where the weight loss curve of the TC18 substrate is steep. At the same time, the growth trend for weight loss curve of the WC-12Co coating is slow after 20 d. Under the same conditions, the weight loss of the WC-12Co coating is significantly less than that of the TC18 substrate.
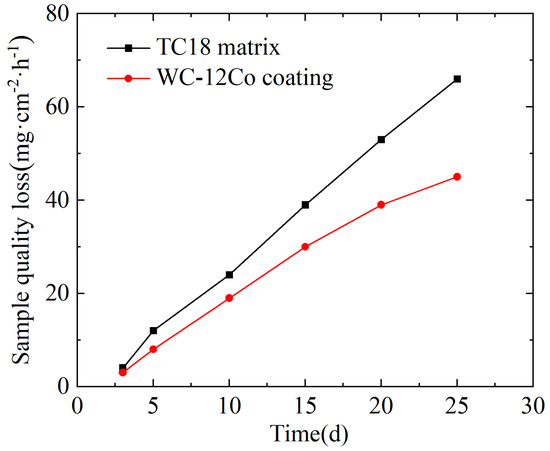
Figure 20.
The change in corrosion weight loss of the substrate and the coating in artificial seawater with time.
The average corrosion rates per unit area of the TC18 substrate and the WC-12Co coating were calculated to be 0.11 mg·cm−2·h−1 and 0.08 mg·cm−2·h−1, respectively, as shown in Table 9. Compared with the TC18 substrate, the average corrosion rate of the WC-12Co coating immersed in artificial seawater is small, which indicates that the WC-12Co coating can improve the corrosion resistance of the TC18 substrate in an artificial seawater environment.
Table 9.
The corrosion test results in artificial seawater.
5.5. Neutral Salt Spray Corrosion Experiment
Hu et al. [34] evaluated the pure mechanical wear and corrosion properties of three WC-based coatings prepared by HVOF in 3.5 wt% NaCl solution. The results showed that the binder phase greatly influences the corrosion and wear properties of the coating. Under pure mechanical wear, the WC-12Co coating shows the best wear resistance, but the corrosion rate is high due to the selective preferential dissolution of the Co phase. The variation curves of the corrosion weight loss for the TC18 substrate and the WC-12Co coating in NaCl neutral salt spray are shown in Figure 21. There are some differences between the two samples in the salt spray environment. The weight loss of the WC-12Co coating is significantly lower than that of the TC18 substrate during the same time. The average corrosion rates per unit area of the TC18 substrate and the WC-12Co coating were calculated to be 0.18 mg·cm−2·h−1 and 0.12 mg·cm−2·h−1, respectively, as shown in Table 10. This indicates that the corrosion resistance of the WC-12Co coating is better than that of the TC18 substrate in a NaCl neutral salt spray medium.
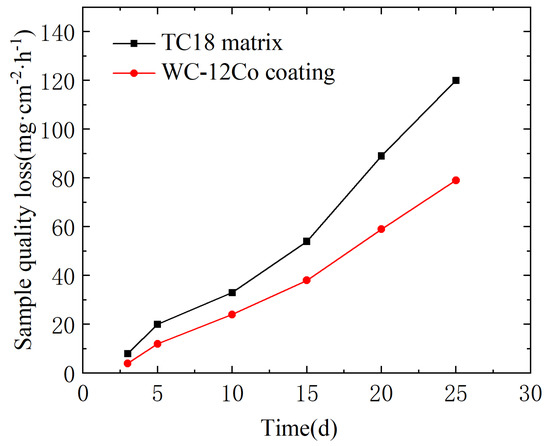
Figure 21.
Weight loss of the substrate and the coating under neutral salt spray corrosion.
Table 10.
The test results of neutral salt spray corrosion.
The micro-morphologies of the TC18 substrate and the WC-12Co coating surface after corrosion by neutral salt spray for 20 days are shown in Figure 22. As shown in Figure 22a,b, the corrosion area of the TC18 substrate contains small amounts of smooth surface and there are many irregular corrosion pits and fine cracks. The corrosion pits are complicated, rough and bottomless, and there is a bright white oxide due to corrosion in the pithead. As shown in Figure 22c,d, the surface of the WC-12Co coating substantially maintains its initial morphology and is relatively flat, with a small number of corrosion pits. After amplifying the corrosion pit, there are many tiny corrosion pores. This is mainly due to the presence of pores and stress concentration produced in the coating preparation, causing Cl− to permeate into the coating to form a micro-cell with the corrosion solution. The bonded phase Co corrodes, the surface becomes rough and the coating significantly cracks and falls off, which reduces its lifetime. The corrosion mechanism of the WC-12Co coating is as follows: the corrosion media corrodes the bonding phase Co, where the corrosion resistance depends on the bonding phase Co. Lv et al. [35] prepared anticorrosive coatings of Al2O3 and WC-Co water-based epoxy resins (WER) on a TC18 substrate by the air spraying method, and the results showed that the WC-Co-WER coatings had a great corrosion resistance. Compared with the TC18 titanium alloy, the WC-12Co coating has excellent corrosion resistance, with relatively minor changes after corrosion tests using neutral salt spray.
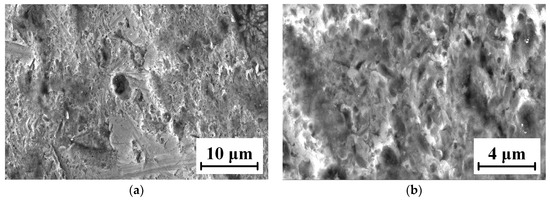
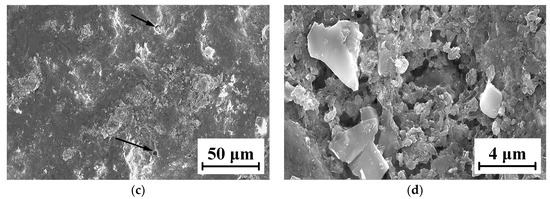
Figure 22.
Micro-morphology of the TC18 substrate and the WC-12Co coating surface after corrosion. (a) Substrate surface morphology at 3 K times magnification; (b) Substrate surface morphology at 10 K times magnification; (c) Coating surface morphology at 1 K times magnification; (d) Coating surface morphology at 10 K times magnification.
The microscopic morphology of the WC-12Co coating sample after neutral salt spray corrosion for 20 days is shown in Figure 23. The coating has a very rough cross-section with many holes, cracks and other defects. When NaCl as corrosion medium is sprayed onto the coating surface, the bonding phase Co with a high corrosion potential is preferentially corroded. However, the NaCl corrosion medium does not penetrate the binding layer between the coating and substrate, and the substrate does not corrode. The WC-12Co coating can effectively improve the corrosion resistance of the TC18 titanium alloy in a neutral salt spray corrosive environment.
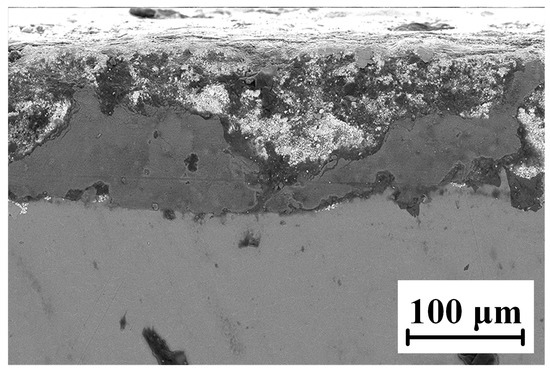
Figure 23.
Micro-morphology of the coating cross-section after neutral salt spray corrosion.
The surface EDS test results of the WC-12Co coating after 25 days of neutral salt spray corrosion is shown in Figure 24. The content of the bonding phase Co in the WC-12Co coating decreased and there is a large amount of O. The results indicate that the bonding phase Co is preferentially corroded in the salt spray experiment and oxide corrosion product forms. A certain amount of Cl− in the coating is caused by the salt residue on the coating surface in a neutral salt spray environment containing NaCl. From the analysis of the EDS energy spectrum of the coating surface, the bonding phase Co of the WC-12Co coating is preferentially corroded in the neutral salt spray corrosion process. There is a particular potential difference between the WC particles and the bonding phase Co, which in turn generates microcurrent corrosion.
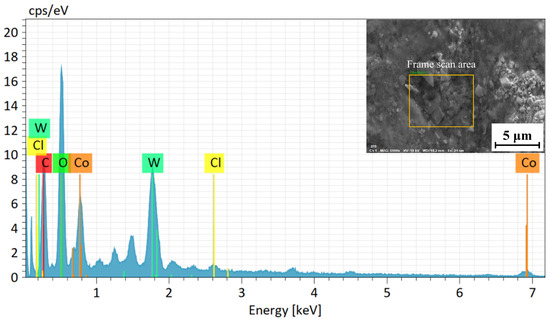
Figure 24.
EDS analysis of the WC-12CO coating surface after corrosion.
6. Conclusions
The combustion reaction model and discrete phase model of the HVAF spraying process were established by the CFD method, which revealed the flame flow characteristics, the mass fraction of gas components and the particle flight characteristics. The response surface equations between the particle temperature, velocity and various process parameters were established, and the optimized process parameters were obtained. The coating was prepared by HVAF spraying based on the optimized process, and micro-characterizations and performance analyses of the coating were carried out.
- (1)
- The numerical calculations show that the temperature and pressure in the combustion chamber reach 2252 K and 497 kPa, respectively. The gas phase velocity reaches a peak value of 1482 m/s at the first Mach cone. There is a small amount of oxygen in the convergent section of the nozzle, which indicates that the propane fully burns near the central axis and the mixing ratio of air and propane is optimal. The maximum temperature and velocity of particles are 1572 K and 417 m/s, respectively.
- (2)
- Based on the response surface equation of Pt and Pv, the optimal parameter combination was obtained as follows: a reactant mass flow rate of 0.051 kg/s, an oxygen/fuel ratio of 2.83 and a nitrogen mass flow rate of 0.000325 kg/s.
- (3)
- The coating experiment showed that the coating prepared by the optimized process has great performance. The distribution of C, Co and W in the WC-12Co powder was uniform. The particles impacted the substrate with flatting deformation, which was in a shape of “cauliflower”. The sprayed particles and the substrate surface overlapped each other to form an “interlock”. The coating density is high and the microhardness was 2.8 times that of the substrate. The mean hardness of the TC18 substrate was 401.2 HV0.3 and the mean hardness of the WC-12Co coating was 1121 HV0.3. The friction coefficient between the TC18 substrate and the Si3N4 ceramic ball was 0.55, and the friction coefficient between the WC-12Co coating and the Si3N4 ceramic ball was 0.4. Compared with the TC18 substrate, the WC-12Co coating has excellent wear resistance and corrosion resistance. Its corrosion mechanism is as follows: the bonding phase Co with a high self-corrosion potential is preferentially corroded, forming corrosion pits and small cracks.
Author Contributions
H.J.: simulation, data analysis, discussion, writing—draft preparation. X.Z.: spray experiment and verification. H.S.: paper typesetting, picture processing. C.L.: fund acquisition, project supervision. All authors have read and agreed to the published version of the manuscript.
Funding
This work was supported by the Liaoning Province Higher Education Innovative Talent Support Program (20201015).
Institutional Review Board Statement
Not applicable.
Informed Consent Statement
Not applicable.
Data Availability Statement
Not applicable.
Conflicts of Interest
The authors declare no conflict of interest.
References
- Dong, S.; Wang, W.; Gao, Y.; Deng, G. Tribological Properties of Different-Sized Black Phosphorus Nanosheets as Water-Based Lubrication Additives for Steel/Titanium Alloy Wear Contact. Metals 2022, 12, 288. [Google Scholar] [CrossRef]
- Gao, Z.; Wang, L.; Wang, Y.; Lyu, F.; Zhan, X. Crack defects and formation mechanism of FeCoCrNi high entropy alloy coating on TC4 titanium alloy prepared by laser cladding. J. Alloys Compd. 2022, 903, 163905. [Google Scholar] [CrossRef]
- Kohli, K.; Bhattacharya, S.K.; Ueda, K.; Narushima, T.; Sahara, R.; Ghosh, P. Electronegativity Difference as a Descriptor for the Oxidation-Inhibiting Effect of the Alloying Element during the Early Stages of Titanium Oxidation. Langmuir 2022, 38, 1448–1457. [Google Scholar] [CrossRef] [PubMed]
- Luo, X.; Chidambaram-Seshadri, R.; Yang, G.-J. Micro-Nanostructured Cermet Coatings. In Advanced Nanomaterials and Coatings by Thermal Spray; Elsevier: Amsterdam, The Netherlands, 2019; pp. 61–117. [Google Scholar]
- Babu, P.S.; Madhavi, Y.; Krishna, L.R.; Sivakumar, G.; Rao, D.S.; Padmanabham, G. Thermal Spray Coatings for Erosion–Corrosion Resistant Applications. Trans. Indian. Inst. Met. 2020, 73, 2141–2159. [Google Scholar] [CrossRef]
- Koivuluoto, H. A Review of Thermally Sprayed Polymer Coatings. J. Therm. Spray Technol. 2022, 31, 1750–1764. [Google Scholar] [CrossRef]
- Sahraoui, T.; Fenineche, N.-E.; Montavon, G.; Coddet, C. Alternative to chromium: Characteristics and wear behavior of HVOF coatings for gas turbine shafts repair (heavy-duty). J. Mater. Process. Technol. 2004, 152, 43–55. [Google Scholar] [CrossRef]
- Li, M.; Christofides, P.D. Multi-scale modeling and analysis of an industrial HVOF thermal spray process. Chem. Eng. Sci. 2005, 60, 3649–3669. [Google Scholar] [CrossRef]
- Kumar, S.; Handa, A.; Chawla, V.; Grover, N.K.; Kumar, R. Performance of thermal-sprayed coatings to combat hot corrosion of coal-fired boiler tube and effect of process parameters and post-coating heat treatment on coating performance: A review. Surf. Eng. 2021, 37, 833–860. [Google Scholar] [CrossRef]
- Shamim, T.; Xia, C.; Mohanty, P. Modeling and analysis of combustion assisted thermal spray processes. Int. J. Therm. Sci. 2007, 46, 755–767. [Google Scholar] [CrossRef]
- Abbas, M.; Smith, G.M.; Munroe, P.R. Microstructural investigation of bonding and melting-induced rebound of HVOF sprayed Ni particles on an aluminum substrate. Surf. Coatings Technol. 2020, 402, 126353. [Google Scholar] [CrossRef]
- Jafari, H.; Emami, S.; Mahmoudi, Y. Numerical investigation of dual-stage high velocity oxy-fuel (HVOF) thermal spray process: A study on nozzle geometrical parameters. Appl. Therm. Eng. 2017, 111, 745–758. [Google Scholar] [CrossRef]
- Baik, J.S.; Kim, Y.J. Effect of nozzle shape on the performance of high velocity oxygen-fuel thermal spray system. Surf. Coat. Technol. 2008, 202, 5457–5462. [Google Scholar] [CrossRef]
- Kuroda, S.; Watanabe, M.; Kim, K.; Katanoda, H. Current Status and Future Prospects of Warm Spray Technology. J. Therm. Spray Technol. 2011, 20, 653–676. [Google Scholar] [CrossRef]
- Liu, S.L.; Zheng, X.P.; Geng, G.Q. Influence of nano-WC–12Co powder addition in WC–10Co–4Cr AC-HVAF sprayed coatings on wear and erosion behaviour. Wear 2010, 269, 362–367. [Google Scholar] [CrossRef]
- Valarezo, A.; Choi, W.B.; Chi, W.; Gouldstone, A.; Sampath, S. Process Control and Characterization of NiCr Coatings by HVOF-DJ2700 System: A Process Map Approach. J. Therm. Spray Technol. 2010, 19, 852–865. [Google Scholar] [CrossRef]
- Nourouzi, S.; Azizpour, M.J.; Salimijazi, H.R. Parametric Study of Residual Stresses in HVOF Thermally Sprayed WC–12Co Coatings. Mater. Manuf. Process. 2014, 29, 1117–1125. [Google Scholar] [CrossRef]
- Myalska, H.; Szymański, K.; Moskal, G. Microstructure and Properties Of WC-Co HVAF Coatings Obtained from Standard, Superfine and Modified by Sub-Micrometric Carbide Powders. Arch. Met. Mater. 2015, 60, 759–766. [Google Scholar] [CrossRef]
- Vijay, S.; Wang, L.; Lyphout, C.; Nylen, P.; Markocsan, N. Surface characteristics investigation of HVAF sprayed cermet coatings. Appl. Surf. Sci. 2019, 493, 956–962. [Google Scholar] [CrossRef]
- Ahmed, R.; Ali, O.; Berndt, C.C.; Fardan, A. Sliding Wear of Conventional and Suspension Sprayed Nanocomposite WC-Co Coatings: An Invited Review. J. Therm. Spray Technol. 2021, 30, 800–861. [Google Scholar] [CrossRef]
- Li, C.; Gao, X.; Yang, Y.; Chen, X.; Han, X. Sensitivity Analysis of Process Parameters of Warm Spraying Process Based on Response Surface Method. J. Therm. Spray Technol. 2022, 31, 585–597. [Google Scholar] [CrossRef]
- Zhou, Z.; Chen, Y.; Hu, Z.; Shen, B.; Liang, X. Numerical Investigation of Particles in Warm-Particle Peening-Assisted High-Velocity Oxygen Fuel (WPPA-HVOF) Spraying. J. Therm. Spray Technol. 2020, 29, 1682–1694. [Google Scholar] [CrossRef]
- Khan, M.N.; Shamim, T.J.A.E. Investigation of a dual-stage high velocity oxygen fuel thermal spray system. Appl. Energy 2014, 130, 853–862. [Google Scholar] [CrossRef]
- Magnussen, B.F.; Hjertager, B.H. On mathematical modeling of turbulent combustion with special emphasis on soot formation and combustion. Symp. Int. Combust. 1977, 16, 719–729. [Google Scholar] [CrossRef]
- Yu, J.; Liu, X.; Yu, Y.; Li, H.; Liu, P.; Sun, R.; Wang, L.; Li, P. Numerical Analysis of High-Velocity Oxygen Fuel Thermal-Spray Process for Fe-Based Amorphous Coatings. Coatings 2021, 11, 1533. [Google Scholar] [CrossRef]
- Yu, J.; Liu, X.; Yu, Y.; Li, Z.; Xu, S.; Li, H.; Liu, P.; Wang, L. Effect of HVOF Spraying Process on Particle Behavior of Fe-Based Amorphous Alloy Coatings. J. Therm. Spray Technol. 2022, 31, 2448–2462. [Google Scholar] [CrossRef]
- Jones, W.P.; Lindstedt, R.P.J.C. Global reaction schemes for hydrocarbon combustion. Combust. Flame 1988, 73, 233–249. [Google Scholar] [CrossRef]
- Liu, F.; Li, Z.; Fang, M.; Hou, H. Numerical analysis of the activated combustion high-velocity air-fuel spraying process: A three-dimensional simulation with improved gas mixing and combustion mode. Materials 2021, 14, 657. [Google Scholar] [CrossRef]
- Gao, X.; Li, C.; Zhang, D.; Gao, H.; Han, X. Numerical analysis of the activated combustion high-velocity air-fuel (AC-HVAF) thermal spray process: A survey on the parameters of operation and nozzle geometry. Surf. Coatings Technol. 2020, 405, 126588. [Google Scholar] [CrossRef]
- Jiang, H.-R.; Li, M.-L.; Wei, X.-S.; Ma, T.-C.; Dong, Y.; Ying, C.-X.; Liao, Z.-Y.; Shen, J. Numerical Investigation of In-Flight Behavior of Fe-Based Amorphous Alloy Particles in AC-HVAF Thermal Spray Process. J. Therm. Spray Technol. 2019, 28, 1146–1159. [Google Scholar] [CrossRef]
- Hamzawy, N.; Mahmoud, T.S.; El-Mahallawi, I.; Khalifa, T.; Khedr, M. Optimization of Thermal Drilling Parameters of 6082 Al-Alloy Based on Response Surface Methodology. Arab. J. Sci. Eng. 2023. [Google Scholar] [CrossRef]
- Hui, S.; Tianyuan, S.; Dejun, K. Surface and cross-section characteristics and friction-wear properties of high velocity oxy fuel sprayed WC-12Co coating. Int. J. Appl. Ceram. Technol. 2018, 15, 1229–1239. [Google Scholar] [CrossRef]
- Mazouzi, A.; Djerdjare, B.; Triaa, S.; Rezzoug, A.; Cheniti, B.; Aouadi, S.M. Effect of annealing temperature on the microstructure evolution, mechanical and wear behavior of NiCr–WC–Co HVOF-sprayed coatings. J. Mater. Res. 2020, 35, 2798–2807. [Google Scholar] [CrossRef]
- Hu, K.; Liu, X.; Zhang, S.; Xue, Z.; Yang, Y.; Yang, K. Tribocorrosion behavior of HVOF sprayed WC-based cermet coatings in sodium chloride solution environment in relation to binder phases. Surf. Coat. Technol. 2022, 435, 128248. [Google Scholar] [CrossRef]
- Lv, Y.; Zhang, P.; Wei, D.; Chen, X.; Ding, F.; Su, F.; Li, H. Corrosion behavior of Al2O3-WER and WC-Co-WER coatings on TC18 in neutral salt spray environment. Mater. Res. Express 2018, 5, 066411. [Google Scholar] [CrossRef]


Disclaimer/Publisher’s Note: The statements, opinions and data contained in all publications are solely those of the individual author(s) and contributor(s) and not of MDPI and/or the editor(s). MDPI and/or the editor(s) disclaim responsibility for any injury to people or property resulting from any ideas, methods, instructions or products referred to in the content. |
© 2023 by the authors. Licensee MDPI, Basel, Switzerland. This article is an open access article distributed under the terms and conditions of the Creative Commons Attribution (CC BY) license (https://creativecommons.org/licenses/by/4.0/).