Article

On the Limits of the EIS Low-Frequency Impedance Modulus as a Tool to Describe the Protection Properties of Organic Coatings Exposed to Accelerated Aging Tests

Department of Industrial Engineering, University of Trento, via Sommarive n. 9, 38123 Trento, Italy
*
Author to whom correspondence should be addressed.
Coatings 2023, 13(3), 598; https://doi.org/10.3390/coatings13030598
Submission received: 2 February 2023 / Revised: 2 March 2023 / Accepted: 9 March 2023 / Published: 11 March 2023
(This article belongs to the Special Issue Degradation of Organic Coatings)

Abstract

:
This study analyzes the limitations of the low-frequency EIS impedance modulus as a tool to describe the protective properties of organic coatings subjected to accelerated aging tests. Acrylic clear-coated steel and hot-dip galvanized steel were exposed to accelerated test methods such as the neutral salt spray chamber and the Prohesion test for up to 2000 and 3000 h, respectively. During exposure, the protective properties of the coatings were monitored by EIS and visual inspection. We observed a significant discrepancy between the measured impedance modulus in the low frequency range (|Z0.01Hz|), and the actual deterioration of the metal–paint interface. The degradation of the two painted substrates is independent of the accelerated test considered. The |Z0.01Hz| values do not represent the actual degradation state of the metal–polymer interface. The manuscript discusses the reasons for the lack of agreement between EIS and visual inspection. The limitations of using the low-frequency EIS impedance modulus to describe the protective properties of organic coatings are highlighted, and several cautions for interpreting the raw EIS data are suggested. The reliability of possible thresholds of |Z0.01Hz| (e.g., failure below 106 ohm∙cm2) to define the protective performance of the coating turned out to be misleading.

1. Introduction

Since the 1970s, electrochemical impedance spectroscopy (EIS) has been used to study organic coatings [1,2]. To date, a large number of studies have been published on the application of EIS to investigate the electrochemical properties and durability of painted metals. Accordingly, several fundamental properties have been investigated using this AC electrochemical technique: water absorption and permeability [3,4,5,6,7,8], cathodic delamination [9], mechanical deformation [10,11,12], and weathering [13,14,15]. Thus, it is well known that the electrochemical properties of organic coatings are closely related to the durability of the protective system. For this reason, a relevant part of the scientific community, industry, military, and standardization bodies have adopted the EIS method to study the degradation kinetics of painted metals and develop modeling and lifetime prediction methods.
EIS is used to monitor the evolution of the electrochemical properties of the painted metal compared to baseline conditions (i.e., prior to outdoor exposure or accelerated laboratory testing). The goal of these experiments may be simply to compare organic coatings of different compositions or to build a database for the development of predictive models. In either case, defining the relevant and representative environment for weathering is a critical issue. Weathering in the intended service environment is the most reliable and effective method for evaluating the durability of organic coatings. However, it is a time-consuming approach because it takes a long time for the coating to fail, making it unsuitable for the time frame of industrial research and development [16]. For this reason, the properties of painted metals are often evaluated by laboratory-scale static or cyclic static accelerated tests. In this context, the neutral salt spray test (ASTM B117 [17]) and its variants (ASTM G85-19 Annex 1–4 [18] or copper accelerated salt spray CASS, ASTM B368 [19]) are commonly used. In the climatic chamber (ASTM D1735 [20]), various combinations of humidity and temperature can be modulated, from the humidostatic regime (ASTM D2247 [21]) to complex wet/dry-cold/warm cycles. Within the cyclic accelerated tests, the prohesion test (also called the dilute electrolyte cyclic fog/dry test, (ASTM G85 Annex 5 [18]) is the most commonly chosen, especially in the automotive field. The prohesion test is recognized as being suitable for simulating a typical industrial environment because it contains aggressive contaminants such as ammonium sulfate. Accelerated weathering cabinets provide a near qualitative and comparable result in a relatively short time (weeks or a few months). The reliability of the results and their correspondence with outdoor weathering has been disputed for many years. The principal limitation of accelerated aging on a laboratory scale is that it should induce the same mechanism of coating failure (e.g., cathodic delamination, filiform corrosion, anodic undermining, blistering, etc.) that occurs in service. Accordingly, one would expect the accelerated test to yield the same performance rating for the specimens tested as for exposure in the natural environment [22]. This basic condition is not always met, and research in this area requires further effort to address all critical aspects.
Regardless of the aging strategy employed, EIS has been widely used to monitor the evolution of the corrosion protection properties of organic coatings in order to correlate the results of quantitative electrochemical properties with the extent of degradation observed in the outdoor environment [13]. The fame of EIS is based on the fact that it is possible, in principle, to extract from a raw electrochemical impedance spectrum collected over a painted metal several physical parameters representative of the system under study: (i) the bulk properties of the polymeric coating, such as coating capacitance and pore resistance; (ii) the electrochemical properties of the metal–electrolyte interface, such as charge transfer resistance and double layer capacitance. In particular, the latter is related to the corrosion activity on the metal substrate [23,24,25]. Extrapolation of these physical parameters from raw EIS data sets is usually performed using nonlinear least-squares fitting techniques, which have proven to be valuable tools for the analysis of complex frequency dispersion data. Passive circuit elements (i.e., electrical equivalent circuits, EEC) are commonly used to fit impedance spectra collected over painted metals. The use of EEC to fit a raw experimental EIS data set is widespread [26,27], although the selection of the correct equivalent circuit and the physical meaning of the obtained fitting parameters are often complex [9,24,28]. In fact, the collected EIS spectra often result from the superposition of electrochemical reactions responses arising from the differential water uptake, organic/inorganic compound leaching, macro defects, distribution of preferential pathways for water permeation, free volume fraction, polar groups in the polymer, inhomogeneity of substrate composition, local corrosion phenomena, diffusion of species through the coating to the metal interface, temperature variations [29,30,31,32], and paint thickness profile [33], etc. Due to the superposition of the electrochemical response of these different processes, the collected spectra would appear very complex and of questionable interpretation. Under these conditions, the application of nonlinear least squares fitting techniques would produce results that are inconsistent with each other, even for similar samples, and the multiple trends would work against the goal of obtaining a common model of degradation. This is especially apparent for large structures where even the simple resist thickness can vary [34]. For this reason, the low-frequency electrochemical impedance modulus (often referred to as |Z|LF, Zmax, |Z0.01Hz|) is commonly used to evaluate, rank, and monitor the performance of coatings. This parameter, generally extrapolated from the “impedance modulus vs. frequency” plot, was proposed by Murray and Hack in 1993 [35] and more widely used by Amirudin and Thierry in their renowned review [36]. Although it is known that the electrochemical impedance modulus provides only partial and incomplete information in the low-frequency range, it is widely used to compare and evaluate different organic coatings on different metal substrates [13,37,38,39,40]. Indeed, several |Z| thresholds are proposed in the literature to distinguish whether the paint is protective or not [36,41]. However, the reliability of these thresholds is controversial. Given the wide range of paint chemistries and the variability of paint cycles [2,42], it is not recommended to adopt universally valid thresholds.
In addition to the limitations of using |Z0.01Hz| to evaluate the protective properties of organic coatings, it should be noted that corrosion tests on organic coatings often give little consideration to the scatter of results in a replicate sample and the uncertainty of the data [43]. Several studies appear to be based on a limited number of samples observed over an extended period of time [37,39,40,41].
Based on these observations, this study aims to evaluate the limitations of using |Z0.01Hz| (i.e., at 10 mHz, |Z0.01Hz|) extrapolated from EIS plots for the study of painted steel and hot-dip galvanized steel specimens when subjected to accelerated aging tests such as the continuous neutral salt spray test (NSST) and the cyclic prohesion test. These aging tests are among the most widely used in the industrial field, both for quality control and new product development [44,45,46,47]. Moreover, different corrosion mechanisms could be triggered by the two types of environmental stresses, and the results of the electrochemical reactions may also be different. The evolution of|Z0.01Hz|, as an indicator of the protection provided by the coating, has been monitored in accelerated tests for up to 3000 h. It is known that |Z0.01Hz| depends on the properties of the coating (dielectric and resistive response), the extent of the corrosion process (charge transfer resistance and double layer capacitance), and the corrosion products (dielectric and resistive response). The effectiveness and reliability of |Z0.01Hz| were evaluated by comparison with the visual appearance of the metal–paint interface (this was possible thanks to the use of a pigment-free coating). The presence of electrolyte deposits and the formation of corrosion products were verified.
The significance of the electrochemical results was discussed in terms of the actual degradation level, which was visually verified, and the monitoring based on |Z0.01Hz| was evaluated in terms of the reliability and accuracy of the data. This study focuses on the EIS monitoring method rather than characterizing the performance of the samples. Six measurements for each sample type and aging procedure were used to examine the trend of deterioration and the agreements between outcomes kinetics were discussed. Since the body of knowledge in the field of organic coatings corrosion is now extensive, users of the available experimental tools need to be made aware of the difficulties in applying these established techniques. The main factor in the complexity of dealing with the degradation of painted metal structures is the enormous number of different practical cases that might be encountered. For this reason, the case studies presented could help to describe some detrimental circumstances that may occur.

2. Materials and Methods

2.1. Samples Preparation

In this work, two types of metal substrates were coated with the same commercial two-component acrylic clearcoat (supplied by Palini Vernici; Pisogne BS, Italy). The selected materials were mild steel (Q-panel R-36, composition: C max. 0.15 wt%; Mg max. 0.6 wt%; P max. 0.03 wt%; S max. 0.035 wt%; and Fe. Bal.) and hot-dip galvanized (HDG) steel supplied by Liberty Steel Italy (Piombino, Italy). For HDG sheets, energy dispersion X-ray spectroscopy (EDXS) revealed the presence of a small amount of Al (0.26 wt.%) in the zinc layer. The base metal for HDG is DX51D low carbon steel EN10346:2015 [48] (C max. 0.18 wt.%; Mn max. 1.2 wt.%; Si max. 0.5 wt.%; P max. 0.12 wt.%; and Fe. Bal.) The steel samples were degreased in acetone and pickled with hydrochloric acid at a concentration of 80 g/dm−3 for 20 min at room temperature. The HDG steel specimens were treated with a 25 g/dm−3 solution of sodium hydroxide for 1 min at 50 °C. A layer of acrylic paint was applied using a blade apparatus (Elcometer 4340). After curing for 1 h at 60 °C, a dry film thickness in the range of 62–78 μm was obtained (see Appendix A for numerical values of each specimen).

2.2. Sample Aging and Characterization

The dry adhesion strength for painted steel and HDG steel determined in the pull-off test [49] was 3.8 ± 0.2 MPa and 2.3 ± 0.3 MPa, respectively (adhesive failure was observed in both cases). The painted specimens were subjected to the neutral salt spray chamber (NSST, ASTM B117) [17] and the prohesion test (ASTM G85-19) [18]. For the tests in the chambers, the edges of the exposed specimens were protected with tape to prevent delamination of the cut edges. The accelerated tests aim to simulate an aggressive environment from the corrosion point of view, which exposes the painted system to high humidity, relatively high temperature, and the presence of chloride ions. The NSST consists of a 100% RH environment achieved with a 5 wt% NaCl solution (Ascott-Analytical, Livonia, MI, USA) and a constant temperature of 35 °C. The prohesion test includes one hour of exposure of the material to a continuous mist of dilute electrolytes followed by one hour of drying at a temperature of 35 °C [18]. The electrolyte used in the wet phase of the prohesion test is a solution of 0.05 wt% NaCl and 0.35 wt% ammonium sulfate (Ascott-Analytical, Livonia, MI, USA) (the composition is described in ASTM D1193 [50]). The coated plates were monitored periodically by recording the EIS response and checking the visual appearance. EIS measurements were performed using an Autolab PGSTAT302N potentiostat (Metrohm, Herisau, Swiss). Spectra were recorded at room temperature (25 °C) in an aqueous NaCl solution (0.5 mol·dm−3) with a quasi-neutral pH (6.2) and with 7.5 ppm dissolved oxygen measured with a PCE-PHD1 probe (PCE-Instruments, Capannori (LU), Italy). Spectra are recorded at a voltage amplitude of ± 15 mV with respect to the open-circuit potential in a frequency range from 100 to 10 mHz after a 5 min delay at the immersion time. A built-in-house mobile cell with a platinum counter electrode with an area of 0.75 cm2 and an Ag/AgCl/3.5M KCl reference electrode with a planar circular test area of 1.25 cm2 was used as the working electrode. EIS data collection was performed to evaluate the corrosion protection properties of the paint during the development of the degradation of the coating system; each sample was analyzed periodically. The experimental campaign was carried out at six different measurement spots for both metallic substrates. The tested areas are always the same for the series of measurements.

3. Results

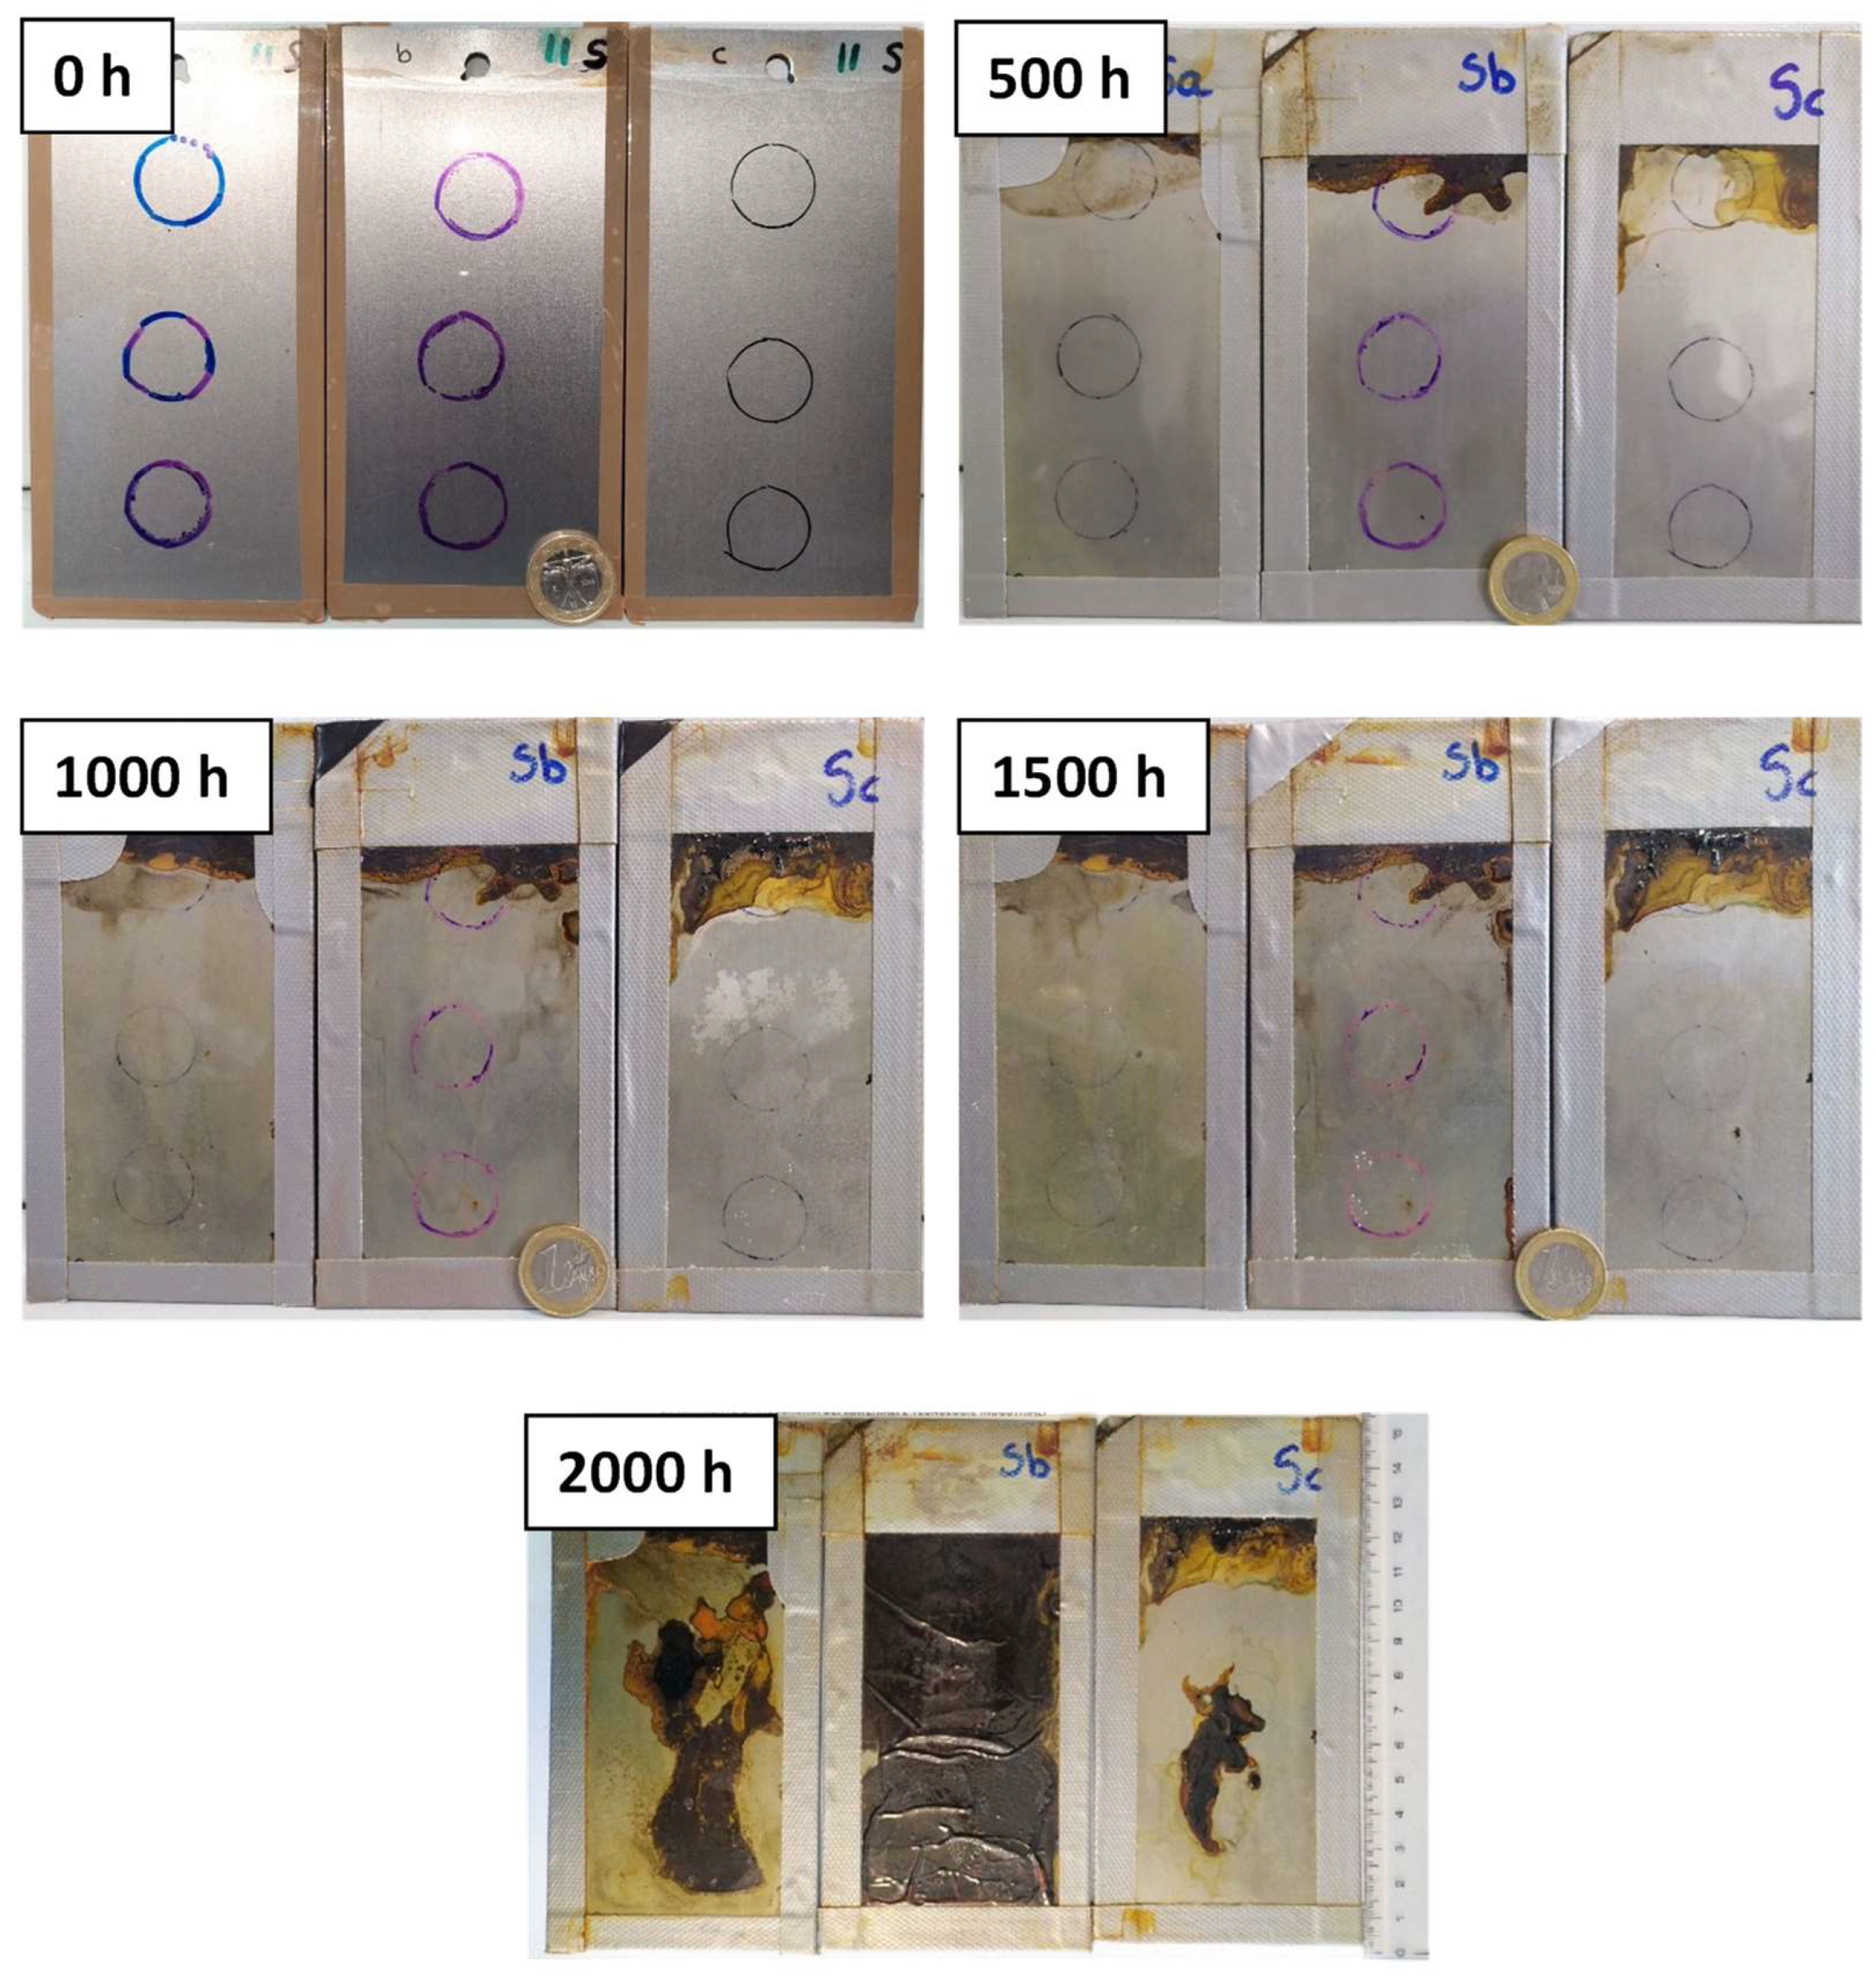
3.1. NSST Aging Results

EIS analysis was performed periodically on the painted samples throughout artificial weathering. Figure 1 and Figure 2 show examples of the EIS response of the tested specimens exposed to NSST, being painted steel and HDG steel, respectively.
For each sample, a decrease in impedance modulus with time is observed, with different kinetics and magnitude. Figure 1 shows the case of a sample that probably had a very small defect in the coating from the beginning. Indeed, a partial resistive response is observed in the mid and low-frequency range. Visual inspection cannot reveal such defects, but EIS can detect them in the early stages of weathering. Many authors believe that samples must be carefully selected before aging tests to obtain homogeneous data [1,2] and a more reproducible campaign. However, real paint films very often do not show a pure capacitive behavior over the whole frequency range [33,51,52,53,54] because the application methods induce the formation of defects. In this work, we examine a range of samples, including coatings with some unavoidable weak spots, to investigate the limit of |Z| in a broader range of scenarios closer to actual application conditions.
Instead, Figure 2 shows the evolution of the coated HDG sample starting from a purely capacitive behavior represented by a phase angle curve stable around −90° [55]. As the aging time progresses, several contributions to the irregular shape of the phase angle occur in parallel with a deflection of the impedance-modulus curve (Figure 1b and Figure 2b). These trends are the superposition of several electrochemical contributions represented by the peaks seen in Figure 1b and Figure 2b, some of which overlap. The qualitative observation of the evolution of |Z| could also be treated as the increasingly resistive frequency range in the weathering period according to Ammar et al. [56], shown by the enlargement of the horizontal part of the curve as the coating absorbs electrolyte and increasingly loses its protective properties [57,58].
The values of |Z0.01Hz| were recorded during the exposure time in the different cabinets, and the evolution with time is shown in Figure 3a,b for painted steel and HDG steel, respectively. The |Z0.01Hz| data are normalized over the paint thickness of the studied area to compare the experimental results. |Z0.01Hz| was monitored during 2000 h, when it dropped significantly to very low values. For both substrates, the initial |Z0.01Hz| values are above 109 ohm∙cm2/µm, and during exposure to NSST, they decrease according to significantly different kinetics. It should be noted that differences of hundreds of hours in the failure time are observed even for similarly manufactured samples, which are due to the unavoidable heterogeneities during the production process, as they are very common in paints applied for corrosion protection purposes. In the case of the painted steel, during the first 300 h in NSST, the samples are characterized by high values of impedance modulus; after about 500 h, some samples show a significant drop to very low |Z0.01Hz| values. As for the painted HDG steel, some samples show a drop in the modulus after the first few days of exposure. Once a sample experiences a drop in impedance modulus, it does not recover and maintains the lower value for the rest of the exposure, or it continues to drop. Both experiments ended after 2000 h when complete coating failure was observed. A sample is considered to have failed when the impedance modulus spectrum shows no capacitive response in the high-frequency region and has very low impedance modulus values (see Figure 1 and Figure 2). At this point, the curves are comparable, to a first approximation, to the results obtained on the bare substrate for comparison. In these conditions, the coating can no longer exert a protective effect: the barrier properties are lost and the electrolyte quickly reaches the metal surface. Figure 3a,b show a very high scatter of the collected data. The experimental points can be schematically represented by a parallelogram, with the acute vertices representing the condition of similar behavior between the samples. This case theoretically occurs at the beginning and at the end of the aging process, when all six samples provide low values of|Z0.01Hz|. The monitored trend during the weathering tests shows a larger dispersion of responses, represented by the highlighted areas in Figure 3a,b. These results indicate that a significant number of samples are required for a reliable experimental investigation of the aging phenomena of painted metals. It seems that even triplicate specimens, which are common in practice [2], are not sufficient to obtain reliable results. In the case of coated steel, all the samples studied exhibit an initial |Z0.01Hz| of about 109 ohm∙cm2/µm, which decreases with time with completely different kinetics from one sample to another. Failure (|Z0.01Hz| ≈ 103 ohm∙cm2/µm) is reached after different exposure times. However, after about 2000 h of the accelerated aging tests, all tested samples show a |Z0.01Hz| value of about 103 ohm∙cm2/µm.
The |Z0.01Hz| values were compared with the appearance of the metal–paint interlayer during the exposure time. Figure 4 shows the evolution of the corrosion at the interface at different exposure times in the aging cabinets: 0, 500, 1000, 1500, and 2000 h. Visual inspection highlights the early underpainting at the cut edge, which proves to be the weakest area despite protection with tape. The areas that showed delamination due to the cut edges were not included in the EIS measurements. The drawn circles on the surface of the sample indicate the area that was sampled with EIS.
In the case of the galvanized substrate (Figure 5), well-distributed white zinc corrosion products developed under the clear coat after 500 h of exposure. At this point, paint adhesion is likely impaired, although the coatings appear to be undamaged, and for most samples, the measured |Z0.01Hz| values are still high (Figure 3b).
Degradation of the metal–polymer interface, corrosion of the substrate, and formation of corrosion products continue for up to 1000 h, resulting in significant degradation of the samples. In the case of steel (Figure 4), in addition to rust formation, significant adhesion loss is observed along with electrolyte accumulation at the interface. On the galvanized surface (Figure 5), the whitish zinc corrosion products partially change to reddish iron corrosion products, and the paint begins to detach from the substrate. After about 1000 h, all specimens look damaged due to the corrosion of the substrates: The coatings are no longer protective. The appearance of the samples after exposure differs significantly from the trend obtained from the raw EIS data. Despite the loss of adhesion and the presence of rust at the interface, the |Z0.01Hz| values are still high (108–109 ohm∙cm2/µm) and correspond to those of a nearly intact organic coating. It should be noted that the samples showing extensive degradation at the interface are often characterized by very high values of impedance modulus throughout the frequency range and |Z0.01Hz| values comparable to those of unexposed samples. In the EIS plots, the contribution of the interface is masked by the electrochemical response of the organic coating (in the frequency range studied, from 10 mHz to 100 kHz), and the true extent of the interface degradation is possible because the coating is a transparent layer.

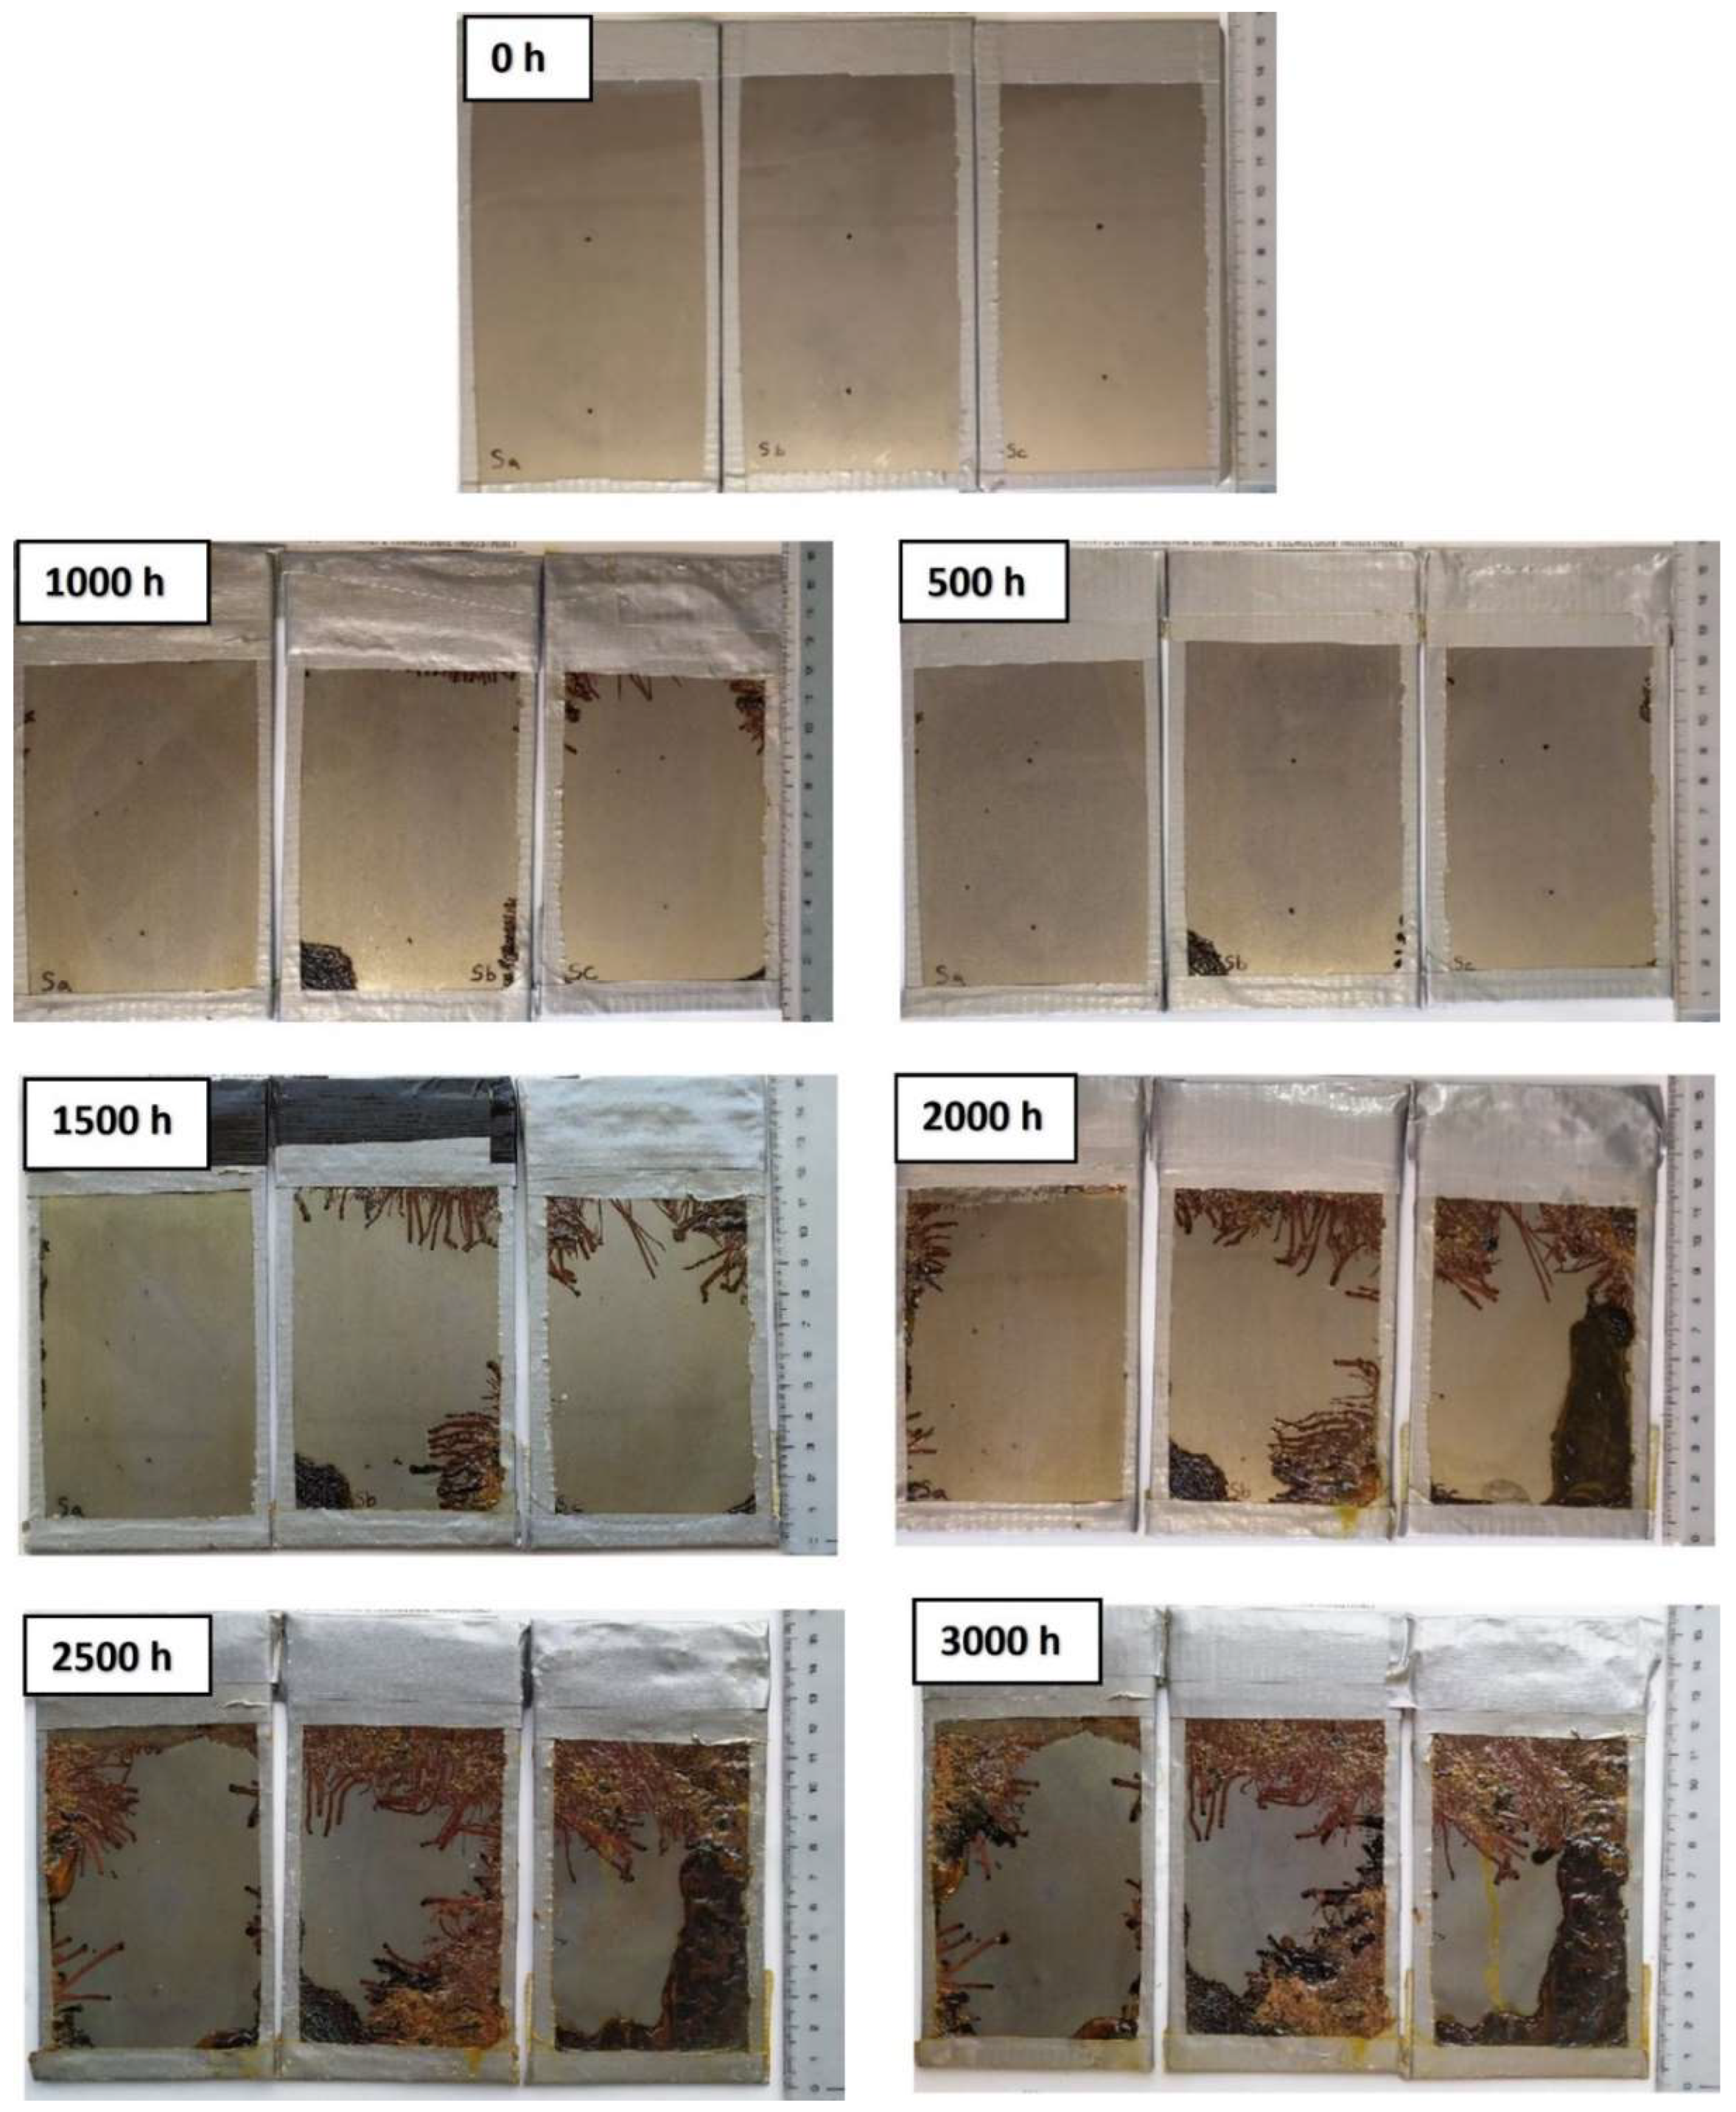
3.2. Prohesion Test Results

The tested samples were exposed in the prohesion test chamber. In this case, the main differences from static NSST are the composition of the electrolyte and the presence of wet/dry cycles, as described in ASTM G-85 [18]. It should be noted that even if the chamber dries out, the moisture remains on the surface of the painted sample until it can be removed by heating (35 °C) after 45 min, simulating the effect of dew or raindrops. Compared to NSST, the chloride concentration is lower and ammonium sulfate is present in the artificial fog (measured pH 6.1) to simulate an industrial environment [59].
Examples of the evolution of EIS over time are shown in Figure 6 and Figure 7 for painted steel and HDG steel, respectively. Despite the change in the accelerated weathering method, the trends are similar to those observed for exposure in NSST. Comparing the initial EIS spectra reveals different behavior: Several samples show a predominantly capacitive response over the entire frequency range (as shown in Figure 2) with high |Z0.01Hz| (about 1010 ohm∙cm2), whereas a few samples show a resistive response in the mid and low-frequency range with |Z0.01Hz| values of about 106–108 ohm∙cm2. The latter is likely characterized by initial weak spots and significant heterogeneities leading to lower impedance values in the mid-low frequency range and more complex spectra (as in Figure 6) at longer immersion times. Also, in this case, the test was prolonged until the capacitive response in the mid-and high-frequency range disappeared (exposure time of more than 2500 h).
Figure 8a,b show the measured |Z0.01Hz| with exposure time in the prohesion test chamber for painted steel and HDG steel, respectively. The data distribution is comparable to that observed for exposure in the NSST. A significant scatter of |Z0.01Hz| data from almost identical samples is observed. For both metal substrates, failure of the entire sample series occurs between 2500 and 3000 h of exposure. Comparing these results with NSST, the prohesion test appears to be less severe for this type of painted substrate, as a failure of 100% of the samples occurred about 1000 h later.
Figure 9 shows the appearance of the specimens during the 3000 h of the prohesion test. In this case, corrosion also began at the cut edges with linear filaments. The EIS spectra were collected over areas that were not affected by delamination of the cut edges. Note that after 500 h of accelerated aging, the steel specimens (Figure 9) are still intact in most painted areas despite some degree of cut-edge corrosion described previously.
In the case of galvanized steel, at the same test time, one of the three specimens is severely damaged compared to the others, likely due to a defect in the coating (Figure 10). Aside from the severely corroded specimen, a few areas of whitish zinc corrosion products appeared after 500 h, but they were nowhere near as pronounced as those observed during exposure in the NSST. Zinc corrosion products develop with exposure time, and paint delamination occurs. However, no traces of steel corrosion products are found. It should be noted that after 2000 h of exposure when an accumulation of corrosion products and electrolytes is observed at the metal–paint interface, several EIS spectra still show quite high |Z0.01Hz| values (>107 ohm∙cm2/µm).
As indicated by the electrochemical analysis and reconfirmed by visual observation, a large number of samples are required to capture the variability in organic coating performance. Studies performed on a perfectly controlled surface are not reliable to represent the actual application in the field, where heterogeneities in coatings are always present.

4. Discussion

So far, discussion of the EIS spectra has been limited to comparisons between the |Z0.01Hz| values and the visual appearance of the samples. We have observed a significant discrepancy between the measured |Z0.01Hz| values decay and the actual metal–paint interface for both the painted substrates and independent of the accelerated test investigated. However, it is known that EIS is sensitive not only to the organic coating but also to the corrosion process under the paint [2]. For this reason, it could be suggested that the collected raw EIS data sets could be analyzed using nonlinear least-squares fitting techniques to separate the contribution of the coating and that of the metal surface to the EIS response. We also believe that a comparison between the actual state of degradation observed by visual inspection and the physical parameters related to the Faradic process at the metal–electrolyte interface (such as the charge transfer resistance of the double-layer capacitance) would likely provide consistent results. For this reason, we report here a discussion of the possible fitting of the collected EIS spectra to obtain a numerical estimate of the physical parameters describing the corrosion process under the coatings.

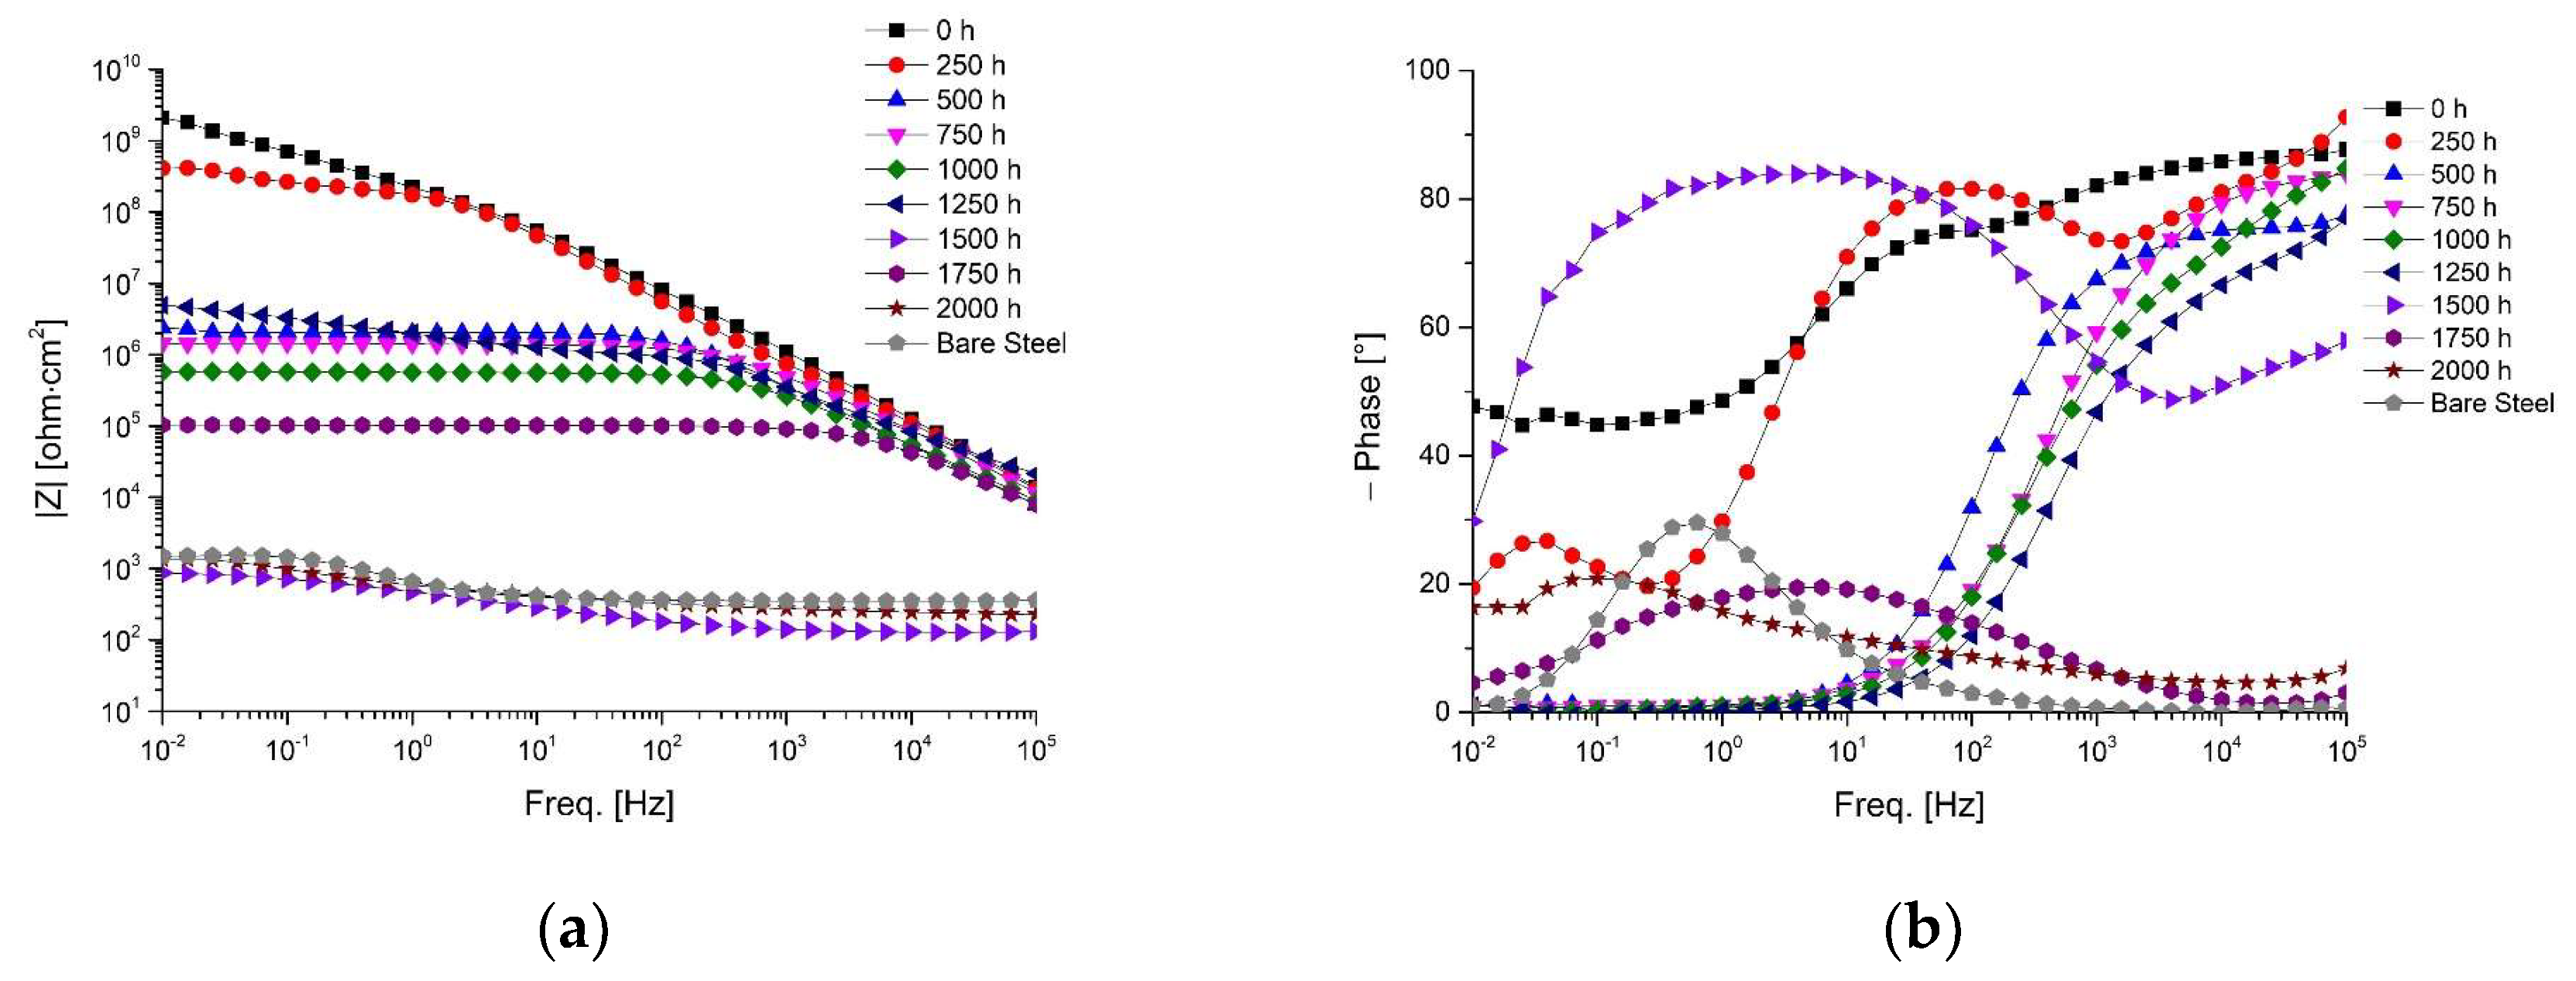
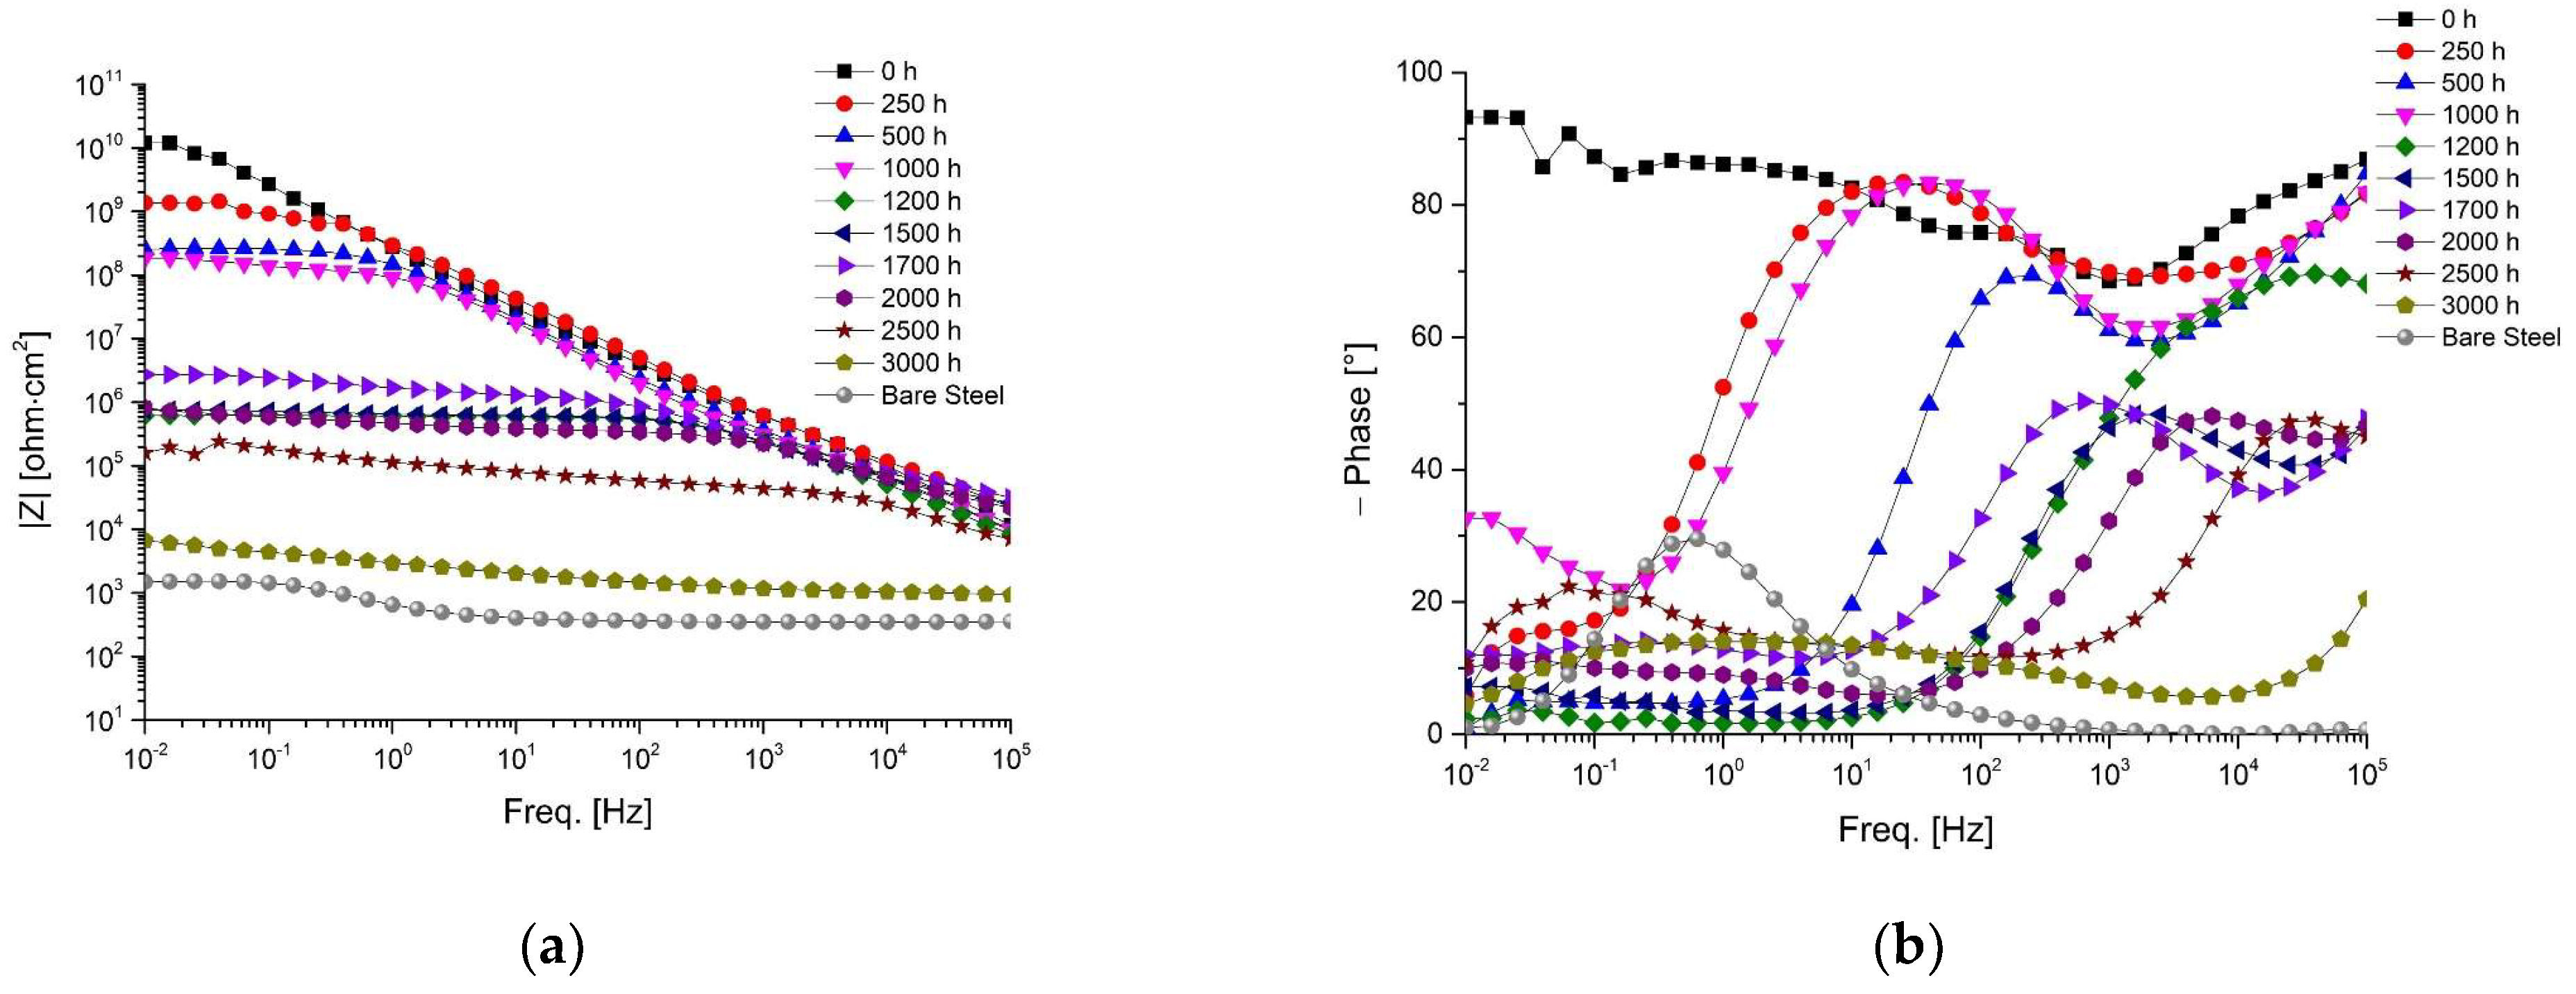
4.1. Comments on EIS Spectra

It is known that EIS is more effective in assessing the deterioration of the barrier properties of organic coatings due to the permeation of ions, whereas EIS may suffer from a shielding effect in thick and durable coatings and is unable to detect adhesion loss at the metal–paint interface [42,60]. In the studied samples, which are a good replica of the real situation where large or complex metal structures are painted, the heterogeneity of the thickness leads to complex impedance spectra. Even for successive measurements on the same sample during the study period, the shape of the EIS spectrum exhibits a large scatter: a deterministic trend representative of the progression of the underpaint degradation process is rarely observed. This aspect appears as a weakness of the experimental campaign, but from a different perspective, it shows once more the limitations and the current problems faced by this electrochemical approach in monitoring painted components in service, in agreement with several previous publications on this subject [61,62,63,64].
Figure 11 shows an example of the collected EIS spectra on painted steel. Since the coating is characterized by a not perfectly homogeneous organic layer, some problems arise in the spectra analysis. First, for most samples, from time zero to the first few hundred hours of accelerated aging, a minimum is observed in the phase angle spectra. According to the observation reported by Touzain et al. [33], the EIS response is probably mainly influenced by the thickness profile of the organic coating on the tested surface, resulting in different water permeation in the layer. In the cited work, the authors observed a similar phase angle minimum in the same frequency range for short immersion times. In this work, the phase angle minimum is observed at high frequency at the beginning of weathering and longer weathering when other time constants occur in the middle and low-frequency range. This peculiarity has been observed in thick coatings [65], where the commonly used electrical equivalent circuits such as R(CR) or R(C(R(CR))) do not fit the raw EIS data sets. For such organic coatings, two relaxation processes appear to occur in the EIS spectra [66], one of which is likely due to the water absorption profile in the coating. As reported by Bouvet et al. [51], the organic coating could ideally be divided into two distinct parts: the outermost layer, which is saturated with water, and the inner layer, which is assumed to be dry. This model of the coating corresponds to two different phase constants in a hypothetical electrical equivalent circuit that considers only the paint portion only. These contributions greatly complicate the fit of the EEC to the raw EIS data sets, and it is difficult to assign univocally physical meaning to each element. The sole presence of the phase angle minimum at high frequencies would require a separate detailed discussion to select an appropriate combination of passive circuit elements to describe the organic coating. However, this analysis is beyond the purpose of this work, which is to focus on the degradation of the system.
The faradic process is generally observed in the low-frequency region of the EIS spectrum, as shown in Figure 11. In contrast to the reported example, most of the curves collected in this experimental campaign did not clearly show the time constant corresponding to the corrosion process under the coating (as an example, see Figure 1, Figure 2, Figure 6 and Figure 7), even for samples where there was visible corrosion activity under the coating. The relaxation process corresponding to interfacial processes is probably at frequencies below 0.01 Hz. This fact severely compromises the ability to extract the physical parameters representative of the faradic process using non-linear least squares fit techniques.

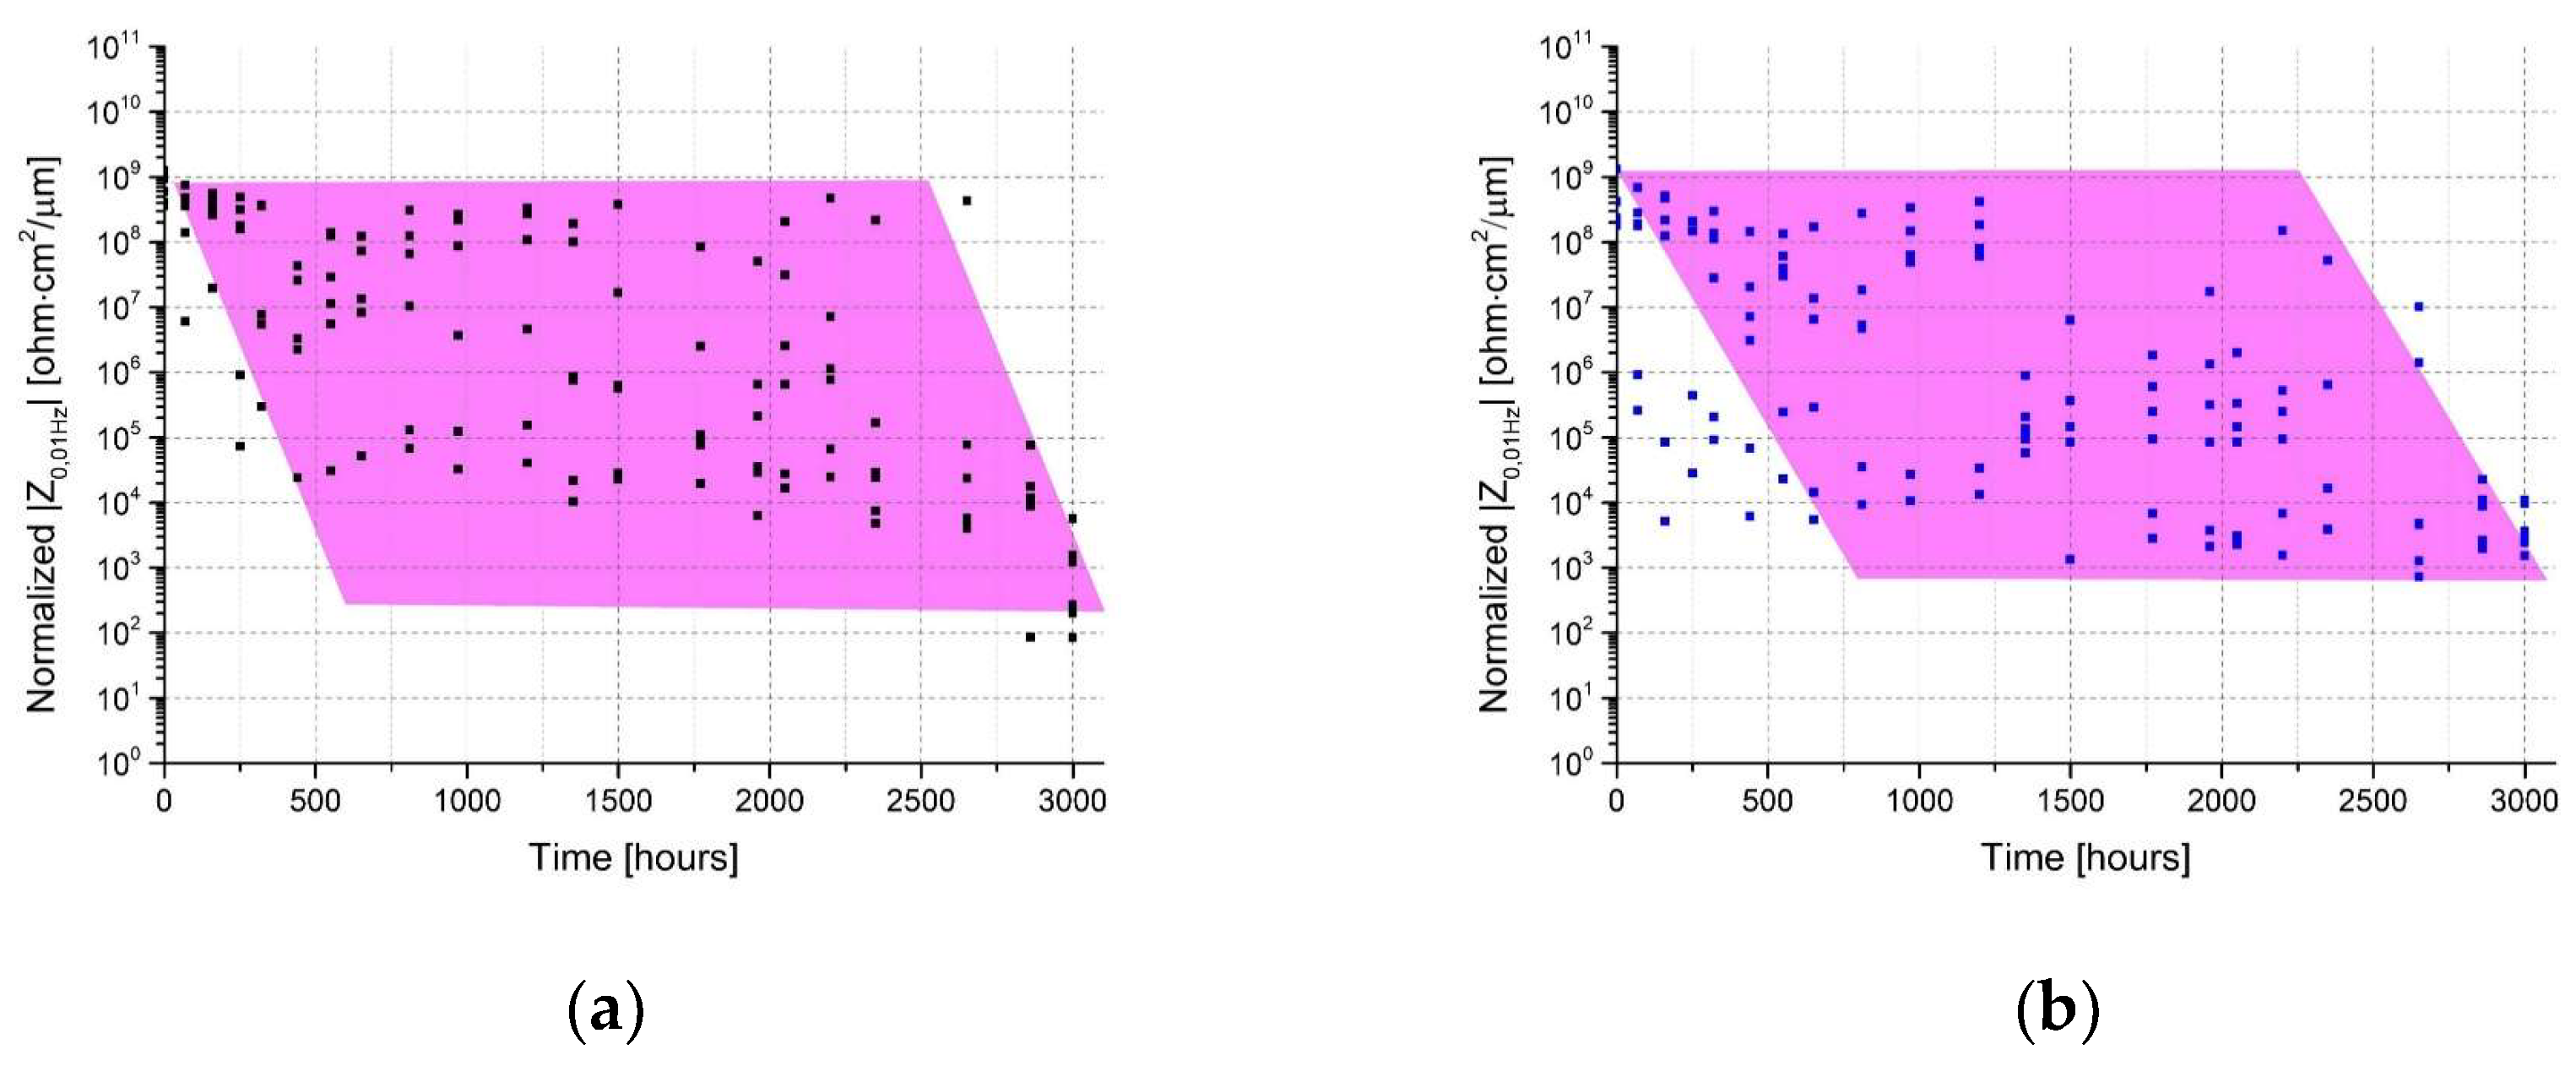
4.2. Correlation between |Z| and the Corrosion Development

Considering the experimental problems encountered in the analysis of EIS spectra when this type of spectra is collected, it is generally attractive to adopt a simplified approach based on the modulus of impedance at 0.01 Hz, as is very often the case in the literature [13,67,68,69]. The possibility of using a single parameter (obtained directly from the EIS spectra) for the rough estimation of the protective properties of the paint during aging has been exploited repeatedly by different authors. However, the experimental evidence reported in this work indicates a significant discrepancy between the measured |Z0.01Hz| values and the corrosion evolution of the undercoat. Figure 12 and Figure 13 show a direct comparison between the evolution of the |Z0.01Hz| values and the actual degradation state of the metal–paint interface during the prohesion test: the limitations of the reliability of the low-frequency impedance modulus to represent the protective properties of the coating are obvious. Similar results were obtained by other authors [49] combining adhesion tests (such as the pull-off test) and EIS [39,68]. However, adhesion is a parameter not directly related to impedance modulus, and high impedance does not always correspond to good metal–paint adhesion.
The corresponding EIS spectra for the samples shown in Figure 12 and Figure 13 are given in Appendix B. Note that despite the significant amount of corrosion and accumulation of hygroscopic corrosion products at the interface, the |Z0.01Hz| values do not fall below the threshold of 106 ohm∙cm2 [1,70,71] until around 3000 h of testing. At this point, the organic layer is severely damaged in some places and cracked by the volumetric expansion of the corrosion products. Although the use of the threshold value of 106 ohm∙cm2 to consider an organic coating as “protective” is questionable, many authors still assume this value as a reference. [36,41,72,73]
A particular challenge could also be the handling of a large number of replicates, which inevitably differ slightly in terms of water absorption profile, as shown by the experience of many studies published in the literature [4,40,51,52,65,74]. Some authors suggest performing five or more repeated EIS analyses and using dispersion plots [36] or reducing the data scatter by rigorous quality control of the painted surface. However, these approaches are not suitable for assessing the extent of degradation of real in-service structures by EIS.
In summary, we have reported an experimental campaign where the collected EIS spectra cannot be evaluated with a reliable EEC. Under these circumstances, or if a less detailed analysis of the EIS spectra is proposed, one solution would be to use the |Z0.01Hz| values for a rough description of the protective properties of the coatings studied. However, the experimental results suggest that when using |Z0.01Hz| values to describe the protective properties of a coating, a proper analysis of the metal–polymer interface (visual inspection or adhesion test) is required to avoid misleading conclusions.

5. Conclusions

In this paper, we report a case study in which the use of |Z0.01Hz| values to classify and describe the protective properties of organic coatings fails. Acrylic-coated carbon steel and HDG steel were exposed to NSST and the prohesion test chamber for up to 3000 h. The comparison between the |Z0.01Hz| value and visual inspection of corrosion product formation at the interface of the metal–paint interface shows the following results:
  • At least 5–6 samples are required to limit the effect of small defects and/or heterogeneities on the final results. A significant scatter in the EIS response of theoretically identical samples was observed;
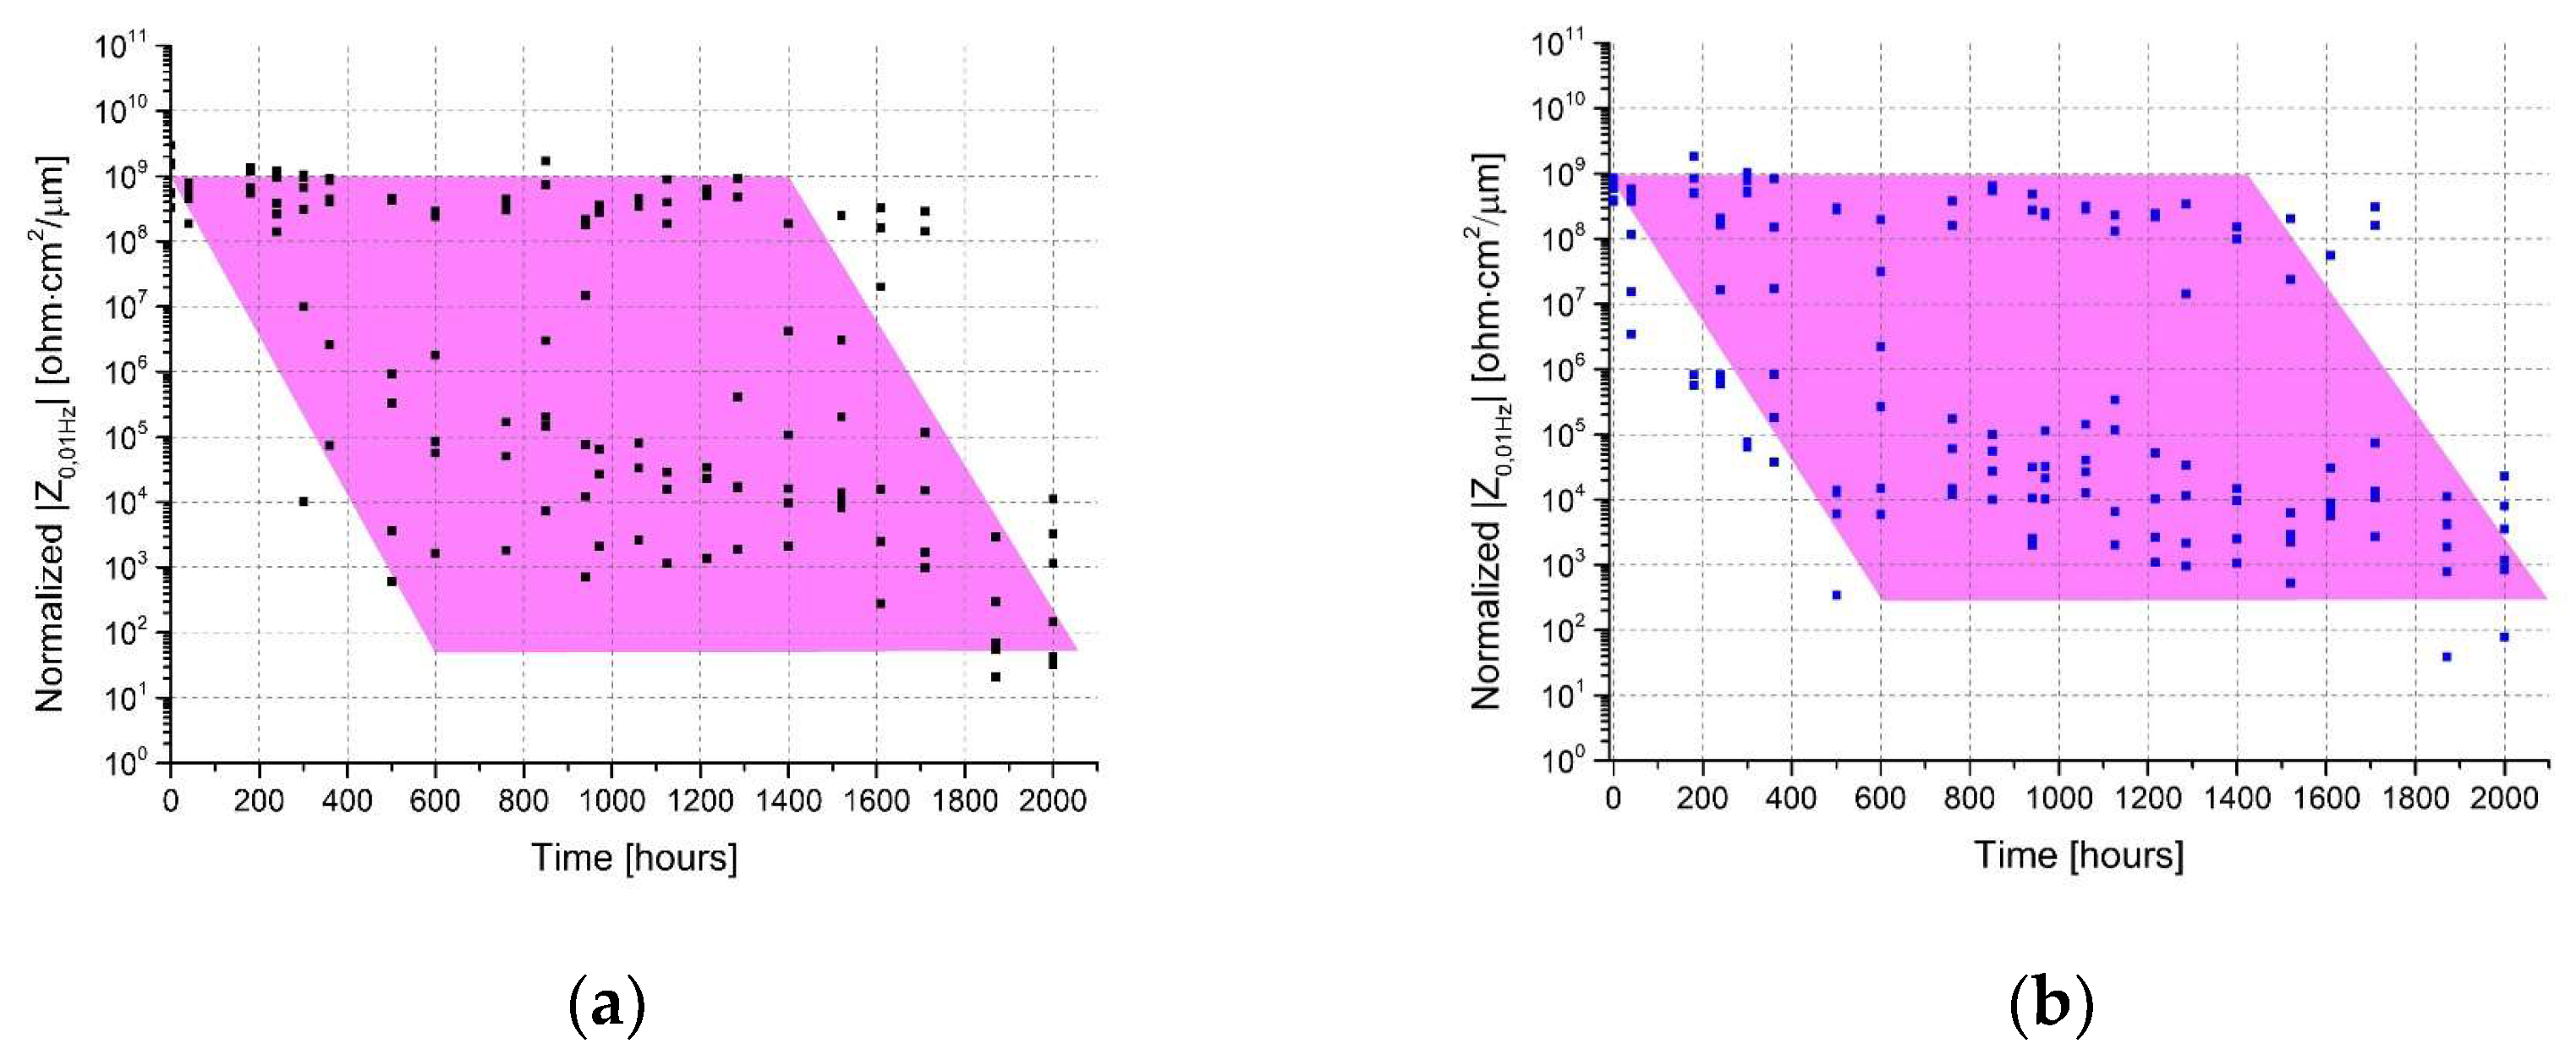
  • It has been shown that the |Z0.01Hz| values measured during the exposure time do not describe the actual protective properties of the organic coatings. Thanks to the transparency of the coatings, it was possible to detect the occurrence of significant and extensive corrosion processes under the paint when the EIS response |Z0.01Hz| provided values well above the thresholds generally accepted to assume an organic coating to be “protective” (e.g., 106 ohm∙cm2);
  • It should be noted that we have reported on one particular experimental campaign where the collected EIS spectra could not be analyzed with a reliable EEC. In these circumstances, or whenever a less detailed analysis of the EIS spectra is proposed, the solution often used in the literature is to use the |Z0.01Hz| values for a rough description of the protective properties of the coatings under investigation. The use of |Z0.01Hz| values requires a proper analysis of the metal–polymer interface (visual inspection or adhesion test) to avoid misleading conclusions. We believe that a comparison between the actual state of degradation observed by visual inspection and the physical parameters related to the Faradic process at the metal–electrolyte interface (such as charge transfer resistance and double-layer capacitance) would likely lead to consistent results;
  • In cases where it is not possible to apply nonlinear least-squares fit techniques to the raw EIS data sets, the |Z0.01Hz| values should be used with caution and coupled with additional investigation methods.

Author Contributions

Conceptualization, S.R., M.F. and A.C.; methodology, A.C., M.F. and S.R.; formal analysis, A.C.; data curation, A.C.; writing—original draft preparation, A.C.; writing—review and editing, A.C., M.F. and S.R.; supervision, M.F., F.D. and S.R.; project administration, S.R., M.F. and F.D. All authors have read and agreed to the published version of the manuscript.

Funding

This work was funded by AMPP-Italy (Grant No. 40103879).

Institutional Review Board Statement

Not applicable.

Informed Consent Statement

Not applicable.

Data Availability Statement

Not applicable.

Acknowledgments

The authors gratefully acknowledge AMPP Italy Chapter for the financial support provided for this research, In addition, the authors thank Liberty Steel Italy (Piombino Li, Italy) and Palini Vernici (Pisogne BS, Italy), for supplying the substrate and acrylic paint respectively.

Conflicts of Interest

The authors declare no conflict of interest.

Appendix A. Paint Thickness of the Measurement Areas

Table A1. Coating thickness for samples aged in NSST.
Paint Thickness
Sample
Steel
(µm)
HDG
(µm)
A171.861.9
A271.263.7
B172.567.6
B274.860.8
C17661.6
C275.865.6
Table A2. A1 Coating thickness for samples aged in the prohesion test.
Paint thickness
Sample
Steel
(µm)
HDG
(µm)
A172.866.2
A278.262.7
B177.871.4
B271.574.7
C170.868.8
C271.362.4

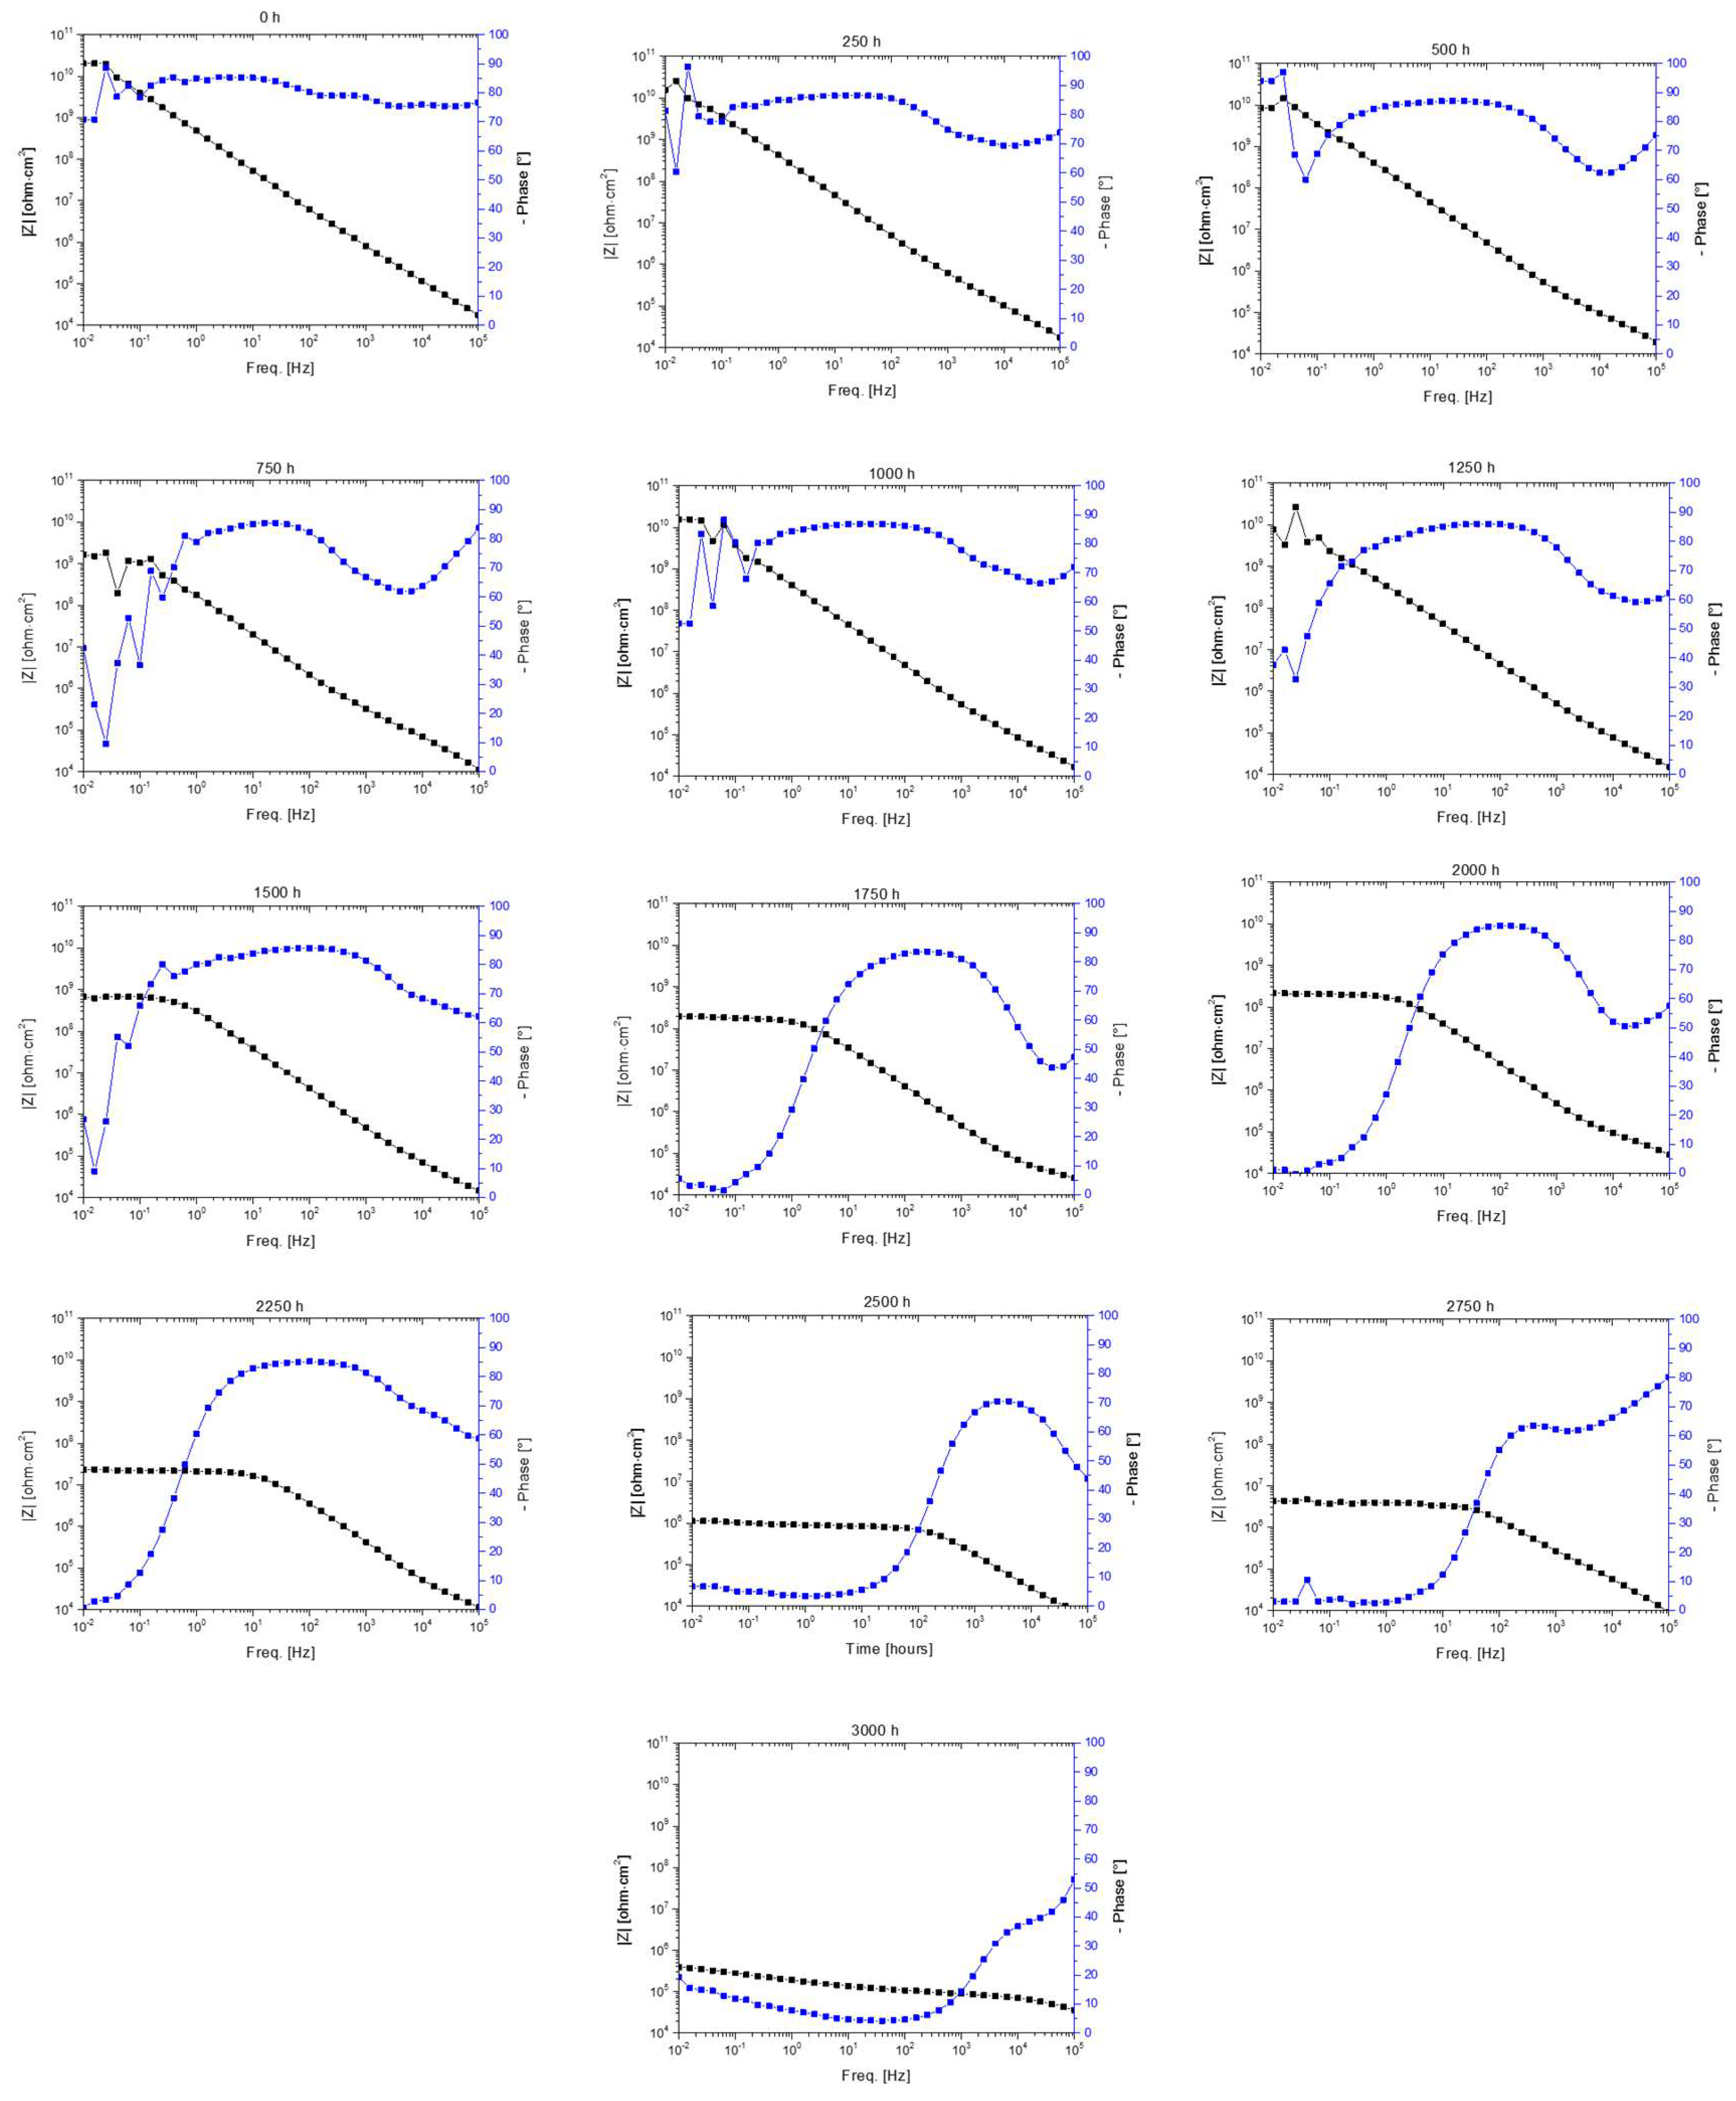
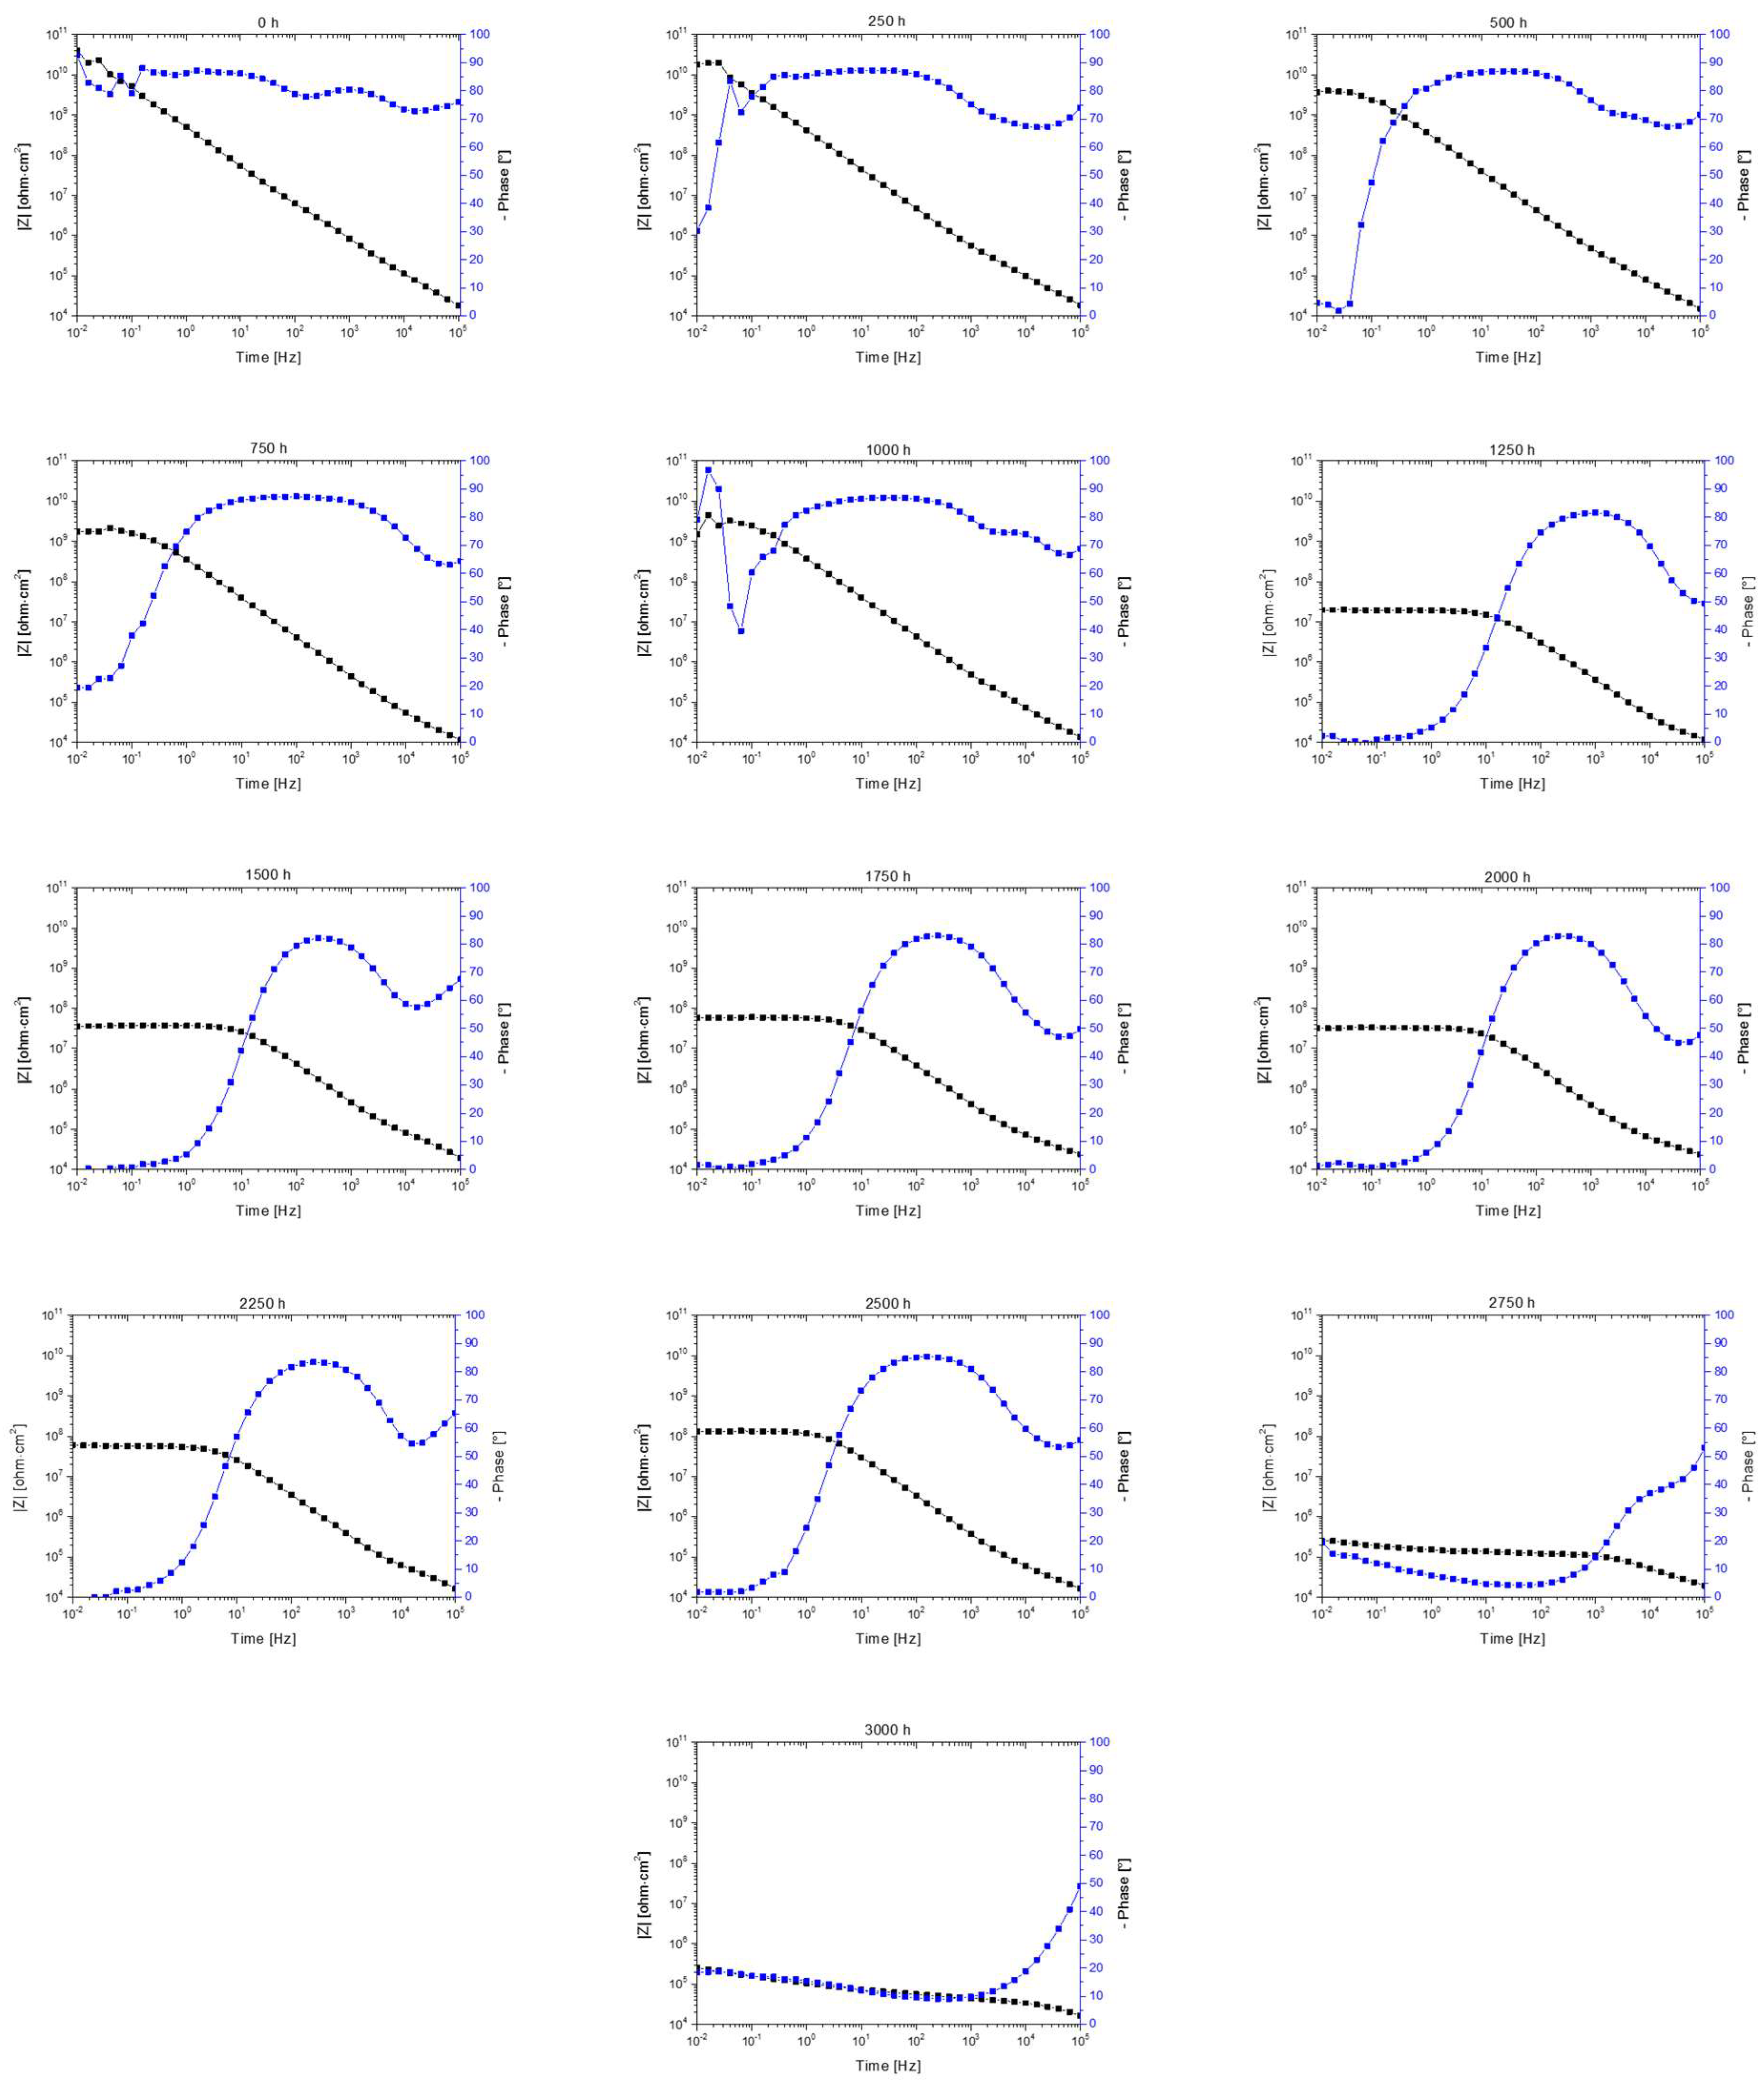
Appendix B. EIS Spectra at Different Aging Times during the Prohesion Test

Figure A1. EIS spectra of a painted steel sample at different aging times during the prohesion test.
Coatings 13 00598 g0a1
Figure A2. EIS spectra of a painted HDG steel sample at different aging times during the prohesion test.
Coatings 13 00598 g0a2

References

  1. Murray, J.N. Electrochemical Test Methods for Evaluating Organic Coatings on Metals: An Update. Part III: Multiple Test Parameter Measurements. Prog. Org. Coat. 1997, 31, 375–391. [Google Scholar] [CrossRef]
  2. Margarit-Mattos, I.C.P. EIS and Organic Coatings Performance: Revisiting Some Key Points. Electrochim. Acta 2020, 354, 136725. [Google Scholar] [CrossRef]
  3. Dornbusch, M.; Kirsch, S.; Henzel, C.; Deschamps, C.; Overmeyer, S.; Cox, K.; Wiedow, M.; Tromsdorf, U.; Dargatz, M.; Meisenburg, U. Characterization of the Water Uptake and Electrolyte Uptake of Organic Coatings and the Consequences by Means of Electrochemical Impedance Spectroscopy and UV–Vis Spectroscopy. Prog. Org. Coat. 2015, 89, 332–343. [Google Scholar] [CrossRef]
  4. Miszczyk, A.; Darowicki, K. Water Uptake in Protective Organic Coatings and Its Reflection in Measured Coating Impedance. Prog. Org. Coat. 2018, 124, 296–302. [Google Scholar] [CrossRef]
  5. Vosgien Lacombre, C.; Bouvet, G.; Trinh, D.; Mallarino, S.; Touzain, S. Effect of Pigment and Temperature onto Swelling and Water Uptake during Organic Coating Ageing. Prog. Org. Coat. 2018, 124, 249–255. [Google Scholar] [CrossRef]
  6. Deflorian, F.; Rossi, S. An EIS Study of Ion Diffusion through Organic Coatings. Electrochim. Acta 2006, 51, 1736–1744. [Google Scholar] [CrossRef]
  7. Duarte, R.G.; Castela, A.S.; Ferreira, M.G.S. A New Model for Estimation of Water Uptake of an Organic Coating by EIS: The Tortuosity Pore Model. Prog. Org. Coat. 2009, 65, 197–205. [Google Scholar] [CrossRef]
  8. Castela, A.S.L.; Simões, A.M.; Ferreira, M.G.S.E.I.S. Evaluation of Attached and Free Polymer Films. Prog. Org. Coat. 2000, 38, 1–7. [Google Scholar] [CrossRef]
  9. Mahdavi, F.; Forsyth, M.; Tan, M.Y.J. Techniques for Testing and Monitoring the Cathodic Disbondment of Organic Coatings: An Overview of Major Obstacles and Innovations. Prog. Org. Coat. 2017, 105, 163–175. [Google Scholar] [CrossRef]
  10. Deflorian, F.; Fedrizzi, L.; Rossi, S. Effects of Mechanical Deformation on the Protection Properties of Coil Coating Products. Corros. Sci. 2000, 42, 1283–1301. [Google Scholar] [CrossRef]
  11. Fredj, N.; Cohendoz, S.; Feaugas, X.; Touzain, S. Effect of Mechanical Stresses on Marine Organic Coating Ageing Approached by EIS Measurements. Prog. Org. Coat. 2011, 72, 260–268. [Google Scholar] [CrossRef]
  12. Alizadeh Razin, A.; Ramezanzadeh, B.; Yari, H. Detecting and Estimating the Extent of Automotive Coating Delamination and Damage Indexes after Stone Chipping Using Electrochemical Impedance Spectroscopy. Prog. Org. Coat. 2016, 92, 95–109. [Google Scholar] [CrossRef]
  13. Bierwagen, G.P.; Tallman, D.E. Choice and Measurement of Crucial Aircraft Coatings System Properties. Prog. Org. Coat. 2001, 41, 201–216. [Google Scholar] [CrossRef]
  14. Buchheit, R.G.; Cunningham, M.; Jensen, H.; Kendig, M.W.; Martinez, M.A. A Correlation between Salt Spray and Electrochemical Impedance Spectroscopy Test Results for Conversion-Coated Aluminum Alloys. Corrosion 1998, 54, 61–69. [Google Scholar] [CrossRef]
  15. Cambier, S.M.; Posner, R.; Frankel, G.S. Coating and Interface Degradation of Coated Steel, Part 1: Field Exposure. Electrochim. Acta 2014, 133, 30–39. [Google Scholar] [CrossRef]
  16. Mills, D.J.; Jamali, S.S. The Best Tests for Anti-Corrosive Paints. And Why: A Personal Viewpoint. Prog. Org. Coat. 2017, 102, 8–17. [Google Scholar] [CrossRef] [Green Version]
  17. ASTM B117-19; Standard Practice for Operating Salt Spray (Fog) Apparatus. ASTM International: West Conshohocken, PA, USA, 2019.
  18. ASTM G85-19; Standard Practice for Modified Salt Spray (Fog) Testing, ASTM International: West Conshohocken, PA, USA, 2019.
  19. ASTM B368-21; Standard Test Method for Copper-Accelerated Acetic Acid-Salt Spray (Fog) Testing (CASS Test). ASTM International: West Conshohocken, PA, USA, 2021.
  20. ASTM D1735-14; Standard Practice for Testing Water Resistance of Coatings Using Water Fog Apparatus. ASTM International: West Conshohocken, PA, USA, 2014.
  21. ASTM D2247-15(2020); Standard Practice for Testing Water Resistance of Coatings in 100% Relative Humidity. ASTM International: West Conshohocken, PA, USA, 2020.
  22. Singleton, R. Accelerated Corrosion Testing. Met. Finish. 2012, 110, 12–19. [Google Scholar] [CrossRef]
  23. Kiosidou, E.D.; Karantonis, A.; Sakalis, G.N.; Pantelis, D.I. Electrochemical Impedance Spectroscopy of Scribed Coated Steel after Salt Spray Testing. Corros. Sci. 2018, 137, 127–150. [Google Scholar] [CrossRef]
  24. Vosgien Lacombre, C.; Bouvet, G.; Trinh, D.; Mallarino, S.; Touzain, S. Water Uptake in Free Films and Coatings Using the Brasher and Kingsbury Equation: A Possible Explanation of the Different Values Obtained by Electrochemical Impedance Spectroscopy and Gravimetry. Electrochim. Acta 2017, 231, 162–170. [Google Scholar] [CrossRef]
  25. Jorcin, J.B.; Aragon, E.; Merlatti, C.; Pébère, N. Delaminated Areas beneath Organic Coating: A Local Electrochemical Impedance Approach. Corros. Sci. 2006, 48, 1779–1790. [Google Scholar] [CrossRef]
  26. Burduhos-Nergis, D.P.; Vasilescu, G.D.; Burduhos-Nergis, D.D.; Cimpoesu, R.; Bejinariu, C. Phosphate Coatings: EIS and SEM Applied to Evaluate the Corrosion Behavior of Steel in Fire Extinguishing Solution. Appl. Sci. 2021, 11, 7802. [Google Scholar] [CrossRef]
  27. Lu, F.; Song, B.; He, P.; Wang, Z.; Wang, J. Electrochemical Impedance Spectroscopy (EIS) Study on the Degradation of Acrylic Polyurethane Coatings. RSC Adv. 2017, 7, 13742. [Google Scholar] [CrossRef] [Green Version]
  28. Mahdavi, F.; Tan, M.Y.J.; Forsyth, M. Electrochemical Impedance Spectroscopy as a Tool to Measure Cathodic Disbondment on Coated Steel Surfaces: Capabilities and Limitations. Prog. Org. Coat. 2015, 88, 23–31. [Google Scholar] [CrossRef]
  29. Sharer Sahir, Z.; Sykes, J.M. Effect of Temperature on the Impedance Response of Coated Metals. Prog. Org. Coat. 2014, 77, 2039–2044. [Google Scholar] [CrossRef]
  30. Touzain, S.; Thu, Q.L.; Bonnet, G. Evaluation of Thick Organic Coatings Degradation in Seawater Using Cathodic Protection and Thermally Accelerated Tests. Prog. Org. Coat. 2005, 52, 311–319. [Google Scholar] [CrossRef]
  31. Fedrizzi, L.; Bergo, A.; Deflorian, F.; Valentinelli, L. Assessment of Protective Properties of Organic Coatings by Thermal Cycling. Prog. Org. Coat. 2003, 48, 271–280. [Google Scholar] [CrossRef]
  32. Upadhyay, V.; Battocchi, D. Exploring the Combined Effect of DC Polarization and High Temperature Exposure on the Barrier Properties of Organic Coatings. Prog. Org. Coat. 2017, 110, 42–46. [Google Scholar] [CrossRef]
  33. Touzain, S. Some Comments on the Use of the EIS Phase Angle to Evaluate Organic Coating Degradation. Electrochim. Acta 2010, 55, 6190–6194. [Google Scholar] [CrossRef]
  34. Jaśniok, T.; Jaśniok, M.; Skórkowski, A. Diagnostics of Large Non-Conductive Anti-Corrosion Coatings on Steel Structures by Means of Electrochemical Impedance Spectroscopy. Materials 2021, 14, 3959. [Google Scholar] [CrossRef] [PubMed]
  35. Murray, J.N.; Hack, H.P. In Proceedings of the 12th International Corrosion Congress, Houston, TX, USA, 19–24 September 1993; p. 151.
  36. Amirudin, A.; Thierry, D. Application of Electrochemical Impedance Spectroscopy to Study the Degradation of Polymer-Coated Metals. Prog. Org. Coat. 1995, 26, 1–28. [Google Scholar] [CrossRef]
  37. Fedrizzi, L.; Bergo, A.; Fanicchia, M. Evaluation of Accelerated Aging Procedures of Painted Galvanised Steels by EIS. Electrochim. Acta 2006, 51, 1864–1872. [Google Scholar] [CrossRef]
  38. Allahar, K.N.; Upadhyay, V.; Bierwagen, G.P.; Gelling, V.J. Monitoring of a Military Vehicle Coating under Prohesion Exposure by Embedded Sensors. Prog. Org. Coat. 2009, 65, 142–151. [Google Scholar] [CrossRef]
  39. Hinderliter, B.R.; Croll, S.G.; Tallman, D.E.; Su, Q.; Bierwagen, G.P. Interpretation of EIS Data from Accelerated Exposure of Coated Metals Based on Modeling of Coating Physical Properties. Electrochim. Acta 2006, 51, 4505–4515. [Google Scholar] [CrossRef]
  40. Nguyen, A.S.; Causse, N.; Musiani, M.; Orazem, M.E.; Pébère, N.; Tribollet, B.; Vivier, V. Determination of Water Uptake in Organic Coatings Deposited on 2024 Aluminium Alloy: Comparison between Impedance Measurements and Gravimetry. Prog. Org. Coat. 2017, 112, 93–100. [Google Scholar] [CrossRef] [Green Version]
  41. Rossi, S.; Deflorian, F.; Fontanari, L.; Cambruzzi, A.; Bonora, P.L. Electrochemical Measurements to Evaluate the Damage Due to Abrasion on Organic Protective System. Prog. Org. Coat. 2005, 52, 288–297. [Google Scholar] [CrossRef]
  42. Rammelt, U.; Reinhard, G. Application of Electrochemical Impedance Spectroscopy (EIS) for Characterizing the Corrosion-Protective Performance of Organic Coatings on Metals. Prog. Org. Coat. 1992, 21, 205–226. [Google Scholar] [CrossRef]
  43. Tait, W.S. Using Electrochemical Measurements to Estimate Coating and Polymer Film DurabiIity. J. Coat. Technol. 2003, 75, 45–50. [Google Scholar] [CrossRef]
  44. Kunce, I.; Królikowska, A.; Komorowski, L. Accelerated Corrosion Tests in Quality Labels for Powder Coatings on Galvanized Steel—Comparison of Requirements and Experimental Evaluation. Materials 2021, 14, 6547. [Google Scholar] [CrossRef]
  45. Yang, X.F.; Li, J.; Croll, S.G.; Tallman, D.E.; Bierwagen, G.P. Degradation of Low Gloss Polyurethane Aircraft Coatings under UV and Prohesion Alternating Exposures. Polym. Degrad. Stab. 2003, 80, 51–58. [Google Scholar] [CrossRef]
  46. Yu, M.; Fan, C.; Ge, F.; Lu, Q.; Wang, X.; Cui, Z. Anticorrosion Behavior of Organic Offshore Coating Systems in UV, Salt Spray and Low Temperature Alternation Simulated Arctic Offshore Environment. Mater. Today Commun. 2021, 28, 102545. [Google Scholar] [CrossRef]
  47. Yang, M.S.; Huang, J.; Chen, J.; Noël, J.J.; Barker, I.; Henderson, J.D.; He, P.; Zhang, H.; Zhang, H.; Zhu, J. A Comparative Study on the Anti-Corrosive Performance of Zinc Phosphate in Powder Coatings. Coatings 2022, 12, 217. [Google Scholar] [CrossRef]
  48. UNI 10346:2015; Continuously Hot-Dip Coated Steel Flat Products for Cold Forming—Technical Delivery Conditions. Ente Italiano di Normazione:: Milano, Italy, 2015.
  49. ASTM D4541-17; Standard Test Method for Pull-Off Strength of Coatings Using Portable Adhesion Testers. ASTM International: West Conshohocken, PA, USA, 2017.
  50. ASTM D1193-06(2018); Standard Specification for Reagent Water. ASTM International: West Conshohocken, PA, USA, 2018.
  51. Bouvet, G.; Nguyen, D.D.; Mallarino, S.; Touzain, S. Analysis of the Non-Ideal Capacitive Behaviour for High Impedance Organic Coatings. Prog. Org. Coat. 2014, 77, 2045–2053. [Google Scholar] [CrossRef]
  52. Martinez, S.; Šoić, I.; Špada, V. Unified Equivalent Circuit of Dielectric Permittivity and Porous Coating Formalisms for EIS Probing of Thick Industrial Grade Coatings. Prog. Org. Coat. 2021, 153, 106155. [Google Scholar] [CrossRef]
  53. Strunz, W.; Schiller, C.A.; Vogelsang, J. The Change of Dielectric Properties of Barrier Coatings during the Initial State of Immersion. Mater. Corros. 2008, 59, 159–166. [Google Scholar] [CrossRef]
  54. Mansfeld, F.; Xiao, H.; Han, L.T.; Lee, C.C. Electrochemical Impedance and Noise Data for Polymer Coated Steel Exposed at Remote Marine Test Sites. Prog. Org. Coat. 1997, 30, 89–100. [Google Scholar] [CrossRef]
  55. Trentin, A.; Pakseresht, A.; Duran, A.; Castro, Y.; Galusek, D. Electrochemical Characterization of Polymeric Coatings for Corrosion Protection: A Review of Advances and Perspectives. Polymers 2022, 14, 2306. [Google Scholar] [CrossRef]
  56. Ammar, S.; Ramesh, K.; Ma, I.A.W.; Farah, Z.; Vengadaesvaran, B.; Ramesh, S.; Arof, A.K. Studies on SiO2-Hybrid Polymeric Nanocomposite Coatings with Superior Corrosion Protection and Hydrophobicity. Surf. Coat. Technol. 2017, 324, 536–545. [Google Scholar] [CrossRef]
  57. Vlasak, R.; Klueppel, I.; Grundmeier, G. Combined EIS and FTIR–ATR study of water uptake and diffusion in polymer films on semiconducting electrodes. Electrochim. Acta 2007, 52, 8075–8080. [Google Scholar] [CrossRef]
  58. Tan, B.; Fu, A.; Guo, L.; Ran, Y.; Xiong, J.; Marzouki, R.; Li, W. Insight into Anti-Corrosion Mechanism of Dalbergia Odorifera Leaves Extract as a Biodegradable Inhibitor for X70 Steel in Sulfuric Acid Medium. Ind. Crops Prod. 2023, 194, 116106. [Google Scholar] [CrossRef]
  59. Schuurkes, J.A.A.R.; Elbers, M.A.; Gudden, J.J.F.; Roelofs, J.G.M. Effects of simulated ammonium sulphate and sulphuric acid rain on acidification, water quality and flora of small-scale soft water systems. Aquat. Bot. 1987, 28, 199–226. [Google Scholar] [CrossRef]
  60. Floyd, F.L.; Avudaiappan, S.; Gibson, J.; Mehta, B.; Smith, P.; Provder, T.; Escarsega, J. Using Electrochemical Impedance Spectroscopy to Predict the Corrosion Resistance of Unexposed Coated Metal Panels. Prog. Org. Coat. 2009, 66, 8–34. [Google Scholar] [CrossRef]
  61. Murray, J.N.; Ruedisueli, R.L. Testing Issues for Coatings for In-Service Marine Immersion Applications. In Proceedings of the CORROSION 2005, Houston, TX, USA, 3–7 April 2005. [Google Scholar]
  62. Tait, W.S.; Handrich, K.A.; Tait, S.W.; Martin, J.W. Analyzing and Interpreting Electrochemical Impedance Spectroscopy Data from Internally Coated Steel Aerosol Containers; Standard Technical Publication; ASTM: Philadelphia, PA, USA, 1993. [Google Scholar]
  63. Mansfeld, F. Models for the Impedance Behavior of Protective Coatings and Cases of Localized Corrosion. Electrochim. Acta 1993, 38, 1891–1897. [Google Scholar] [CrossRef]
  64. Martin, J.W.; Saunders, S.C.; Floyd, F.L.; Wineburg, J.P. Methodologies for Predicting the Service Lives of Coatings Systems; FSCT Series on Coatings Technology (Booklet); DIANE Publishing: Blue Bell, PA, USA, 1996; p. 34. [Google Scholar]
  65. Amand, S.; Musiani, M.; Orazem, M.E.; Pébère, N.; Tribollet, B.; Vivier, V. Constant-Phase-Element Behavior Caused by Inhomogeneous Water Uptake in Anti-Corrosion Coatings. Electrochim. Acta 2013, 87, 693–700. [Google Scholar] [CrossRef] [Green Version]
  66. Alsamuraee, A.; Jaafer, H. Electrochemical Impedance Spectroscopic Evaluation of Corrosion Protection Properties of Polyurethane /Polyvinyl Chloride Blend Coatings on Steel. Am. J. Sci. Ind. Res. 2011, 2, 761–768. [Google Scholar] [CrossRef]
  67. Hu, J.; Li, X.; Gao, J.; Zhao, Q. Ageing Behavior of Acrylic Polyurethane Varnish Coating in Artificial Weathering Environments. Prog. Org. Coat. 2009, 65, 504–509. [Google Scholar] [CrossRef]
  68. Bierwagen, G.; Li, J.; He, L.; Tallman, D. Fundamentals of the Measurement of Corrosion Protection and the Prediction of Its Lifetime in Organic Coatings. ACS Symp. Ser. 2002, 805, 316–350. [Google Scholar] [CrossRef]
  69. Kuwano, E.; Fujitani, T.; Satoh, T. A new approach to the anti-corrosion function of coatings. In Proceedings of the International Symposium on Advances in Corrosion Protection by Organic Coatings 1997, Noda, Japan, 29–31 October 1997. [Google Scholar]
  70. Murray, J.N. Electrochemical Test Methods for Evaluating Organic Coatings on Metals: An update. Part II: Mul-tiple test parameter measurements. Prog. Org. Coat. 1997, 31, 255–264. [Google Scholar] [CrossRef]
  71. Lasia, A. Electrochemical Impedance Spectroscopy and its Applications, 1st ed.; Springer: New York, NY, USA, 2017; pp. 257–261. [Google Scholar]
  72. Bacon, R.C.; Smith, J.J.; Rugg, F.M. Electrolytic resistance in evaluating protective merit of coatings on metals. Ind. Eng. Chem. 1948, 40, 161. [Google Scholar] [CrossRef]
  73. Wirth, J.K. The testing of iron corrosion under protecting films. Chem. Fabrik 1938, 11, 455. [Google Scholar]
  74. Cattarin, S.; Comisso, N.; Musiani, M.; Tribollet, B. The Impedance of an Electrode Coated by a Resistive Film with a Graded Thickness. Electrochem. Solid-State Lett. 2008, 11, 27–30. [Google Scholar] [CrossRef]
Figure 1. Example of impedance modulus (a) and phase angle (b) evolution in time for painted steel during NSST.
Coatings 13 00598 g001
Figure 2. Example of impedance modulus (a) and phase angle (b) evolution in time for painted HDG steel during NSST.
Coatings 13 00598 g002
Figure 3. Impedance modulus at low frequencies (0.01 Hz) of painted steel (a) and HDG steel (b) samples vs. aging time in NSST.
Coatings 13 00598 g003
Figure 4. State of damage of painted steel samples after 0, 500, 1000, 1500, and 2000 h of NSST.
Coatings 13 00598 g004
Figure 5. State of damage of painted HDG steel samples after 0, 500, 1000, 1500, and 2000 h of NSST.
Coatings 13 00598 g005
Figure 6. Example of impedance modulus (a) and phase angle (b) evolution in time for painted steel during the prohesion test.
Coatings 13 00598 g006
Figure 7. Example of impedance modulus (a) and phase angle (b) evolution in time for painted HDG steel during the prohesion test.
Coatings 13 00598 g007
Figure 8. Impedance modulus at low frequencies (0.01 Hz) of painted steel (a) and HDG steel (b) samples vs. aging time in the prohesion test.
Coatings 13 00598 g008
Figure 9. State of damage of painted steel samples after 0, 500, 1000, 1500, 2000, 2500, and 3000 h of the prohesion test.
Coatings 13 00598 g009
Figure 10. State of damage of painted HDG steel samples after 0, 500, 1000, 1500, 2000, 2500, and 3000 h of the prohesion.
Coatings 13 00598 g010
Figure 11. Example of the impedance modulus plot for a painted steel sample characterized by a minimum at high frequencies.
Coatings 13 00598 g011
Figure 12. Example of impedance modulus evolution in time and the corresponding corrosion evolution during the prohesion test for painted steel.
Coatings 13 00598 g012
Figure 13. Example of impedance modulus evolution in time and the corresponding corrosion evolution during the prohesion test for painted HDG steel.
Coatings 13 00598 g013
Disclaimer/Publisher’s Note: The statements, opinions and data contained in all publications are solely those of the individual author(s) and contributor(s) and not of MDPI and/or the editor(s). MDPI and/or the editor(s) disclaim responsibility for any injury to people or property resulting from any ideas, methods, instructions or products referred to in the content.

