
Thermal, Structural, Morphological and Electrical Characterization of Cerium-Containing 45S5 for Metal Implant Coatings

 ,
,  ,
,  ,
,  and
and 
Abstract
1. Introduction
2. Materials and Methods
2.1. Synthesis Method
2.2. Thermal Analysis
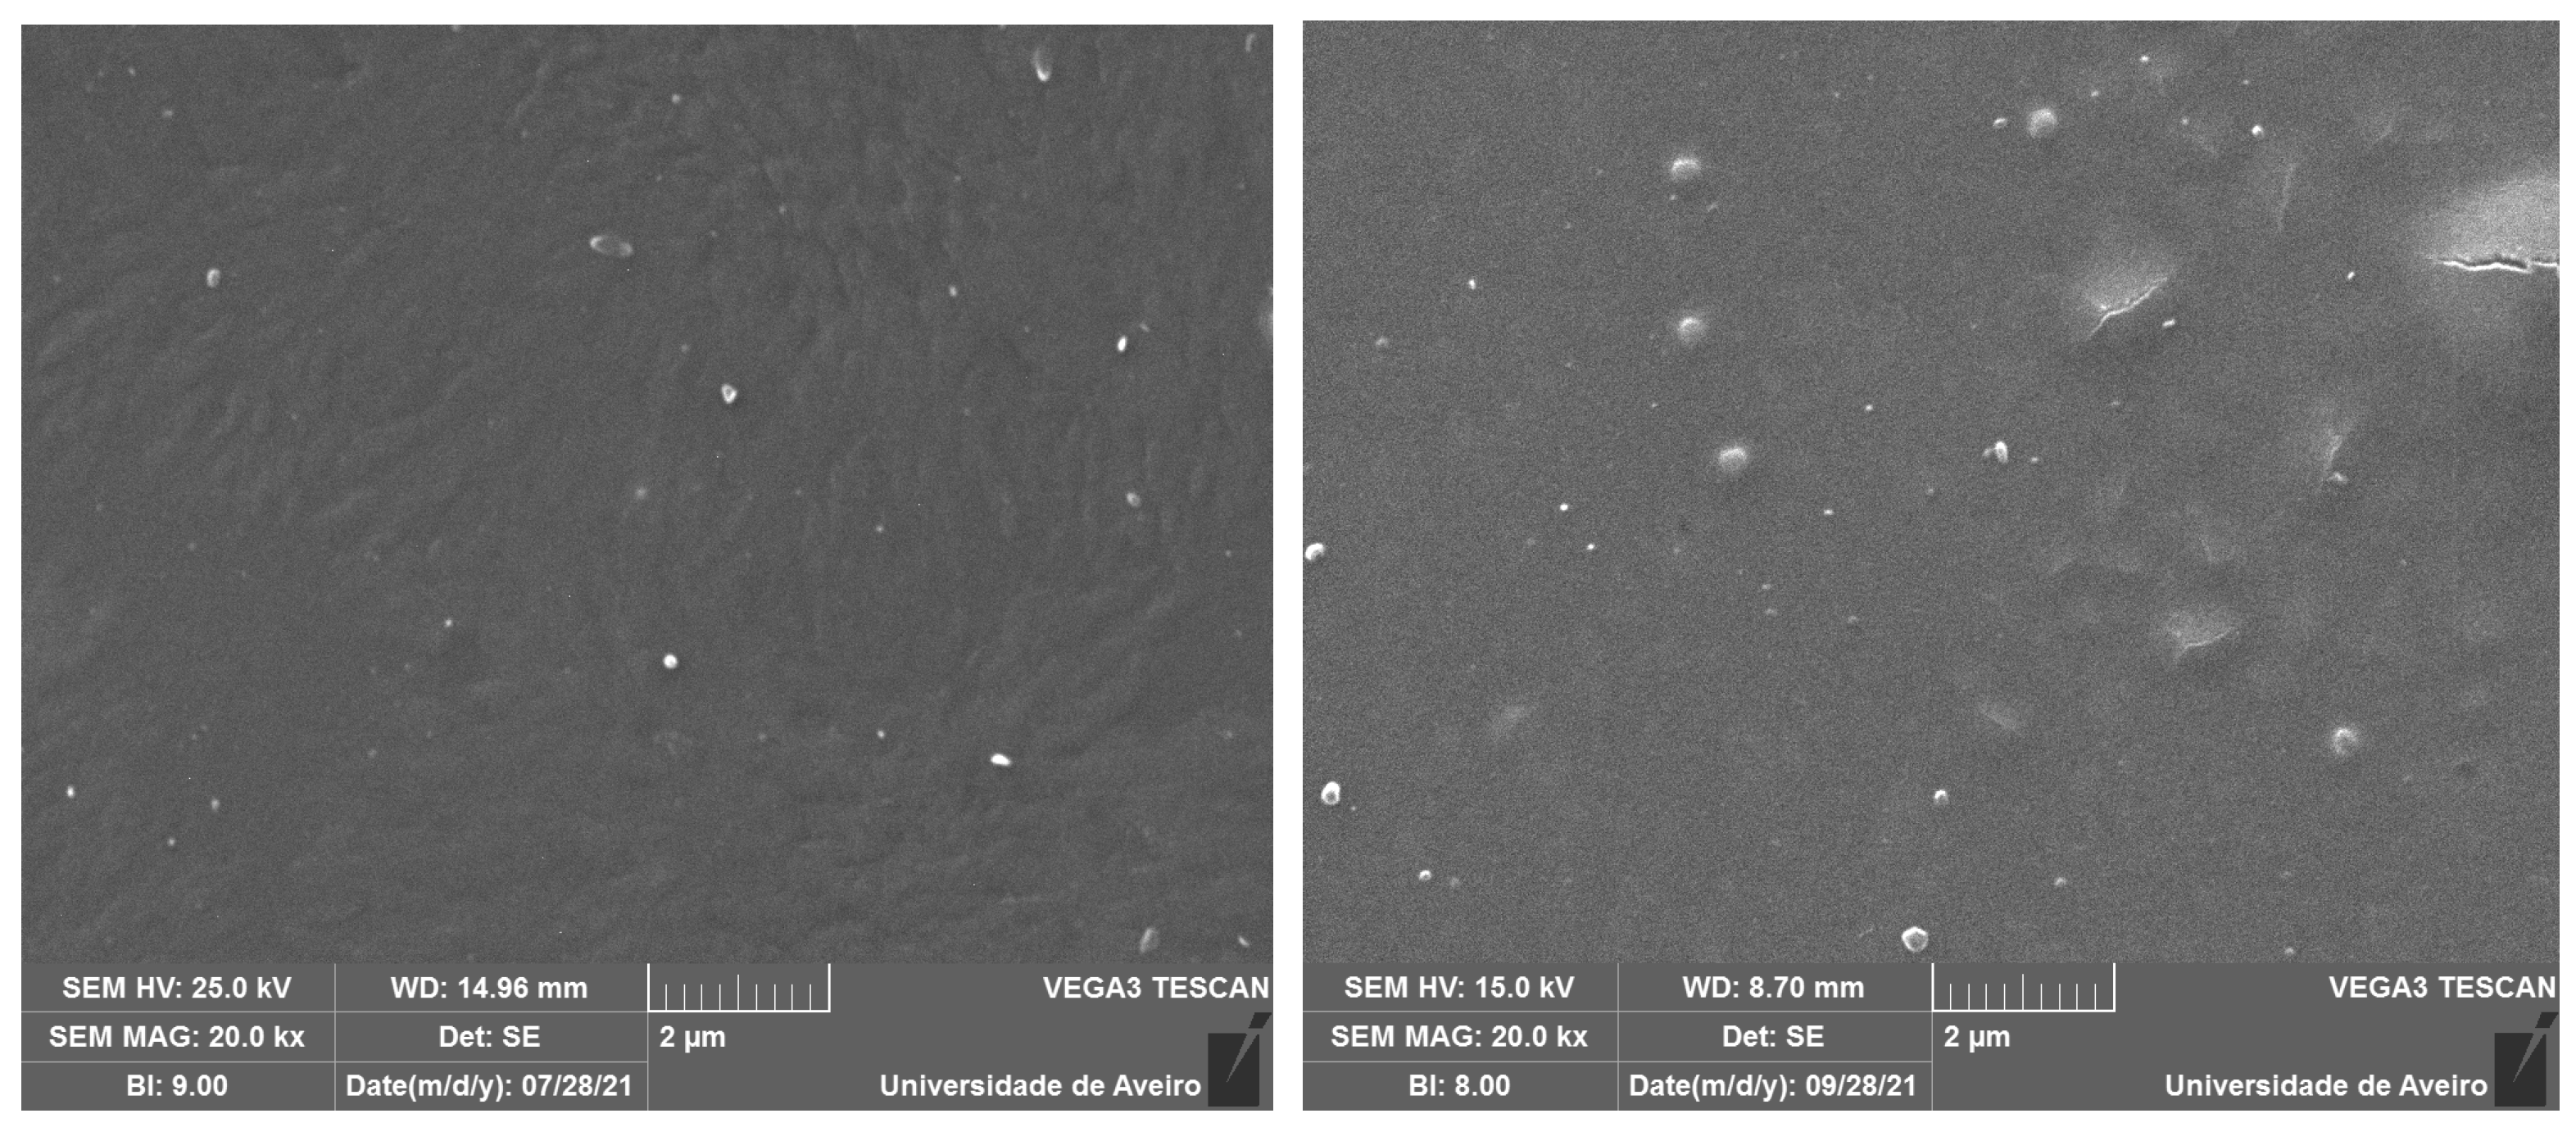
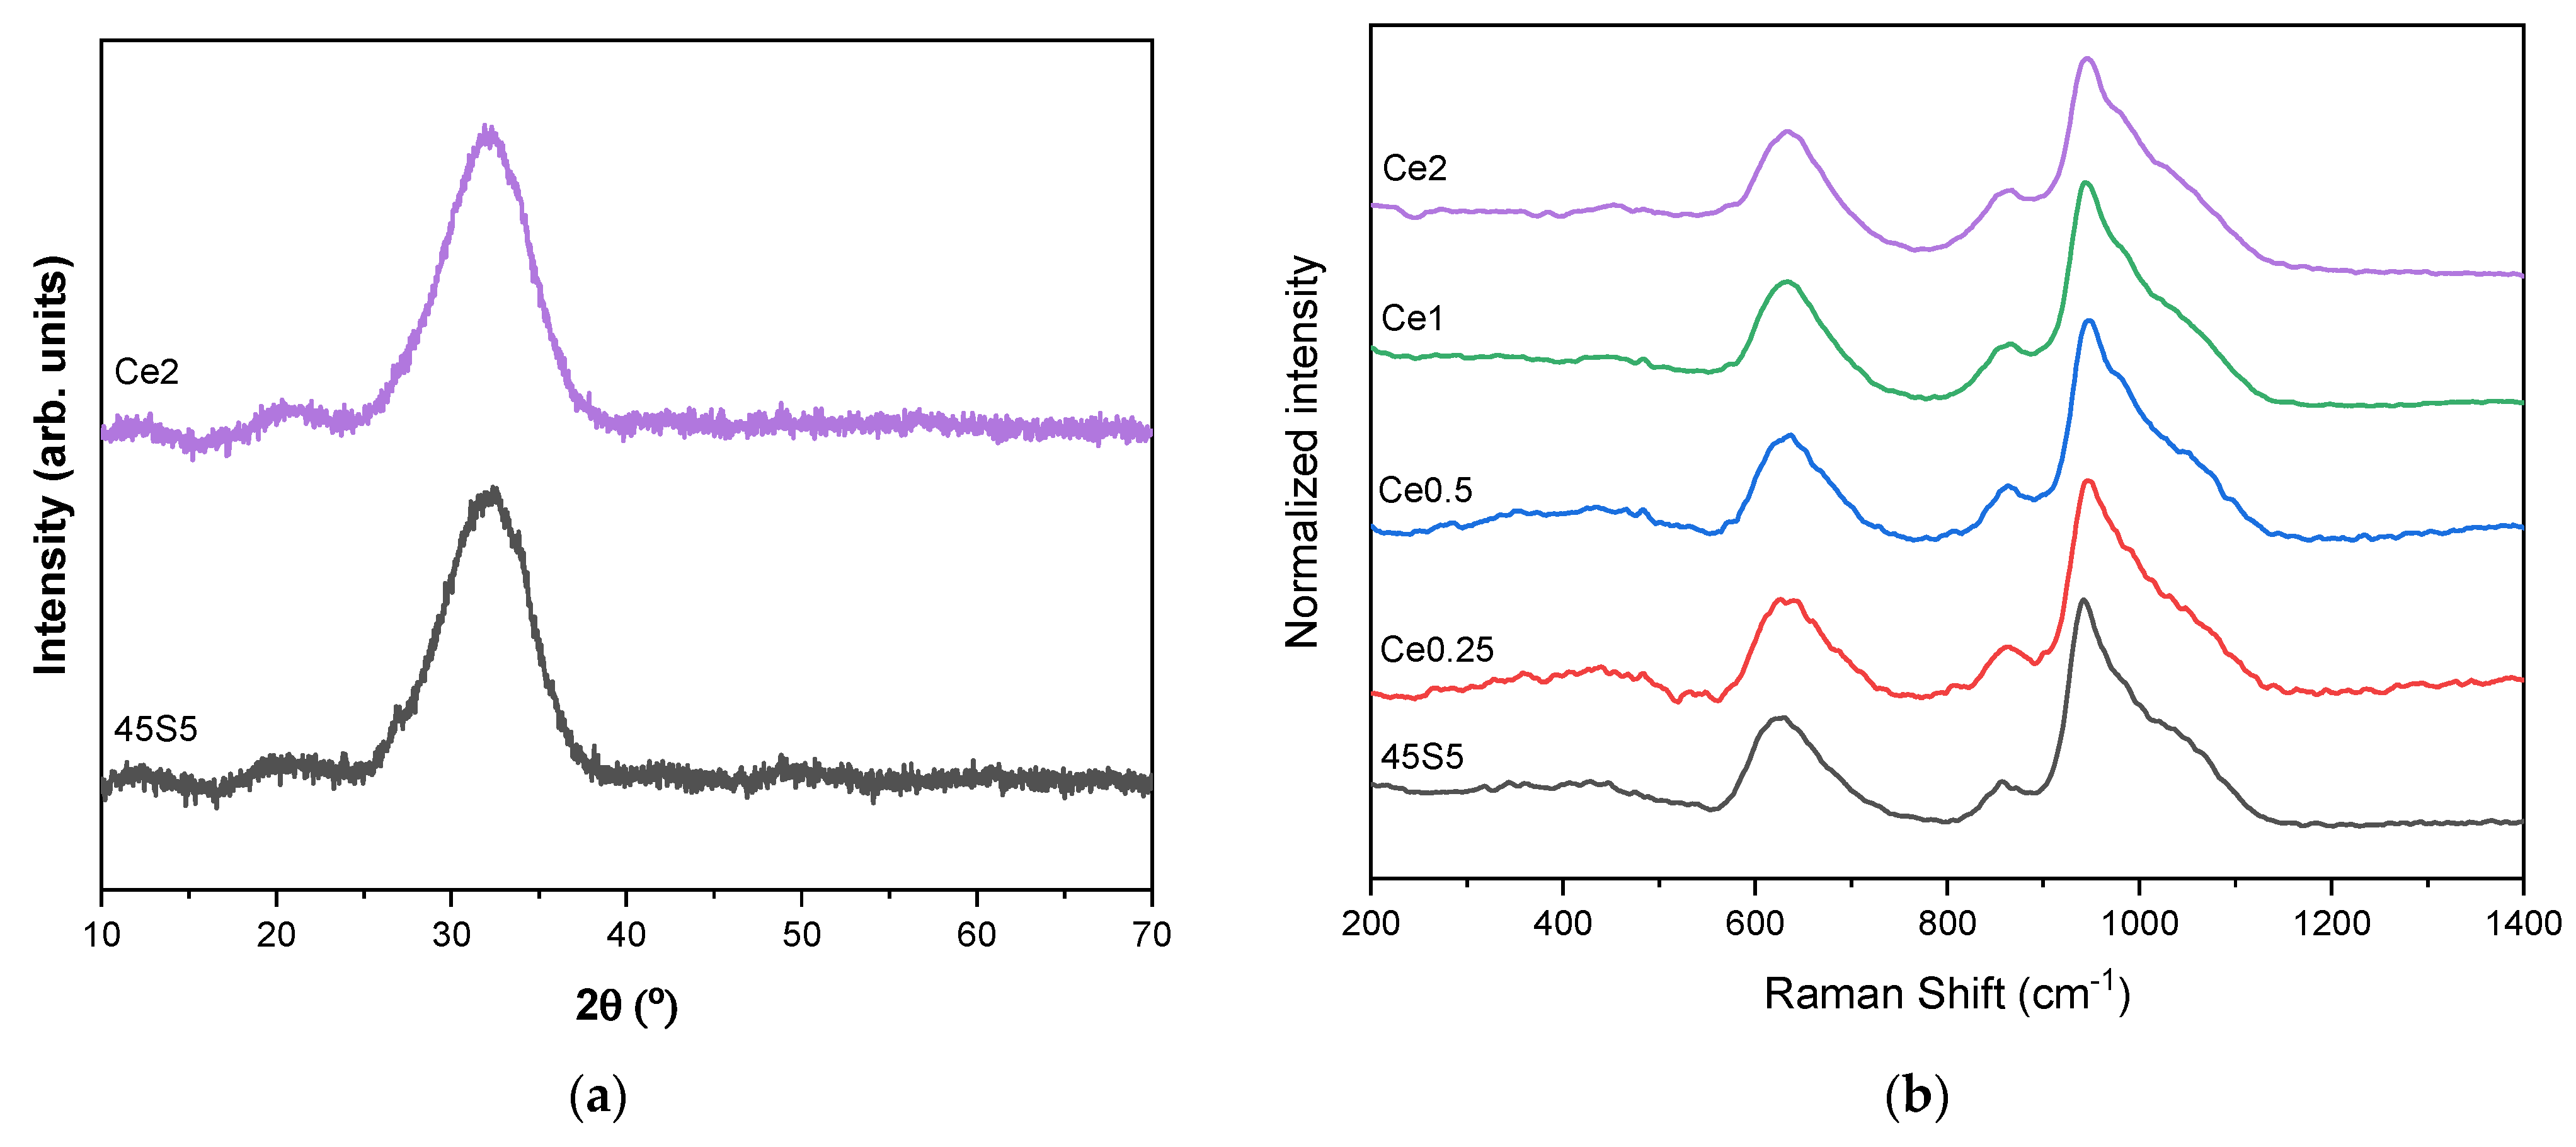
2.3. Morphological and Structural Characterization
2.4. Electrical Characterization
3. Results and Discussion
4. Conclusions
Author Contributions
Funding
Institutional Review Board Statement
Informed Consent Statement
Data Availability Statement
Acknowledgments
Conflicts of Interest
References
- Lung, C.Y.K.; Abdalla, M.M.; Chu, C.H.; Yin, I.; Got, S.R.; Matinlinna, J.P. A multi-element-doped porous bioactive glass coating for implant applications. Materials 2021, 14, 961. [Google Scholar] [CrossRef] [PubMed]
- Sergi, R.; Bellucci, D.; Cannillo, V. A comprehensive review of bioactive glass coatings: State of the art, challenges and future perspectives. Coatings 2020, 10, 757. [Google Scholar] [CrossRef]
- Iviglia, G.; Kargozar, S. Biomaterials, Current Strategies, and Novel Nano-Technological Approaches for Periodontal Regeneration. J. Funct. Biomater. 2019, 10, 3. [Google Scholar] [CrossRef]
- Hench, L.L. The story of Bioglass®. J. Mater. Sci. Mater. Med. 2006, 17, 967–978. [Google Scholar] [CrossRef] [PubMed]
- Joy-anne, N.O.; Su, Y.; Lu, X.; Kuo, P.H.; Du, J.; Zhu, D. Bioactive glass coatings on metallic implants for biomedical applications. Bioact. Mater. 2019, 4, 261–270. [Google Scholar] [CrossRef]
- Kermani, F.; Vojdani-Saghir, A.; Mollazadeh Beidokhti, S.; Nazarnezhad, S.; Mollaei, Z.; Hamzehlou, S.; El-Fiqi, A.; Baino, F.; Kargozar, S. Iron (Fe)-doped mesoporous 45S5 bioactive glasses: Implications for cancer therapy. Transl. Oncol. 2022, 20, 101397. [Google Scholar] [CrossRef]
- Xu, C.; Qu, X. Cerium oxide nanoparticle: A remarkably versatile rare earth nanomaterial for biological applications. NPG Asia Mater. 2014, 6, e90. [Google Scholar] [CrossRef]
- Fan, M.; Liu, W.; Fan, C.; Zheng, X.; Hui, J.; Hu, C.; Fan, D. Ce and Se co-doped MBG/SA/HLC microgel bone powder for repairing tumor bone defects. Nano Res. 2022, 16, 746–756. [Google Scholar] [CrossRef]
- Hammouda, H.F.; Farag, M.M.; El Deftar, M.M.F.; Abdel-Gabbar, M.; Mohamed, B.M. Ce-doped Nanobioactive Glass/Collagen/Chitosan Composite Scaffolds: Biocompatibility with Normal Rabbit’s Osteoblast Cells and Anticancer Activity Test. Adv. Anim. Vet. Sci. 2022, 10, 712–724. [Google Scholar] [CrossRef]
- Lord, M.S.; Berret, J.F.; Singh, S.; Vinu, A.; Karakoti, A.S. Redox Active Cerium Oxide Nanoparticles: Current Status and Burning Issues. Small 2021, 17, 2102342. [Google Scholar] [CrossRef]
- Gavinho, S.R.; Pádua, A.S.; Sá-Nogueira, I.; Silva, J.C.; Borges, J.P.; Costa, L.C.; Graça, M.P.F. Biocompatibility, Bioactivity, and Antibacterial Behaviour of Cerium-Containing Bioglass®. Nanomaterials 2022, 12, 4479. [Google Scholar] [CrossRef] [PubMed]
- Anesi, A.; Malavasi, G.; Chiarini, L.; Salvatori, R.; Lusvardi, G. Cell proliferation to evaluate preliminarily the presence of enduring self-regenerative antioxidant activity in cerium doped bioactive glasses. Materials 2020, 13, 2297. [Google Scholar] [CrossRef] [PubMed]
- Malavasi, G.; Salvatori, R.; Zambon, A.; Lusvardi, G.; Rigamonti, L.; Chiarini, L.; Anesi, A. Cytocompatibility of potential bioactive cerium-doped glasses based on 45S5. Materials 2019, 12, 594. [Google Scholar] [CrossRef]
- Raimondi, S.; Zambon, A.; Ranieri, R.; Fraulini, F.; Amaretti, A.; Rossi, M.; Lusvardi, G. Investigation on the antimicrobial properties of cerium-doped bioactive glasses. J. Biomed. Mater. Res. Part A 2021, 110, 504–508. [Google Scholar] [CrossRef]
- Amaldoss, M.J.N.; Mehmood, R.; Yang, J.-L.; Koshy, P.; Kumar, N.; Unnikrishnan, A.; Sorrell, C.C. Anticancer therapeutic effect of cerium-based nanoparticles: Known and unknown molecular mechanisms. Biomater. Sci. 2022, 10, 3671–3694. [Google Scholar] [CrossRef] [PubMed]
- Kurtuldu, F.; Mutlu, N.; Michálek, M.; Zheng, K.; Masar, M.; Liverani, L.; Chen, S.; Galusek, D.; Boccaccini, A.R. Cerium and gallium containing mesoporous bioactive glass nanoparticles for bone regeneration: Bioactivity, biocompatibility and antibacterial activity. Mater. Sci. Eng. C 2021, 124, 112050. [Google Scholar] [CrossRef]
- Atkinson, I.; Anghel, E.M.; Petrescu, S.; Seciu, A.M.; Stefan, L.M.; Mocioiu, O.C.; Predoana, L.; Voicescu, M.; Somacescu, S.; Culita, D.; et al. Microporous and Mesoporous Materials Cerium-containing mesoporous bioactive glasses: Material characterization, in vitro bioactivity, biocompatibility and cytotoxicity evaluation. Microporous Mesoporous Mater. 2019, 276, 76–88. [Google Scholar] [CrossRef]
- Qi, M.; Li, W.; Zheng, X.; Li, X.; Sun, Y.; Wang, Y.; Li, C.; Wang, L. Cerium and Its Oxidant-Based Nanomaterials for Antibacterial Applications: A State-of-the-Art Review. Front. Mater. 2020, 7, 213. [Google Scholar] [CrossRef]
- Dubey, A.K.; Oyama, Y.; Kakimoto, K. Surface charge-assisted synthesis of ZnO on polarized BaTiO3 substrate. Ionics 2019, 25, 1351–1358. [Google Scholar] [CrossRef]
- Obata, A.; Nakamura, S.; Moriyoshi, Y.; Yamashita, K. Electrical polarization of bioactive glass and assessment of theirin vitro apatite deposition. J. Biomed. Mater. Res. 2003, 67A, 413–420. [Google Scholar] [CrossRef]
- Schneider, C.A.; Rasband, W.S.; Eliceiri, K.W. Historical Commentary NIH Image to ImageJ: 25 years of image analysis. Nat. Methods 2012, 9, 671–675. [Google Scholar] [CrossRef]
- Graça, M.P.F.; Ferreira da Silva, M.G.; Sombra, A.S.B.; Valente, M.A. The dielectric behavior of a thermoelectric treated B2O3-Li2O-Nb2O5 glass. J. Non-Cryst. Solids 2008, 354, 3408–3413. [Google Scholar] [CrossRef]
- Graça, M.P.F.; Ferreira da Silva, M.G.; Valente, M.A. Influence of thermal and thermoelectric treatments on structure and electric properties of B2O3-Li2O-Nb2O5 glasses. J. Non-Cryst. Solids 2008, 354, 901–908. [Google Scholar] [CrossRef]
- Graça, M.P.F.; Ferreira da Silva, M.G.; Sombra, A.S.B.; Valente, M.A. Electrical characterization of SiO2:LiNbO3 glass and glass-ceramics using dc conductivity, TSDC measurements and dielectric spectroscopy. J. Non-Cryst. Solids 2007, 353, 4390–4394. [Google Scholar] [CrossRef]
- Jović, V.D. Calculation of a pure double layer capacitance from a constant phase element in the impedance measurements. Zastita Materijala 2022, 63, 50–57. [Google Scholar] [CrossRef]
- Devaraja, C.; Gowda, G.V.J.; Eraiah, B.; Talwar, A.M.; Dahshan, A.; Nazrin, S.N. Structural, conductivity and dielectric properties of europium trioxide doped lead boro-tellurite glasses. J. Alloys Compd. 2022, 898, 162967. [Google Scholar] [CrossRef]
- Javed, M.; Arif, A.; Kazmi, J.; Ambri, M.; Sha, M.; Iqbal, Y. Impedance spectroscopic study of charge transport and relaxation mechanism in MnCr2O4 ceramic chromite. J. Alloy. Compd. 2021, 854, 156996. [Google Scholar] [CrossRef]
- Gavinho, S.R.; Graça, M.P.F.; Prezas, P.R.; Kumar, J.S.; Melo, B.M.G.; Sales, A.J.M.; Almeida, A.F.; Valente, M.A. Structural, thermal, morphological and dielectric investigations on 45S5 glass and glass-ceramics. J. Non-Cryst. Solids 2021, 562, 120780. [Google Scholar] [CrossRef]
- Gavinho, S.R.; Prezas, P.R.; Graça, M.P.F. Synthesis, structural and electrical properties of the 45S5 Bioglass®. In Electrical Measurements: Introduction, Concepts and Applications; Nova Science Publishers Inc.: Hauppauge, NY, USA, 2017; pp. 295–320. ISBN 9781536129748. [Google Scholar]
- Gavinho, S.R.; Prezas, P.R.; Ramos, D.J.; Sá-Nogueira, I.; Borges, J.P.; Lança, M.C.; Silva, J.C.; Henriques, C.M.R.; Pires, E.; Kumar, J.S.; et al. Nontoxic glasses: Preparation, structural, electrical and biological properties. Int. J. Appl. Ceram. Technol. 2019, 16, 1885–1894. [Google Scholar] [CrossRef]
- Fernandes, H.R.; Gaddam, A.; Rebelo, A.; Brazete, D.; Stan, G.E.; Ferreira, J.M.F. Bioactive glasses and glass-ceramics for healthcare applications in bone regeneration and tissue engineering. Materials 2018, 11, 2530. [Google Scholar] [CrossRef]
- Araujo, M.S.; Silva, A.C.; Bartolomé, J.F.; Mello-Castanho, S. Structural and thermal behavior of 45S5 Bioglass®-based compositions containing alumina and strontium. J. Am. Ceram. Soc. 2020, 103, 3620–3630. [Google Scholar] [CrossRef]
- Dziadek, M.; Zagrajczuk, B.; Jelen, P.; Olejniczak, Z.; Cholewa-Kowalska, K. Structural variations of bioactive glasses obtained by different synthesis routes. Ceram. Int. 2016, 42, 14700–14709. [Google Scholar] [CrossRef]
- Berezicka, A.; Szumera, M.; Sułowska, J.; Jeleń, P.; Olejniczak, Z.; Stępień, J.; Zając, M.; Pollastri, S.; Olivi, L. Unraveling the nature of sulfur-bearing silicate-phosphate glasses: Insights from multi-spectroscopic (Raman, MIR, 29Si, 31P MAS-NMR, XAS, XANES) investigation. Ceram. Int. 2022, 48, 4238–4254. [Google Scholar] [CrossRef]
- Sun, Y.; Zhang, Z.; Liu, L.; Wang, X. FTIR, Raman and NMR investigation of CaO-SiO2-P2O5 and CaO-SiO2-TiO2-P2O5 glasses. J. Non-Cryst. Solids 2015, 420, 26–33. [Google Scholar] [CrossRef]
- Graça, M.P.F.; Ferreira da Silva, M.G.; Valente, M.A. NaNbO3 crystals dispersed in a B2O3 glass matrix—Structural characteristics versus electrical and dielectrical properties. Solid State Sci. 2009, 11, 570–577. [Google Scholar] [CrossRef]
- Graça, M.P.F.; Ferreira da Silva, M.G.; Sombra, A.S.B.; Valente, M.A. Electric and dielectric properties of a SiO2-Na2O-Nb2O5 glass subject to a controlled heat-treatment process. Phys. B Condens. Matter 2007, 396, 62–69. [Google Scholar] [CrossRef]
- Keshri, S.R.; Ganisetti, S.; Kumar, R.; Gaddam, A.; Illath, K.; Ajithkumar, T.G.; Balaji, S.; Annapurna, K.; Nasani, N.; Krishnan, N.M.A.; et al. Ionic Conductivity of Na3Al2P3O12 Glass Electrolytes—Role of Charge Compensators. Inorg. Chem. 2021, 60, 12893–12905. [Google Scholar] [CrossRef]
- Melo, B.M.G.; Loureiro, F.J.A.; Fagg, D.P.; Costa, L.C.; Graça, M.P.F. DFRTtoEIS: An easy approach to verify the consistency of a DFRT generated from an impedance spectrum. Electrochim. Acta 2021, 366, 137429. [Google Scholar] [CrossRef]
- Jovic, V.D.; Jovic, B.M. EIS and differential capacitance measurements onto single crystal faces in different solutions: Part I: Ag(111) in 0.01 M NaCl. J. Electroanal. Chem. 2003, 541, 1–11. [Google Scholar] [CrossRef]


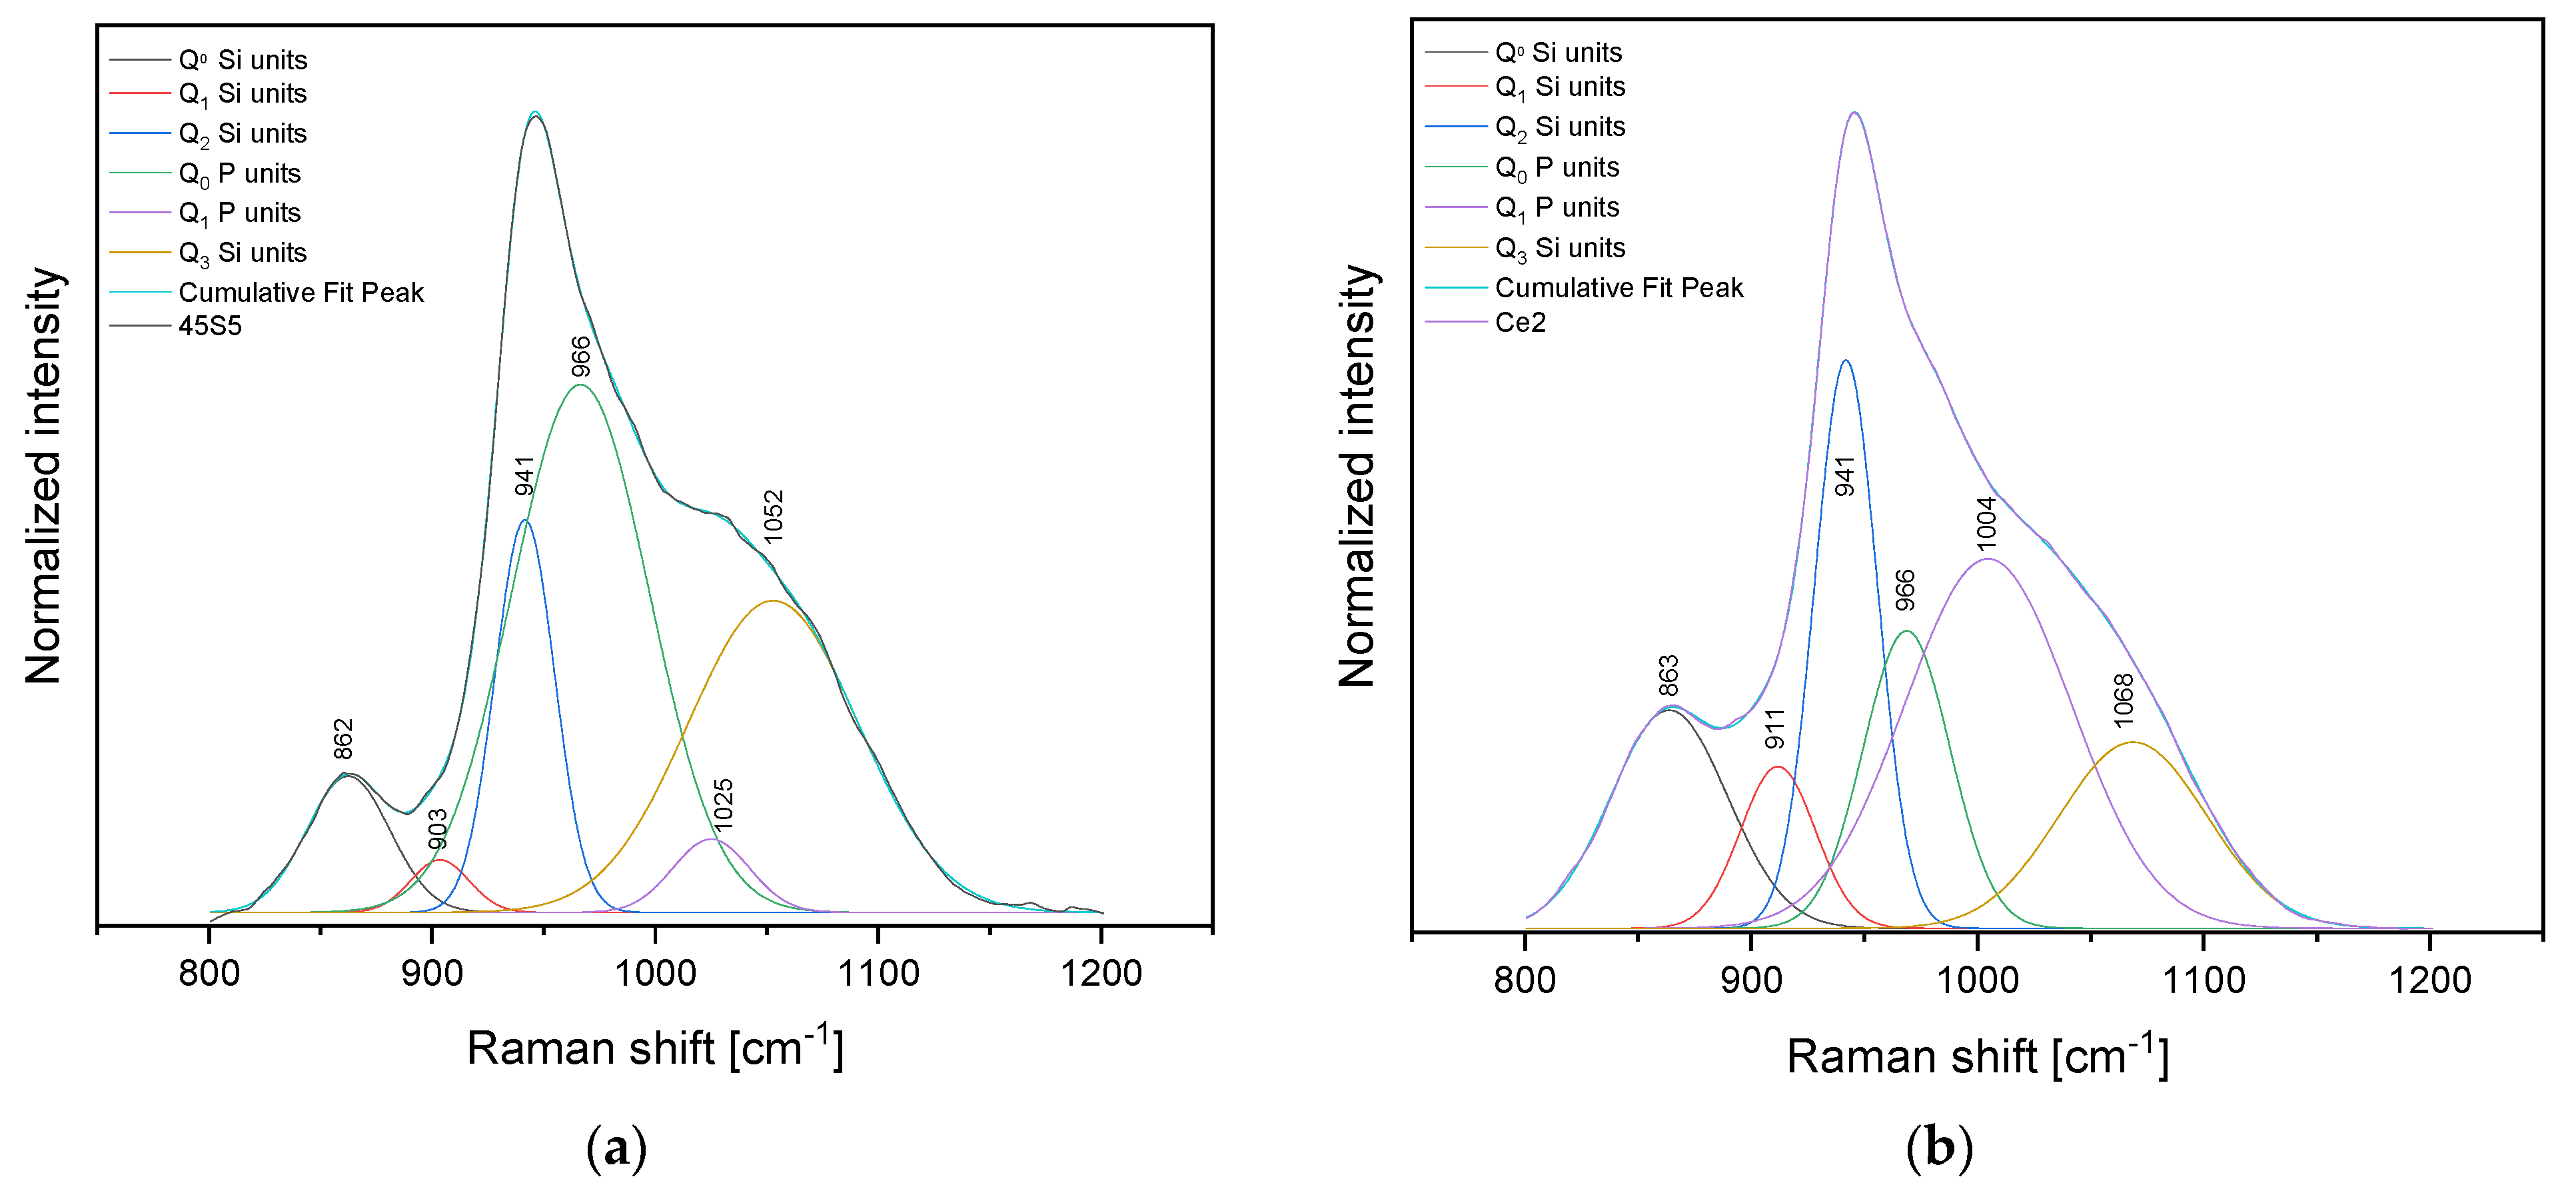
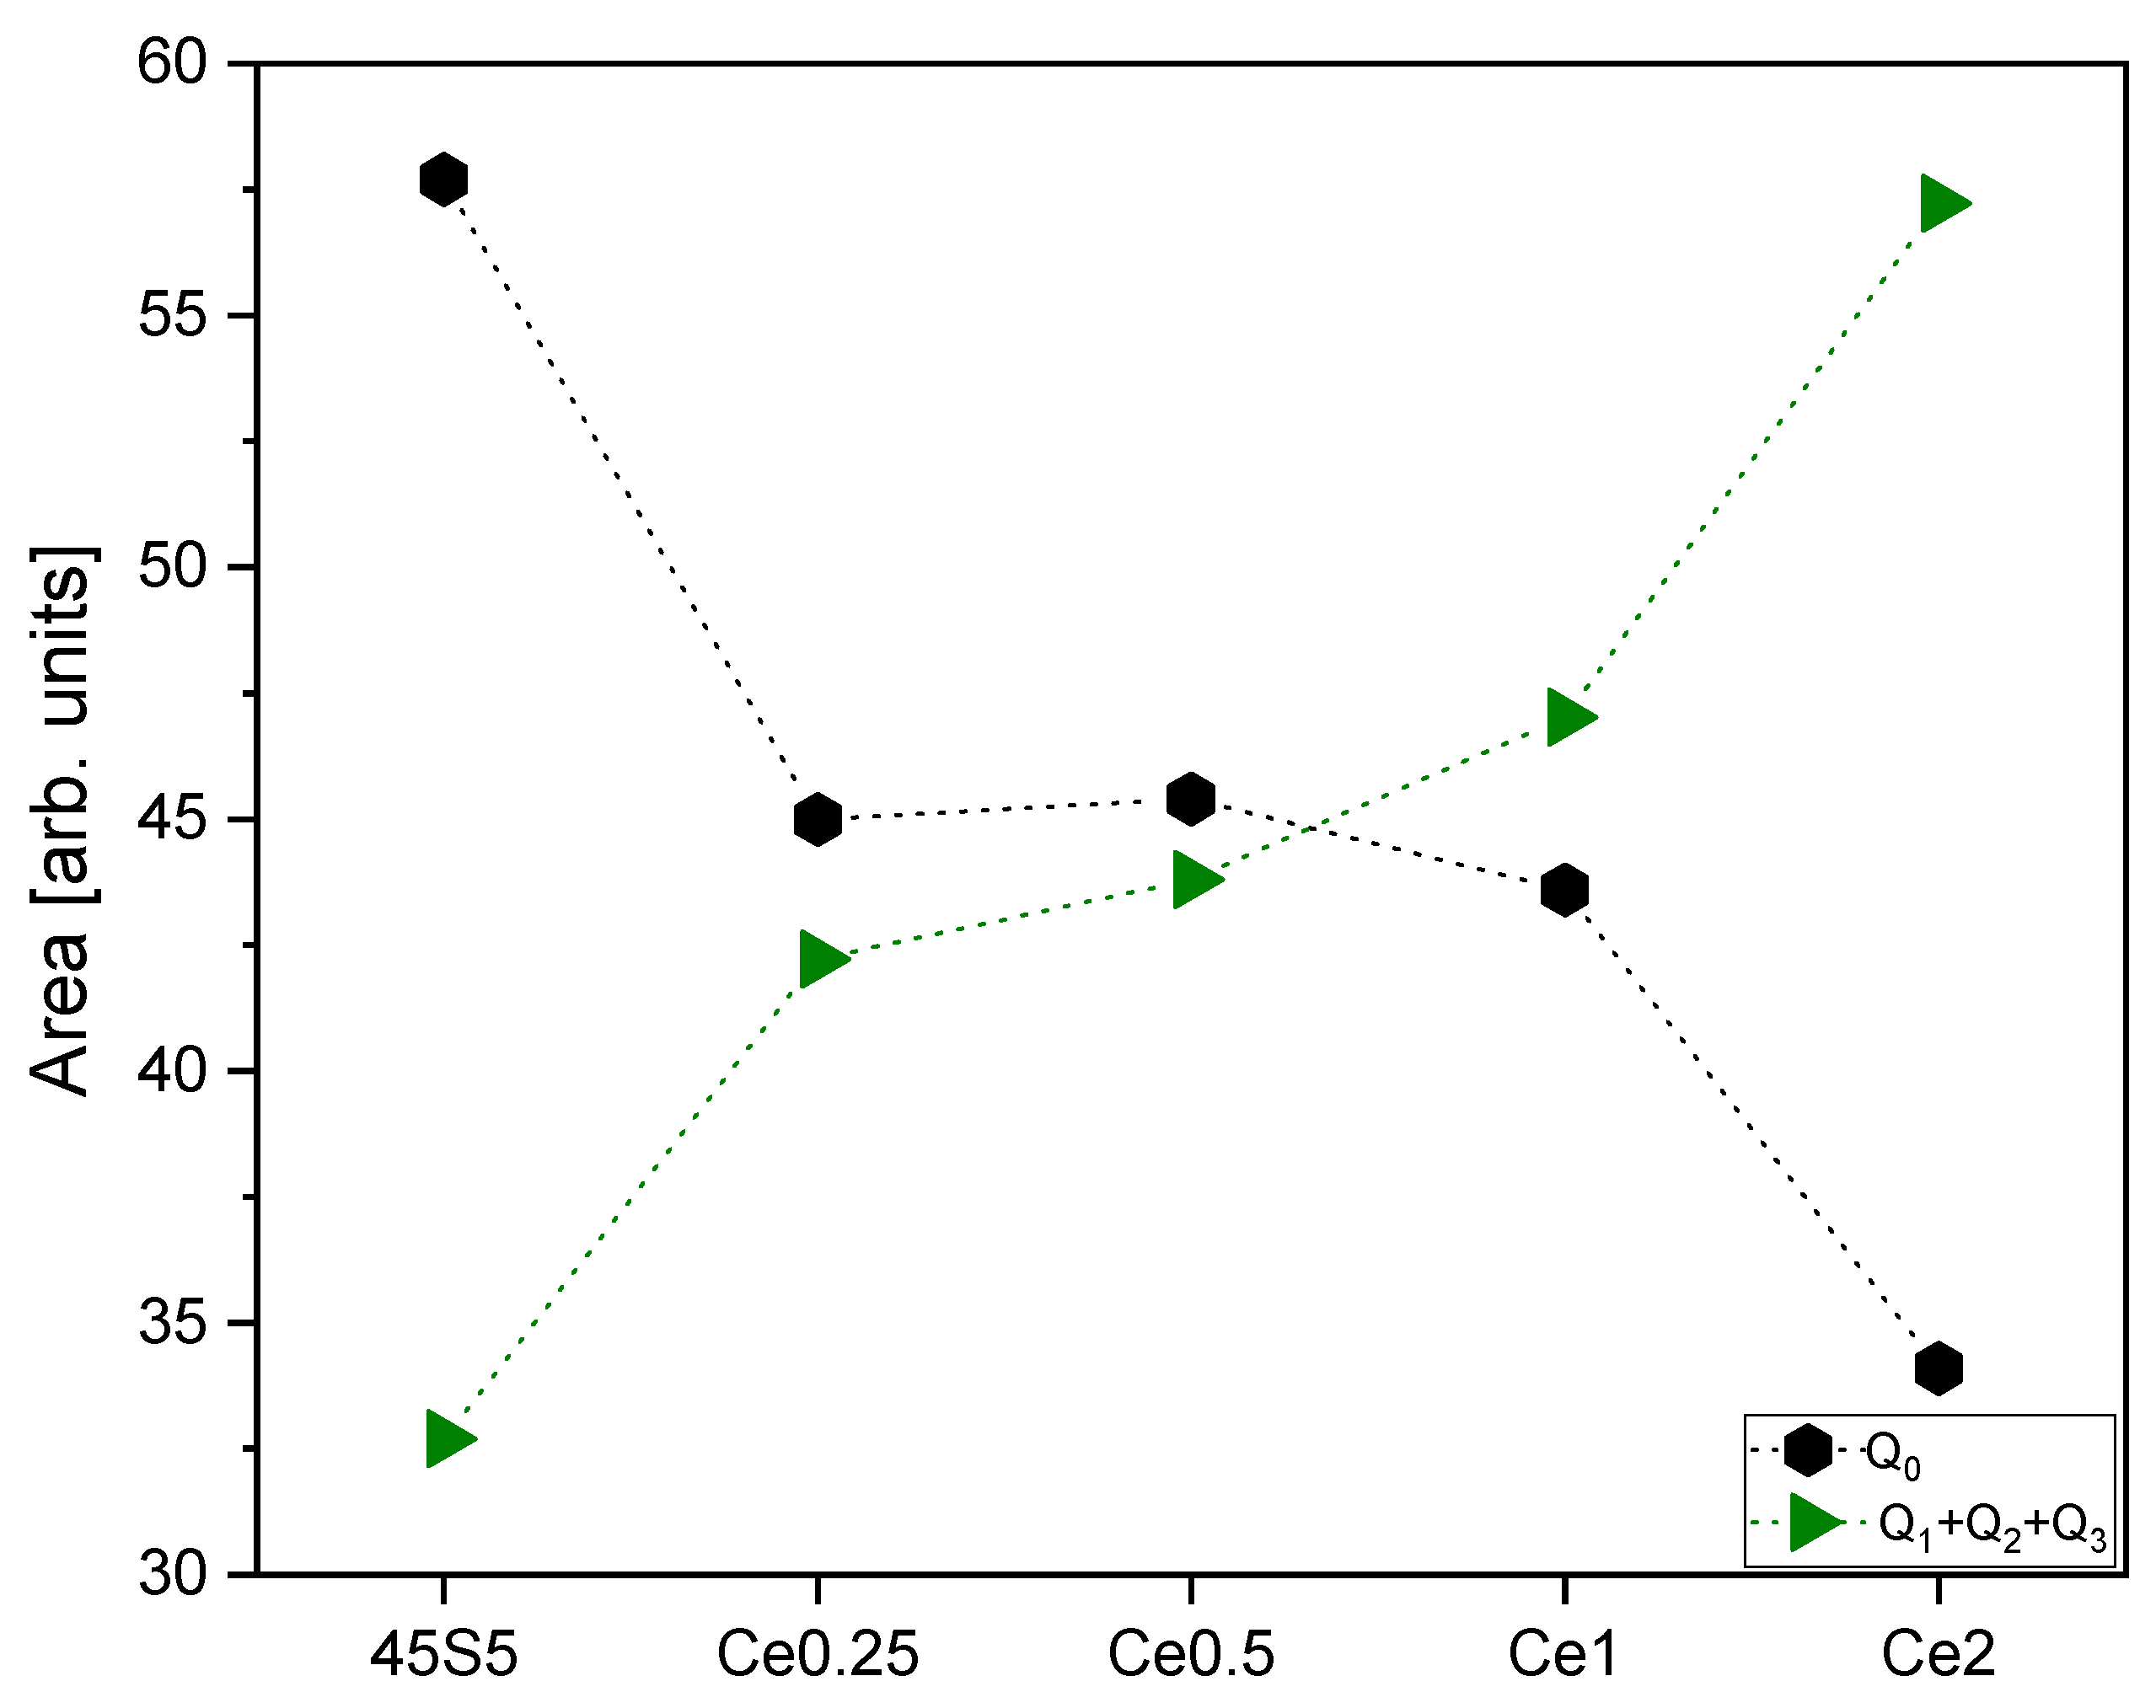
| Peak 1 Area (Q0 Si Units) | Peak 2 Area (Q1 Si Units) | Peak 3 Area (Q2 Si Units) | Peak 4 Area (Q0 P Units) | Peak 5 Area (Q1 P Units) | Peak 6 Area (Q3 Si Units) | |
|---|---|---|---|---|---|---|
| 45S5 | 7.8 | 2.13 | 15.9 | 49.9 | 3.9 | 36.7 |
| Ce0.25 | 9.1 | 5.9 | 22.8 | 35.9 | 21 | 21.6 |
| Ce0.5 | 11.1 | 5.7 | 26.6 | 34.3 | 16.8 | 24.3 |
| Ce1 | 15.4 | 3.6 | 34 | 28.2 | 28.2 | 12.7 |
| Ce2 | 16.9 | 8.1 | 23.8 | 17.4 | 41.1 | 18.3 |
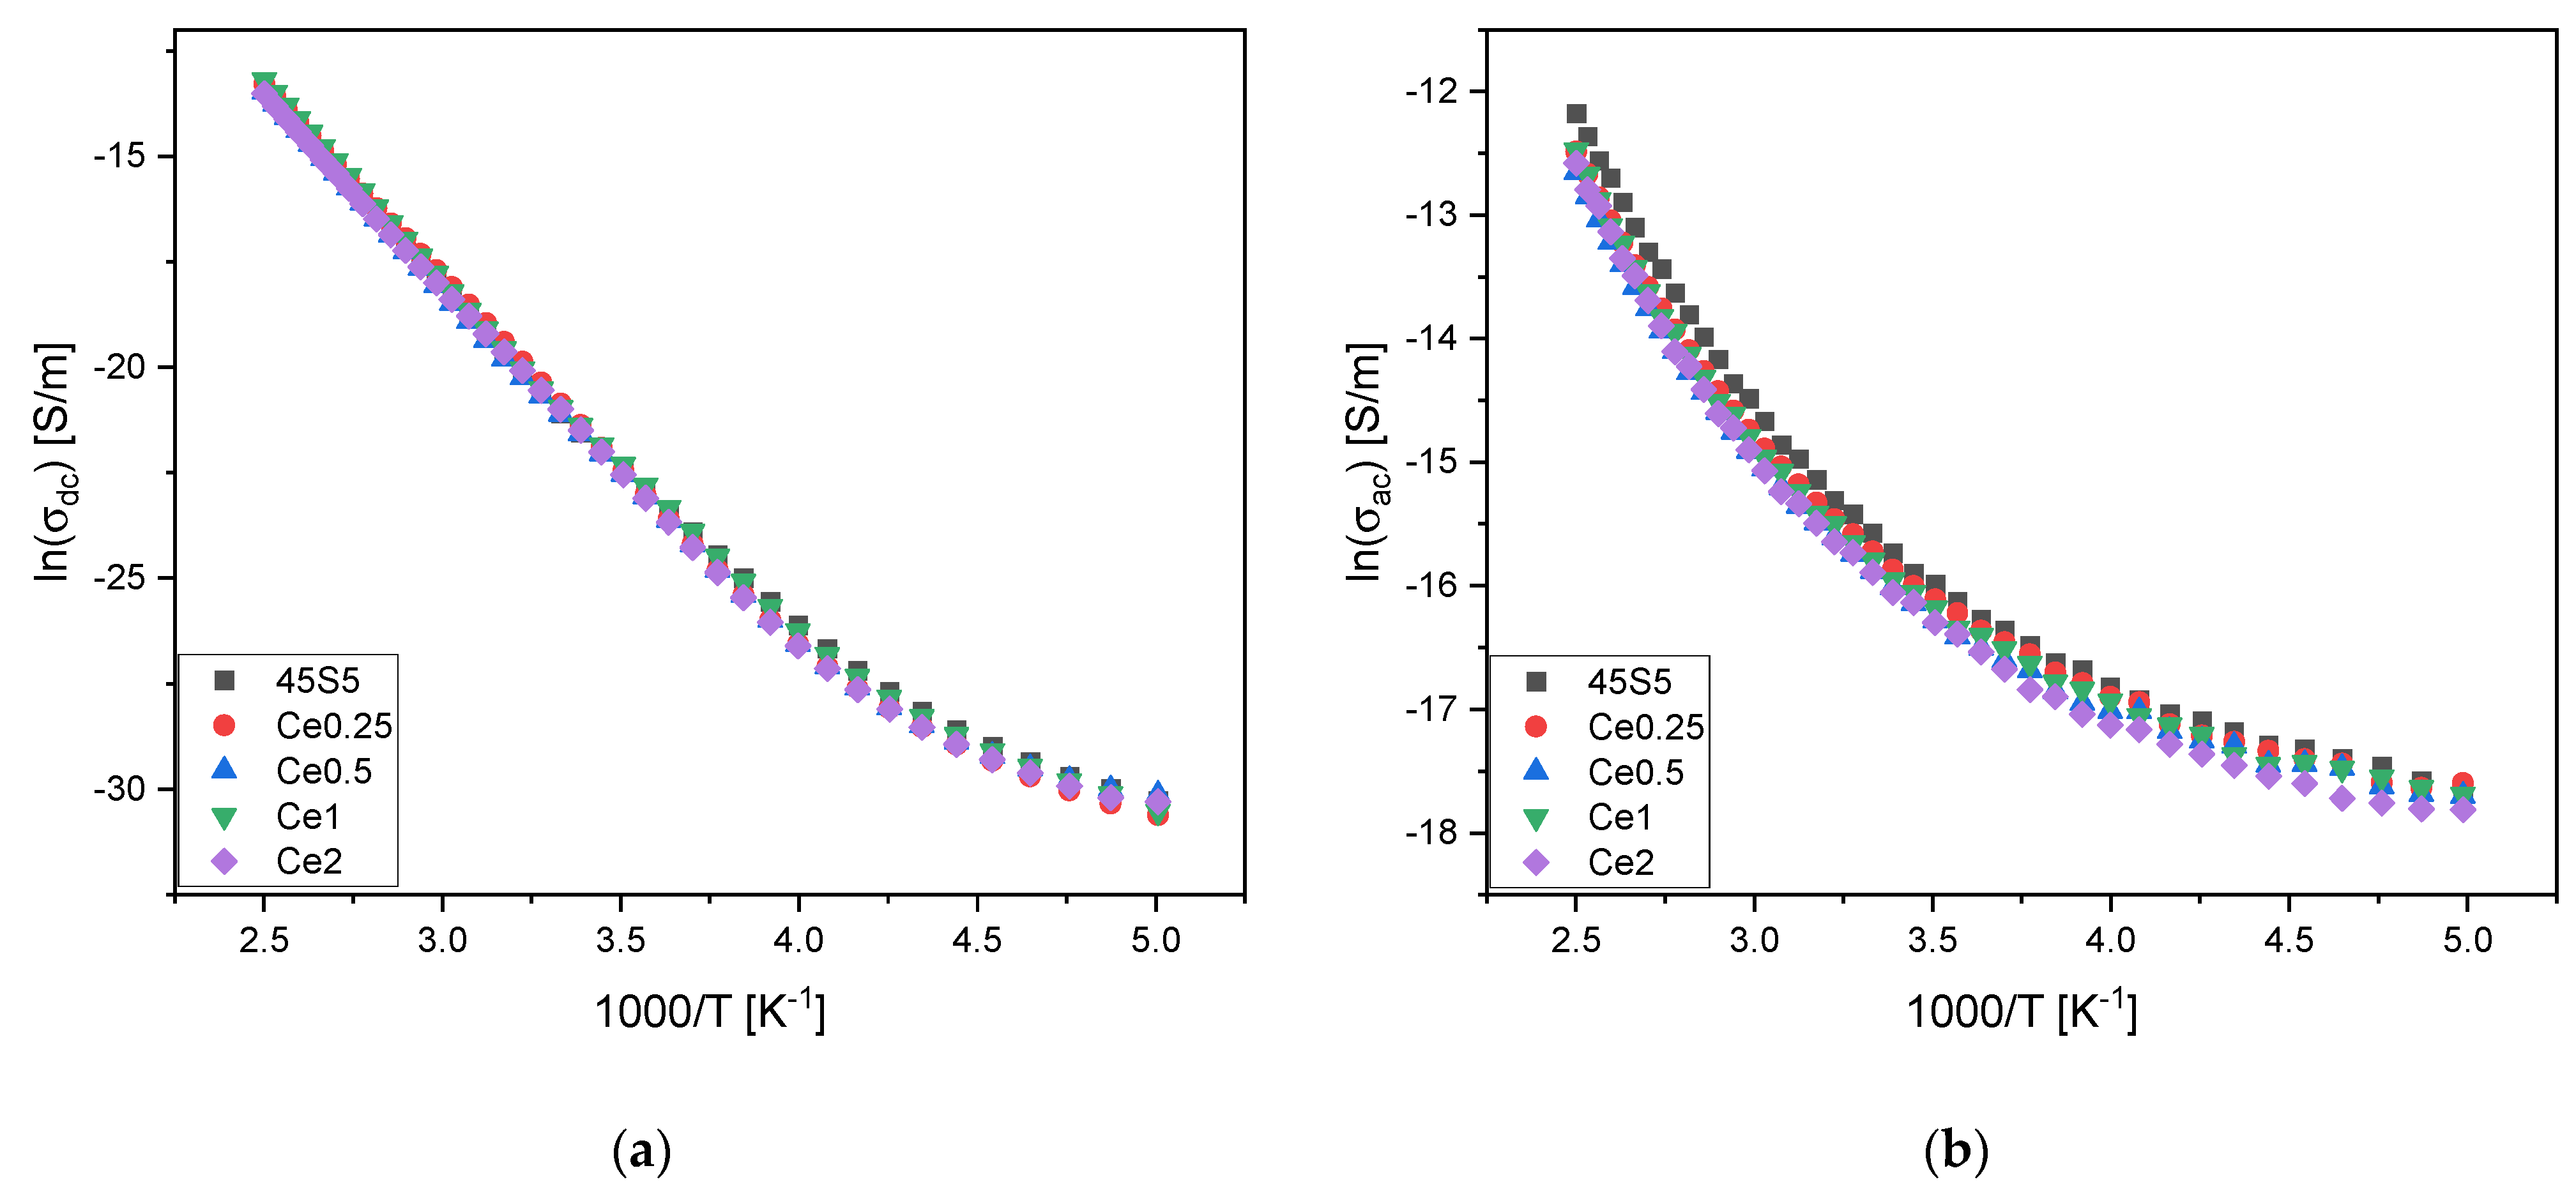
| (10−10) [S/m] | Ea dc [kJ/mol] | (10−7) [S/m] | Ea ac [kJ/mol] | |||
|---|---|---|---|---|---|---|
| 45S5 | 6.9 ± 0.1 | 77.7 ± 0.8 | 1.73 ± 0.02 | 40.99 ± 0.43 | 11.9 ± 0.7 | 0.31 ± 0.03 |
| Ce0.25 | 8.7 ± 0.2 | 76.0 ± 0.8 | 1.48 ± 0.04 | 39.66 ± 0.41 | 11.7 ± 0.9 | 0.27 ± 0.04 |
| Ce0.5 | 6.8 ± 0.1 | 78.9 ± 0.8 | 1.27 ± 0.02 | 39.62 ± 0.41 | 11.7 ± 0.6 | 0.23 ± 0.02 |
| Ce1 | 7.9 ± 0.2 | 79.0 ± 0.8 | 1.38 ± 0.03 | 40.77 ± 0.42 | 12.0 ± 0.8 | 0.25 ±0.03 |
| Ce2 | 7.6 ± 0.2 | 76.9 ± 0.8 | 1.26 ± 0.02 | 41.14 ± 0.43 | 12.0 ± 0.7 | 0.26 ± 0.02 |
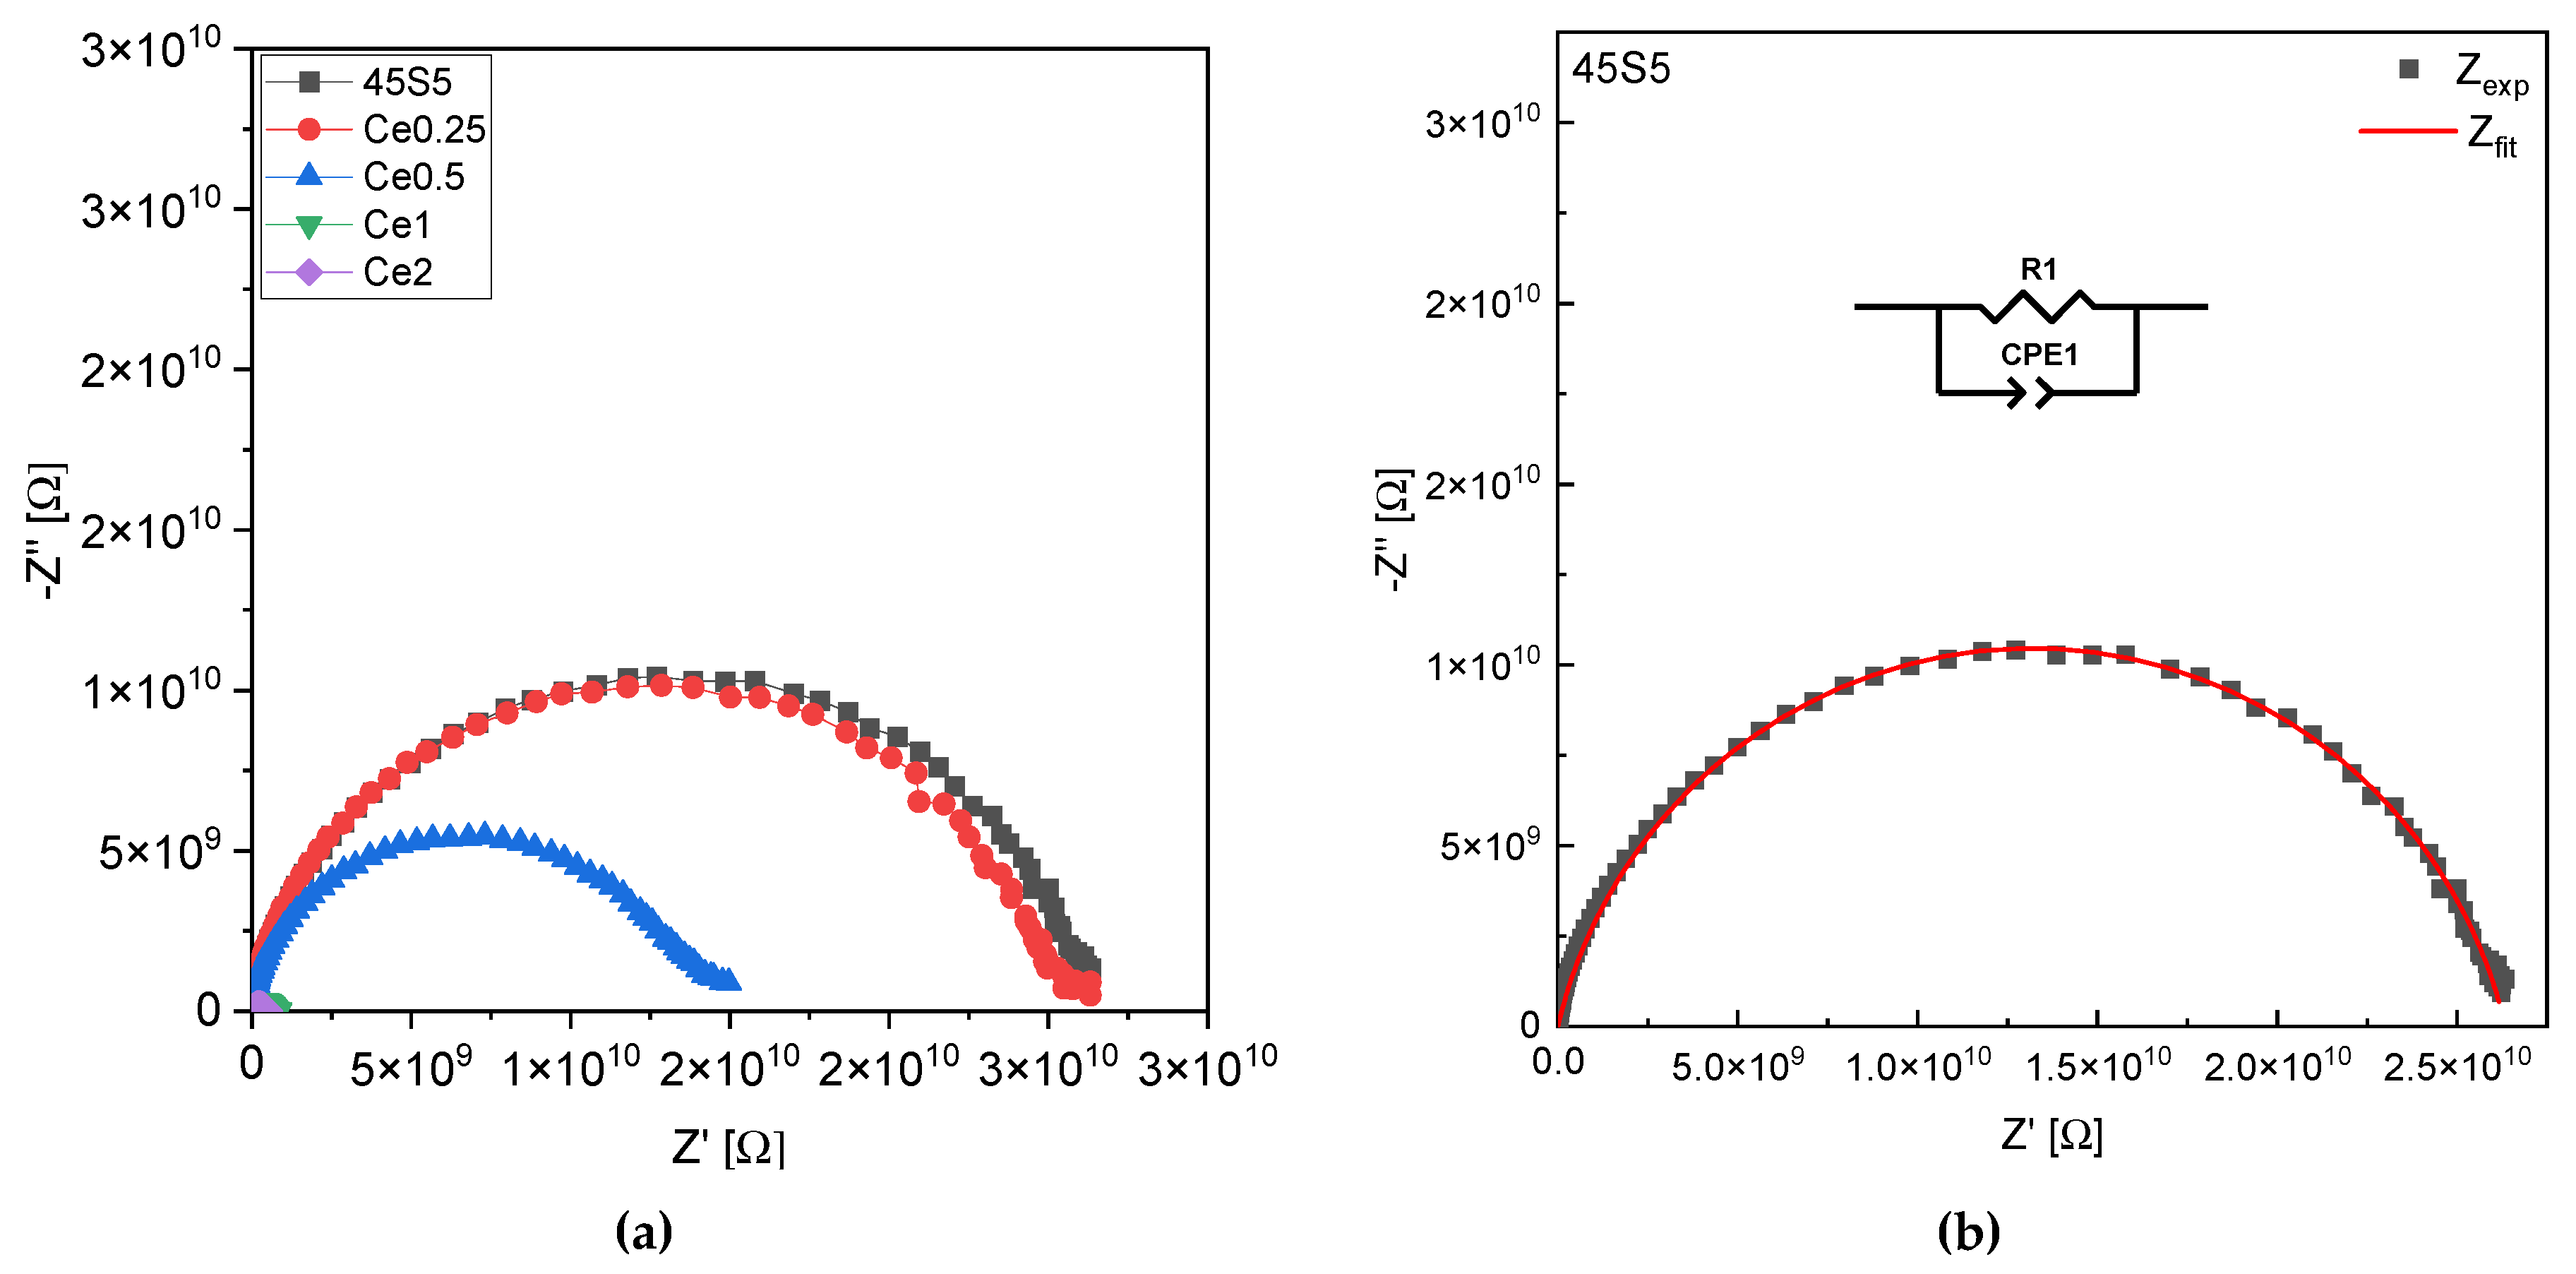
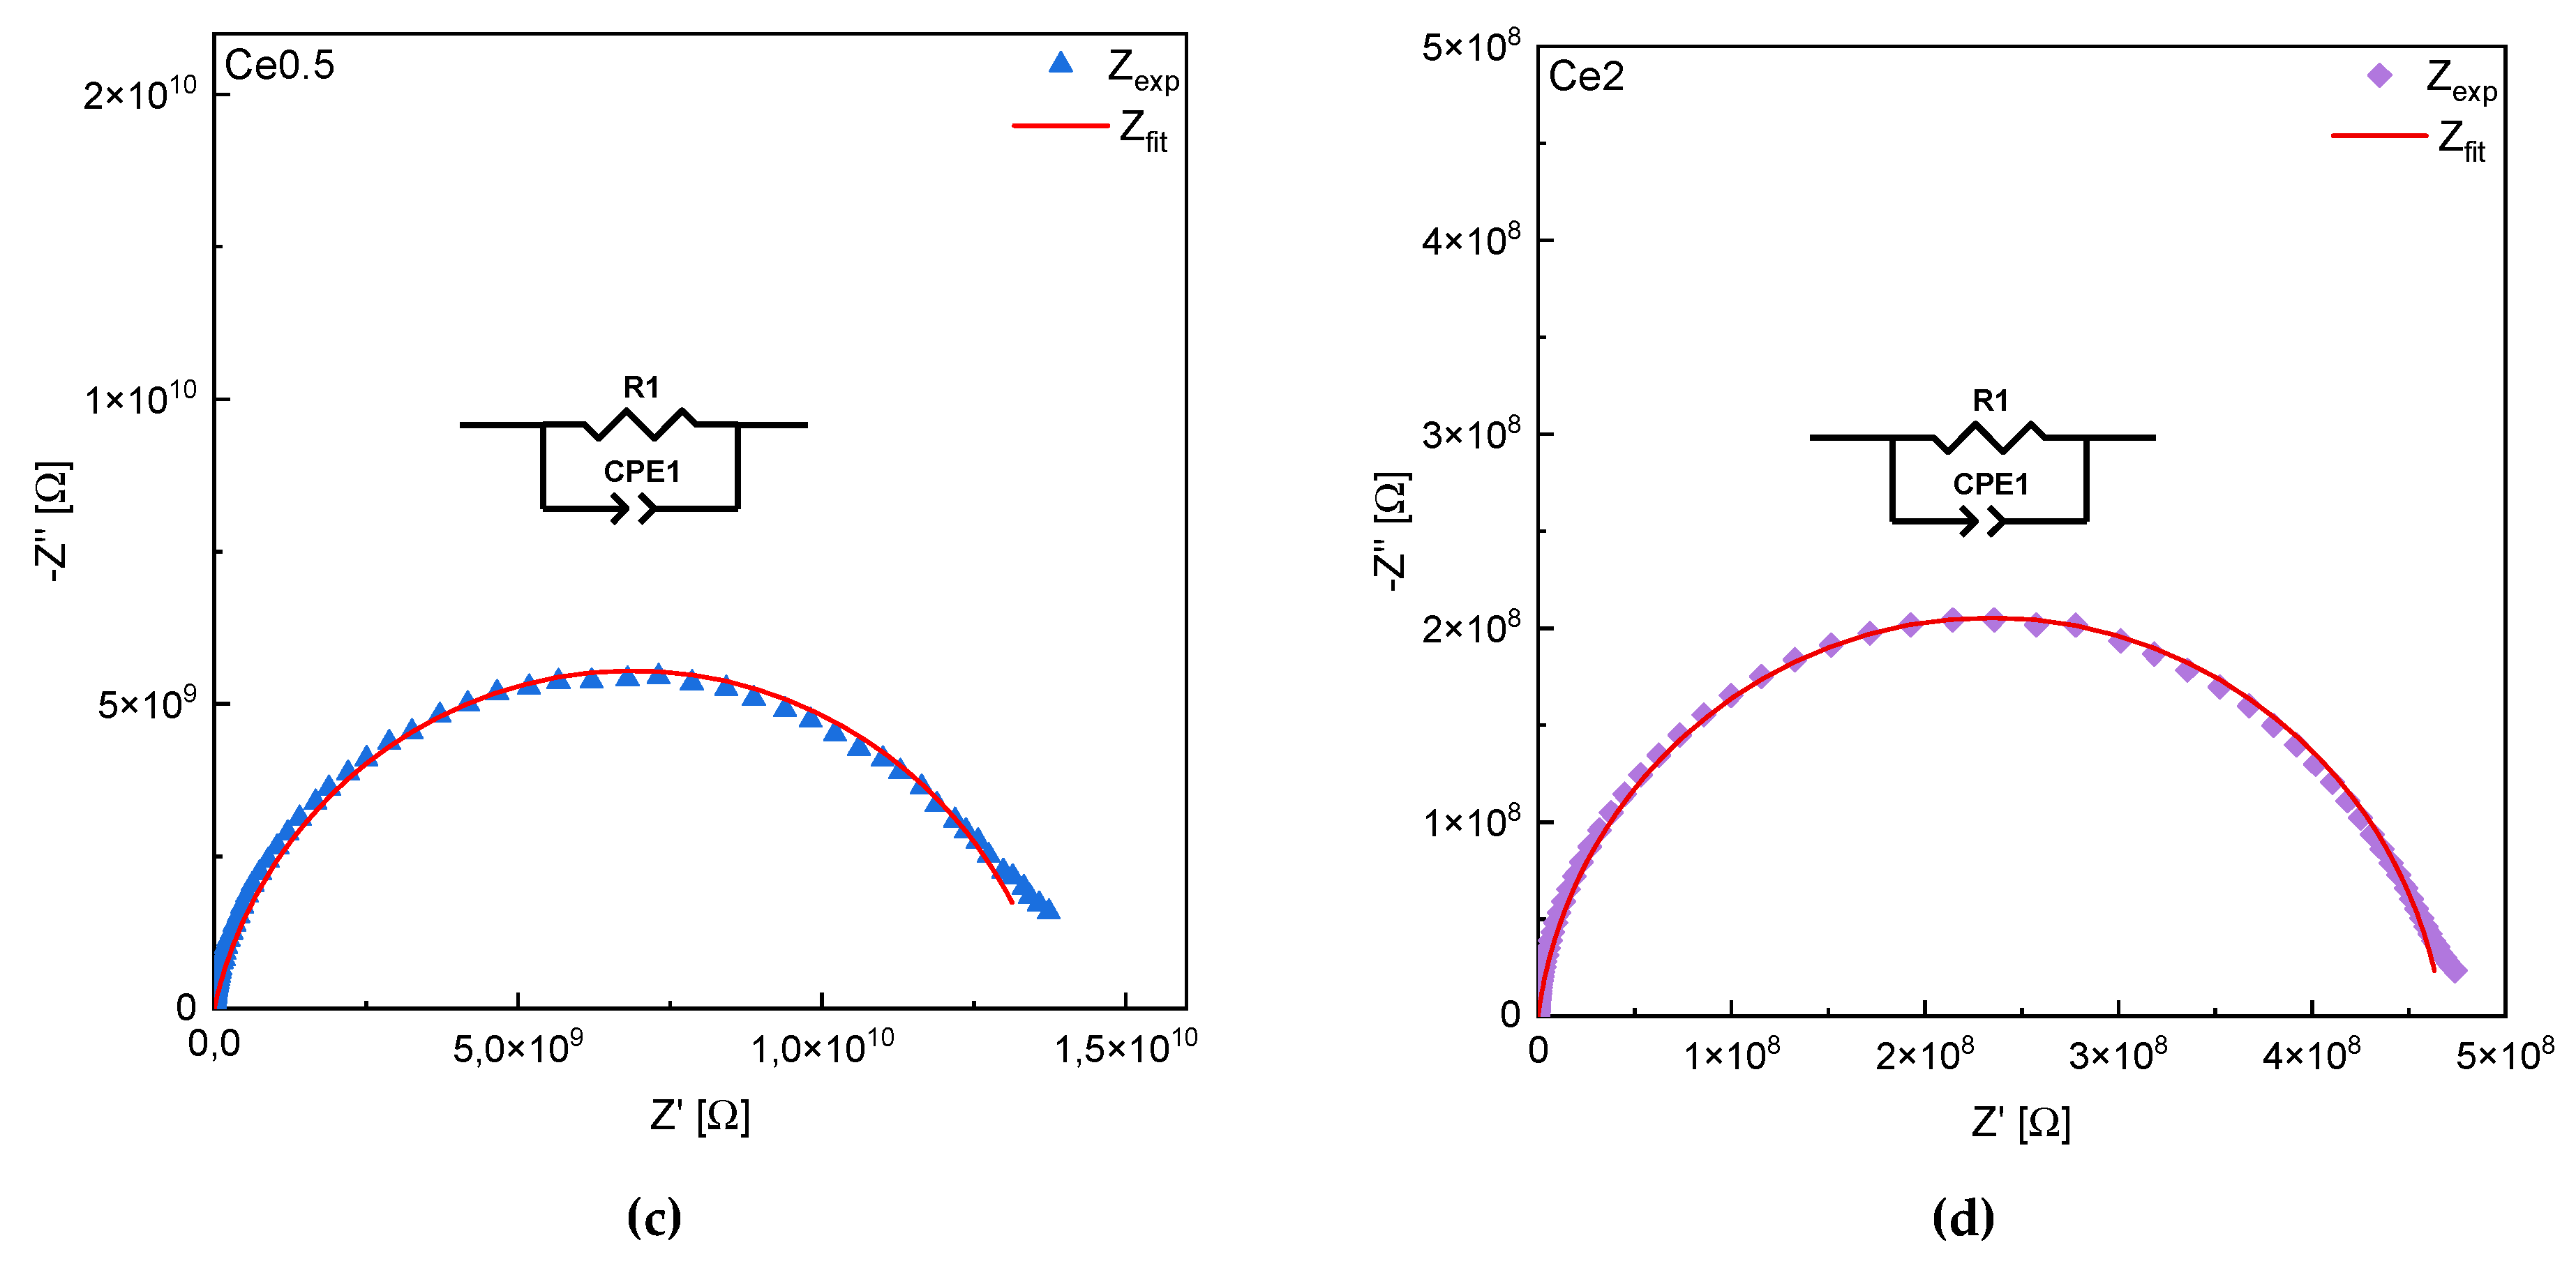
| R1 (108) [Ω] | A (10−11) [Ω−1sn] | n | C (10−12) [F] | |
|---|---|---|---|---|
| 45S5 | 263 | 1.10 | 0.85 | 8.7 |
| Ce0.25 | 253 | 0.86 | 0.87 | 6.7 |
| Ce0.5 | 138 | 0.84 | 0.86 | 5.7 |
| Ce1 | 7.3 | 0.92 | 0.91 | 5.5 |
| Ce2 | 4.67 | 0.88 | 0.92 | 5.4 |
Disclaimer/Publisher’s Note: The statements, opinions and data contained in all publications are solely those of the individual author(s) and contributor(s) and not of MDPI and/or the editor(s). MDPI and/or the editor(s) disclaim responsibility for any injury to people or property resulting from any ideas, methods, instructions or products referred to in the content. |
© 2023 by the authors. Licensee MDPI, Basel, Switzerland. This article is an open access article distributed under the terms and conditions of the Creative Commons Attribution (CC BY) license (https://creativecommons.org/licenses/by/4.0/).
Share and Cite
Gavinho, S.R.; Melo, B.M.G.; Borges, J.P.; Silva, J.C.; Graça, M.P.F. Thermal, Structural, Morphological and Electrical Characterization of Cerium-Containing 45S5 for Metal Implant Coatings. Coatings 2023, 13, 294. https://doi.org/10.3390/coatings13020294
Gavinho SR, Melo BMG, Borges JP, Silva JC, Graça MPF. Thermal, Structural, Morphological and Electrical Characterization of Cerium-Containing 45S5 for Metal Implant Coatings. Coatings. 2023; 13(2):294. https://doi.org/10.3390/coatings13020294
Chicago/Turabian StyleGavinho, Sílvia Rodrigues, Bruno Miguel Gonçalves Melo, João Paulo Borges, Jorge Carvalho Silva, and Manuel Pedro Fernandes Graça. 2023. "Thermal, Structural, Morphological and Electrical Characterization of Cerium-Containing 45S5 for Metal Implant Coatings" Coatings 13, no. 2: 294. https://doi.org/10.3390/coatings13020294
APA StyleGavinho, S. R., Melo, B. M. G., Borges, J. P., Silva, J. C., & Graça, M. P. F. (2023). Thermal, Structural, Morphological and Electrical Characterization of Cerium-Containing 45S5 for Metal Implant Coatings. Coatings, 13(2), 294. https://doi.org/10.3390/coatings13020294