Article

Porous Nickel Electrode for Highly Sensitive Non-Enzyme Electrochemical Glucose Detection

1
School of Engineering, University of Liverpool, Liverpool L63 3GH, UK
2
School of Mechanical and Automotive Engineering, Ningbo University of Technology, Ningbo 315336, China
*
Author to whom correspondence should be addressed.
Coatings 2023, 13(2), 290; https://doi.org/10.3390/coatings13020290
Submission received: 29 December 2022 / Revised: 18 January 2023 / Accepted: 23 January 2023 / Published: 27 January 2023

Abstract

:
Porous metals have great potential for applications in non-enzyme glucose detection because they have a high surface area and therefore improved the sensitivity of detection and the accuracy of measurement. An LCS/DHBT porous nickel with both macropores (710–1000 μm) and microscale pores (1–25 μm) has been produced by combining the Lost Carbonate Sintering (LCS) and Dynamic Hydrogen Bubble Template (DHBT) processes. Its behavior for glucose measurement has been studied by cyclic voltammetry and compared with a nickel plate and the LCS porous nickel substrate. The as-fabricated porous nickel has an electroactive surface area 18% higher than the LCS porous nickel. The anodic peak current density of the LCS/DHBT electrode in an electrolyte of 0.1 M KOH containing 0.5 mM glucose at scan rates in the range of 25–300 mV/s are in the range of 3.43–13.94 mA/cm2, which is approximately 2 and 10 times those of the plate and LCS electrodes. Increasing the scan rate results in a higher current density and a larger anodic peak potential shift. Current density increases with glucose concentration in several linear segments. The sensitivity and limit of detection of LCS/DHBT nickel electrode in the glucose measurement are 5775 μA/cm2mM and 0.66–2.91 μΜ, respectively. It shows excellent performance for glucose measurement due to its porous nanostructure and its highly effective surface area.

1. Introduction

Glucose sensors have attracted considerable attention in recent years as diabetes has increasingly become a serious global health problem. Enzymatic glucose sensors have two main issues: Difficulty in quality control and the effect of oxygen on sensitivity [1]. Firstly, the accuracy of glucose detection depends on the activity of the enzyme, which is influenced by factors such as temperature, humidity, pH, and contamination. Normally, the active enzyme can only work and be stored in dry conditions below 40 °C with a pH value in the range of 2–8. Moreover, a sterilization process is needed throughout the whole sensor manufacturing process. These requirements not only complicate the manufacturing process and increase the production cost but also increase the risk of low reproducibility [1]. Secondly, the sensitivity of enzymatic sensors is highly affected by the oxygen concentration. Low or high concentrations of oxygen result in the distortion of measurement [1].
Enzyme-free electrochemical glucose sensors have little restriction in the manufacturing and storing processes because no active enzyme is needed. They are suitable for mass production and have lower unit prices and better reproducibility. In addition, the glucose is directly oxidized on the surface of the sensor, avoiding the oxygen effect on measurement because the potential of glucose oxidation is lower than that of oxygen reduction. Therefore, non-enzyme electrochemical glucose sensors potentially have a large market in the future.
Many metals, including gold, platinum, silver, copper, and nickel, and their alloys or oxides possess electrochemical catalytic activity to glucose [2,3,4,5,6,7], and many studies have been carried out to improve the electrochemical catalysis of glucose sensors [8,9,10,11,12]. Among these metals, nickel-based materials have received much attention because of their advantages such as low cost, high catalytic activity, and ease of manufacturing. The catalytic activity of the Ni2+/Ni3+ couple in an alkaline medium allows fast oxidation of glucose to gluconolactone as shown below:
Ni + 2OH → Ni (OH)2 + H2O + e
Ni (OH)2 + 2OH → NiOOH + H2O + e
NiOOH + glucose → Ni (OH)2 + gluconolactone
Bulk nickel, however, is not accurate and efficient for glucose measurement. Although it can measure the glucose concentration by applying a potential to catalyze the glucose reaction, the collected current is on a scale of μA/cm2/mM. In such a small current, any small disturbance can cause significant errors in the measurement. Increasing the surface area of the electrode becomes an effective pathway to improve the sensitivity of detection and accuracy of measurement. For example, growing nickel nano particles on a substrate can significantly improve the electrocatalytic activity of the electrode, especially on those substrates with ultra-high surface areas such as a multi-wall carbon nanotube/glass carbonate electrode (MWCNT/GCE) [13]. Using a porous structure (e.g., porous film) not only increases the effective surface area but also improves the kinetics of the glucose electro-oxidation reaction [14]. Porous metals have been studied as electrochemical sensors, and many interesting results have been obtained in non-enzyme glucose detection [15,16].
Lost Carbonate Sintering (LCS) is one of the space-holder processes for manufacturing porous metals [17]. It uses potassium carbonate powder to create pores and uses solid-state sintering to process high-melting-point metals. It has the advantage of good control over pore shape, pore size, and porosity. The pore size of the LCS porous metals is normally in the range of 250–1500 μm, and the porosity is in the range of 60%–85%. LCS porous metals have been considered for electrochemical applications such as fuel cells and current collectors due to their high surface area and open-cell porous structure.
The Dynamic Hydrogen Bubble Template (DHBT) is a useful method to form a metal foam film on a substrate [18,19]. In the DHBT process, hydrogen is evolved, and the gas bubbles act as a dynamic soft template. During electrolytic metal deposition, metal crystallization takes place around the bubbles and forms a porous structure. DHBT is easy to implement and the as-manufactured porous film has a very high surface area. Similar to the coatings produced by other electrodeposition techniques (e.g., [20,21]), DHBT coatings are expected to have wide electrochemical applications.
In this paper, we combine the LCS and DHBT processes to manufacture an LCS/DHBT porous nickel structure and investigate the feasibility of this material as electrodes for the cyclic voltametric measurement of glucose. We measure the surface area of the samples and establish the relationship between the current and glucose concentration when they are used as electrodes. We also study the effect of the scan rate in the cyclic voltammetry measurement. We compare the LCS/DHBT porous nickel with other Ni-based enzyme-free glucose sensors in terms of sensitivity and linearity of detection (LOD) and discuss its suitability for use as non-enzyme glucose sensors.

2. Experimental

Porous nickel substrates with a porosity of 80% and a pore size range of 710–1000 μm were manufactured by the LCS process as described in [17]. The nickel powder (99.9%) was supplied by Tianjiu Ltd., Changsha, China, and has spherical particles with a size range of 45–75 μm. The potassium carbonate powder (99.0%) was supplied by E&E Ltd., Australia, and has spherical particles with a size range of 710–1000 μm. The Ni and potassium carbonate powders were prepared at a volume ratio of 1:4, which would give the final porous Ni sample a porosity of 80%. The two powders were mixed thoroughly, poured into a cylinder mold, and compacted at 200 MPa by a hydraulic press to form a preform. The preform was sintered in a furnace at 850 °C for 4 h. It was then soaked in hot water to eliminate the potassium carbonate to form a porous Ni sample, which was cut into cuboids (4 × 5 × 6 mm) to serve as substrates.
A thin porous nickel film was electrodeposited on each of the LCS porous nickel specimens by the DHBT method as described in [18,19]. A three-electrode configuration was used in the deposition process, which was driven by a potentiostat (Autolab PGSTAT 101). The LCS porous nickel substrate served as the working electrode, a 10 cm Pt coil was used as the counter electrode, and a saturated calomel electrode (SCE) was employed as the reference electrode. The electrodeposition process was carried out in a 50 mL electrolytic tank at room temperature. The electrolyte contained 0.2 M acetate nickel (99.9%) and 0.5 M ammonium chloride (99.5%), which were supplied by Simga-Alrich Co. Ltd, Gillingham, UK. It was degassed by aerating with plenty of nitrogen gas. The distance between the electrodes is kept at 20 mm. The deposition potential was −1.7 V vs. SCE and the deposition time was 300 s. The as-produced LCS/DHBT porous nickel sample was cleaned with plenty of distilled water and ethanol. To avoid damage to the sample, no ultrasonic cleaning was carried out. The fully cleaned and dried sample was observed by an optical microscope and a scanning electron microscope (SEM) and characterized by Energy-Dispersive X-Ray Spectroscopy (EDX).
The electroactive surface area of the LCS/DHBT porous nickel samples was measured in a three-electrode electrochemical system (Autolab PGSTAT 101) by the peak current method [22,23,24]. The working electrode was the porous Ni sample, the reference electrode was a Saturated Calomel Electrode (SCE, +0.241 V vs. a standard hydrogen electrode), and the counter electrode was a platinum wire electrode. The electrolyte was 1 mM K4[Fe(CN)6] in a 0.1 M KOH solution, which was de-aerated with argon for 5 min before the measurement. The potential window was from −0.1 to 0.4 V vs. SCE and the scan rate range was from 25 to 300 mV/s. The anodic peak appeared at approximately 0.25 V, as shown in Figure 1. The electrochemical reaction during the scan was in the form of:
[ F e ( C N ) 6 ] 4 [ F e ( C N ) 6 ] 3 + e
The electroactive surface area of the porous nickel samples was calculated from the peak current by the Randles Sevcik equation [24,26]:
i p = 0.4463 n F A C ( n F v D R T ) 1 2
where n is the number of electrons transferred in the redox process, A is the active surface area, C is the concentration of the ferrocyanide in the bulk solution, v is the scan rate, D is the diffusion coefficient of the ferrocyanide in the electrolyte (D = 6.4 × 10⁻⁶ cm2/s), F is the Faraday constant, R is the gas constant, and T is temperature.
The glucose measurement performance of the LCS/DHBT porous nickel samples was characterized in the same three-electrode electrochemical system (Autolab PGSTAT 101) by the cyclic peak current method. The electrolyte was a 0.1 M KOH background solution, and the concentration of glucose was changed from 10 μM to 500 μM in a step of 50 μM and increased until a peak current could not be obtained. The sweep potential window was from −0.2 to 1 V and the scan rate was in the range of 25 to 300 mV/s. The anodic peak current was measured at each glucose concentration.

3. Results and Discussion

3.1. Surface Morphology and Surface Area

Figure 2 shows the microstructure and surface morphology of the LCS and the LCS/DHBT porous nickel samples. The optical micrographs show that both samples show interconnected macro pores. The only difference is that the LCS sample exhibits smooth and shiny metal particles (Figure 2a) while the LCS/DHBT sample has a matte surface, even inside the inner pores (Figure 2b). The SEM micrograph of the LCS/DHBT sample (Figure 2c) shows that the DHBT deposit is composed of cauliflower-like nickel particles, many spherical dimples, and a large number of fine pores. The pores and dimples are in the size range of 1–25 μm. The porosity is estimated to be above 80% from observations, which generally agrees with the measured values reported in [27].
Figure 3 compares the morphology and the composition of the LCS/DHBT porous Ni electrode before and after glucose measurement, showing that there is no significant change in the morphology and composition.
The electroactive surface area of the LCS/DHBT porous nickel sample is measured to be 9.11 cm2, while that of the LCS porous nickel sample of the same size is 7.46 cm2. The DHBT coating has a moderate effect on the electroactive surface area compared to the LCS substrate, with an increase of less than 20%. This is because, although the DHBT coating has a nanostructure and an associated high real surface area, some of the features in the coating are smaller or comparable to the thickness of the diffusion layer and cannot be detected using the peak current method [22,23].

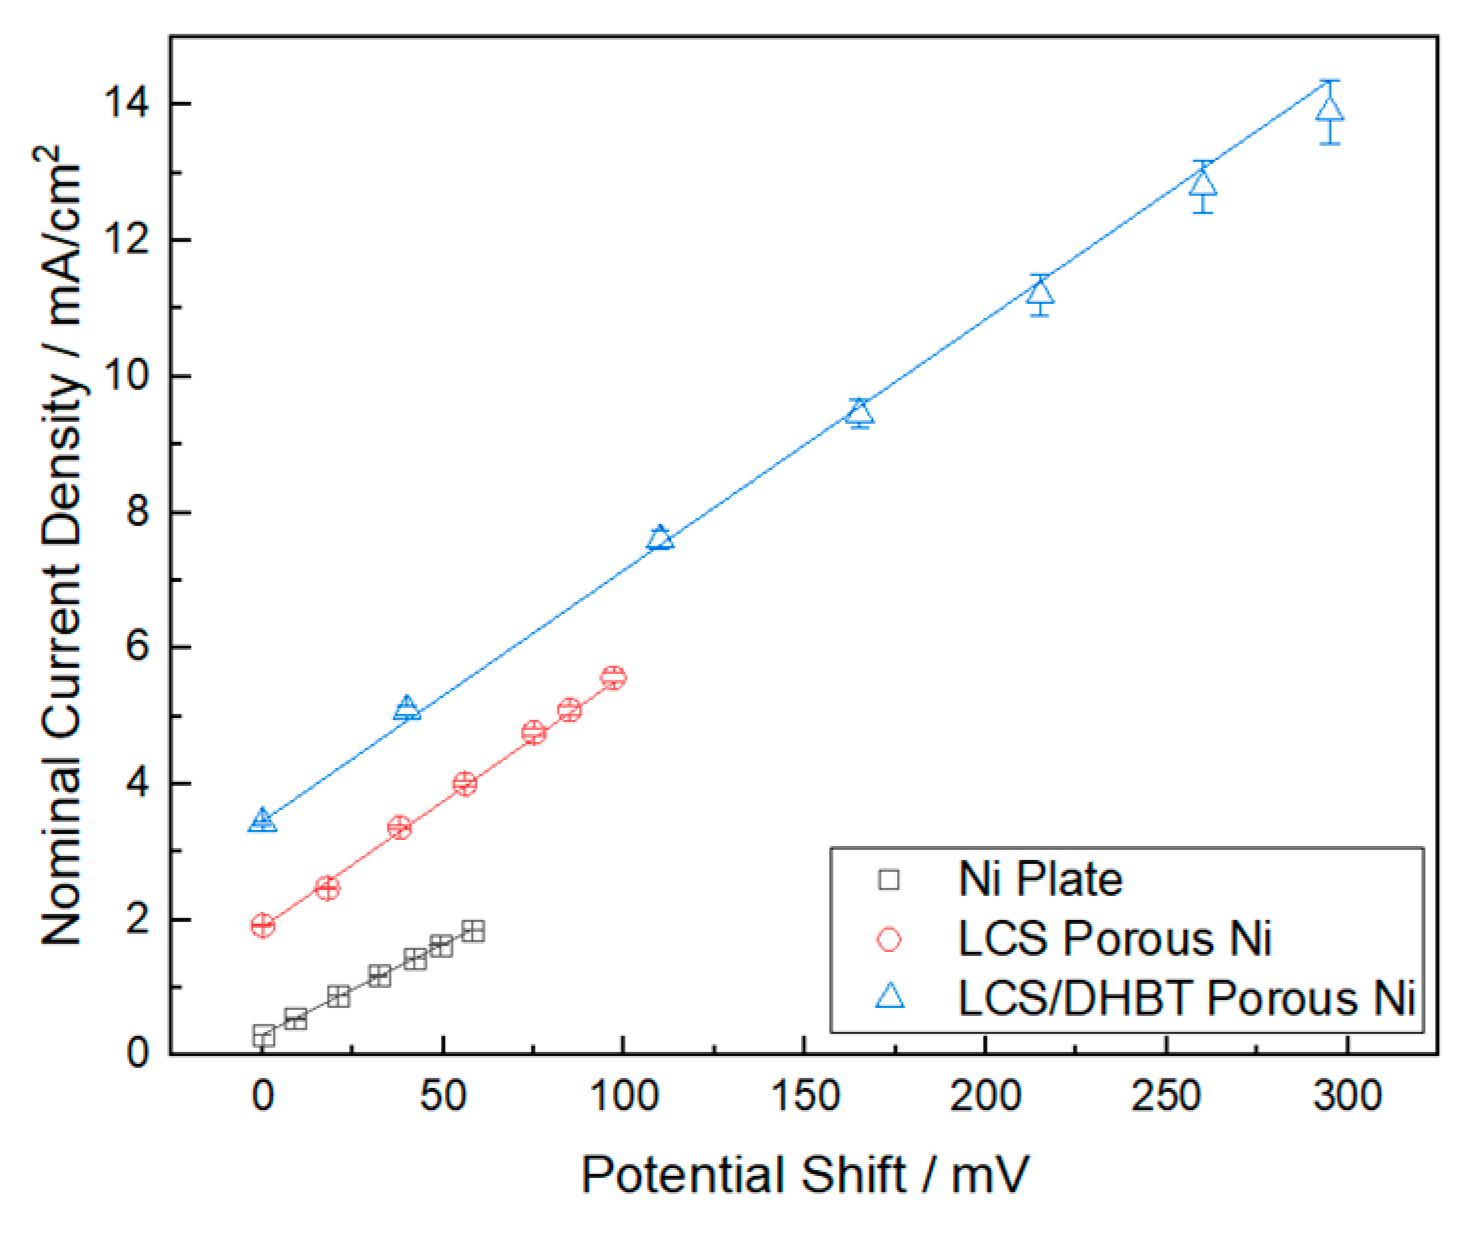
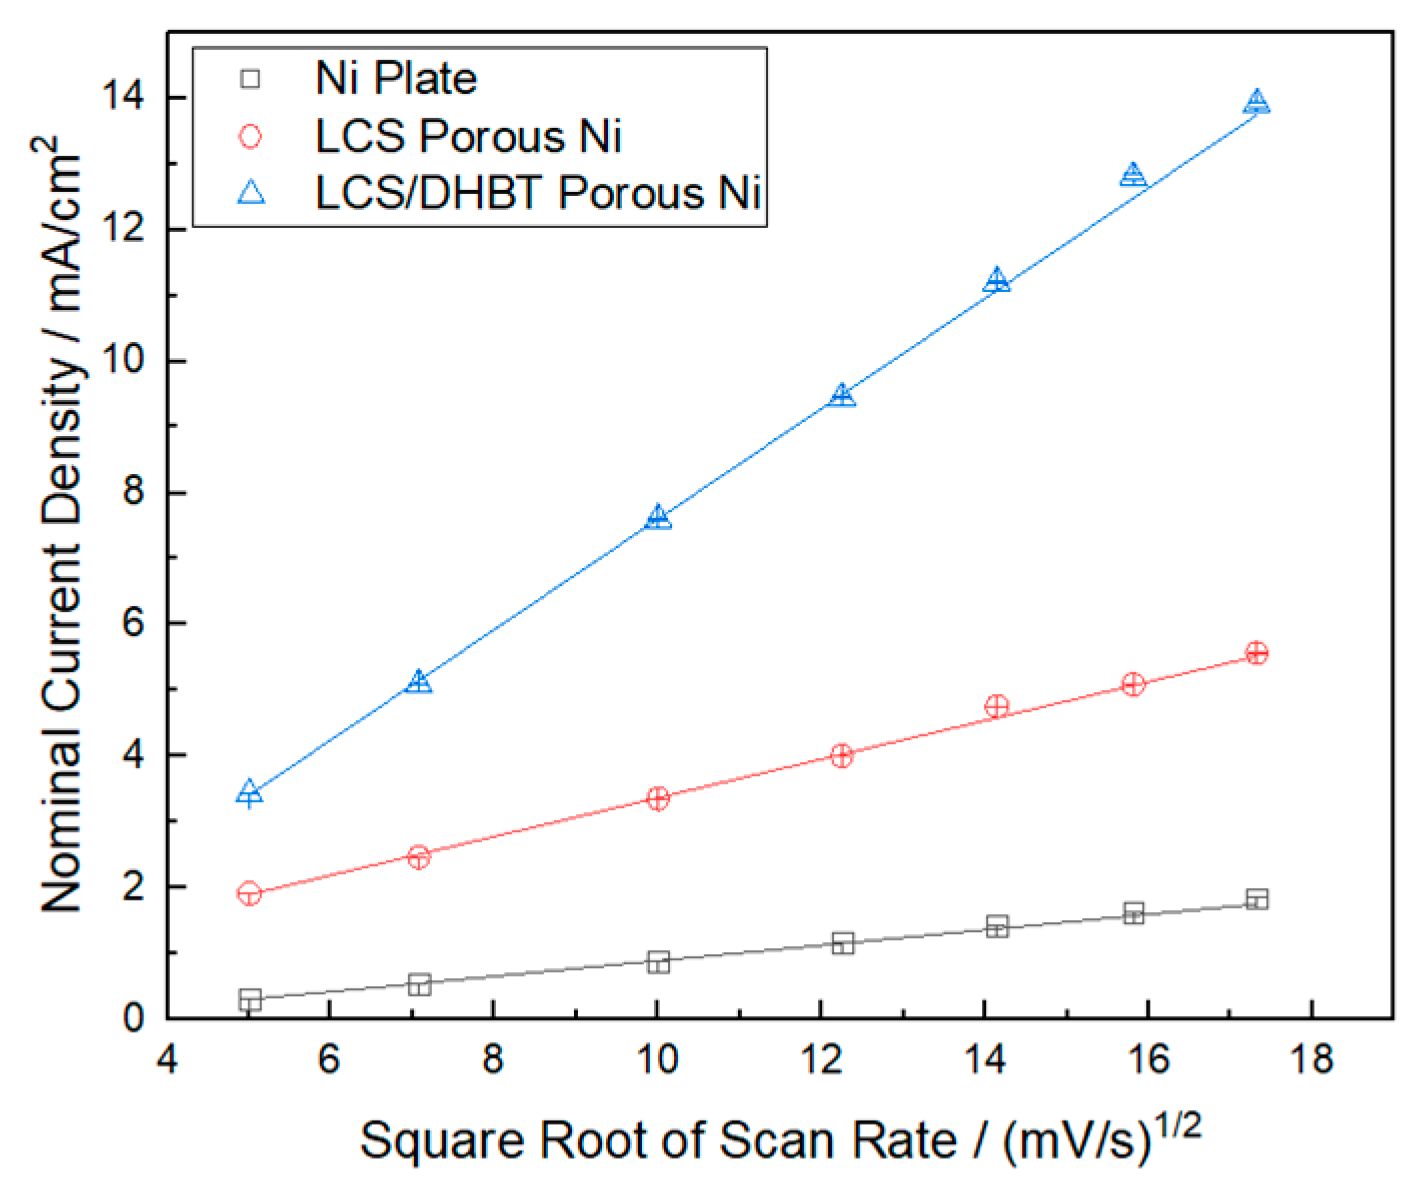
3.2. Effect of Scan Rate on Current-Potential Profile

Figure 4 shows the cyclic voltammograms of the nickel plate, the LCS porous nickel, and the LCS/DHBT porous nickel electrodes in a solution of 0.1 M KOH containing 0.5 mM glucose at scan rates in the range of 25–300 mV/s. The anodic peak occurs at a potential in the range of 0.4 to 0.8 V vs. SCE. The occurrence of the peak is due to the redox reaction of the Ni2+/Ni3+ couple on the surface of the electrode (Reactions (1)–(3)). The nominal peak current densities for the plate, the LCS, and the LCS/DHBT electrodes are in the ranges of 0.314–1.85, 1.92–5.57, and 3.43–13.94 mA/cm2, respectively. The nominal current density is calculated by dividing the current by the external surface area of the cuboid, not by the real surface area of the sample contributing to the reactions.
It is noted that the anodic peak potential shifts positively with an increasing scan rate. As the scan rate increases from 25 to 300 mV/s, the potential shifts for the nickel plate, the LCS porous nickel, and the LCS/DHBT porous nickel electrodes are 0.058, 0.097, and 0.295 V, respectively. The anodic potential shift is due to the polarization caused by the increasing scan rate. Many factors, including ohmic resistance in the three-electrode configuration, electromotive force, and the diffusional and electrochemical processes, can induce polarization [28]. The ohmic polarization caused by the ohmic resistance (inner resistance in the solution or the electrodes) is expressed by:
iR = φcathode − φanode − ΔV
where i is the current through the circuit, R is the ohmic resistance between the electrodes, φanode and φcathode are the potentials at anodic and cathodic peaks, and ΔV is the potential shift.
Figure 5 shows the anodic peak current density as a function of potential shift. The current density and potential shift have a good linear relationship, confirming that the potential shift is caused by the ohmic resistance.
Table 1 shows the anodic peak current density and potential of the plate, LCS, and LCS/DHBT nickel electrodes at different scan rates. The anodic peak current of the nickel plate electrode is in the range of 0.314 to 1.848 mA/cm2. The low current densities show that the amount of glucose taking part in the reaction is small. The potential shift of the nickel plate electrode, however, is small and within 0.06 V, showing that the hindrance to the glucose diffusion to the electrode surface is small. The uncertainties in the experimental results were analyzed by the propagation of the uncertainty method reported in [23,29]. The errors of the current measurements were estimated to be in the range of 0.07%–3.3%.
The anodic peak current density of the LCS porous nickel is in the range of 1.922 to 5.569 mA/cm2. It is higher than that for the nickel plate. However, the LCS porous nickel electrode has a high first-anodic-peak potential of 0.5 V at a slow scan rate of 25 mV/s, which is the highest among the three electrodes. A high potential indicates a high inner resistance. This is because the sintering necks formed between the nickel particles during the LCS manufacturing process and the oxides on the particle surfaces formed during the sintering result in the porous matrix having a lower electrical conductivity than a solid nickel. The potential shift of the LCS porous nickel electrode is only 0.09 V, which is similar to that of the Ni plate electrode. It shows that the LCS electrode has the same mode and rate of glucose mass transport to the electrode surface as the plate electrode.
The LCS/DHBT porous nickel electrode has the highest anodic peak current density, which is in the range of 3.428 to 13.94 mA/cm2. The high peak current densities indicate a large amount of gluconolactone (oxidized product of glucose) is formed. The LCS/DHBT electrode has a much higher first-anodic-peak potential of 0.48 V than that of the nickel plate. As the ohmic resistance of the electrolyte is the same for all three electrodes, a high anodic peak potential indicates a high inner resistance [28].
The LCS/DHBT porous nickel electrode has the largest potential shift of 0.3 V when the scan rate is increased from 25 to 300 mV/s. The increase in the potential shift is also the fastest among the three electrodes, indicating a fast increase in the ohmic resistance of the electrolyte with an increasing scan rate. The glucose diffusion from the bulk solution to the electrode surface is obviously hindered.
Figure 6 shows the variations of the andic peak current density with the square root of the scan rate for the plate, LCS, and LCS/DHBT porous nickel electrodes. The linear relationships show that the oxidation of glucose on the electrode surfaces is a diffusion-controlled process, i.e., the diffusion rate is the rate-determining step. The active species are transported to the surface of the electrode by the spontaneous concentration difference, and a diffusion layer between the bulk solution and the electrode surface is established [22].
In Figure 6, the LCS/DHBT electrode has the steepest slope, indicating a larger current density than the other two electrodes. In addition, its intercept at the y-axis is the highest, indicating that the electrode provides the best accuracy in the electrochemical measurement of glucose. The LCS porous nickel electrode has a moderate slope and its intercept at the y-axis is also higher than the plate electrode, showing that the LCS electrode has a higher reaction current than the nickel plate electrode under any given condition. The nickel plate electrode has the lowest slope and intercept among the three electrodes, which indicates a very limited accuracy of measurement. This means that nickel plate electrodes are not a good choice for the electrochemical measurement of glucose, especially when there are interferences from other species, such as ascorbic acid and uric acid, on the measurement [30].

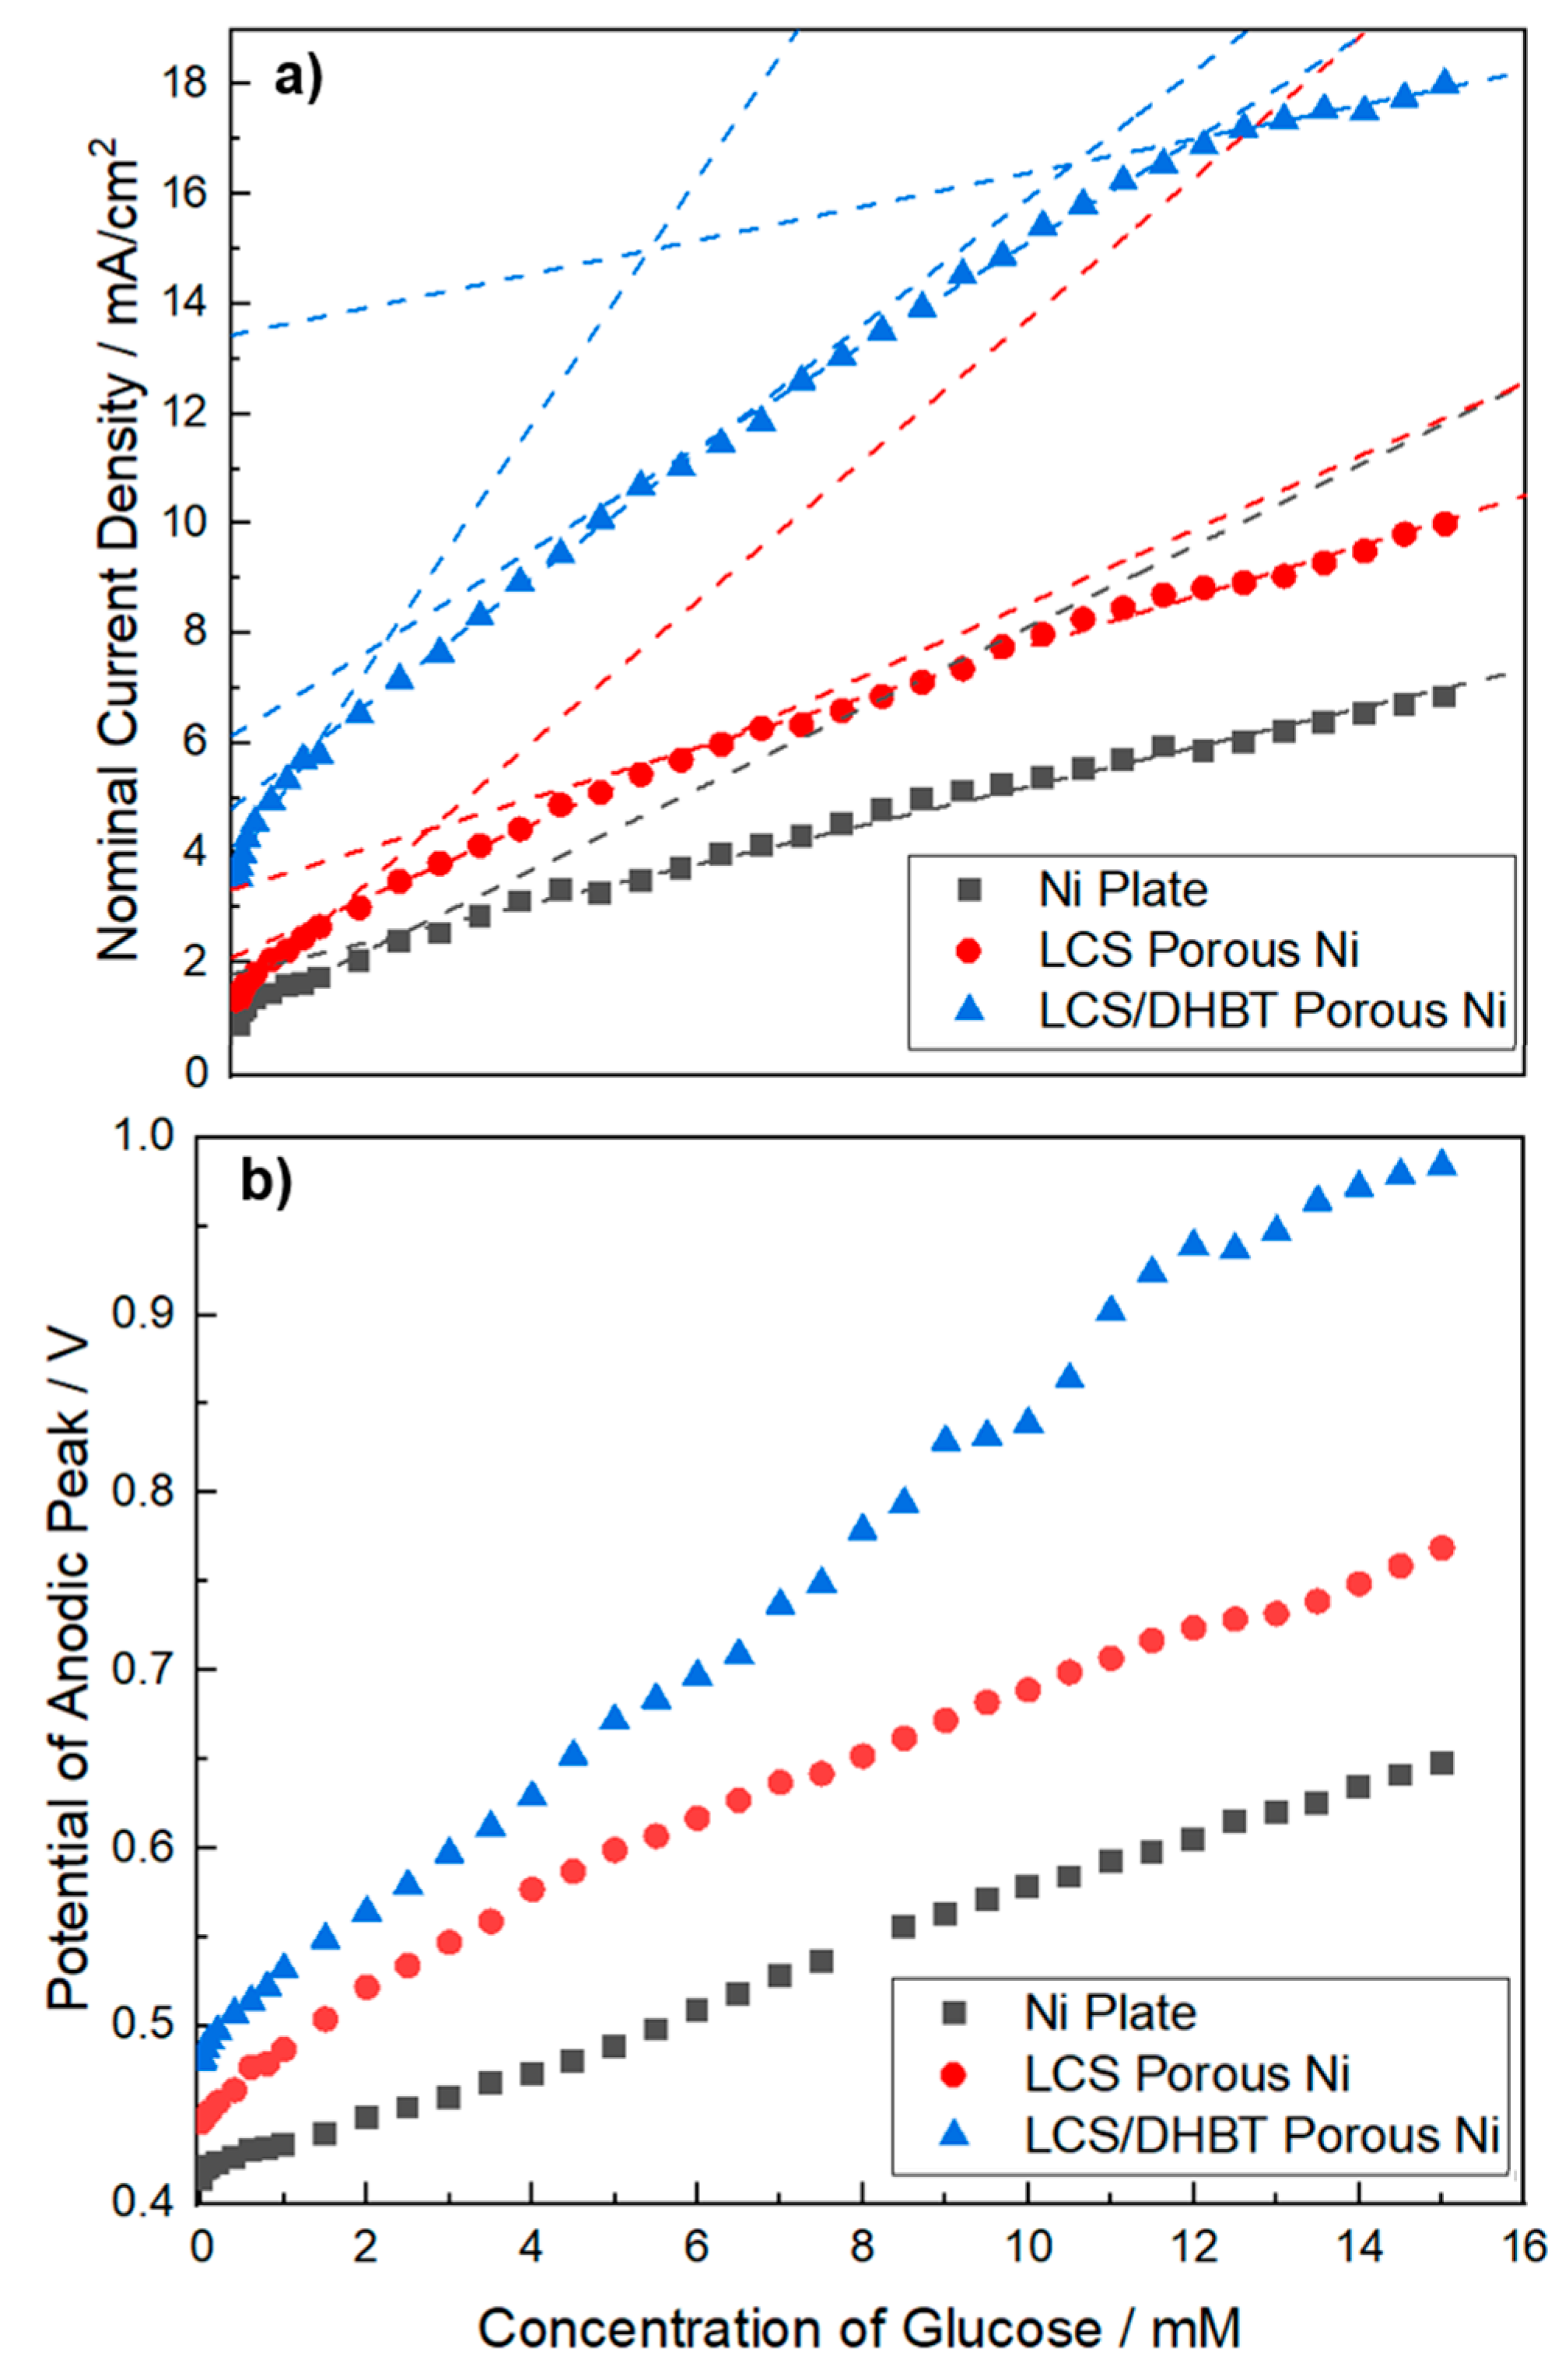
3.3. Effect of Glucose Concentration on Peak Current and Peak Potential

Figure 7 shows the variations of the anodic peak current density and potential as a function of the glucose concentration for the nickel plate, LCS porous nickel, and LCS/DHBT porous nickel electrodes. Figure 7a shows that each current vs. concentration curve can be divided into several linear segments. At any given glucose concentration, the LCS/DHBT electrode has the highest current density, up to 2.5 times that of the plate electrode and 1.6 times that of the LCS electrode. This is because the LCS/DHBT electrode has a much higher real surface area and therefore a large number of active sites for the glucose oxidation reaction. It indicates that the LCS/DHBT electrode has excellent glucose detection performance.
Table 2 shows the slope and intercept of the linear segments of the current density vs. glucose concentration curves of the porous Ni electrodes shown in Figure 7a. For the LCS/DHBT porous nickel electrode, the slope becomes gentle after increasing glucose concentration to above 12 mM. This decrease in current is due to the local exhaustion of glucose. The LCS/DHBT electrode contains some large pores and many very small pores. While the large pores can serve as reservoirs to constantly supply the reactants, the reactants in the small pores can be easily exhausted before new reactants are transported to these pores.
Figure 7b shows that the potential shifts of the plate, LCS, and LCS/DHBT electrodes at a glucose concentration of 15 mM are 0.23, 0.32, and 0.5 V, respectively. The LCS/DHBT electrode has the highest potential shift and the greatest rate of increase with an increasing glucose concentration. The anodic peak potential shift is due to the increased concentration of the reaction products in the electrolyte, which increases the resistance of the solution.

3.4. Comparison with Other Nickel Electrodes

The key parameters to assess the performance of an electrochemical sensor are the limit of detection (LOD) and sensitivity. LOD is calculated by [31]:
LOD = k σ b
where k is the expansion factor (usually = 3), σ is the population standard deviation of the blank signals, and b is the slope of the signal/concentration functional relationship (the linear part of the current vs. concentration curve). Sensitivity is expressed by:
Sensitivity = change   in   the   anodic   peak   current   change   in   the   concentration
Table 3 shows the linear ranges of the current vs. concentration curve, LOD, and sensitivity values of the plate, LCS, and LCS/GHBT nickel electrodes. The values of typical nickel electrodes in the literature are also listed for comparison. It shows that the LCS/DHBT and LCS porous nickel electrodes have good linear ranges and high sensitivity as Ni-based non-enzyme electrodes for electrochemical glucose detection.
The LOD values of the plate, LCS, and LCS/DHBT nickel electrodes are in the ranges of 0.49–7.13, 0.53–4.29, and 0.66–2.91 μΜ, respectively. The sensitivity values are 1724, 2651, and 5775 μA/cm2mM, respectively. The LCS and LCS/DHBT nickel electrodes have excellent electrocatalytic performance for glucose measurement in terms of the LOD and sensitivity, compared to the nickel plate electrode. This is because they have highly effective surface areas and highly porous structures in electrochemical measurement [23]. The LCS/DHBT porous nickel electrode, in particular, has micron- and even nano-scale nickel particles on the surface (see Figure 3a), which provides superior electrochemical properties compared to those electrodes with smooth surfaces. At the same time, the macro pores in the structure provide pathways to facilitate the mass transfer of the reactants and products to the surface of the electrolyte.
Compared to the Ni-based sensors reported in the literature, the linear detection range of glucose of the LCS/DHBT porous Ni used in this study is excellent. As we discussed above, the peak current of the glucose oxidation is hard to distinguish if it overlaps with other reactions, e.g., oxygen evolution reaction. The samples used in this study have a broad potential difference between the potential of glucose oxidation and that of oxygen evolution reaction with a slow positive potential shift, which overlaps until a high glucose concentration is reached. The LOD of the LCS/DHBT porous Ni is comparable to the other Ni-based Ni sensors. However, the LCS/DHBT porous Ni has a high sensitivity to glucose concentration detection. Even in the solution with a high glucose concentration, where the sensitivity is reduced markedly, the sensitivity of the LCS/DHBT porous Ni is higher than many other Ni-based sensors.
The LCS/DHBT porous Ni electrode was stored in air at room temperature for three days after the glucose measurements and was then re-used to measure the current in solutions with different glucose concentrations. There were no significant changes in the measured values, showing that the LCS/DHBT porous Ni has good long-term stability. While the SEM and EDX observations showed that there are no changes in surface morphology and composition after the measurements, more accurate characterization techniques, e.g., Raman spectroscopy [42,43], may be required to confirm this.
In summary, the LCS/DHBT porous Ni electrode is a relatively low-cost material with a unique porous structure, which offers many advantages. The large pores of the LCS porous structure allow the electrolyte to access the metal matrix inside the electrode, providing a fast transport of electrolyte and increasing the reaction current [22,23]. The small pores and fine features in the DHBT coating generate a large surface area, which provides a large number of active sites for reaction and increases the reaction current density. For glucose detection, it means increased sensitivity and accuracy. Therefore, the LCS/DHBT Ni electrode can serve as a non-enzyme glucose sensor capable of continuous glucose detection. It also has great potential for applications in other medical and electrochemical devices.

4. Conclusions

An LCS/DHBT porous nickel with both macropores (710–1000 μm) and microscale pores (1–25 μm) has been produced by combining the LCS and DHBT processes. The as-fabricated porous nickel has an electroactive surface area 1.18 times that of the LCS porous nickel. The anodic peak current densities for the nickel plate, the LCS porous nickel, and the LCS/DHBT porous nickel electrodes, in an electrolyte of 0.1 M KOH containing 0.5 mM glucose at scan rates in the range of 25–300 mV/s, are in the ranges of 0.314–1.85, 1.92–5.57, and 3.43–13.94 mA/cm2, respectively. Increasing the scan rate results in a higher current density and a larger anodic peak potential shift. Current density increases with glucose concentration in several linear segments. The sensitivities of the plate, the LCS, and the LCS/DHBT nickel electrodes in the glucose measurement are 1724, 2651, and 5775 μA/cm2mM, respectively. Their respective LOD values are in the ranges of 0.49–7.13, 0.53–4.29, and 0.66–2.91 μΜ. The LCS/DHBT nickel electrode shows excellent performance for glucose measurement because of its highly effective surface area.

Author Contributions

Conceptualization, Z.W. and Y.Z.; methodology and investigation, Z.W.; data analysis, Z.W. and Y.Z.; writing, Z.W.; review and editing, Y.Z. All authors have read and agreed to the published version of the manuscript.

Funding

This research received no external funding.

Institutional Review Board Statement

Not applicable.

Informed Consent Statement

Not applicable.

Data Availability Statement

Data are available upon request from the authors.

Conflicts of Interest

The authors declare no conflict of interest.

References

  1. Hwang, D.-W.; Lee, S.; Seo, M.; Chung, T.D. Recent Advances in Electrochemical Non-Enzymatic Glucose Sensors—A Review. Anal. Chim. Acta 2018, 1033, 1–34. [Google Scholar] [CrossRef] [PubMed]
  2. Ernst, S.; Heitbaum, J.; Hamann, C.H. The Electrooxidation of Glucose in Phosphate Buffer Solutions: Part I. Reactivity and Kinetics below 350 mV/RHE. J. Electroanal. Chem. Interfacial Electrochem. 1979, 100, 173–183. [Google Scholar] [CrossRef]
  3. Skou, E. The Electrochemical Oxidation of Glucose on platinum—I. The Oxidation in 1 M H2SO4. Electrochim. Acta 1977, 22, 313–318. [Google Scholar] [CrossRef]
  4. Hsiao, M.W.; Adžić, R.R.; Yeager, E.B. Electrochemical Oxidation of Glucose on Single Crystal and Polycrystalline Gold Surfaces in Phosphate Buffer. J. Electrochem. Soc. 1996, 143, 759. [Google Scholar] [CrossRef]
  5. Becerik, I.; Kadirgan, F. The Electrocatalytic Properties of Palladium Electrodes for the Oxidation of D-Glucose in Alkaline Medium. Electrochim. Acta 1992, 37, 2651–2657. [Google Scholar] [CrossRef]
  6. Guo, M.-M.; Wang, P.-S.; Zhou, C.-H.; Xia, Y.; Huang, W.; Li, Z. An Ultrasensitive Non-Enzymatic Amperometric Glucose Sensor Based on a Cu-Coated Nanoporous Gold Film Involving Co-Mediating. Sens. Actuators B Chem. 2014, 203, 388–395. [Google Scholar] [CrossRef]
  7. Xiao, Q.; Wang, X.; Huang, S. Facile Synthesis of Ni(OH)2 Nanowires on Nickel Foam via One Step Low-Temperature Hydrothermal Route for Non-Enzymatic Glucose Sensor. Mater. Lett. 2017, 198, 19–22. [Google Scholar] [CrossRef]
  8. Du, Q.; Liao, Y.; Shi, N.; Sun, S.; Liao, X.; Yin, G. Facile Synthesis of Bimetallic Metal–organic Frameworks on Nickel Foam for a High Performance Non-Enzymatic Glucose Sensor. J. Electroanal. Chem. 2022, 904, 1572–6657. [Google Scholar] [CrossRef]
  9. Long, B.; Cao, P.; Zhao, Y.; Fu, Q.; Mo, Y.; Zhai, Y.; Liu, J.; Lyu, X.; Li, T.; Guo, X.; et al. Pt1/Ni6Co1 Layered Double hydroxides/N-Doped Graphene for Electrochemical Non-Enzymatic Glucose Sensing by Synergistic Enhancement of Single Atoms and Doping. Nano Res. 2022, 16, 318–324. [Google Scholar] [CrossRef]
  10. Sg, M.; Adarakatti, P.S.; Udayakumar, V.; Almalki, A.S.A. Fabrication of Cerium Oxide and β-Ni (OH) 2 Nano Hexagonal Architectures Assembled on Reduced Graphene Oxide for Non-Enzymatic Electrochemical Detection of Glucose. Ionics 2022, 28, 1957–1972. [Google Scholar]
  11. Shu, H.; Peng, S.; Lai, T.; Cui, X.; Ren, J.; Chen, T. Nickel Foam Electrode Decorated with Fe-CdIn2O4 Nanoparticles as an Effective Electrochemical Sensor for Non-Enzymatic Glucose Detection. J. Electroanal. Chem. 2022, 919, 116524. [Google Scholar] [CrossRef]
  12. Wahab, M.A.; Hossain, S.M.A.; Masud, M.K.; Park, H.; Ashok, A.; Mustapić, M.; Kim, M.; Patel, D.; Shahbazi, M.; Hossain, M.S.A.; et al. Nanoarchitectured Superparamagnetic Iron Oxide-Doped Mesoporous Carbon Nanozymes for Glucose Sensing. Sens. Actuators B Chem. 2022, 366, 131980. [Google Scholar] [CrossRef]
  13. Sun, A.; Zheng, J.; Sheng, Q. A Highly Sensitive Non-Enzymatic Glucose Sensor Based on Nickel and Multi-Walled Carbon Nanotubes Nanohybrid Films Fabricated by One-Step Co-Electrodeposition in Ionic Liquids. Electrochim. Acta 2012, 65, 64–69. [Google Scholar] [CrossRef]
  14. Song, Y.-Y.; Zhang, D.; Gao, W.; Xia, X.-H. Nonenzymatic Glucose Detection by Using a Three-Dimensionally Ordered, Macroporous Platinum Template. Chemistry 2005, 11, 2177–2182. [Google Scholar] [CrossRef] [PubMed]
  15. Ci, S.; Huang, T.; Wen, Z.; Cui, S.; Mao, S.; Steeber, D.A.; Chen, J. Nickel Oxide Hollow Microsphere for Non-Enzyme Glucose Detection. Biosens. Bioelectron. 2014, 54, 251–257. [Google Scholar] [CrossRef] [PubMed]
  16. Sun, Q.-Q.; Wang, M.; Bao, S.-J.; Wang, Y.C.; Gu, S. Analysis of Cobalt Phosphide (CoP) Nanorods Designed for Non-Enzyme Glucose Detection. Analyst 2016, 141, 256–260. [Google Scholar] [CrossRef]
  17. Zhao, Y.Y.; Fung, T.; Zhang, L.P.; Zhang, F.L. Lost Carbonate Sintering Process for Manufacturing Metal Foams. Scr. Mater. 2005, 52, 295–298. [Google Scholar] [CrossRef]
  18. Shin, H.-C.; Dong, J.; Liu, M. Nanoporous Structures Prepared by an Electrochemical Deposition Process. Adv. Mater. 2003, 15, 1610–1614. [Google Scholar] [CrossRef]
  19. Li, Y.; Song, Y.-Y.; Yang, C.; Xia, X.-H. Hydrogen Bubble Dynamic Template Synthesis of Porous Gold for Nonenzymatic Electrochemical Detection of Glucose. Electrochem. Commun. 2007, 9, 981–988. [Google Scholar] [CrossRef]
  20. Sciortino, F.; Rydzek, G.; Grasset, F.; Kahn, M.L.; Hill, J.P.; Chevance, S.; Gauffre, F.; Ariga, K. Electro-Click Construction of Hybrid Nanocapsule Films with Triggered Delivery Properties. Phys. Chem. Chem. Phys. 2018, 20, 2761–2770. [Google Scholar] [CrossRef] [PubMed]
  21. Wang, H.; Wang, L.; Sato, T.; Sakamoto, Y.; Tominaka, S.; Miyasaka, K.; Miyamoto, N.; Nemoto, Y.; Terasaki, O.; Yamauchi, Y. Synthesis of Mesoporous Pt Films with Tunable Pore Sizes from Aqueous Surfactant Solutions. Chem. Mater. 2012, 24, 1591–1598. [Google Scholar] [CrossRef]
  22. Zhu, P.; Zhao, Y. Effects of Electrochemical Reaction and Surface Morphology on Electroactive Surface Area of Porous Copper Manufactured by Lost Carbonate Sintering. RSC Adv. 2017, 7, 26392–26400. [Google Scholar] [CrossRef] [Green Version]
  23. Diao, K.K.; Xiao, Z.; Zhao, Y.Y. Specific Surface Areas of Porous Cu Manufactured by Lost Carbonate Sintering: Measurements by Quantitative Stereology and Cyclic Voltammetry. Mater. Chem. Phys. 2015, 162, 571–579. [Google Scholar] [CrossRef] [Green Version]
  24. Bard, A.J.; Faulkner, L.R. Electrochemical Methods: Fundamentals and Applications. Surf. Technol. 1983, 20, 91–92. [Google Scholar]
  25. Zhu, P.; Zhao, Y. Cyclic Voltammetry Measurements of Electroactive Surface Area of Porous Nickel: Peak Current and Peak Charge Methods and Diffusion Layer Effect. Mater. Chem. Phys. 2019, 233, 60–67. [Google Scholar] [CrossRef]
  26. Moldenhauer, J.; Meier, M.; Paul, D.W. Rapid and Direct Determination of Diffusion Coefficients Using Microelectrode Arrays. J. Electrochem. Soc. 2016, 163, 672. [Google Scholar] [CrossRef]
  27. Darayen, J.; Chailapakul, O.; Praserthdam, P.; Panpranot, J.; Tungasmita, D.N.; Boonyongmaneerat, Y. Porous Electrodeposited Cu as a Potential Electrode for Electrochemical Reduction Reactions of CO2. Appl. Sci. 2021, 11, 11104. [Google Scholar] [CrossRef]
  28. Pu, X.; Zhao, D.; Fu, C.; Chen, Z.; Cao, S.; Wang, C.; Cao, Y. Understanding and Calibration of Charge Storage Mechanism in Cyclic Voltammetry Curves. Angew. Chem. Int. Ed. Engl. 2021, 60, 21310–21318. [Google Scholar] [CrossRef]
  29. Holman, J.P. Experimental Methods for Engineers; McGraw Hill: New York, NY, USA, 2012. [Google Scholar]
  30. Ko, C.-Y.; Huang, J.-H.; Raina, S.; Kang, W.P. A High Performance Non-Enzymatic Glucose Sensor Based on Nickel Hydroxide Modified Nitrogen-Incorporated Nanodiamonds. Analyst 2013, 138, 3201–3208. [Google Scholar] [CrossRef]
  31. Desimoni, E.; Brunetti, B. About Estimating the Limit of Detection by the Signal to Noise Approach. Pharm. Anal. Acta. 2015, 6, 355. [Google Scholar]
  32. Wang, Z.; Hu, Y.; Yang, W.; Zhou, M.; Hu, X. Facile One-Step Microwave-Assisted Route towards Ni Nanospheres/reduced Graphene Oxide Hybrids for Non-Enzymatic Glucose Sensing. Sensors 2012, 12, 4860–4869. [Google Scholar] [CrossRef] [Green Version]
  33. Lu, L.-M.; Zhang, L.; Qu, F.-L.; Lu, H.-X.; Zhang, X.-B.; Wu, Z.-S.; Huan, S.-Y.; Wang, Q.-A.; Shen, G.-L.; Yu, R.-Q. A Nano-Ni Based Ultrasensitive Nonenzymatic Electrochemical Sensor for Glucose: Enhancing Sensitivity through a Nanowire Array Strategy. Biosens. Bioelectron. 2009, 25, 218–223. [Google Scholar] [CrossRef]
  34. Niu, X.; Lan, M.; Zhao, H.; Chen, C. Highly Sensitive and Selective Nonenzymatic Detection of Glucose Using Three-Dimensional Porous Nickel Nanostructures. Anal. Chem. 2013, 85, 3561–3569. [Google Scholar] [CrossRef]
  35. Yi, Q.; Huang, W.; Yu, W.; Li, L.; Liu, X. Hydrothermal Synthesis of Titanium-Supported Nickel Nanoflakes for Electrochemical Oxidation of Glucose. Electroanalysis 2008, 20, 2016–2022. [Google Scholar] [CrossRef]
  36. Cao, F.; Guo, S.; Ma, H.; Shan, D.; Yang, S.; Gong, J. Nickel Oxide Microfibers Immobilized onto Electrode by Electrospinning and Calcination for Nonenzymatic Glucose Sensor and Effect of Calcination Temperature on the Performance. Biosens. Bioelectron. 2011, 26, 2756–2760. [Google Scholar] [CrossRef]
  37. Liu, Y.; Teng, H.; Hou, H.; You, T. Nonenzymatic Glucose Sensor Based on Renewable Electrospun Ni Nanoparticle-Loaded Carbon Nanofiber Paste Electrode. Biosens. Bioelectron. 2009, 24, 3329–3334. [Google Scholar] [CrossRef]
  38. Nie, H.; Yao, Z.; Zhou, X.; Yang, Z.; Huang, S. Nonenzymatic Electrochemical Detection of Glucose Using Well-Distributed Nickel Nanoparticles on Straight Multi-Walled Carbon Nanotubes. Biosens. Bioelectron. 2011, 30, 28–34. [Google Scholar] [CrossRef]
  39. Lu, W.; Qin, X.; Asiri, A.M.; Al-Youbi, A.O.; Sun, X. Ni Foam: A Novel Three-Dimensional Porous Sensing Platform for Sensitive and Selective Nonenzymatic Glucose Detection. Analyst 2013, 138, 417–420. [Google Scholar] [CrossRef]
  40. Wang, L.; Zhang, Y.; Yu, J.; He, J.; Yang, H.; Ye, Y.; Song, Y. A Green and Simple Strategy to Prepare Graphene Foam-like Three-Dimensional Porous carbon/Ni Nanoparticles for Glucose Sensing. Sens. Actuators B Chem. 2017, 239, 172–179. [Google Scholar] [CrossRef]
  41. Ensafi, A.A.; Ahmadi, N.; Rezaei, B. Nickel Nanoparticles Supported on Porous Silicon Flour, Application as a Non-Enzymatic Electrochemical Glucose Sensor. Sens. Actuators B Chem. 2017, 239, 807–815. [Google Scholar] [CrossRef]
  42. Malka, D.; Berkovic, G.; Tischler, Y.; Zalevsky, Z. Super-Resolved Raman Spectra of Toluene and Toluene–Chlorobenzene Mixture. Spectrosc. Lett. 2015, 48, 431–435. [Google Scholar] [CrossRef]
  43. Malka, D.; Berke, B.A.; Tischler, Y.; Zalevsky, Z. Improving Raman Spectra of Pure Silicon Using Super-Resolved Method. J. Opt. 2019, 21, 075801. [Google Scholar] [CrossRef]
Figure 1. A typical current-potential plot of redox reaction of ferrocyanide [25].
Coatings 13 00290 g001
Figure 2. Micrographs of (a) the LCS (optical, cross-section), (b) the LCS/DHBT (optical, cross-section), and (c) the LCS/DHBT (SEM, surface) porous nickel samples.
Coatings 13 00290 g002
Figure 3. SEM graphs and EDX spectra of LCS/DHBT porous Ni before (a,b) and after (c,d) glucose measurement.
Coatings 13 00290 g003
Figure 4. Cyclic voltammograms of (a) the plate nickel, (b) the LCS porous nickel, and (c) the LCS/DHBT porous nickel electrodes in the solution of 0.1 M KOH and 0.5 mM glucose at scan rates of 25–300 mV/s.
Coatings 13 00290 g004
Figure 5. Relationship between anodic peak current density and potential shift for the plate, LCS, and LCS/DHBT nickel electrodes.
Coatings 13 00290 g005
Figure 6. Variations of current density with the square root of scan rate for the plate, LCS, and LCS/DHBT nickel electrodes.
Coatings 13 00290 g006
Figure 7. (a) Anodic peak current density and (b) potential as a function of glucose concentration for the plate, LCS, and LCS/DHBT nickel electrodes.
Coatings 13 00290 g007
Table 1. Anodic current density and potential for plate, LCS, and LCS/DHBT nickel electrodes at different scan rates.
Scan Rate(V/s)PlateLCSLCS/DHBT
Current Density
(mA/cm2)
Potential
(V)
Current Density
(mA/cm2)
Potential
(V)
Current Density
(mA/cm2)
Potential
(V)
0.0250.314 ± 0.00020.421.922 ± 0.0090.503.428 ± 0.0280.48
0.050.546 ± 0.00070.432.474 ± 0.0140.525.09 ± 0.0620.52
0.10.885 ± 0.0020.443.363 ± 0.0270.547.597 ± 0.1370.58
0.151.176 ± 0.0030.454.013 ± 0.0380.559.448 ± 0.2120.64
0.21.436 ± 0.0050.464.762 ± 0.0540.5711.22 ± 0.2980.70
0.251.644 ± 0.0060.475.094 ± 0.0620.5812.84 ± 0.3980.73
0.31.848 ± 0.0080.485.569 ± 0.0740.5913.94 ± 0.4590.78
Table 2. Linear ranges of the current density vs. glucose concentration curves of the plate, LCS, and LCS/DHBT porous Ni electrodes and their slopes and intercepts.
Ni ElectrodesLinear Range (mM)SlopeInterceptR2
Ni plate0–10.631.130.953
2–150.341.880.992
LCS porous Ni0–11.191.500.987
1–60.672.090.995
4–150.463.160.993
LCS/DHBT porous Ni0–12.343.920.970
1–61.144.810.996
4–120.945.880.997
12–150.33130.953
Table 3. Comparison of electrochemical properties of Ni-based electrodes for non-enzymatic glucose measurement.
MaterialLinear Range
(mM)
LOD
(μM)
Sensitivity
(μA/cm2mM)
Reference
Ni nanospheres/RGO0.001–0.11N/A813[32]
Ordered Ni nanowire arrays0.0005–70.11043[33]
3D porous Ni networks0.0005–40.0072900[34]
Ni-MWCNT3.2–17.50.9867.19[13]
Ni nanoflake/Ti plate0.05–0.61.27320[35]
NiO microfiber/FTO0.001–0.270.0331785.41[36]
Ni nanoparticle/C fiber mixtureUp to 2.551420.4[37]
Ni nanoparticle 0.001–10.051438[38]
Ni foam0.05–7.352.2N/A[39]
Ni nanoparticle on porous GF0.015–6.454.8207.3[40]
Ni nanoparticle on porous Si0.002–50.2N/A[41]
Ni plate 0–10.491724This work
2–157.13568
LCS porous nickel0–10.532651This work
1–62.151374
4–154.29839
LCS/DHBT porous nickel0–10.435775This work
1–61.832781
4–122.911686
12–150.661297
Note: RGO—reduced graphene oxide, MWCNT—multiwalled carbon nanotubes, FTO—fluorine tin oxide, GF—graphene foam.
Disclaimer/Publisher’s Note: The statements, opinions and data contained in all publications are solely those of the individual author(s) and contributor(s) and not of MDPI and/or the editor(s). MDPI and/or the editor(s) disclaim responsibility for any injury to people or property resulting from any ideas, methods, instructions or products referred to in the content.

