Article

Investigation of Evolution of Microstructure, Mechanical Properties, and Corrosion Resistance of Novel Al-Mg-Si-Ag Alloy

1
MCC Heavy Industry (Tangshan) Co., Ltd., Tangshan 063000, China
2
College of Mechanical Engineering, Yanshan University, Qinhuangdao 066004, China
*
Author to whom correspondence should be addressed.
Coatings 2023, 13(12), 2012; https://doi.org/10.3390/coatings13122012
Submission received: 2 November 2023 / Revised: 17 November 2023 / Accepted: 21 November 2023 / Published: 28 November 2023

Abstract

:
In this paper, the evolution of the microstructure, mechanical properties, and intergranular corrosion (IGC) resistance of an Al-Mg-Si-Ag alloy is systematically investigated. For the as-cast alloy, the microstructure consists of the Mg2Si phase and Mg32(Al, Ag)49 phase. In the isothermal aging process, the novel alloy presents a significant age hardening effect. The ultimate tensile strength (UTS) and yield strength (YS) of the peak-aged alloy are 342 MPa and 231 MPa, respectively, which are 53 MPa and 84 MPa higher than that of the as-quenched alloy. The main strengthening phase at the peak-aged stage of the alloy is the MgAg phase, which has a body-centered cubic structure with a lattice constant of a = 0.33 nm. In addition, the IGC resistance of the peak-aged alloy is worse than that of other aged alloys. The corresponding microstructure of GBPs of the peak-aged alloy is more consecutive, and this is the main reason for the deterioration of IGC resistance of the alloy.

1. Introduction

Currently, 5xxx aluminum alloys (Al-Mg based alloys) are widely used in fields such as automobiles and ships due to their low density, high corrosion resistance, high specific strength, and good welding performance [1,2,3]. However, the strength of 5xxx aluminum alloys is greatly limited owing to the non-heat-treatable feature [4,5,6].
The main strengthening methods for 5xxx aluminum alloys are solid solution strengthening and work hardening. To increase the solid solution strengthening effect and improve the strength of the alloy, the Mg content in the alloy can be increased. However, increasing the Mg content promotes the continuous precipitation of the β-Al3Mg2 phase at grain boundaries, significantly reducing the intergranular corrosion resistance of the alloy [7,8]. Additionally, cold working is used to enhance the work hardening effect of the alloy. The accumulation of deformation dislocations promotes the continuous precipitation of the β phase along grain boundaries or sub-grain boundaries, significantly reducing the corrosion resistance of the alloy [9].
There are two main approaches to simultaneously enhancing the strength and corrosion resistance of 5xxx aluminum alloys. One is through alloying to promote the precipitation of nanoscale strengthening phases, including the addition of elements such as Cu, Zn and Ag to facilitate aging precipitation. The other approach is to optimize the aging process route and regulate the intra-grain strengthening phases and grain boundary microstructure to simultaneously improve strength and corrosion resistance. The principle of synchronously improving the strength and corrosion resistance of 5xxx aluminum alloys through alloying is to use elements such as Cu, Zn, and Ag to promote the segregation of atomic clusters and the nucleation and precipitation of strengthening phases within the crystal of the 5xxx aluminum alloy, thereby improving the aging strengthening effect of the alloy. At the same time, the strengthening phase within the crystal disperses and precipitates, consuming a large number of solute atoms that are solidly soluble, thereby suppressing grain boundaries β phases. The nucleation and precipitation of phases improve the corrosion resistance of the alloy. Austrian scholar Stemper et al. [10,11] used in situ transmission electron microscopy combined with first-principles calculations to study the mechanism of Zn and Cu elements, promoting the aging precipitation of 5xxx aluminum alloys. The results showed that Cu can increase the stability of solute clusters, thereby promoting the precipitation of T′ phase Mg32(Al, Zn)49 and improving the age-hardening effect of the alloy. The maximum tensile strength of the alloy can reach 550 MPa, but its corrosion performance has not been reported.
To improve the age hardening effect of 5xxx aluminum alloys, a few additions of Zn [12,13], Cu [14], and Si [15] can promote the precipitation of the MgZn2, Al2CuMg, and Mg2Si phases. Unlike the heat-treatable 2xxx, 6xxx, and 7xxx alloys, the ratio of Mg/Cu, Zn, and Si in 5xxx aluminum alloys is >1. Pan et al. [16] reduced the potential difference between grain boundary precipitates and the matrix by increasing the ratio of the 5xxx aluminum alloy (Zn + Cu)/Mg, which can improve the strength of the alloy while ensuring a good corrosion performance. The maximum intergranular corrosion depth of the alloy can be reduced to 25 μm.
Recently, the influence of Ag on the precipitation behavior of 5xxx and 6xxx alloys has been reported. Ag forms Mg-Ag clusters with Mg atoms during the aging process, and the high binding energy between Ag and vacancies increases the stability of the GP region, thereby promoting the precipitation of a large number of nanoscale T-Mg32(Al, Ag)49 phases in the crystal, significantly improving the strength of the alloy. The yield strength of the 5083-aluminum alloy with the addition of 0.6 wt% Ag reaches 237 MPa, which is 85 MPa higher than that of traditional 5083 aluminum alloy [17,18]. In addition, the alloying of Ag can not only improve the age-strengthening effect of 5xxx aluminum alloy, but also consume Mg and Ag atoms in the matrix due to the precipitation of a large number of nanoscale T phases in the crystal, thereby inhibiting the nucleation and precipitation of grain boundary phases and improving the intergranular corrosion resistance of the alloy. Therefore, it is feasible to use microalloying to synchronously improve the strength and corrosion performance of 5xxx series aluminum alloys. The interaction of Mg, Si, and Ag promotes the formation of solute clusters and GP zones, which provide nucleation sites for nanoscale particles [19,20]. However, the evolution of its composition and the structure of precipitates in the Al-Mg-Si-Ag alloy has not been identified yet.
In this paper, a novel 5xxx aluminum alloy with a few Si and Ag additions is investigated in detail. The evolution of precipitation behavior during isothermal aging is elucidated by atomic resolution HAADF-STEM. Meanwhile, the influences of isothermal aging on the mechanical properties and intergranular corrosion (IGC) resistance of the novel Al-Mg-Si-Ag alloy are discussed in detail.

2. Materials and Methods

An alloy ingot with a composition of Al-4.7Mg-0.6Si-0.6Ag (wt.%) was prepared in an induction furnace. The ingot was homogenized at 520 °C for 12 h. After this, the alloy ingot was hot-rolled to 5 mm and cold-rolled to 2 mm. The cold-rolled sheet was processed by solution heat treatment at 560 °C for 30 min, followed by water quenching. The isothermal aging was carried out at 180 °C for 0–48 h; first, the temperature was raised from room temperature to 180 °C at the rate of 10 °C/min, and the holding time was 0 h, 0.5 h, 1 h, 2 h, 4 h, 8 h, 12 h, 24 h, 36 h, and 48 h, respectively.
An electric spark cutting machine was used to process the hardness and tensile strength of samples of a certain size according to standards, and the longest edge of the sample was cut along the rolling direction. To ensure a smooth and clean surface of the hardness sample, it was necessary to pretreat the sample before conducting the hardness test; we ground them with 600#, 1000#, and 2000# sandpaper under aqueous conditions. The hardness of the investigated alloy was measured by a Vickers hardness instrument (Qness, Q10A+, Golling an der Salzach, Austria) with a load of 500 g and a dwelling time of 10 s. To ensure the accuracy of the data, the hardness values in this paper are the average of seven data points. A CSS-44100-type universal testing machine (Changchun Testing Machine Factory, Changchun, China) was employed for the tensile testing. The gauge size of the tensile specimens is 50 mm × 12.5 mm. The tensile rate is 2 mm/min, and the initial strain rate is 6 × 10⁻⁴ s−1. The tensile test was repeated three times to ensure reliability.
The ultra-plus SSX-550-type SEM (Shimadzu Company, Kyoto, Japan) and JEM-ARM200F TEM (JEOL, Kyoto, Japan, an accelerating voltage of 200 kV) were employed for the microstructural characterization. The specific test method was as follows: Prepare the SEM and TEM samples via standard cutting. The SEM samples were ground with 600#, 1000#, 2000#, and 2000# SiC sandpaper in an aqueous environment, and then they were polished with a 3 µm diamond polishing solution and a 0.02 µm silica polishing solution in a mixture of 10% perchloric acid and 90% alcohol solution. The samples were electropolished at 25 V for 30 s. The microstructure of the sample was characterized by electron backscatter diffraction, using an ultra-plus SSX-550-type scanning electron microscope (SEM), and subsequent photos were taken. The data were then processed using the Aztec Crystal software 3.1. We mechanically ground and polished the TEM samples to 80 µm, punched out a thin sheet with a diameter of 3 mm, and performed double jet thinning at −25 °C. We took TEM images by observing the microstructure of the sample at the center and edge positions, using a JEM-ARM200F transmission electron microscope.
Nitric acid mass loss testing (NAMLT) was carried out to evaluate the IGC resistance. According to ASTM G67-04 [21], the sensitivity of materials to intergranular corrosion is evaluated based on the weight loss per unit area of the sample before and after intergranular corrosion testing. According to the standard regulations, the required sample size for the experiment is 50 mm × 6 mm × thickness (50 mm is the rolling direction of the material), with three parallel samples. Before the experiment, each surface of the sample was ground with 320# sandpaper to the same roughness, and then the sample size was measured (with an accuracy of 0.02 mm), the surface area was calculated, and the surface oil stains were washed with alcohol or acetone. Then, the sample was immersed in a 5 wt% sodium hydroxide solution at 80 °C for 1 min; subsequently, it was removed, washed with distilled water, and then immersed it in a concentrated nitric acid solution with a concentration of 70–72 wt% for 30 s. The sample was washed with distilled water, dried, and weighed to the nearest 0.1 mg. Finally, the sample was immersed completely in a concentrated nitric acid solution of 70–72 wt%, and the solution was kept in a constant temperature water bath at 30 ± 0.1 °C for 24 h. After taking out the sample, it was rinsed with water, completely removing any particles adhered to the surface with a brush; then, the sample was dried in air and weighed, and the mass loss per unit area before and after corrosion was calculated, expressed in mg/cm2.
A CORRTEST CS310M electrochemical workstation was used for the electrochemical test. The size of the surface of the test sample was 1.0 cm2. Before testing, the surface of the sample was polished until smooth with 2000# sandpaper. During the testing process, a three-electrode system was employed. The counter electrode (CE) was a platinum sheet, and the reference electrode was a saturated calomel electrode (SCE). The electrolyte was a 3.5 wt.% NaCl aqueous solution. Open-circuit potential testing was performed on the electrolyte for 900 s. A potentiodynamic polarization curve was tested with a scan rate of 2 mV⋅s−1 and a potential range of −0.25 V~−1.25 V. An electrochemical impedance spectrum (EIS) was recorded in the frequency range of 100 kHz to 100 mHz with a voltage amplitude of 5 mV, and the number of points per decade was 10 points. At least three replicates were tested to ensure reliability.

3. Results and Discussion

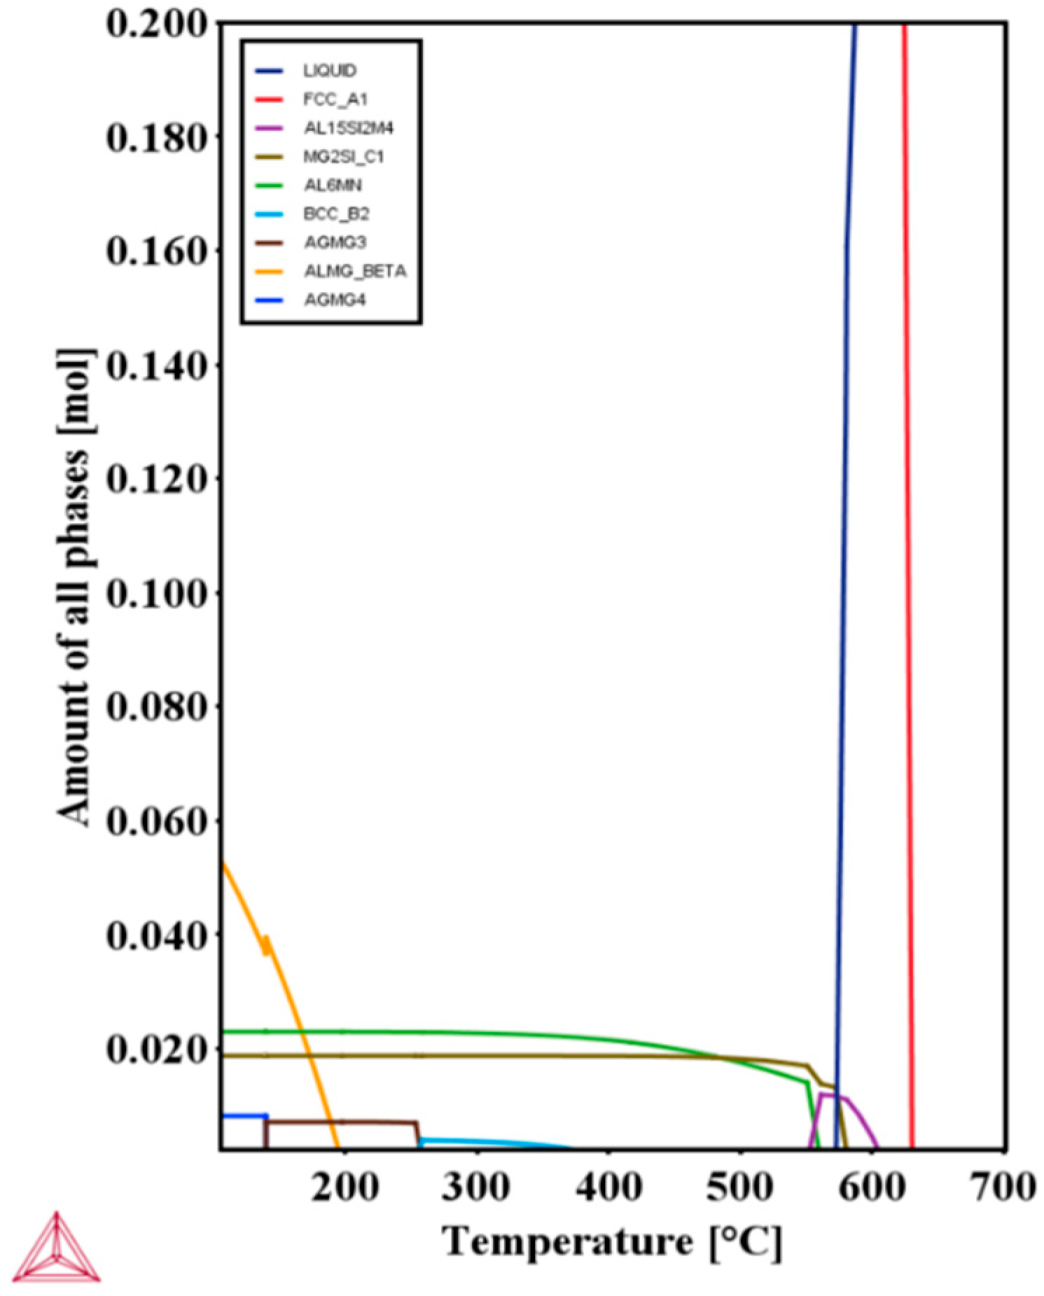
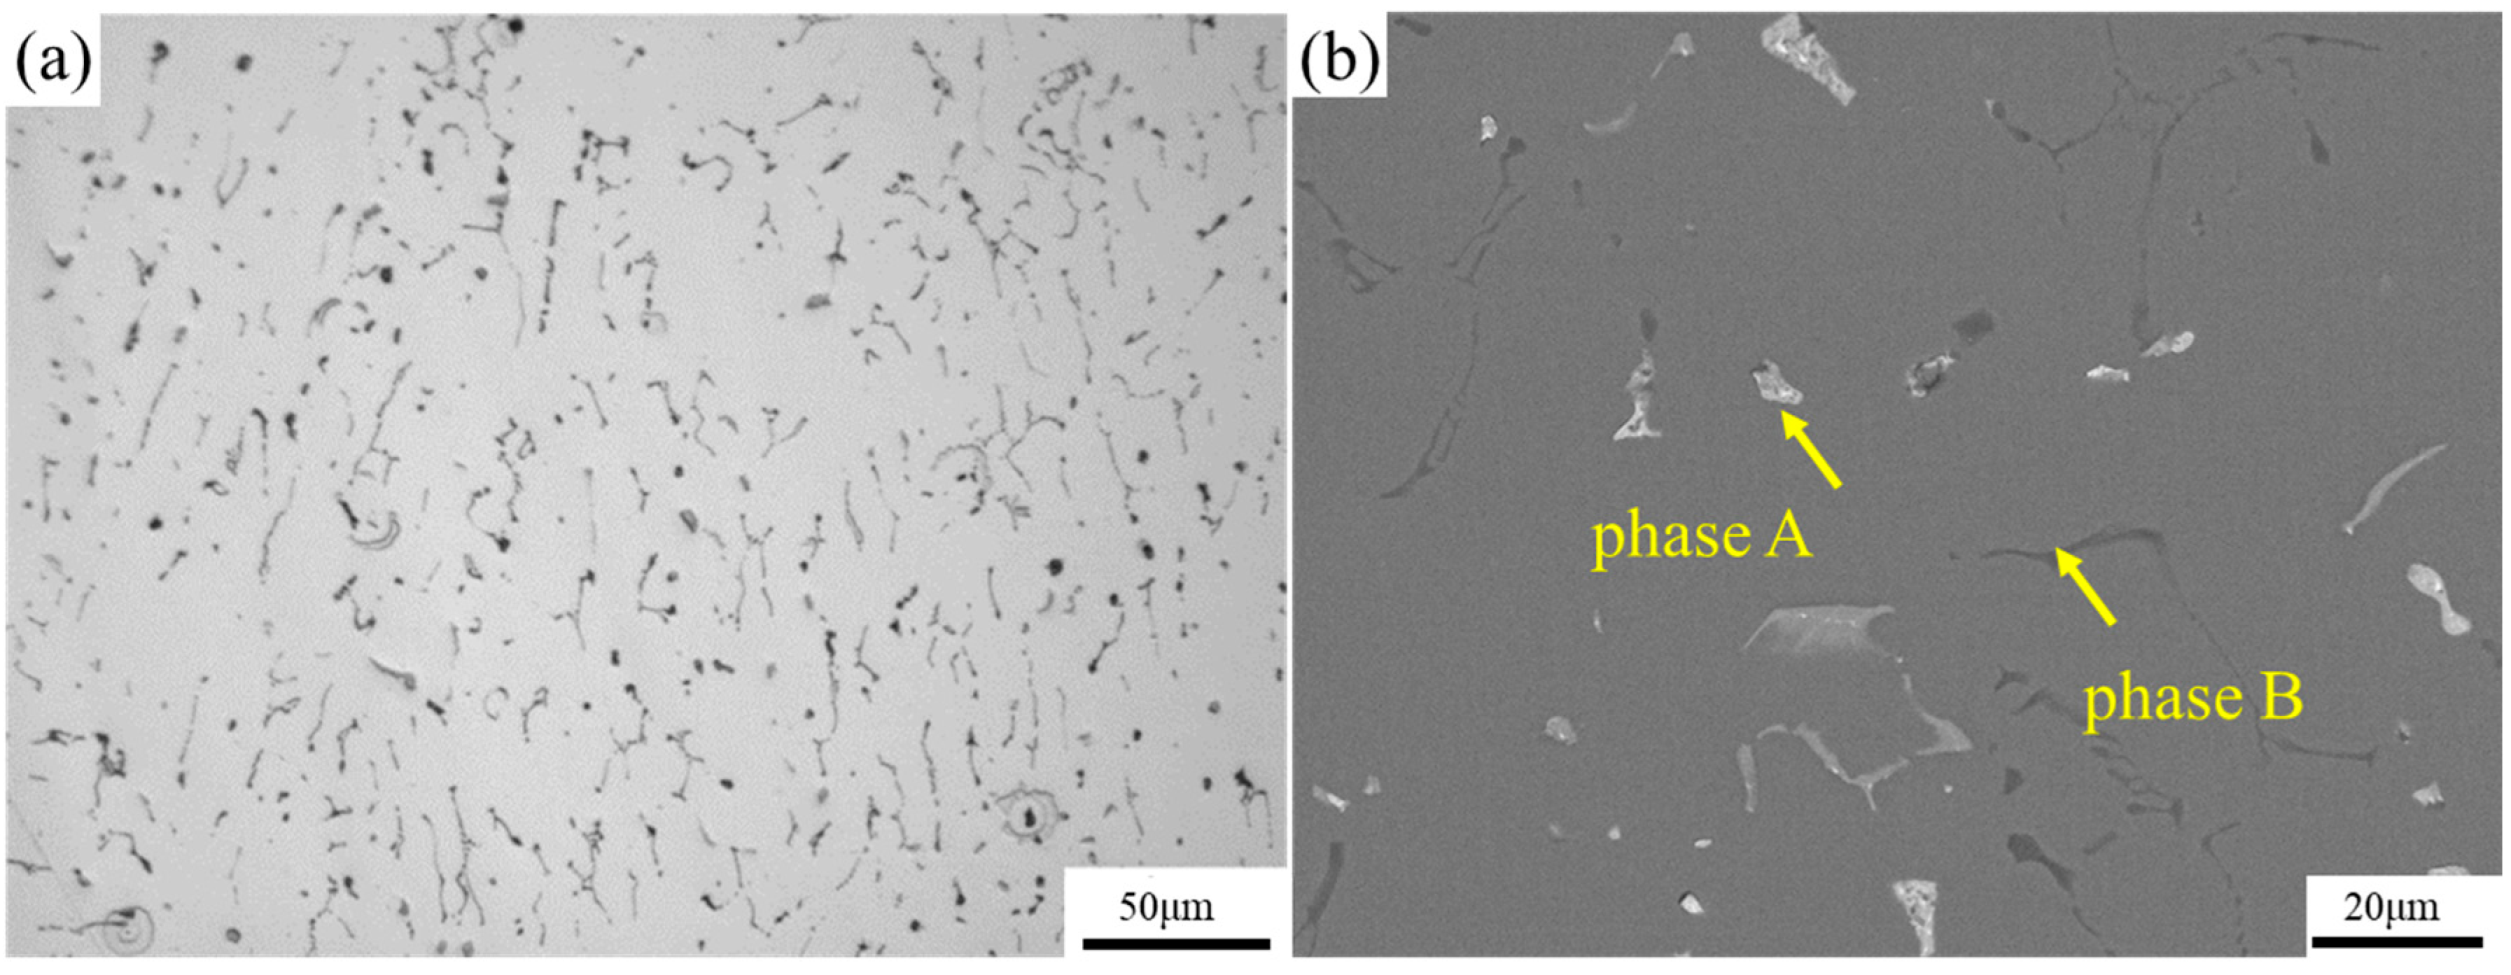
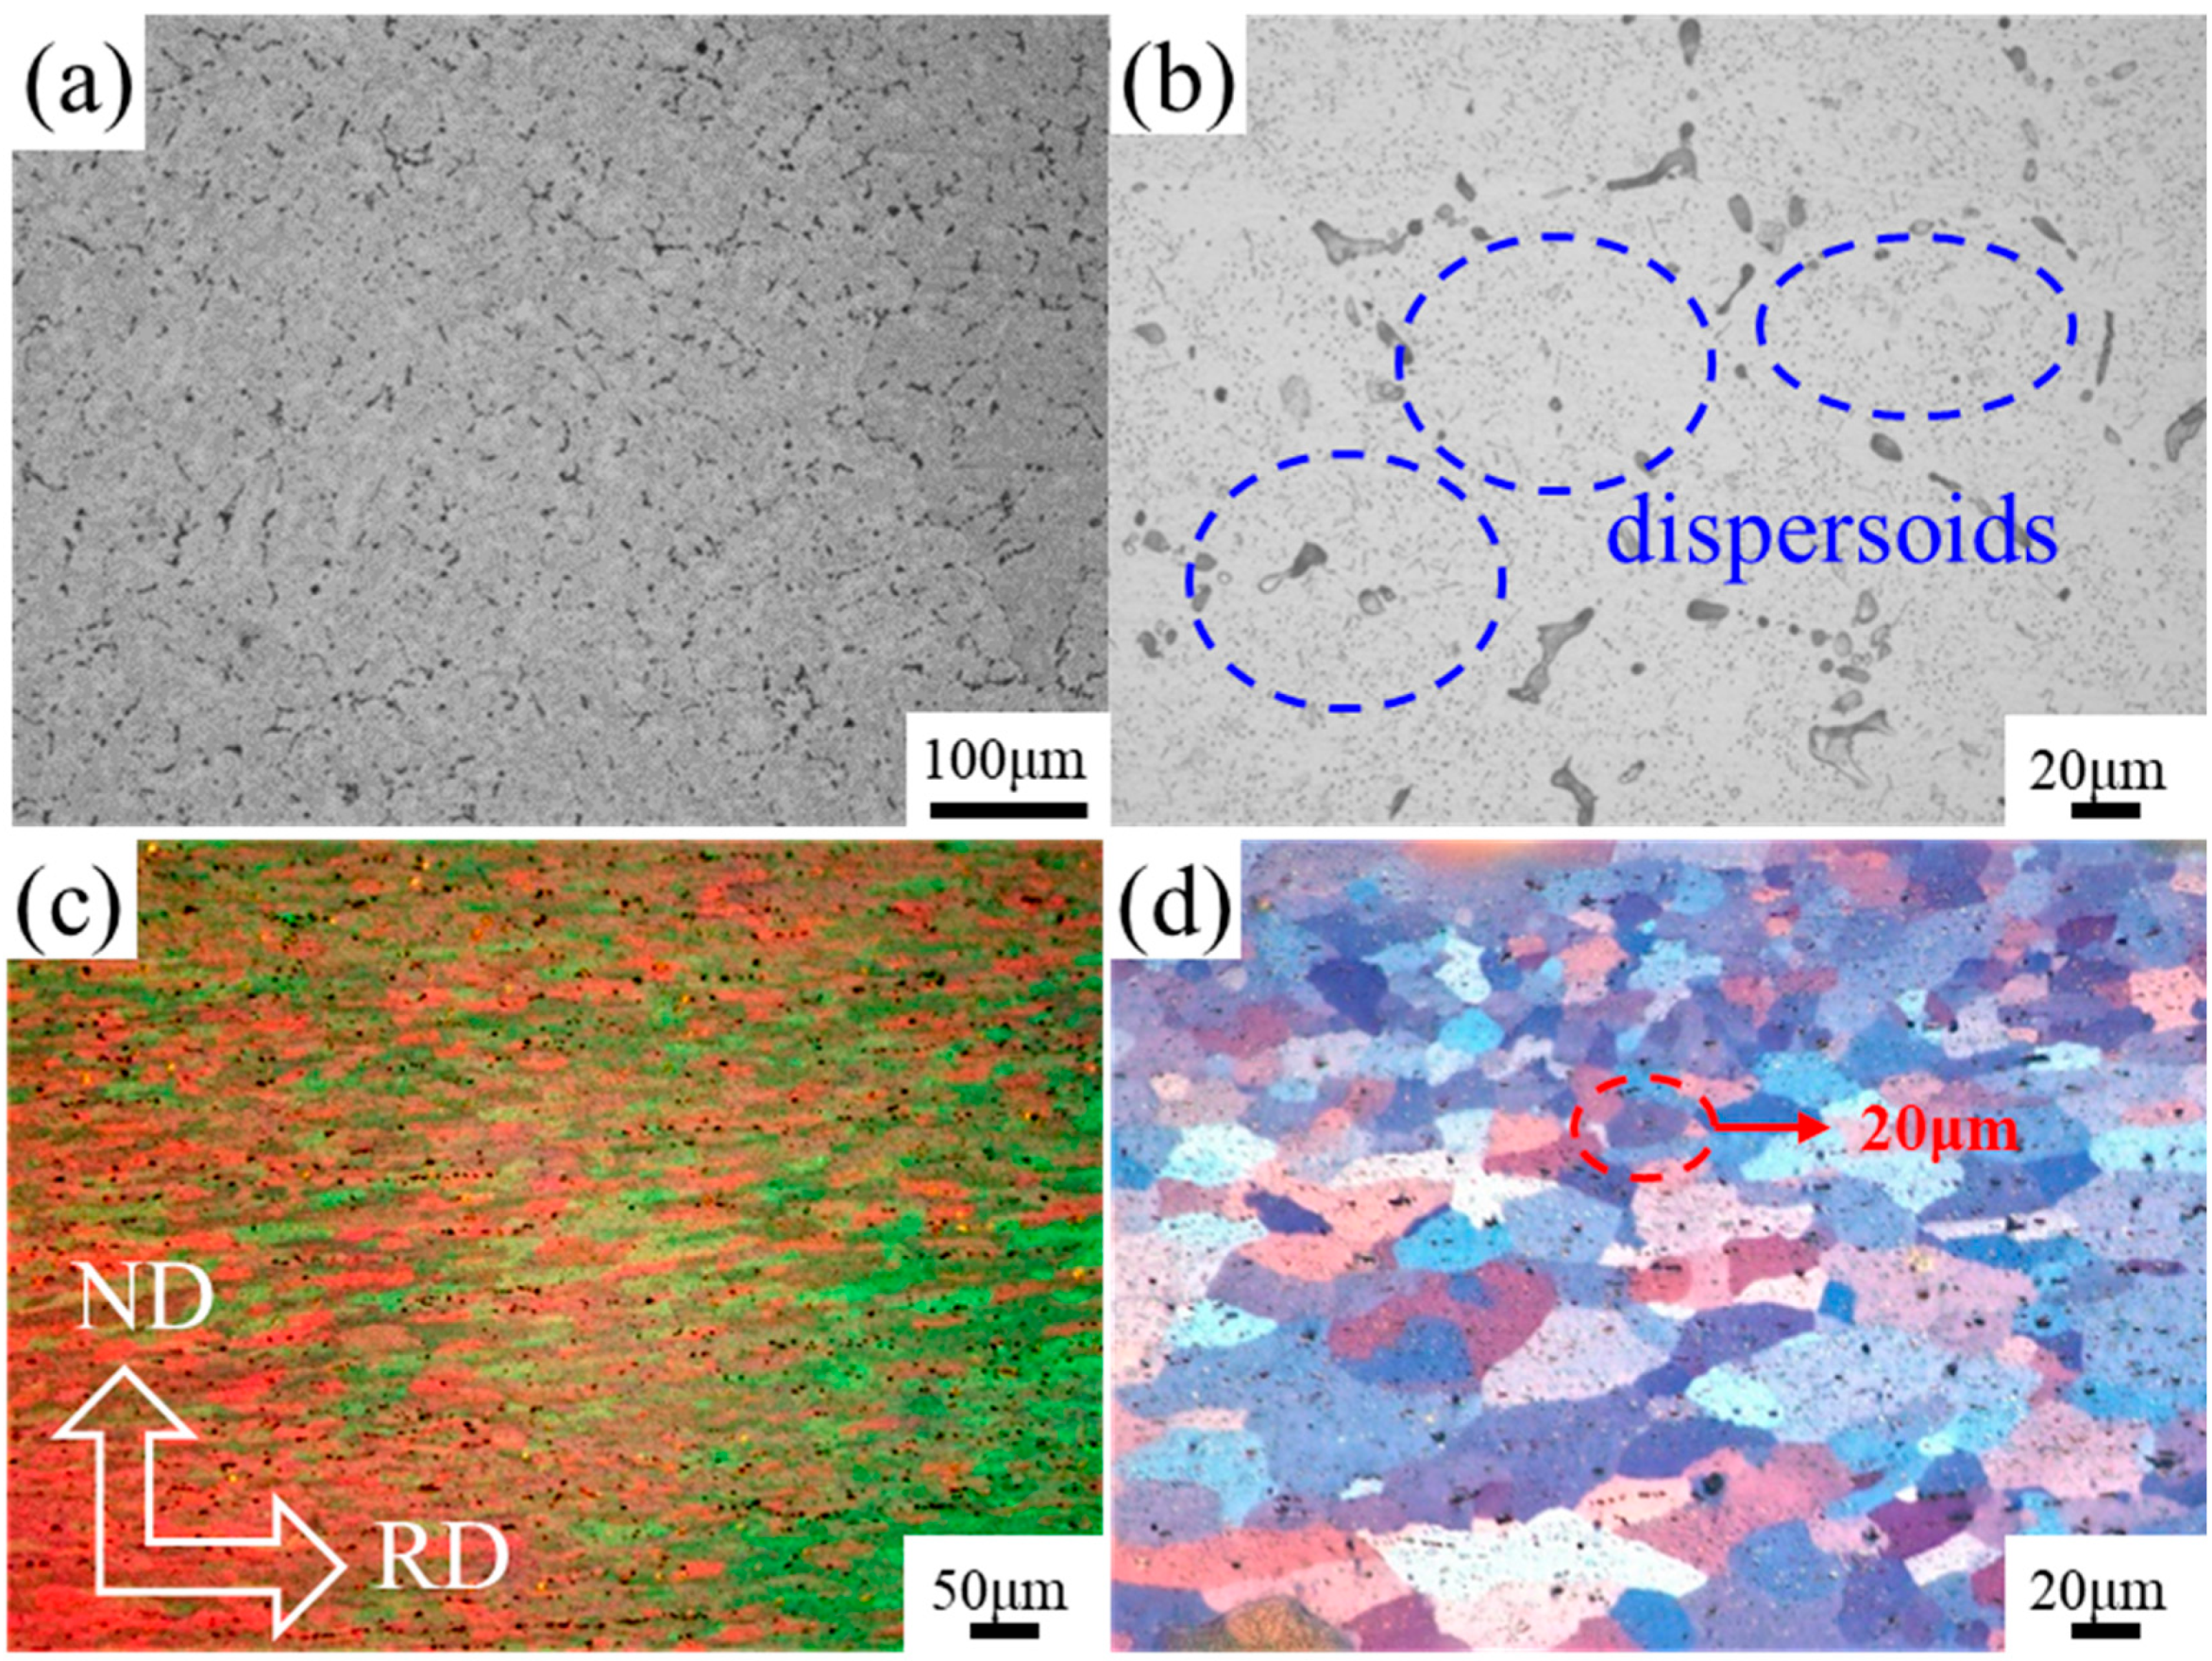
3.1. Evolution of the Microstructure during Processing

Figure 1 shows the phase composition and phase fraction of the Al-4.7Mg-0.6Si-0.6Ag alloy at the different heat treatment temperatures, which were calculated using Thermo-Calc software 2019. It is obvious that the precipitates of the alloy mainly include the Mg2Si and Mg-Ag phases.
Figure 2 shows the as-cast microstructure of the investigated Al-4.7Mg-0.6Si-0.6Ag alloy. As shown in Figure 2a, the microstructure contains many stripe-like precipitates which connect to the network structure. A corresponding SEM image is shown in Figure 2b. It is obvious that the secondary phases comprise two different phases. Phase A is brighter in contrast, while phase B is darker in contrast. Table 1 presents the EDS results of the investigated phases marked by yellow arrows in Figure 2b. Phase A mainly contains Mg, Al, and Ag elements, which can be speculated to be the Mg32(Al, Ag)49 phase [22]. For phase B, the composition mainly consists of Mg, Al, and Si elements and can be speculated to be the Mg2Si phase [23]. Based on the results above, the phases in the as-cast microstructure are mainly the Mg2Si and Mg32(Al, Ag)49 phases.
Figure 3a,b show the OM images of the alloy after homogenization at 520 °C for 12 h. Compared with the as-cast alloy, the distribution of phases in the as-homogenized alloy is more uniform, as shown in Figure 3a. In addition, a lot of fine-scale dispersoids precipitate from the matrix, as marked by blue dashed lines in Figure 3b. On the one hand, homogenization treatment promotes the dissolution of a non-equilibrium eutectic structure, making the distribution of the second phase more uniform. At the same time, this can promote the precipitation of solute atoms in the as-cast microstructure, forming a uniform distribution of dispersoids.
Polarized light pictures which can reflect the grain size of the alloy are presented in Figure 3c,d. For the as-rolled alloy, as shown in Figure 3c, the grains exhibit a fibrous stripe structure along the rolling direction. After the solution heat treatment, the alloy undergoes complete recrystallization, and the grain morphology of the alloy changes from a fibrous stripe structure to an equiaxed grain, with a grain size of 10–20 μm.

3.2. Evolution of the Mechanical Properties and Aging Precipitates

After the solution heat treatment, the alloy was isothermally aged at 180 °C for 0–48 h. Figure 4a shows the evolution of hardness of the investigated alloy against the aging time. For the as-quenched alloy, the hardness is about 75 HV. In the aging process, it is obvious that the alloy presents a remarkable age-hardening effect, as the hardness increases greatly as the aging times increases. The peak hardness of the aged alloy was 109.4 ± 3.0 HV when the alloy was aged at 180 °C for 8 h. This reflects that the addition of Si and Ag in the Al-Mg-based alloys can contribute to the precipitation of nanophases during the alloy aging process, thus improving the age-strengthening effect of the alloy.
The corresponding tensile test results are shown in Figure 4b. For the as-quenched alloy, the ultimate tensile strength (UTS) is 289 MPa, while the yield strength (YS) is 147 MPa. For the peak-aged alloy, the UTS and YS increase to 342 MPa and 231 MPa, an increase of 18% and 57%, respectively. With the further increase in aging time, the strength of the alloy decreases and reaches the over-aged stage. At this stage, the UTS and YS of the alloy are 279 MPa and 178 MPa, respectively. Compared with the mechanical properties and corrosion resistance of the Al-Mg-Si-Ag alloy under the different heat treatment processes in the existing articles [24,25], the strengthening effect of the alloy in this study is more obvious.
To elucidate the hardening mechanism of the investigated Al-Mg-Si-Ag alloy, the evolution of the aging precipitates is shown in Figure 5 and Figure 6. For the under-aged alloy, finer-scale dot-like particles are uniformly distributed in the α-Al matrix, as shown in Figure 5a. These particles can be speculated as GP zones which maintain a coherent relationship with the matrix. At this stage, there is lattice distortion between the GP region and the aluminum matrix, which exhibits a significant hardening response. For the peak-aged alloy, the volume fraction of precipitates increases greatly, while their grain size maintains a finer scale (Figure 5b). At this stage, the nanoscale precipitates can hinder the dislocation movement during plastic deformation and improve the strength of the alloy significantly.
To clarify the crystal structure of the precipitates at the peak-aged stage, atomic-resolution HAADF-STEM images and corresponding FFT patterns of the nanoscale precipitates are shown in Figure 6. Based on the Figure 6a, the precipitates present a size of about 2–5 nm. Figure 6b,c show the atomic arrangement and crystal structure of the aging precipitates. Due to the positive correlation between the contrast of the atomic column in the atomic-resolution HAADF-STEM image and the square of the atomic number, the arrangement of solute atoms in the precipitates can be reflected clearly in this image. It is obvious that the precipitate has a periodic atomic arrangement and still maintains a coherent relationship with the matrix, as is shown in Figure 6b. Furthermore, columns of Ag can be easily identified, as Ag’s atomic number is much higher than that of the other elements. According to the arrangement of Ag/Mg columns and FFT pattern (Figure 6d), the precipitates have a body-centered cubic structure and can be identified as the Mg-Ag phase (a = 0.33 nm). Due to the strong binding energy between the Ag atoms and quenched vacancies, diffusion of the vacancies drives the Ag atoms to segregate and form solute clusters in the early stages of aging. With the increase in aging time, the solute clusters gradually transform into GP zones, as is shown in Figure 5a. At the peak-aged stage, a large number of GP regions serve as nucleation sites for strengthening phases, promoting the precipitation of strengthening phases during the peak aging stage. These strengthening phases inhibit the dislocation movement during the plastic deformation of the alloy and improve the strength of the alloy, thereby significantly improving the age-strengthening effect of the alloy.
For the over-aged alloy, the size of the precipitates becomes coarser with the diffusion of solute atoms, as shown in Figure 6c. At this stage, the obstruction response of the coarse precipitates relative to the dislocations decreases. As a result, the strength of the alloy begins to decrease.
To elucidate the alloying element distribution under peak-aged conditions of the investigated Al-Mg-Si-Ag alloy, the elemental mapping via EDS is shown in Figure 7. In the peak-aged stage, it is obvious that the composition mainly consists of Mg, Si, Ag, and Al elements for different precipitates, and these can be speculated to be the Mg2Si and Mg32(Al, Ag)49 phases. This is consistent with the inferred results of the precipitated phases above.

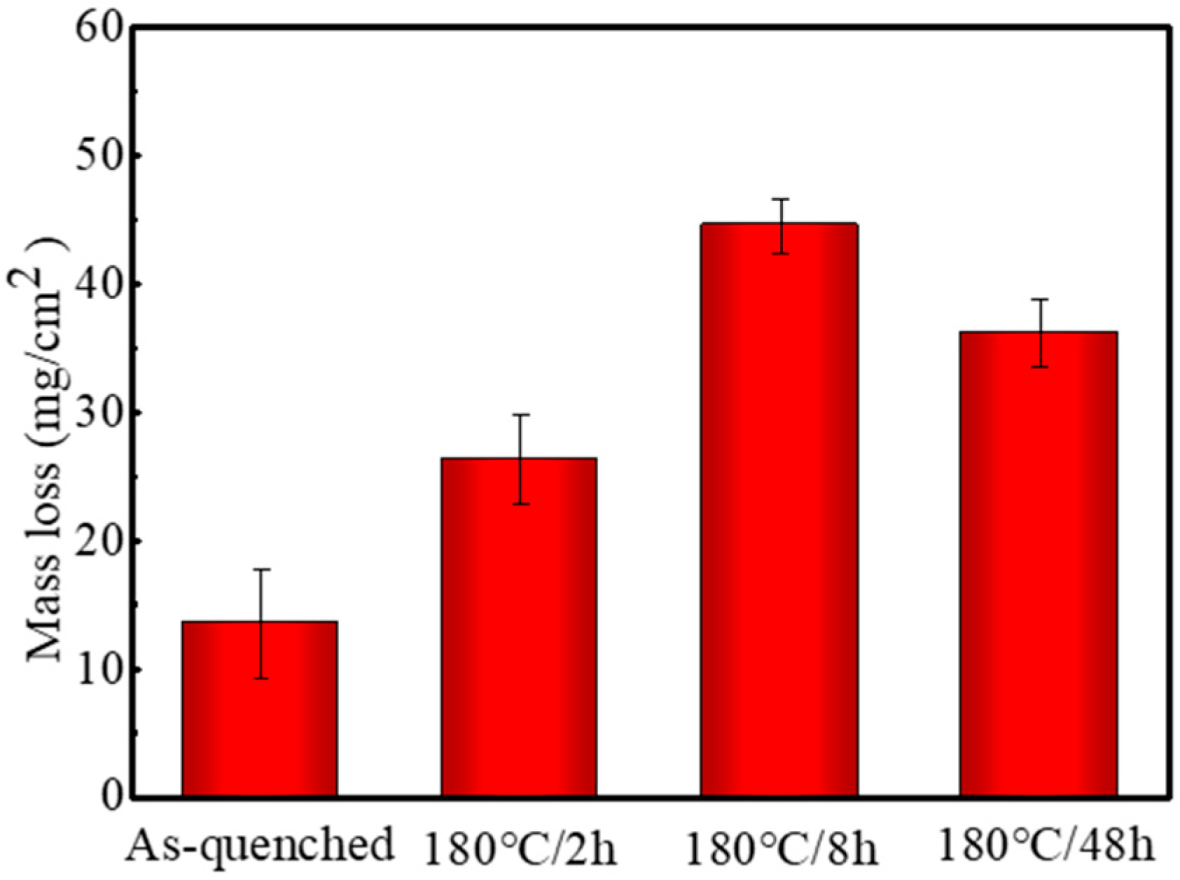
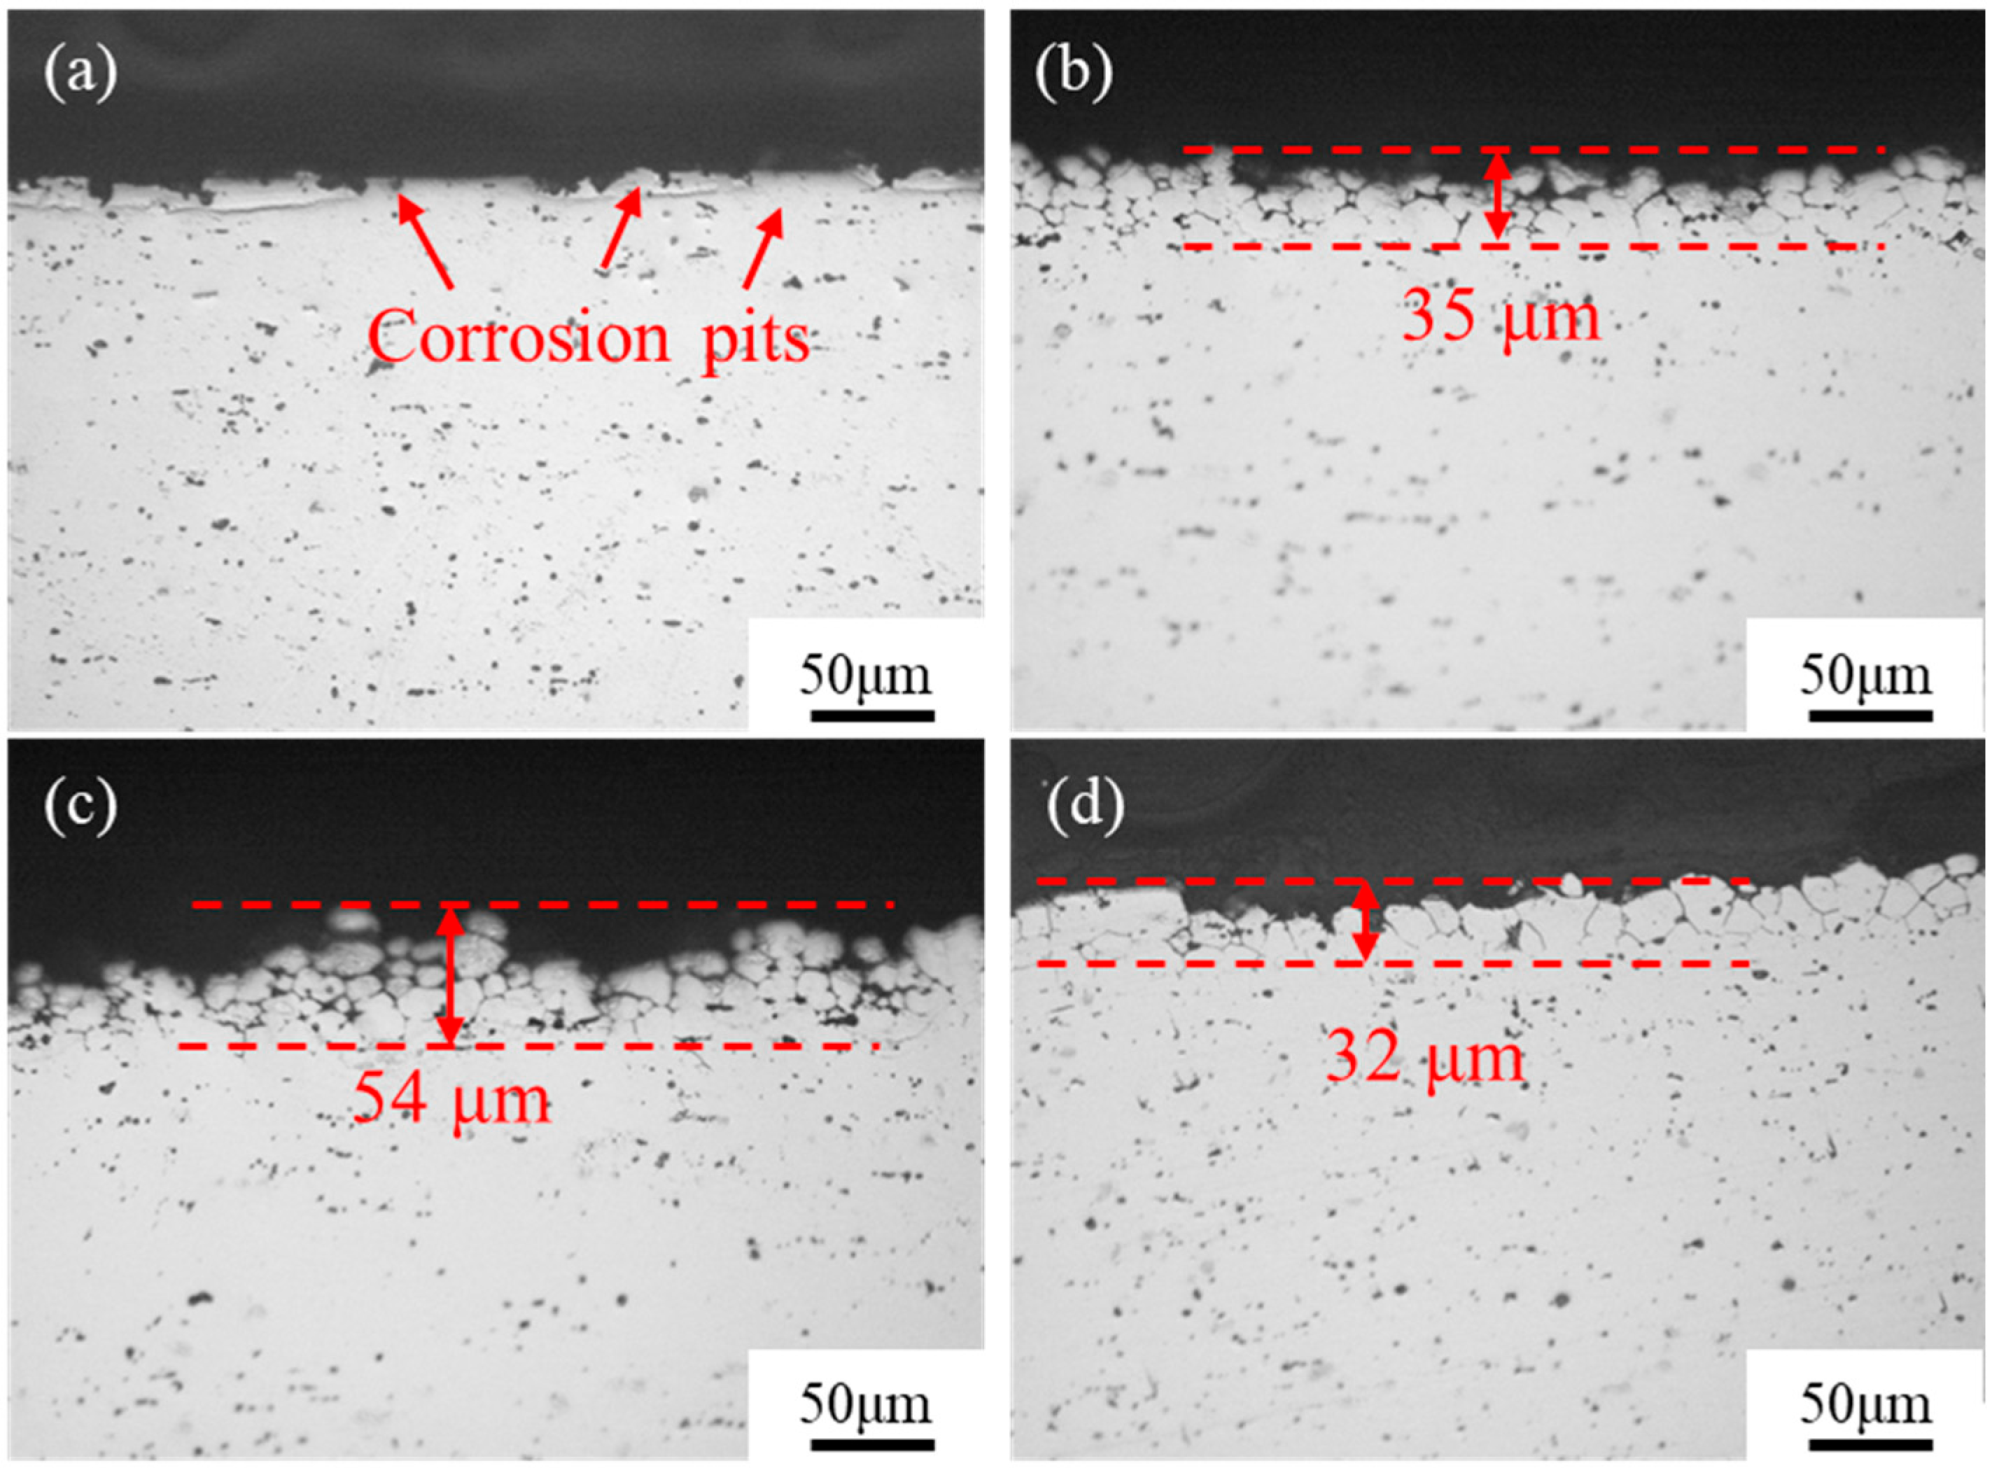
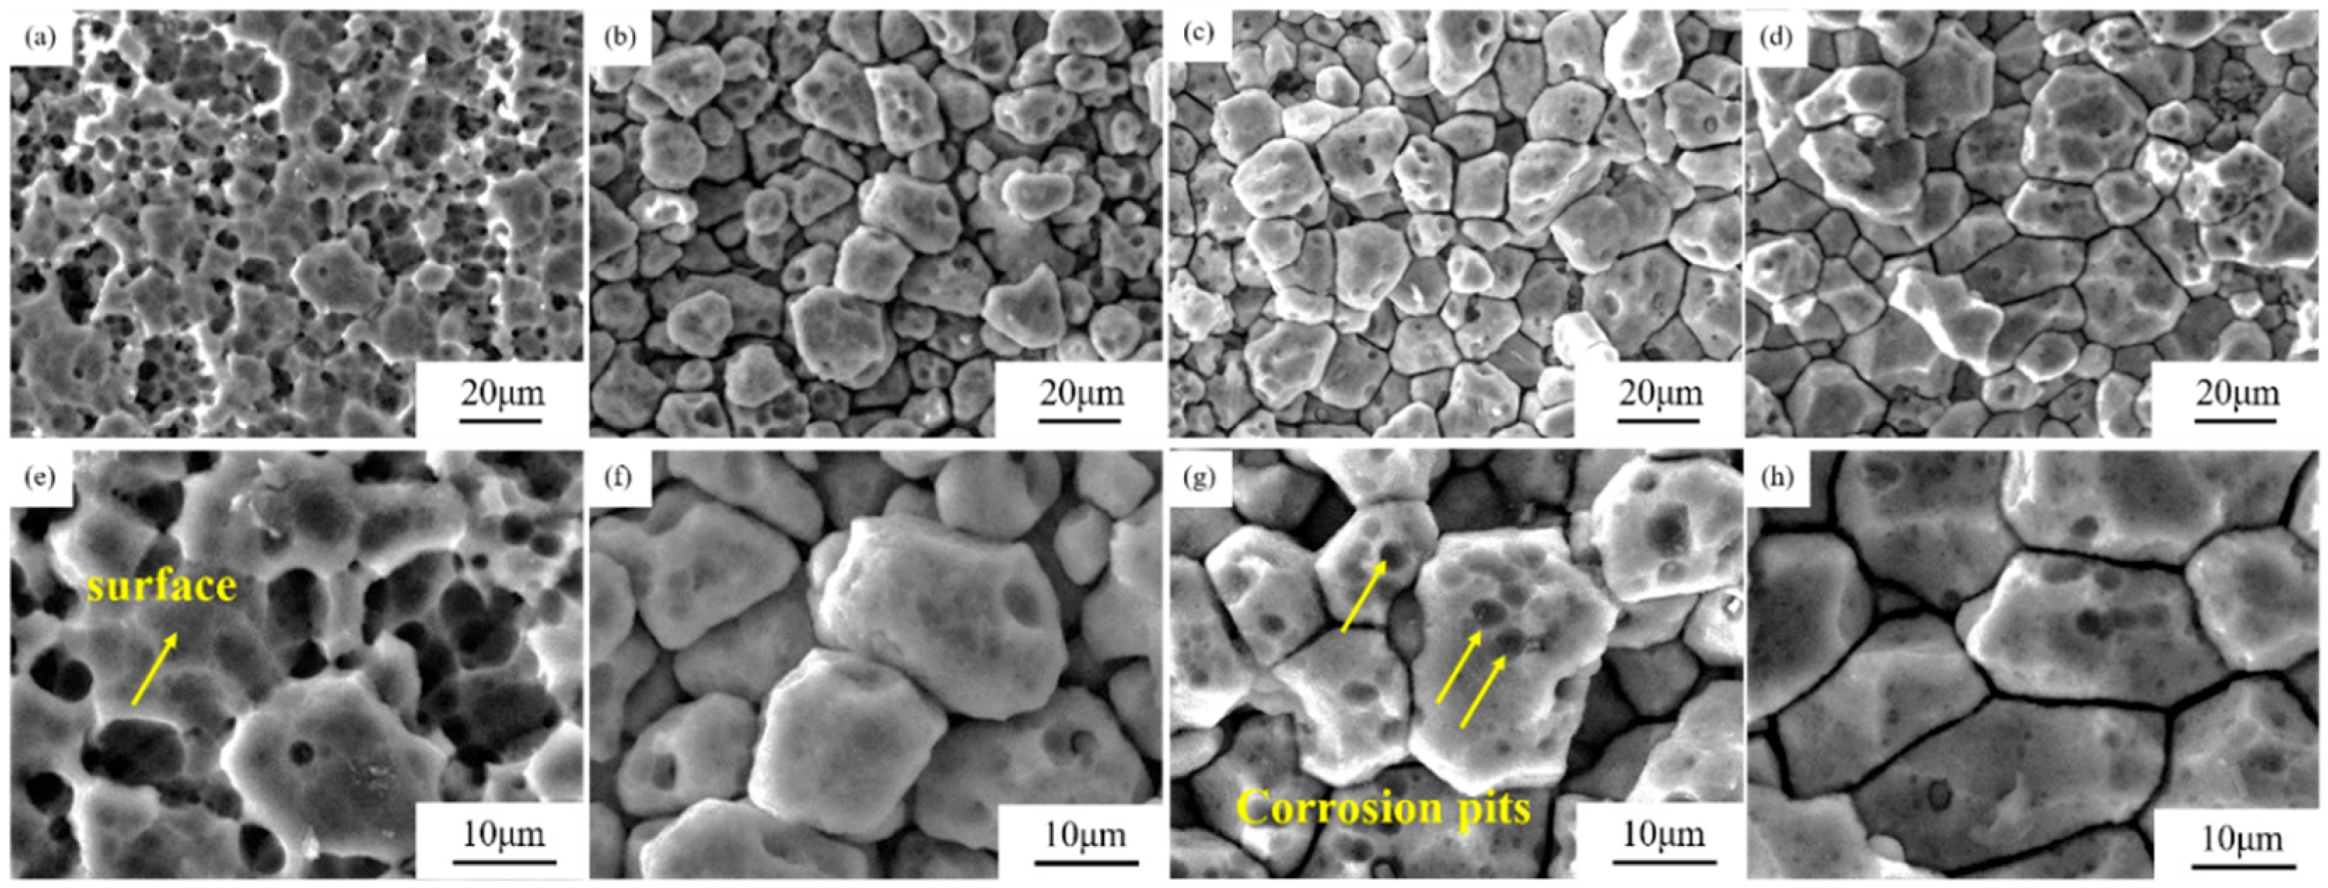
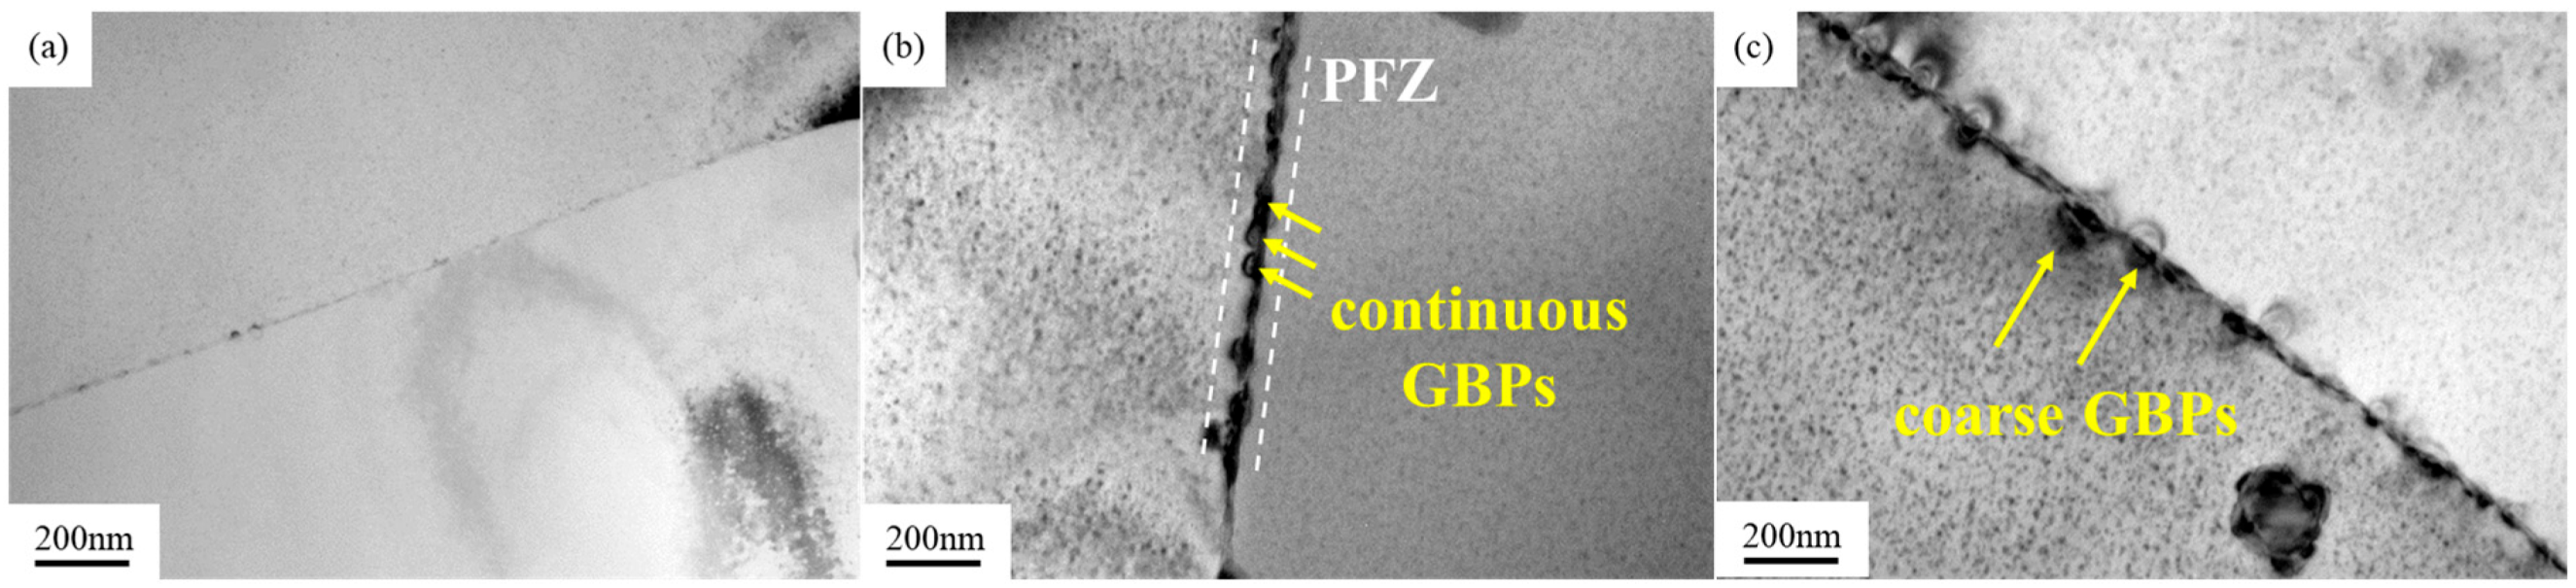
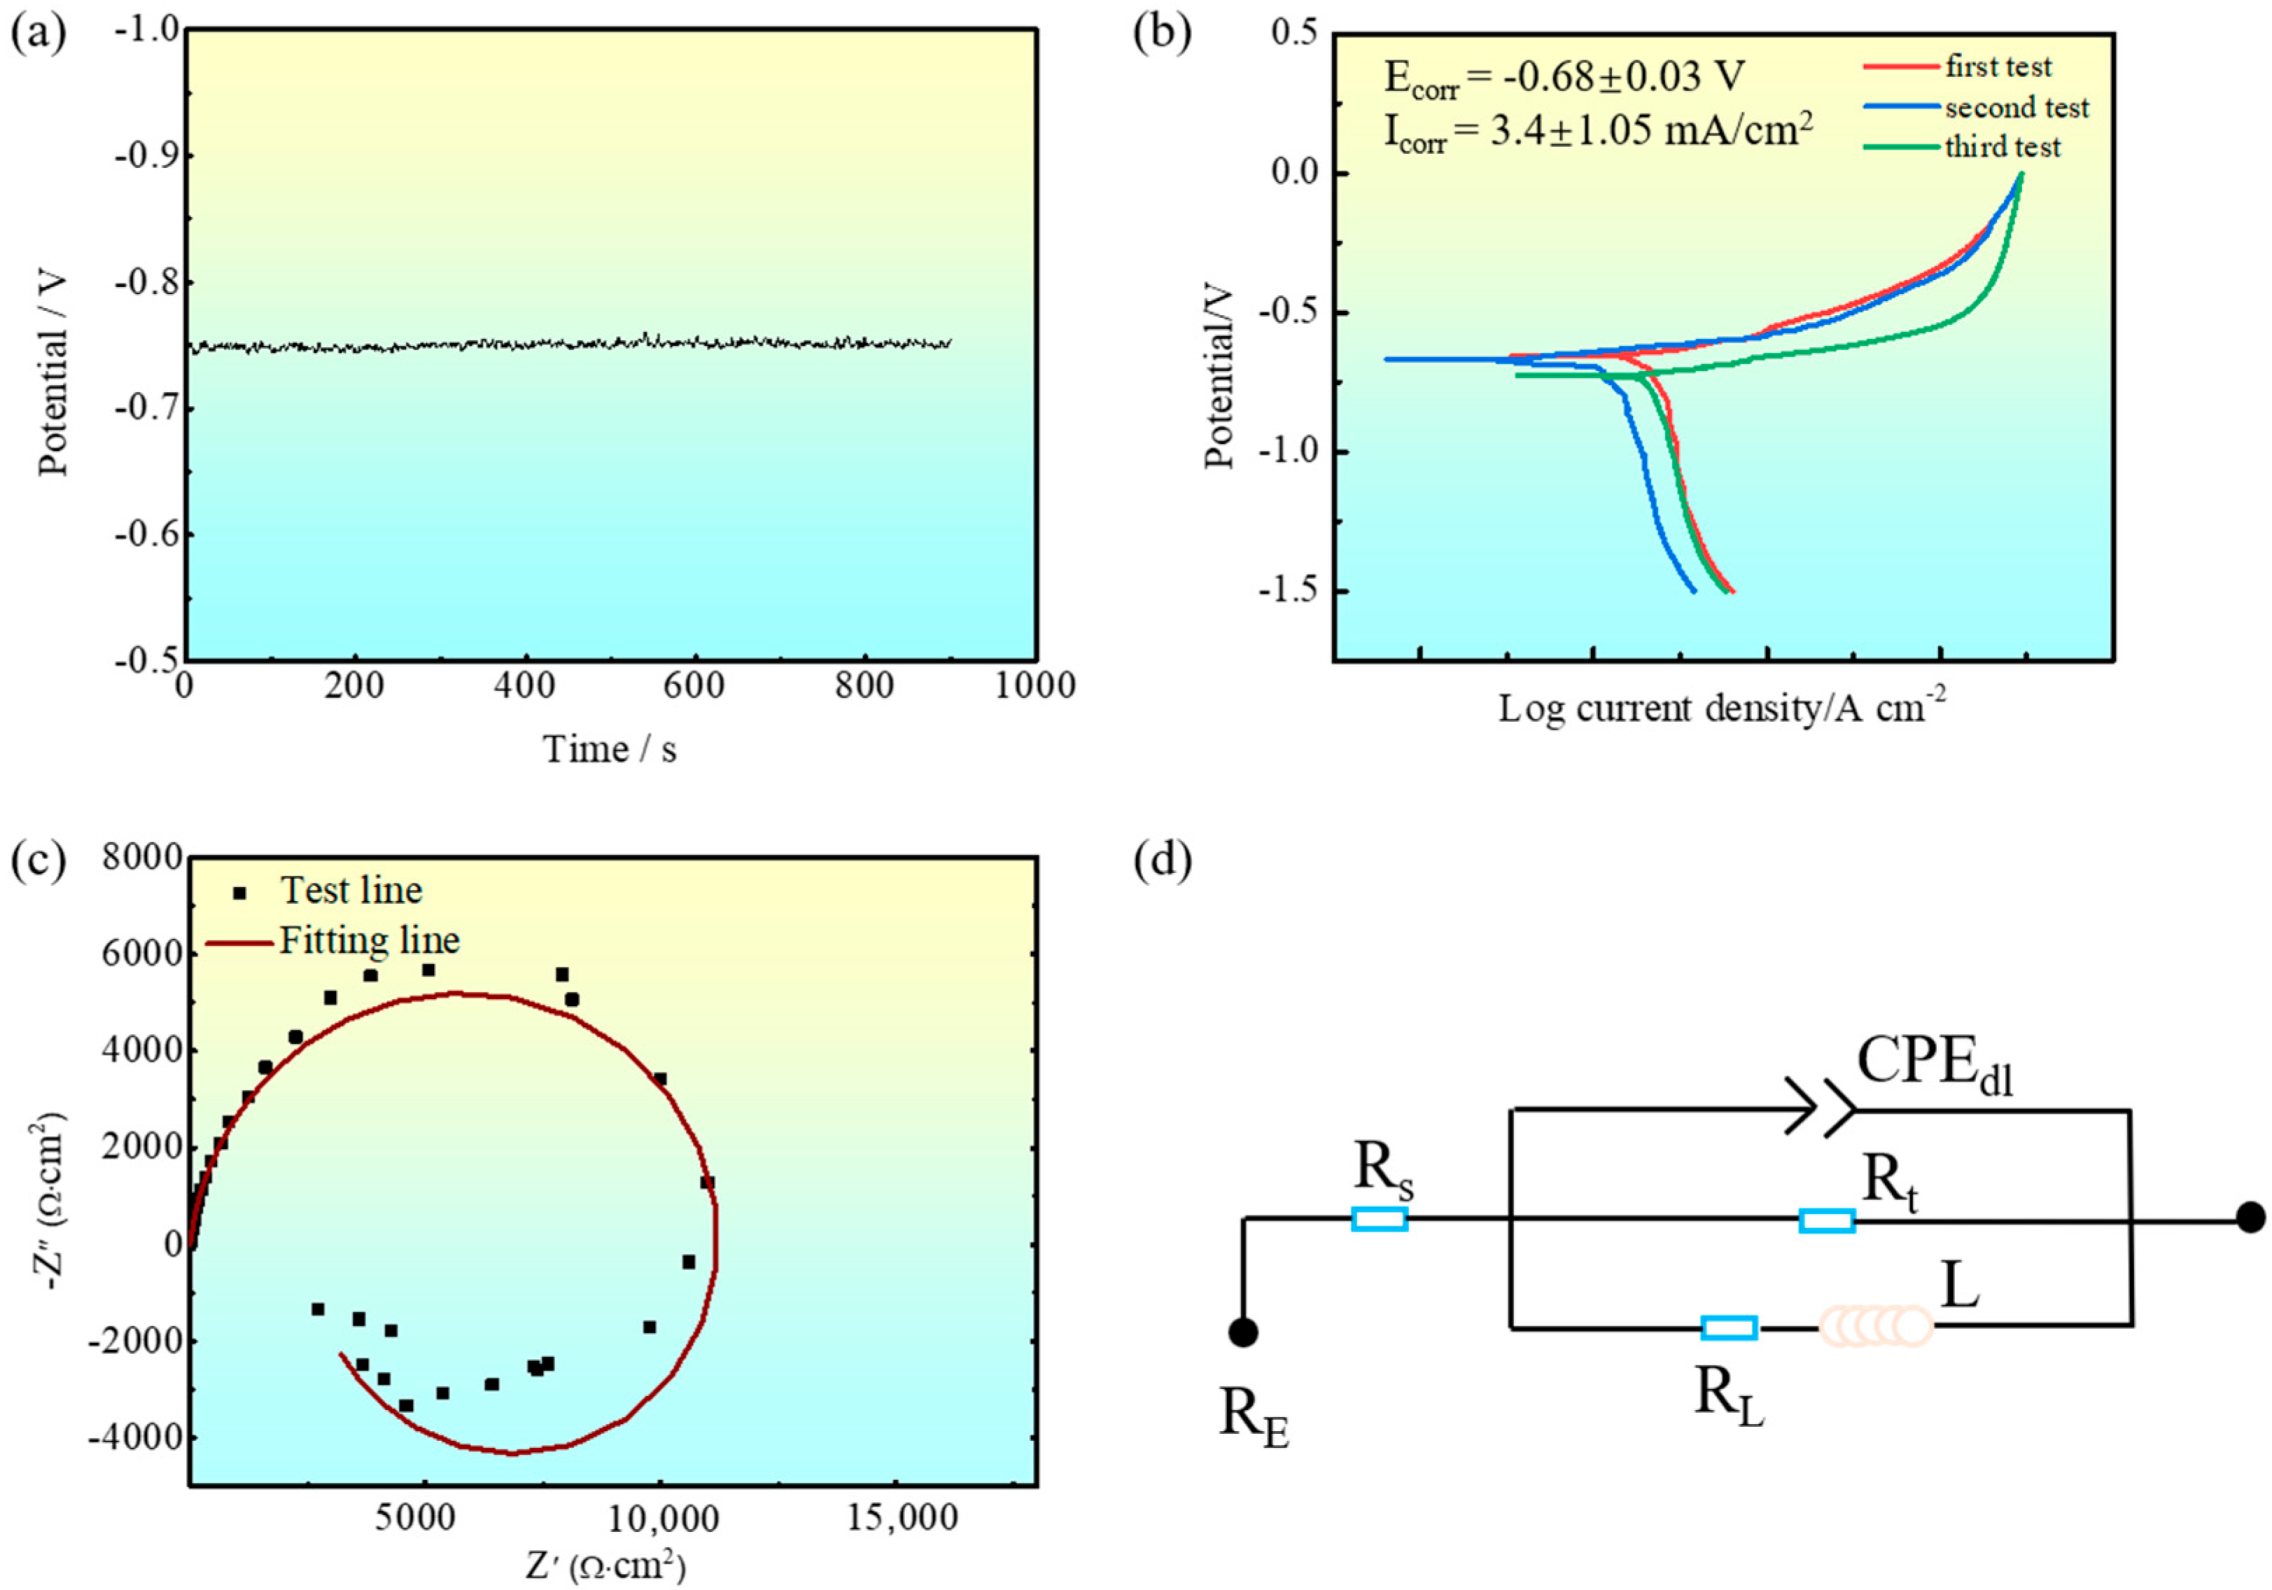
3.3. Evolution of the Intergranular Corrosion Behavior

Figure 8 shows the mass loss results of the Al-Mg-Si-Ag alloy after the immersion test at different aging stages. For the as-quenched alloy, the mass loss is about 13.5 mg/mm2. With an increase in aging time, the mass loss increases gradually and reaches a maximum during the peak-aged stage (mass loss is about 44.5 mg/mm2). This reflects that isothermal aging promotes the precipitation of GBPs, which deteriorates the intergranular corrosion resistance. At the over-aged stage, as the precipitates gradually coarsen, the extension and development of the intergranular corrosion are inhibited, and the intergranular corrosion performance of the alloy is improved. At this stage, the mass loss decreases to 36 mg/mm2.
To further investigate the intergranular corrosion resistance of the alloys, Figure 9 represents the cross-sectional (normal direction × transverse direction, ND × TD) observations of the alloys after the NAMLT test. The maximum corrosion depths of each alloy are marked by red dashed lines. For the as-quenched alloy, it is obvious that there is no occurrence of intergranular corrosion, but there are some corrosion pits. This reflects the better corrosion resistance of the alloy. For the as-aged alloy, as shown in Figure 9b–d, the maximum corrosion depth of the peak-aged alloy (54 μm) is higher than that of the under-aged (35 μm) and over-aged (32 μm) alloys. The results are also consistent with the mass loss results in Figure 8.
The corrosion morphology of the surface (rolling direction × transverse direction, RD × TD) after the immersion test is shown in Figure 10. For the as-quenched alloy, although the surface of the alloy undergoes corrosion, there are still some areas in the matrix that have not been corroded, as marked by yellow arrows in Figure 10e. The outline of the grain boundary is not attacked by the immersion test (Figure 10a,e). For the under-aged alloy, as shown in Figure 10b, the equiaxial grains are clearly outlined by the attacked grain boundaries. Furthermore, a few corrosion pits can be detected on the grain, as shown in Figure 10f. For the peak-aged alloy, as shown in Figure 10c,g, in addition to a clear outline of the equiaxial grain boundary, the number of corrosion pits on the grain also significantly increases, displaying severe susceptibility to corrosion. For the over-aged alloy, the number of corrosion pits decreases, and the corrosion resistance improves, as shown in Figure 10d,h.
To illustrate the influence of isothermal aging on the intergranular corrosion behavior of the Al-Mg-Si-Ag alloy, TEM images of the grain boundary microstructure were taken and are shown in Figure 11. For the aluminum alloys, intergranular corrosion is mainly caused by the potential difference between the GBPs and the nearby Al matrix (or the precipitate free zone, PFZ) [26]. The difference in the potential makes these alloys prone to electrochemical corrosion in corrosive environments. When the potential of the GBPs is lower than that of the matrix, the GBPs act as the anode, and this prioritizes corrosion. In addition, GBPs can serve as channels for corrosion extension and promote the development of IGC. For 5xxx aluminum alloys, the continuous precipitation of GBPs is the main reason for the deterioration of IGC resistance. However, for the new-type Al-Mg-Si-Ag alloy, the large amount of precipitation of the strengthening phase within the grain consumes a large number of solute atoms, thus inhibiting the nucleation and precipitation of GBPs. As shown in Figure 11a, for the under-aged alloy, a few fine GBPs precipitate along the grain boundary. At this aged stage, due to the small number and size of the precipitated phases at the grain boundaries and the discontinuity of GBPs, the alloy presents a better IGC resistance.
For the peak-aged alloy, as shown in Figure 11b, the size of the GBPs increases, and their distribution is more consecutive (yellow arrows). Continuous GBPs cause corrosion to gradually extend along the grain boundaries, resulting in an increase in the depth of the grain boundary corrosion of the alloy (Figure 9c) and a decrease in its corrosion resistance. Furthermore, the occurrence of PFZs is also a major reason for the deterioration of IGC resistance of the alloy. This is because the solubility of solute atoms in the PFZ is relatively low, and there is a potential difference among the PFZs, GBPs, and the matrix. As a result, the potential difference is prone to severe electrochemical corrosion and intergranular corrosion cracking. As marked by the white dashed lines in Figure 11b, PFZs can be detected in the peak-aged alloy. The continuous distribution of GBPs and the appearance of PFZ are the main reason for the deterioration of IGC resistance of the peak-aged alloy. For the over-aged alloy, with the precipitation of solute atoms, the size of the GBPs becomes coarse, and the gaps among each GBPs increase (Figure 11b). The discontinuous GBPs contribute to the improvement in corrosion resistance of the alloy.
For the over-aged alloy, due to the gradual precipitation and diffusion of solute atoms from the matrix, the size of the GBPs gradually increases. The coarser precipitates become more discontinuous in their distribution, which hinders the effective extension of IGC at the grain boundaries, thus improving the IGC resistance of the alloy.
In order to better explain the corrosion behavior of the as-aged Al-Mg-Si-Ag alloy, Figure 12 shows the electrochemical test results of the peak-aged alloy. Figure 12a presents the open-circuit potential and potentiodynamic polarization curves of the peak-aged Al-Mg-Si-Ag alloys. It can be seen from the results that the value of the open-circuit potential is approximately −0.75 V. The open circuit potential fluctuation of the alloy during immersion in the corrosive solution is not significant, indicating that the alloy circuit is in a stable state. Figure 12b presents the polarization curve of the peak-aged alloy. The corrosion potential of the alloy is about −0.75 V, which is roughly equal to the open-circuit potential. In addition, no passivation zone can be observed in the polarization curve, which reflects the poor corrosion protection ability of an oxide film of the alloy.
Figure 12c shows the electrochemical impedance spectrum (EIS) of the alloy. The spectrum consists of a large capacitive loop at a higher frequency region and a small inductance loop at a lower-frequency region. The loop at the high-frequency region represents the chemical reactions that occur in the oxide film of the alloy. The larger the radius of the loop, the better the corrosion resistance of the alloy. The loop at the low-frequency region represents the chemical reaction when the oxide film ruptures. The corresponding equivalent circuit is shown in Figure 12d. Rs is the resistance of the solution, while the Rct is the charge transfer resistance. The higher the Rs value, the greater the resistance in the solution and the less likely it is that the alloy will be corroded. CPEdl represents a double-layer capacitor (defined by n and Y0; n ranges from 0 to 1; Y0 is the corroding capacitance). L and RL represent the inductance and inductance resistance, respectively. The value of RL can also reflect the resistance during the corrosion reactions of the oxide film rupture. The higher the RL value, the more difficult it is for the reaction of the oxide film rupture to occur and the better the corrosion protection effect on the alloy. According to the EIS results, the corrosion behavior of alloys can be explained as follows: Firstly, the oxide film of the alloy has a good protective effect on the corrosion performance of the alloy. When the corrosion time is extended, the oxide film begins to rupture, thus leading to local corrosion. Subsequently, as the precipitation phase at the grain boundary gradually increases, local corrosion begins to extend along the grain boundary, forming intergranular corrosion. In severe cases, it can cause grain boundary corrosion cracking.
Although the traditional solution aging treatment (T6) can improve the strength of the heat-treatable aluminum alloy, the effect of this process on the strength of the alloy through a single precipitation hardening mechanism is limited. In addition, the T6 process generally cannot obtain the optimal strength and corrosion performance at the same time, and the alloy has the highest strength and poor corrosion performance at the peak aging stage. In the over-aging stage, the strength is reduced, and the corrosion performance is improved, so if we want to obtain a high-strength corrosion-resistant alloy, in addition to improving the aging strengthening ability of the alloy, it is necessary to further improve the aging process of the alloy. Ma et al. [27] studied the effect of the regression re-aging process on the strength and intergranular corrosion performance of the Al-Mg-Zn alloy. The regression treatment temperature promoted the coarsening of GBPs and reduced the width of the grain boundary precipitation-free zone (PFZ), thereby improving the intergranular corrosion performance of the alloy. After the regression and re-aging treatment, the alloy strength is comparable to that of the T6 process. Guo et al. [28] studied the effect of the deformation aging process on the strength and corrosion performance of the Ag/Zn microalloying 5xxx aluminum alloy. The combination of the pre-deformation and solution aging process resulted in high-density dislocation, promoting the nano-strengthened phase nucleation and precipitation, and the dislocation interacted with the nanophase. High-density defects, such as a sub-crystal, dislocation cell, and low-temperature recovery zone were formed, which can effectively regulate the precipitation and distribution of the strengthened phase and grain boundary microstructure in the crystal, and then simultaneously improved the strength and corrosion resistance of the alloy.

4. Conclusions

In this paper, the evolution of the microstructure, mechanical properties, and IGC resistance of a novel Al-Mg-Si-Ag alloy during isothermal aging is investigated. The detailed results are as follows:
(1)
The microstructure of the as-cast alloy consists of the Mg2Si phase and Mg32(Al, Ag)49 phase. For the as-rolled alloy, the grains present a fibrous stripe structure, which transforms to equiaxed grains after solution heat treatment.
(2)
During isothermal aging, numerous nanoscale particles are distributed in the matrix uniformly. The precipitates at the peak-aged stage have a BCC structure with the lattice constant of a = 0.33 nm and can be identified as MgAg phase.
(3)
The strength of the alloy increases greatly in the aging process. The UTS and YS of the peak-aged alloy are 342 MPa and 231 MPa, which increase by 18% and 57% to the as-quenched alloy, respectively. However, the peak-aged alloy presents a worse IGC resistance than that of the as-quenched alloy. The continuous distribution of GBPs and the appearance of PFZs are the main reasons for the deterioration of the IGC resistance of the alloy.

Author Contributions

Conceptualization, C.G.; Methodology, Y.W. and H.W.; Investigation, T.L. and H.W.; Writing—original draft, T.L.; Writing—review & editing, C.G.; Supervision, C.G. All authors have read and agreed to the published version of the manuscript.

Funding

This research received no external funding.

Institutional Review Board Statement

Not applicable.

Informed Consent Statement

Not applicable.

Data Availability Statement

Data are contained within the article.

Conflicts of Interest

Author Tao Liu and Yanli Wu was employed by the MCC Heavy Industry (Tangshan) Co., Ltd. The remaining authors declare that the research was conducted in the absence of any commercial or financial relationships that could be construed as a potential conflict of interest.

References

  1. He, L.; Li, X.; Wang, X.; Zhang, H.; Cui, J. Effects of homogenization on microstructures and properties of a new type Al-Mg-Mn-Zr-Ti-Er alloy. Mater. Sci. Eng. A 2010, 527, 7510–7518. [Google Scholar] [CrossRef]
  2. Mofarrehi, M.; Javidani, M.; Chen, X. Effect of Mn content on the hot deformation behavior and microstructure evolution of Al-Mg-Mn 5xxx alloys. Mater. Sci. Eng. A 2022, 845, 143217. [Google Scholar] [CrossRef]
  3. Li, M.; Pan, Q.; Shi, Y.; Wang, Y. Microstructure dependent fatigue crack growth in Al-Mg-Sc alloy. Mater. Sci. Eng. A 2014, 611, 142–151. [Google Scholar] [CrossRef]
  4. Yi, G.; Cullen, D.; Littrell, K.; Golumbfskie, W.; Sundberg, E.; Free, M. Characterization of Al-Mg alloy aged at low temperatures. Metall. Mater. Trans. A 2017, 48, 2040–2050. [Google Scholar] [CrossRef]
  5. Wu, X.; Chen, S.; Lai, B.; Hui, H.; Wen, S.; Gao, K.; Wang, W.; Nie, Z.; Zaluzec, N. Microstructure Characterization of Microalloyed 5xxx Aluminum Alloys with Er and Zr using Analytical Transmission Electron Microscopy and Synchrotron X-ray Fluorescence Microscopy. Microsc. Microanal. 2018, 24, 760–761. [Google Scholar] [CrossRef]
  6. Zhu, X.; Liu, F.; Wang, S.; Ji, S. The development of low-temperature heat-treatable high-pressure die-cast Al-Mg-Fe-Mn alloys with Zn. J. Mater. Sci. 2021, 56, 11083–11097. [Google Scholar] [CrossRef]
  7. Mariusz, K.; Tański, T.; Snopiński, P.; Tomiczek, B. Structure and properties of aluminium-magnesium casting alloys after heat treatment. J. Therm. Anal. Calorim. 2017, 127, 299–308. [Google Scholar]
  8. Lee, B.; Kim, S.; Park, J.; Kim, H.; Lee, J. Role of Mg in simultaneously improving the strength and ductility of Al-Mg alloys. Mater. Sci. Eng. A 2016, 657, 115–122. [Google Scholar] [CrossRef]
  9. Huskins, E.; Cao, B.; Ramesh, K. Strengthening mechanisms in an Al-Mg alloy. Mater. Sci. Eng. A 2010, 527, 1292–1298. [Google Scholar] [CrossRef]
  10. Stemper, L.; Tunes, M.; Oberhauser, P.; Uggowitzer, P.; Pogatscher, S. Age-hardening response of AlMgZn alloys with Cu and Ag additions. Acta Mater. 2020, 195, 541–554. [Google Scholar] [CrossRef]
  11. Stemper, L.; Tunes, M.; Dumitraschkewitz, P.; Mendez-Martin, F.; Tosone, R.; Marchand, D.; Curtin, W.; Uggowitzer, P.; Pogatscher, S. Giant hardening response in AlMgZn(Cu) alloys. Acta Mater. 2021, 206, 116617. [Google Scholar] [CrossRef]
  12. Stemper, L.; Tunes, M.; Tosone, R.; Uggowitzer, P.; Pogatscher, S. On the potential of aluminum crossover alloys. Prog. Mater. Sci. 2022, 124, 100873. [Google Scholar] [CrossRef]
  13. Hou, S.; Liu, P.; Zhang, D.; Zhang, J.; Zhuang, L. Precipitation hardening behavior and microstructure evolution of Al-5.1Mg-0.15Cu alloy with 3.0Zn (wt%) addition. J. Mater. Sci. 2018, 53, 3846–3861. [Google Scholar] [CrossRef]
  14. Hou, S.; Zhang, D.; Ding, Q.; Zhang, J.; Zhuang, L. Solute clustering and precipitation of Al-5.1Mg-0.15Cu-xZn alloy. Mater. Sci. Eng. A 2019, 759, 465–478. [Google Scholar] [CrossRef]
  15. Ji, S.; Yang, W.; Gao, F.; Watson, D.; Fan, Z. Effect of iron on the microstructure and mechanical property of Al-Mg-Si-Mn and Al-Mg-Si diecast alloys. Mater. Sci. Eng. A 2013, 564, 130–139. [Google Scholar] [CrossRef]
  16. Pan, Y.; Zhang, D.; Liu, H.; Zhuang, L.; Zhang, J. Precipitation hardening and intergranular corrosion behavior of novel Al-Mg-Zn(-Cu) alloys. J. Alloys Compd. 2021, 853, 157199. [Google Scholar] [CrossRef]
  17. Guo, C.; Zhang, H.; Wu, Z.; Shen, X.; Wang, P.; Li, B.; Cui, J.; Nagaumi, H. An atomic-resolution investigation of precipitation evolution in Al-Mg-Ag alloys. Mater. Lett. 2019, 248, 231–235. [Google Scholar] [CrossRef]
  18. Guo, C.; Zhang, H.; Wu, Z.; Wang, D.; Li, B.; Cui, J. Effects of Ag on the age hardening response and intergranular corrosion resistance of Al-Mg alloys. Mater. Charact. 2019, 147, 84–92. [Google Scholar] [CrossRef]
  19. Djema, O.; Bouabdallah, M.; Badji, R.; Saadi, A.; Kherrouba, N.; Sahli, A. Isothermal and non-isothermal precipitation kinetics in Al-Mg-Si-(Ag) alloy. Mater. Chem. Phys. 2020, 240, 122073. [Google Scholar] [CrossRef]
  20. Weng, Y.; Jia, Z.; Ding, L.; Pan, Y.; Liu, Y.; Liu, Q. Effect of Ag and Cu additions on natural aging and precipitation hardening behavior in Al-Mg-Si alloys. J. Alloys Compd. 2017, 695, 2444–2452. [Google Scholar] [CrossRef]
  21. ASTM G67-04; Standard Test Method for Determining the Susceptibility to Intergranular Corrosion of 5xxx Series Aluminum Alloys by Mass Loss after Exposure to Nitric Acid (NAMLT Test). ASTM: West Conshohocken, PA, USA, 2004.
  22. Chen, J.; Cheng, X.; Ding, L.; Weng, Y.; Yin, J.; Yao, H.; Yu, H. Effect of multi-stage aging on the precipitation strengthening and mechanical properties for an Al-Mg-Si-Ag alloy. Mater. Charact. 2022, 190, 112004. [Google Scholar] [CrossRef]
  23. Edwards, G.; Stiller, K.; Dunlop, G.; Couper, M. The precipitation sequence in Al-Mg-Si alloys. Acta. Mater. 1998, 46, 3893–3904. [Google Scholar] [CrossRef]
  24. Weng, Y.; Jia, Z.; Ding, L.; Liu, M.; Wu, X.; Liu, Q. Combined effect of pre-aging and Ag/Cu addition on the natural aging and bake hardening in Al-Mg-Si alloys. Prog. Nat. Sci. Mater. 2018, 28, 363–370. [Google Scholar] [CrossRef]
  25. Pirhayati, P.; Jamshidi Aval, H.; Loureiro, A. Characterization of microstructure, corrosion, and tribological properties of a multilayered friction surfaced Al-Mg-Si-Ag alloy. Arch. Civ. Mech. Eng. 2022, 22, 176. [Google Scholar] [CrossRef]
  26. Hou, S.; Zhang, D.; Pan, Y.; Ding, Q.; Long, W.; Zhang, J.; Zhuang, L. Dependence of microstructure, mechanical properties, and inter-granular corrosion behavior of Al-5.1Mg-3.0Zn-0.15Cu alloys with high temperature pre-treatment. Mater. Charact. 2020, 168, 110512. [Google Scholar] [CrossRef]
  27. Ma, Q.; Zhang, D.; Zhuang, L.; Zhang, J. Intergranular corrosion resistance of Zn modified 5xxx series Al alloy during retrogression and re-aging treatment. Mater. Charact. 2018, 144, 264–273. [Google Scholar] [CrossRef]
  28. Guo, C.; Zhang, H.; Li, S.; Chen, R.; Nan, Y.; Li, L.; Wang, P.; Li, B.; Cui, J.; Nagaumi, H. Evolution of microstructure, mechanical properties and corrosion behavior of Al-4Mg-2Zn-0.3Ag (wt.%) alloy processed by T6 or thermomechanical treatment. Corros. Sci. 2021, 188, 109511. [Google Scholar] [CrossRef]
Figure 1. The phase diagram using Thermo-Calc.
Coatings 13 02012 g001
Figure 2. (a) OM and (b) SEM images of as-cast microstructure.
Coatings 13 02012 g002
Figure 3. OM images of (a,b) as-homogenized alloy, (c) polarized light picture of as-rolled alloy, and (d) polarized light picture of as-quenched alloy.
Coatings 13 02012 g003
Figure 4. Hardness and tensile test results of aged Al-Mg-Si-Ag alloy: (a) hardness and (b) tensile test results.
Coatings 13 02012 g004
Figure 5. TEM images of aging precipitates: (a) under-aged alloy, (b) peak-aged alloy, and (c) over-aged alloy.
Coatings 13 02012 g005
Figure 6. Microstructure of peak-aged alloy: (a) HRTEM image, (b) HAADF-STEM image of aging precipitates, (c) enlarged image of red dashed area in (b), and (d) FFT pattern of (c).
Coatings 13 02012 g006
Figure 7. The element distribution mapping via EDS of peak-aged alloy.
Coatings 13 02012 g007
Figure 8. Mass loss results of investigated alloy after the NAMLT test.
Coatings 13 02012 g008
Figure 9. Cross-sectional (ND × TD) observations of the alloy after NAMLT test: (a) as-quenched alloy, (b) under-aged alloy, (c) peak-aged alloy, and (d) over-aged alloy.
Coatings 13 02012 g009
Figure 10. SEM images of the surface (RD × TD) of (a,e) as-quenched alloy, (b,f) under-aged alloy, (c,g) peak-aged alloy, and (d,h) over-aged alloy.
Coatings 13 02012 g010
Figure 11. Grain boundary microstructure of (a) under-aged alloy, (b) peak-aged alloy, and (c) over-aged alloy.
Coatings 13 02012 g011
Figure 12. (a) The open-circuit potential and (b) potentiodynamic polarization curves of the peak-aged Al-Mg-Si-Ag alloys. (c) Electrochemical impedance spectra and (d) corresponding equivalent circuit diagram of the alloy.
Coatings 13 02012 g012
Table 1. Composition of investigated phases marked in Figure 2b (wt.%).
PhaseMgAlSiCrMnFeZrAg
A3.3136.331.480.060.070.120.1158.52
B9.2969.6219.860.010.510.150.000.57
Disclaimer/Publisher’s Note: The statements, opinions and data contained in all publications are solely those of the individual author(s) and contributor(s) and not of MDPI and/or the editor(s). MDPI and/or the editor(s) disclaim responsibility for any injury to people or property resulting from any ideas, methods, instructions or products referred to in the content.

