Article

Automatic Identification Method of Defects in Concrete Structures Strengthened with Composite Materials Based on a Multi-Scale Model

1
Civil & Architecture Engineering Institute, Zhengzhou University of Science & Technology, Zhengzhou 450064, China
2
School of Civil Engineering, Henan Polytechnic University, Jiaozuo 454000, China
*
Author to whom correspondence should be addressed.
Coatings 2023, 13(12), 2005; https://doi.org/10.3390/coatings13122005
Submission received: 9 October 2023 / Revised: 22 November 2023 / Accepted: 23 November 2023 / Published: 25 November 2023

Abstract

:
Due to the inconsistent geometric characteristics of reinforced concrete structures with composite materials, some echo signals have a lower degree of clarity, resulting in problems such as long time, small range, and low accuracy in identifying structural defects. Therefore, in order to improve the accuracy and efficiency of defect identification in composite material reinforced concrete structures, a multi-scale model based on the automatic defect identification method for composite material reinforced concrete structures is proposed. Using the interface connection method, based on continuous distribution coupling and the uniform weighting coefficient calculation method to weigh the interface nodes, we determined the interface connection mode and analyzed the stress–strain relationship. The impact echo method was used to analyze the degree of high-frequency stress wave scattering caused by internal non-uniformity in composite reinforced concrete, and the fast Fourier transform conversion algorithm was used to generate amplitude–frequency curves and resolved thickness or defect depth. The experimental results show that the multi-scale finite element simulation structure of this method is clear and accurate, and although there are errors, they do not affect the simulation results of the structure. The impact echo detection effect is obvious; it can automatically identify defects in composite reinforced concrete structures and quickly and accurately identify defects in different states and positions of composite reinforced concrete, with a recognition accuracy of 98%.

1. Introduction

Reinforced concrete composite materials have become the most widely used building materials due to their strong manufacturability [1,2], strong environmental adaptability, high compressive strength [3], and good durability. However, this material cannot completely avoid defects caused by concrete pouring during use, which can affect the strength, durability, and normal performance of building structures [4]. Therefore, identifying and verifying defects in reinforced concrete composite structures is of great significance.
At present, reference [5] proposes an enhanced artificial neural network (ANN) to predict the displacement of composite materials pipelines under different velocities of falling hammer impacts. A composite pipe with a diameter of 54 mm was considered to investigate the damage caused by low-speed impact and the impact of these damages on its strength. Use Jaya and E-Jaya algorithms to enhance the ANN algorithm for good training, prediction, and complete damage detection. Reference [6] proposes a method for detecting structural damage detection by placing vibration sensors in carbon fiber-reinforced polymer (CFRP) composite structures. Considering the actual weight of the beam and the actual weight of the vibration sensor and connecting cable, a set of structural vibration experiments were conducted at different sensor positions. A teaching-based optimization algorithm (TLBO) was utilized to identify the optimal placement position of sensors, and a crack location formula was used to predict the severity of damage and crack depth. Wakata S et al. have studied an automatic identification method for concrete defects in infrastructure [7]. This method utilizes shock waves generated by laser-induced plasma (LIP) to detect defects in concrete structures through telemetry technology. LIP is generated by irradiating an Nd: YAG pulse laser near the surface of concrete. When LIP spreads to the surrounding area at an extremely fast speed, a spherical shock wave is generated. This shock wave achieves non-contact and non-destructive pulse excitation force on concrete structures. The response of concrete structures was measured using a laser Doppler vibrometer (LDV) to complete defect detection of artificial concrete structures. Michal Matysík et al. studied the use of a nonlinear resonance ultrasound spectrum to identify concrete damage [8] and calculated concrete damage based on the measurement speed and volume density of ultrasound pulses (linear acoustic method). Nonlinear resonance ultrasound spectrum monitoring responds to the shift of resonance frequency in response to changes in excitation frequency amplitude and measures concrete samples at different temperatures. Concrete damage is detected based on the measurement speed and volume density of ultrasonic pulses.
Chun PJ et al. studied an automatic crack recognition method for concrete surface images based on a two-step optical gradient enhancer [9]. In crack recognition, the pixel values of the target pixels and the geometric features of the cracks at the connection line are considered, effectively generating concrete structure feature images. Coleman Z W et al. proposed an automatic identification method for impact echo defects in uncovered reinforced concrete bridge decks [10] and completed the automatic identification of concrete structural defects by evaluating and using frequency profiles through improved receiver operator feature analysis. Zhang T et al. used concrete solid models to detect internal hole defects in concrete structures using acoustic methods, acoustic CT methods, and ground penetrating radar methods [11], effectively analyzing the accuracy of each method for identifying internal structural defects in concrete. Although the above methods can achieve recognition, they also have some drawbacks, such as a lack of non-destructive recognition, long recognition time, inaccurate recognition results, and a small recognition range.
Multi-scale models can describe behaviors at different scales, not only expressing the complexity of the system but also providing more detailed results. Reference [12] established a multi-scale finite element failure analysis method for composite materials considering interface phases based on the three-phase representative bulk element of fiber–matrix interface, achieving low-temperature composite material structural failure prediction under thermal and mechanical loads. And use this method to conduct failure analysis on three typical composite laminates under five different temperatures. Reference [13] used a multi-scale finite element method to study the effect of two types of random source composite materials on the macroscopic mechanical properties of 20% SiCp/2009Al. By conducting quasi-static tensile simulations on a series of representative volume unit models containing random sources, the random distribution characteristics of material failure strain and fracture energy and their correlation characteristics were obtained. Then, combined with the macroscopic sample model, the characterization of the randomness of material performance in different regions within the actual material was realized.
In order to solve the problem of inaccurate identification results of defects in reinforced concrete structures, a multi-scale model was introduced, and an automatic identification method for defects in reinforced concrete structures was proposed. Firstly, a multi-scale finite element analysis was conducted on the reinforced concrete composite structure to establish a multi-scale model of the reinforced concrete steel frame composite structure and determine the interface connection method. Combine the constitutive model of a composite reinforced concrete frame with the implicit algorithm of the general finite element software ABAQUS to simulate the model. We simulated the defective reinforced concrete steel frame structure and automatically identified the defects in the reinforced concrete composite structure using the impact echo method.

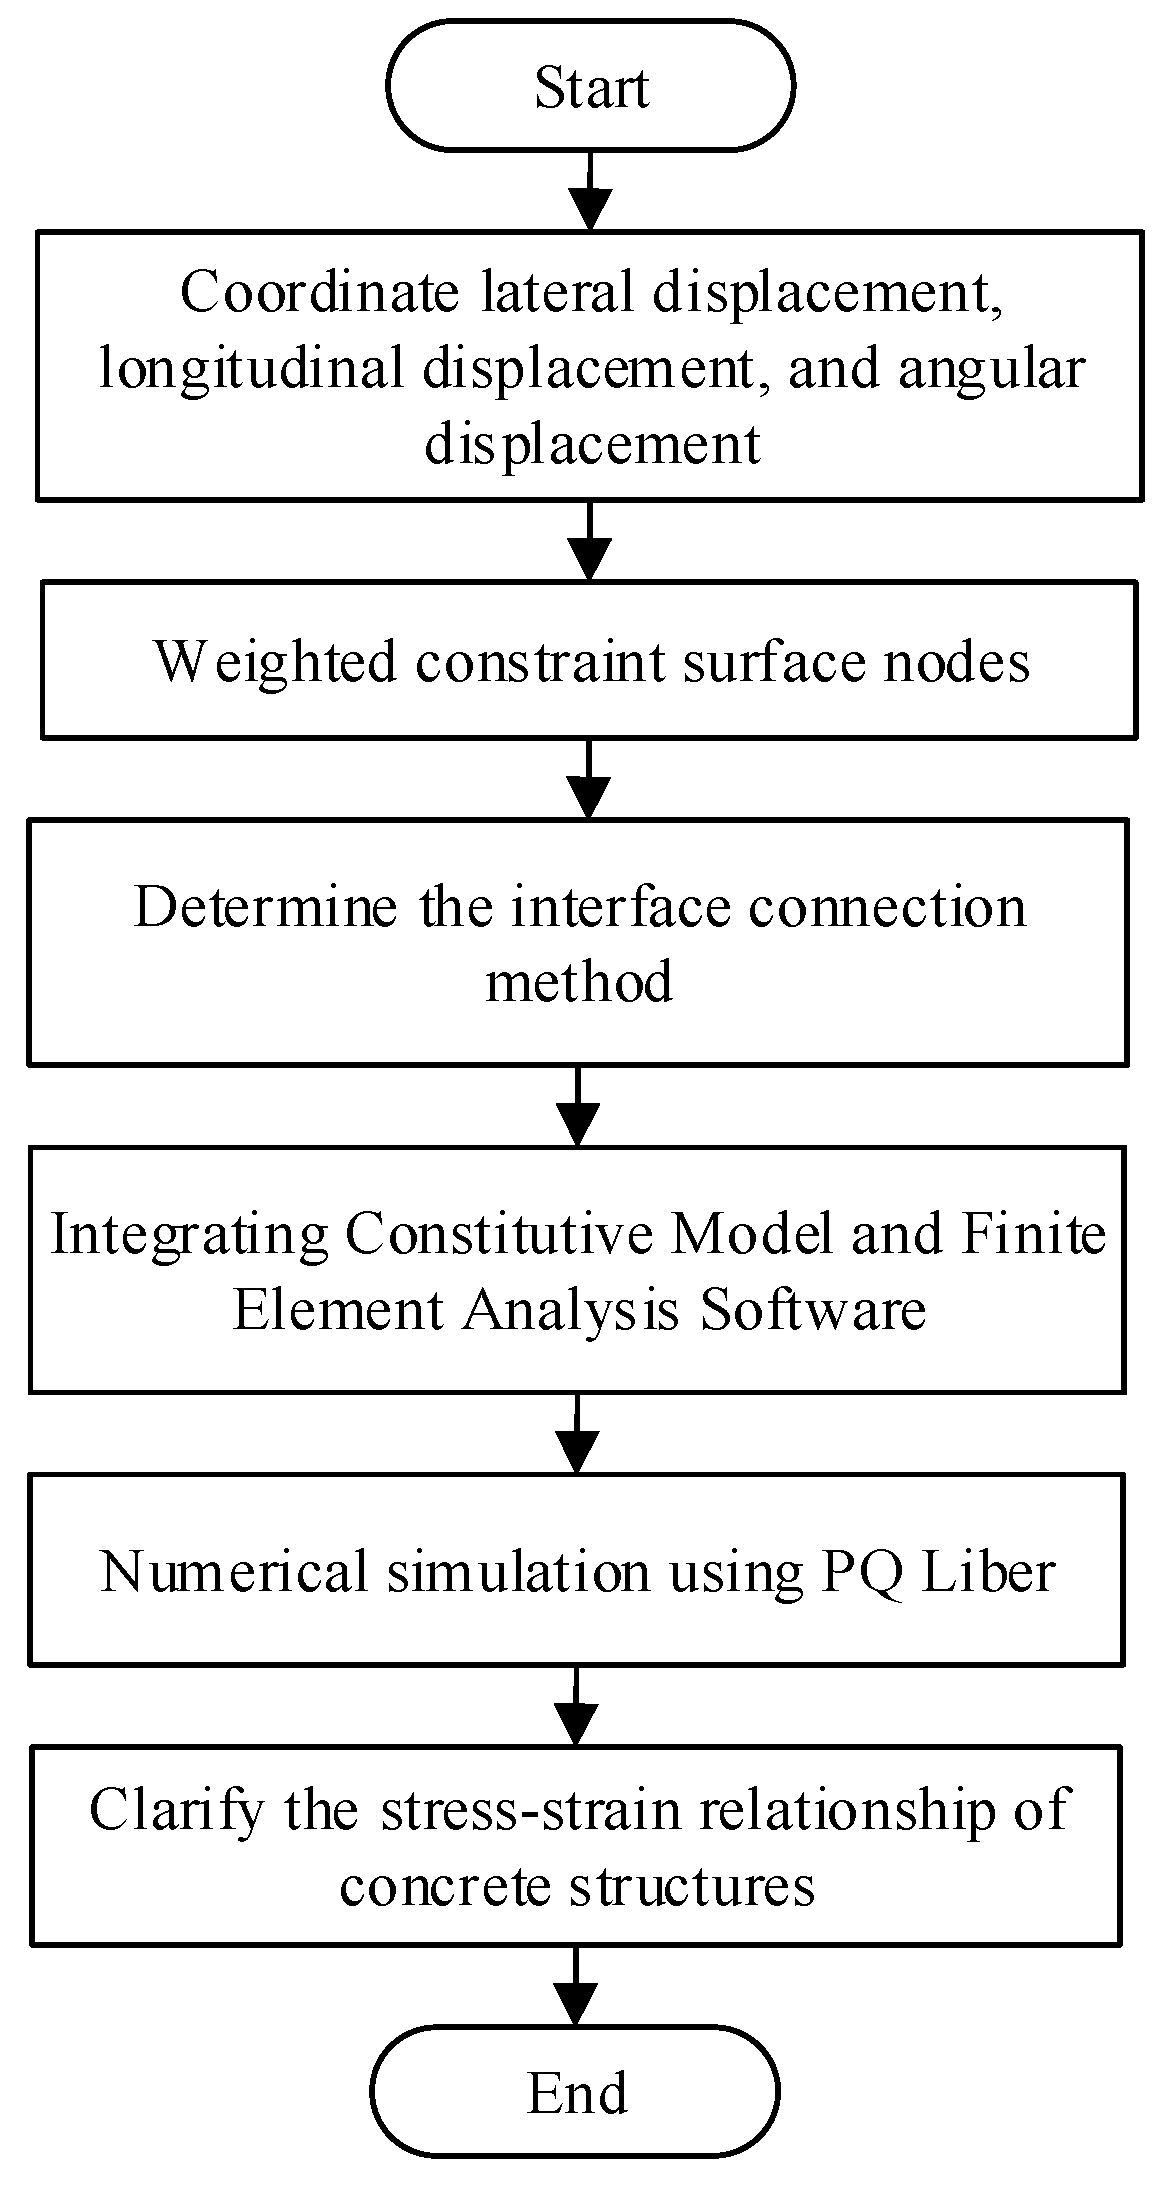
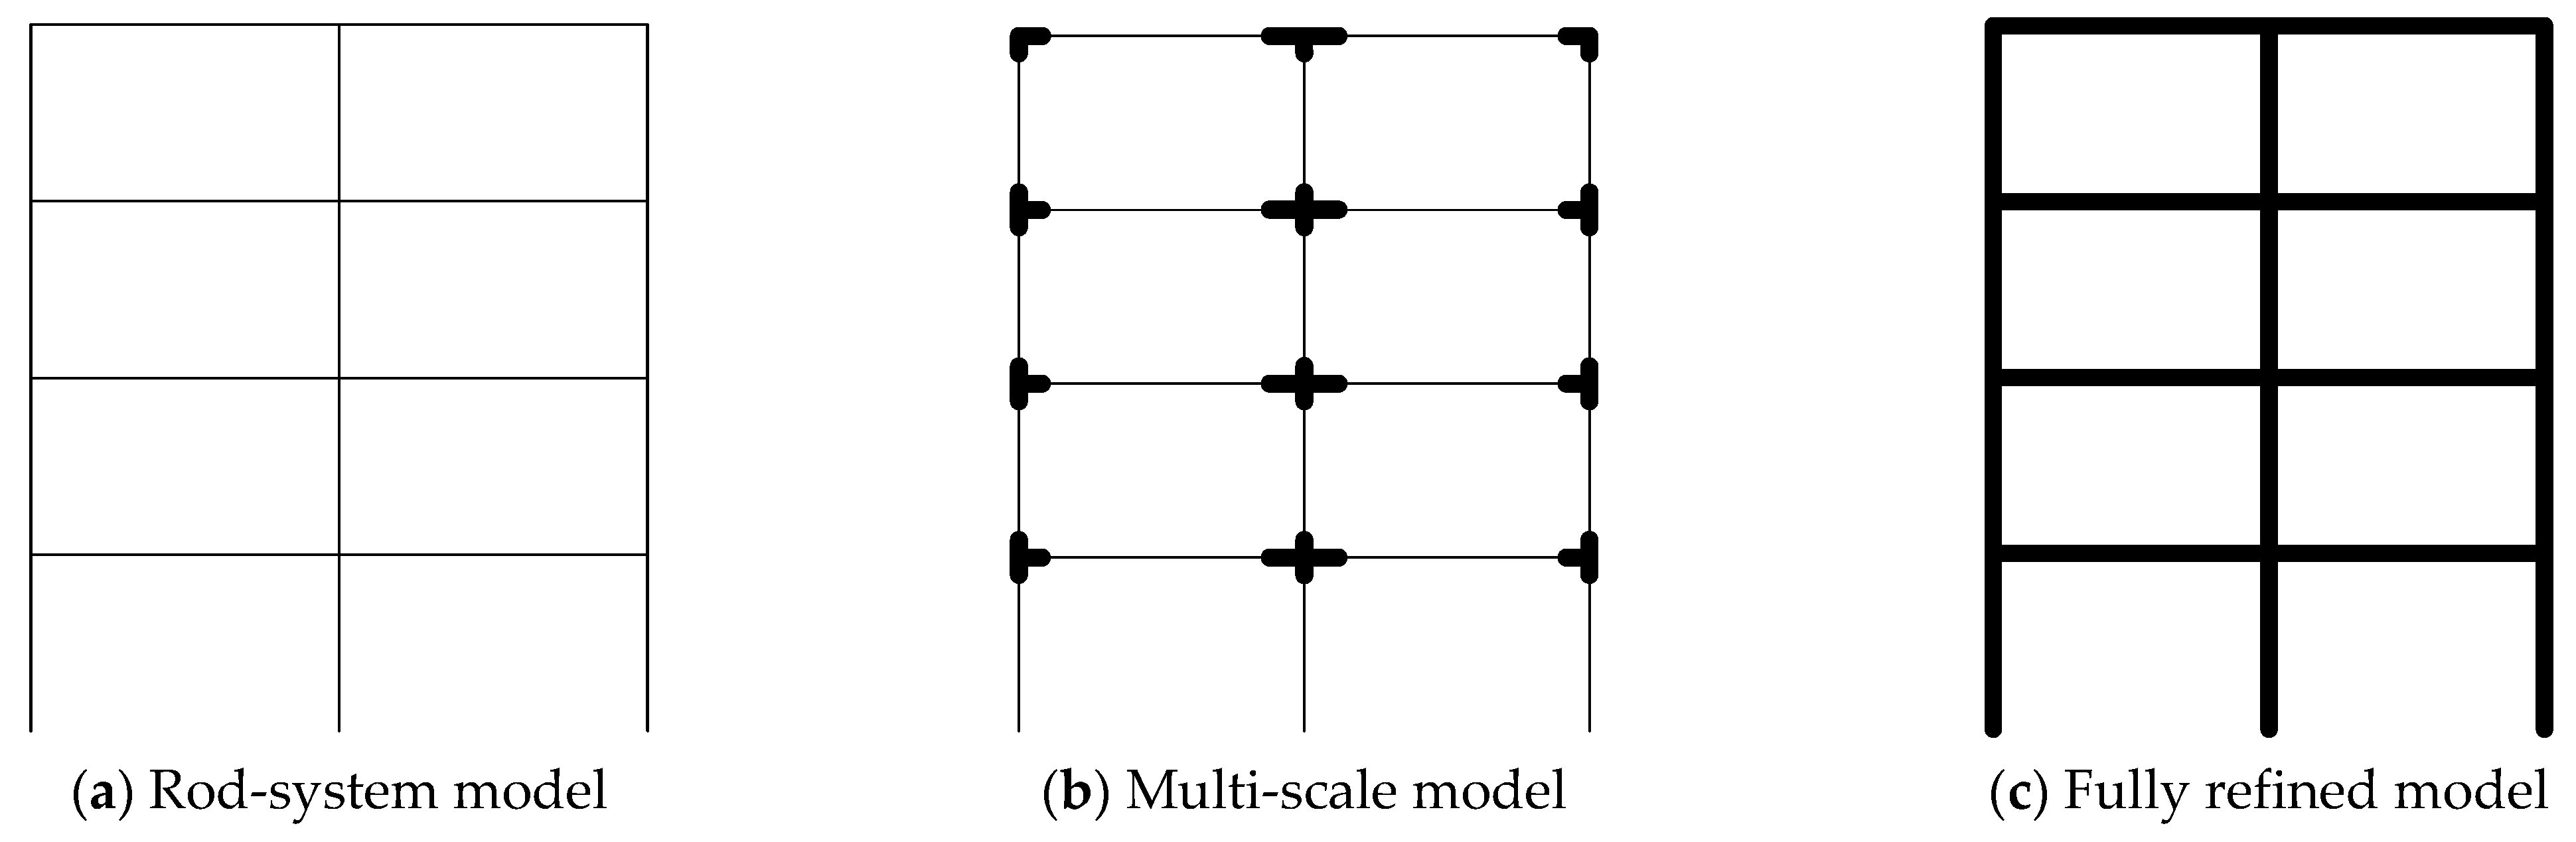
2. Multi-Scale Finite Element Analysis of Concrete Structures Strengthened with Composite Materials

Multi-scale finite element analysis is an analysis method that relates models of different scales to each other. This method establishes a connection between macroscopic structure and microscopic material properties to model and analyze the response of structures at different scales. Among them, the macro scale includes the overall geometric shape of the structure, boundary conditions, external loading, etc. The finite element method will analyze the overall behavior of the structure at the macro-scale and the micro-scale, which includes the distribution of composite reinforcement, interface effects, and the constitutive relationship of the micro material. By establishing coupling relationships and model transfer rules at these scales, effective mapping from microscopic material characteristics to macroscopic structural responses is achieved, integrating multi-scale features and behaviors of composite material reinforced concrete structures and achieving recognition and monitoring of structural defects. When conducting multi-scale finite element analysis of composite reinforced concrete structures, using h-type finite element method for simulation analysis, because different elements are selected to simulate composite reinforced concrete [14], there are some differences in the selection of reinforcement simulation and concrete constitutive model [15,16], for example, the eight-node 3D solid reduced integral element C3D8R is used as the fine element of composite reinforced concrete; B31 steel frame model is used as the rough element of concrete strengthened with composite materials. At the same time, the degrees of freedom and accuracy of different element types of nodes in composite reinforced concrete structures are different. When different elements are used in a model to simulate different parts of composite reinforced concrete structures or components, the interface connection is related to the deformation coordination between elements.
Therefore, the Embedded command is used in the solid element to embed the rebar into the composite reinforced concrete. The reinforcement treatment in steel frames is slightly complicated: the interface connection method based on continuous distributed coupling is analyzed, and the section reinforcement is realized through the equivalent simulation method of superposition of the same type of steel frames. Use the * Elcopy command to divide the reinforced concrete and composite reinforced concrete into two steel frames of the same type, and then let these steel frames share nodes. Because the steel frames have the same type and share the same joint, it can ensure that the displacement coordination of any point in the steel frame and the assumption of the plane section are valid, and the equivalent simulation is carried out. The overall workflow of multi-scale finite element analysis is shown in Figure 1.

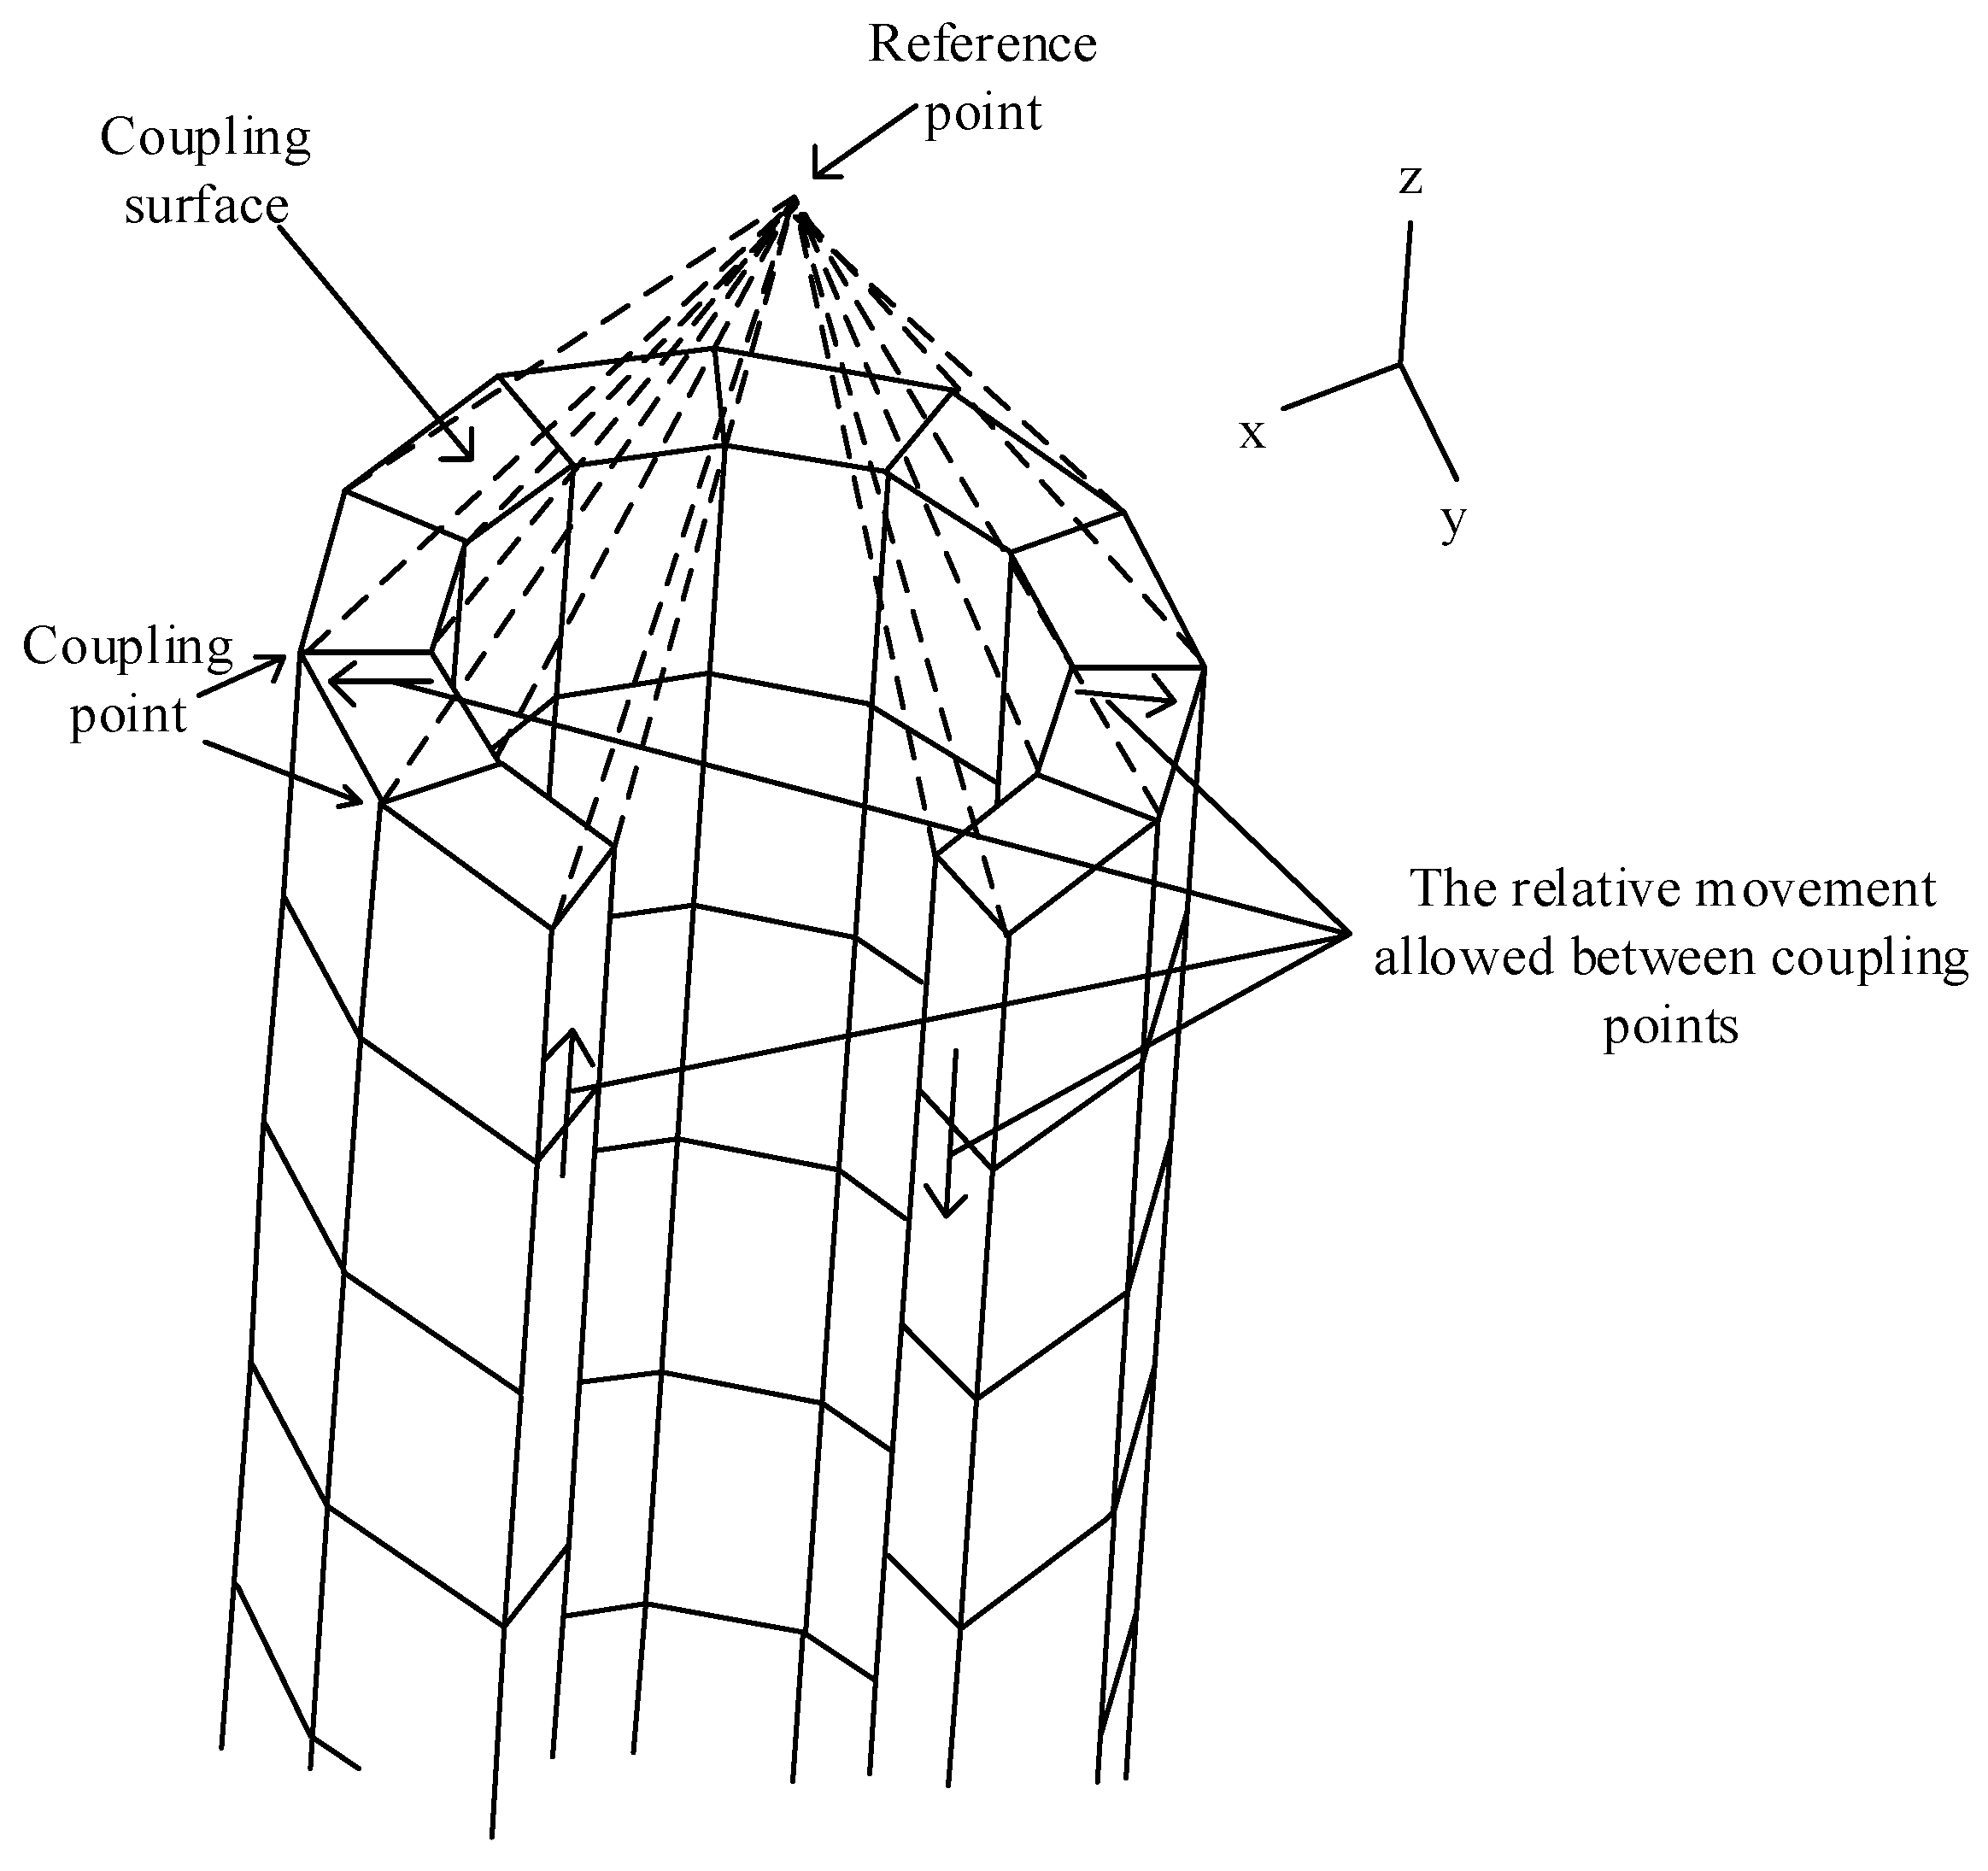
2.1. Interface Connection Method Based on Continuous Distributed Coupling

In multi-scale finite element analysis of concrete structures strengthened with composite materials, the technical threshold in the multi-scale analysis realizes the connection between macro rod elements, micro shell elements, solid elements, etc. There are three kinds of displacements that need to be coordinated between different scale models, namely, transverse displacement, longitudinal displacement, and angular displacement. The interface connection method based on continuous distributed coupling is adopted for the shell element, and the bar element of the concrete structure is strengthened with composite materials.
The continuous distributed coupling diagram is shown in Figure 2.
In Figure 2, the continuous distributed coupling allows the relative movement of each node on the constraint surface. By weighting the movement of each point on the constraint surface, the resultant force and the resultant force distance on this area are equivalent to the force and moment applied on the reference point to solve the problem of tangential overconstraint. Therefore, multi-scale finite element analysis of concrete structures based on continuous distribution coupling theory can theoretically avoid tangent overconstraints caused by multi-scale displacement coordination theories such as lateral displacement, longitudinal displacement, and angular displacement. ABAQUs continuous distributed coupling has four kinds of weighting coefficient calculation methods, including consistent, linear, quadratic, and cubic. After repeated trial calculation, the consistent weighting coefficient calculation method is used to weight the interface nodes. The calculation formula is as follows:
Agreement :   ω i = 1
Linear :   ω i = 1 r i r 0
Quadratic :   ω i = 1 r i r 0 2
Cubic :   ω i = 1 3 r i r 0 2 + 2 r i r 0 3
where, ω i is an interface node i ’s weighting coefficient; r i is an interface node i ’s radial distance to the reference point; r 0 is the radial distance of the farthest point.

2.2. Simulation of Composite Reinforced Concrete Structure

After determining the interface connection mode, the constitutive model of steel frame concrete strengthened with composite materials is combined with the implicit algorithm of the general finite element software ABAQUS and simulated using the material subprogram PQ Liber of steel bar and concrete based on the fiber model.
The concrete constitutive relation is defined according to the concrete skeleton curve of the concrete specification, and the output state variables include the compressive residual strain (compressive strain when unloading to stress 0), unloading/reloading stiffness, yield state of the section, etc. The plastic damage constitutive model of concrete is selected as the solid element of concrete strengthened with composite materials. For stress hardening, two definition methods are provided in ABAQUS: the behavior based on stress–strain and the behavior based on fracture energy. From the analysis of Figure 2, it can be seen that the h-type finite element was selected during the finite element analysis process. Therefore, in the calculation process, the type of element is not changed, but the geometric size of the element is continuously reduced; that is, the mesh is encrypted to improve the calculation results. Based on the analysis principle of stress–strain characteristics in ABAQUS, numerical calculations are carried out on grids with different refinement levels using the inter-distance grid partitioning method. Compared with the analysis results, it can be seen that during the simulation process, as the mesh is refined, the error decreases. Therefore, this finite element analysis method has good convergence and controllability [17]. The performance of convergence can be visualized by comparing the simulation results with the analysis results. The stress–strain relationship is simulated according to Code for Design of Concrete Structures [18], and the tensile and compressive damage factors in this model d c , d t and the calculation formulas are:
d c = 1 σ c E 0 1 ε c p l 1 / b c 1 + σ c E 0 1
d t = 1 σ t E 0 1 ε t p l 1 / b t 1 + σ t E 0 1
where, ε c p l and ε t p l are plastic strain in the compression and tension stages; σ c and σ t are compressive stress and tensile stress, and b c and b t are the ratio of plastic strain to inelastic strain under uniaxial compression and tension, respectively. The stress path is calibrated by unloading and reloading under cyclic load, which are 0.7 and 0.1, respectively.

3. Automatic Detection and Verification of Defects in Composite Reinforced Concrete Structures

In order to achieve multi-scale finite element analysis of reinforced concrete structures reinforced with composite materials, it is necessary to verify the identification results based on the identification of defects in reinforced concrete structures to quantitatively and qualitatively analyze the defect damage in reinforced concrete structures and ultimately use the analysis results to solve the degree, type, and impact on the structural performance of defects. In the identification process, consideration is given to the need to detect and identify non-destructive cavities, cracks, and other non-uniformity in non-destructive reinforced concrete structures. The impact echo method can evaluate the quality and integrity of materials by measuring the reflection and propagation time of sound waves propagating through them. Therefore, it is used to detect and identify concrete quality, voids, cracks, and other issues in reinforced concrete structures, providing an important data basis for structural defect identification. The impact echo method is also used to identify defective composite reinforced concrete structures. Based on the principle of resonance generated by the interaction between elastic waves and the internal structure of the object, the thickness, defect location, and surface crack depth of the composite reinforced concrete structure are calculated based on the resonance frequency [19,20,21].
Due to the use of low-frequency longitudinal wave, the depth measurement is large, and it is less affected by the difference between the material composition and the structural condition of the concrete strengthened by structural composite materials; the indirect determination method is used to conduct impact echo test on the solid plate with known thickness T and obtain the thickness frequency f T . The P-wave velocity can be obtained indirectly by using Equation (7).
There is a direct relationship between stress waves and flaw impact echo detection. The flaw impact echo detection is a common non-destructive identification method, which uses the characteristics of shock wave propagation in materials to identify the flaws in materials. Some parameters in the process of generation and propagation of stress waves, combined with wave velocity, will directly affect the propagation behavior of shock waves in materials and the characteristics of flaw impact echo. The stress wave is related to three important parameters: impact duration, hammer diameter, and hammer impact kinetic energy. Part of the kinetic energy of the impact hammer is converted into the elastic wave energy propagating inside the composite reinforced concrete, and the displacement of the particle generating the stress wave is proportional to the impact force. Shock duration t c is a linear function of the diameter of the impact hammer and has little relationship with the kinetic energy. If the impact hammer falls freely from the height h to the flat composite reinforced concrete slab, the impact duration t c is approximately as
t c = 0.0043 D h 0.1
Usually the value of h ranges from 0.2 to 4 m, so the results of h 0.1 ranges from 0.85 to 1.15. Therefore, the falling height h impact duration t c the impact of is small and can be ignored. There is a non-linear relationship between the impact duration t c and the diameter of the impact hammer D . By utilizing the operation of hammerhead mass κ and impact angle τ , the recognition process is endowed with automated attributes, as shown below:
t c = 0.0043 κ D τ
The stress wave generated by impact contains rich frequency components, which depend on the impact time function. Experience shows that for impact echo test, the frequency is 1.25 t c . The amplitude of the stress wave can meet the requirements.
The identification process is shown in Figure 3 and Figure 4.
In Figure 3 and Figure 4, the stress waves generated by the impact hammer striking the surface of composite reinforced concrete have three forms (see Figure 5): P wave (longitudinal wave), S wave (transverse wave), and R wave (surface wave). The R wave propagates along the surface from the disturbance, and the P and S waves propagate in the form of spherical waves. However, the P wave is related to normal stress propagation, and the S wave is related to shear stress propagation. The low-frequency (≤70 kHz) stress wave generated by the impact hammer striking the composite material reinforced concrete surface propagates to the structure and reflects at the defect or external interface. The reflected wave reaches the striking surface and produces a typical vibration displacement, which is recorded by the sensor and forms a voltage–time signal wave. In order to clarify the types and size ranges of defects in composite reinforced concrete structures and achieve multi-scale finite element analysis of structural defects, X-ray detection technology can be used to transmit and verify the voltage–time signals recorded by sensors; the specific content is as follows. Based on the preliminary results of impact echo detection, X-ray detection technology has selected a detector with an activity of 10–30 Ci. This detector is based on high sensitivity and purity germanium emission X-ray reconstruction images and signal data analysis to obtain quantitative and qualitative information on defects. The specific verification process is:
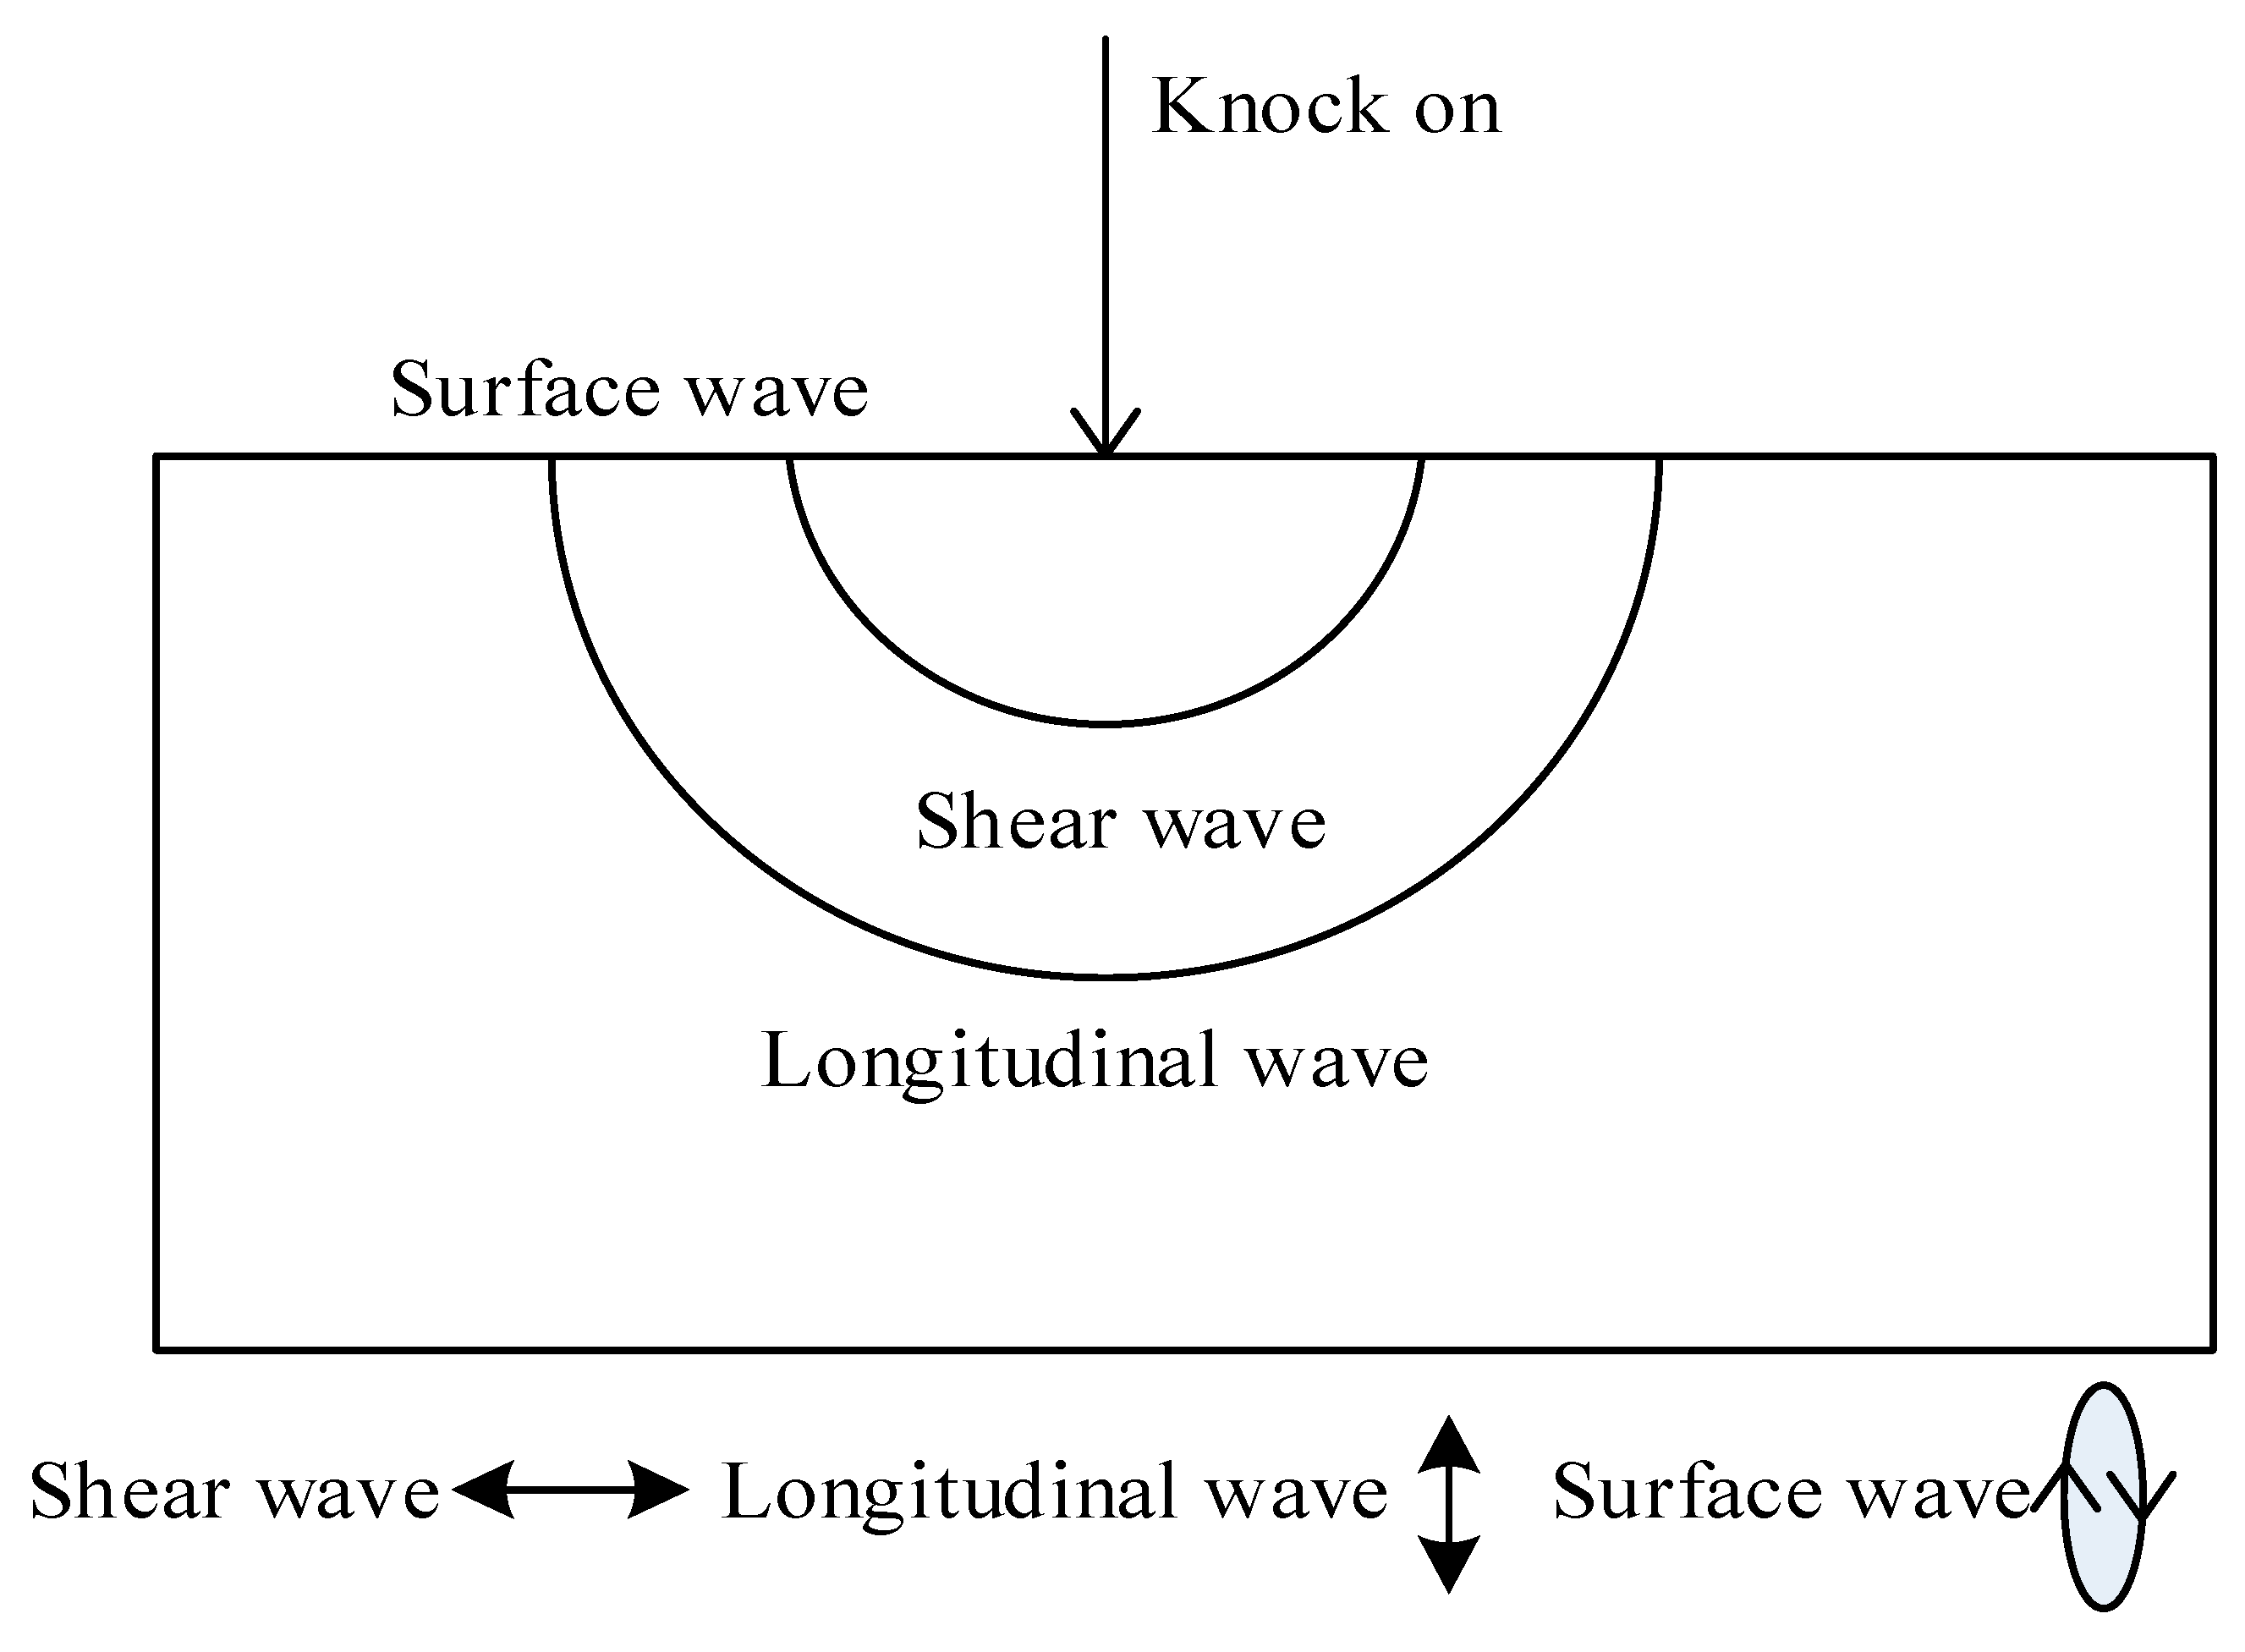
  • Combining Figure 3 with Equations (7) and (8), the intensity A D of the incident X-ray is 100 mGy/cm2/s. The X-ray energy range B h is between 50–10 kilovolts (kV).
  • Measure the transmitted radiation intensity by passing X-rays through the reinforced concrete structure S .
  • Using the transmission formula, calculate the thickness T of composite reinforced concrete by measuring the transmission radiation intensity and the known parameters obtained in Equations (7) and (8). The specific calculation process is as follows:
    S = A D exp μ T B h
    where: T is the broadband radiation absorption coefficient of the material.
According to the transmission formula, if the measured transmission radiation intensity A D is low, it indicates that the material thickness T is correspondingly large, and there may be large crack defects or strong absorption capacity of the material. On the contrary, if the measured transmission radiation intensity A D is high, it indicates that the material thickness T is correspondingly small, and there may be no large crack defects or the material’s absorption capacity is weak, which can help us achieve achieve quantitative and qualitative analysis and verification of defect damage in reinforced concrete structures.
In order to achieve automatic solution verification of T , the fast Fourier transform conversion algorithm is applied to generate amplitude–frequency curves (frequency domain diagrams), and then the resonance frequency is obtained. The automatic solution result for the thickness or defect depth of composite reinforced concrete is:
T = b C p d t d c s f T
where: C p is the speed of P wave propagation; s is the thickness frequency corresponding to the maximum wave peak in the frequency domain diagram; f T is the geometric structure shape coefficient, and for plate structures. The value of b is 0.96.

4. Experimental Analysis

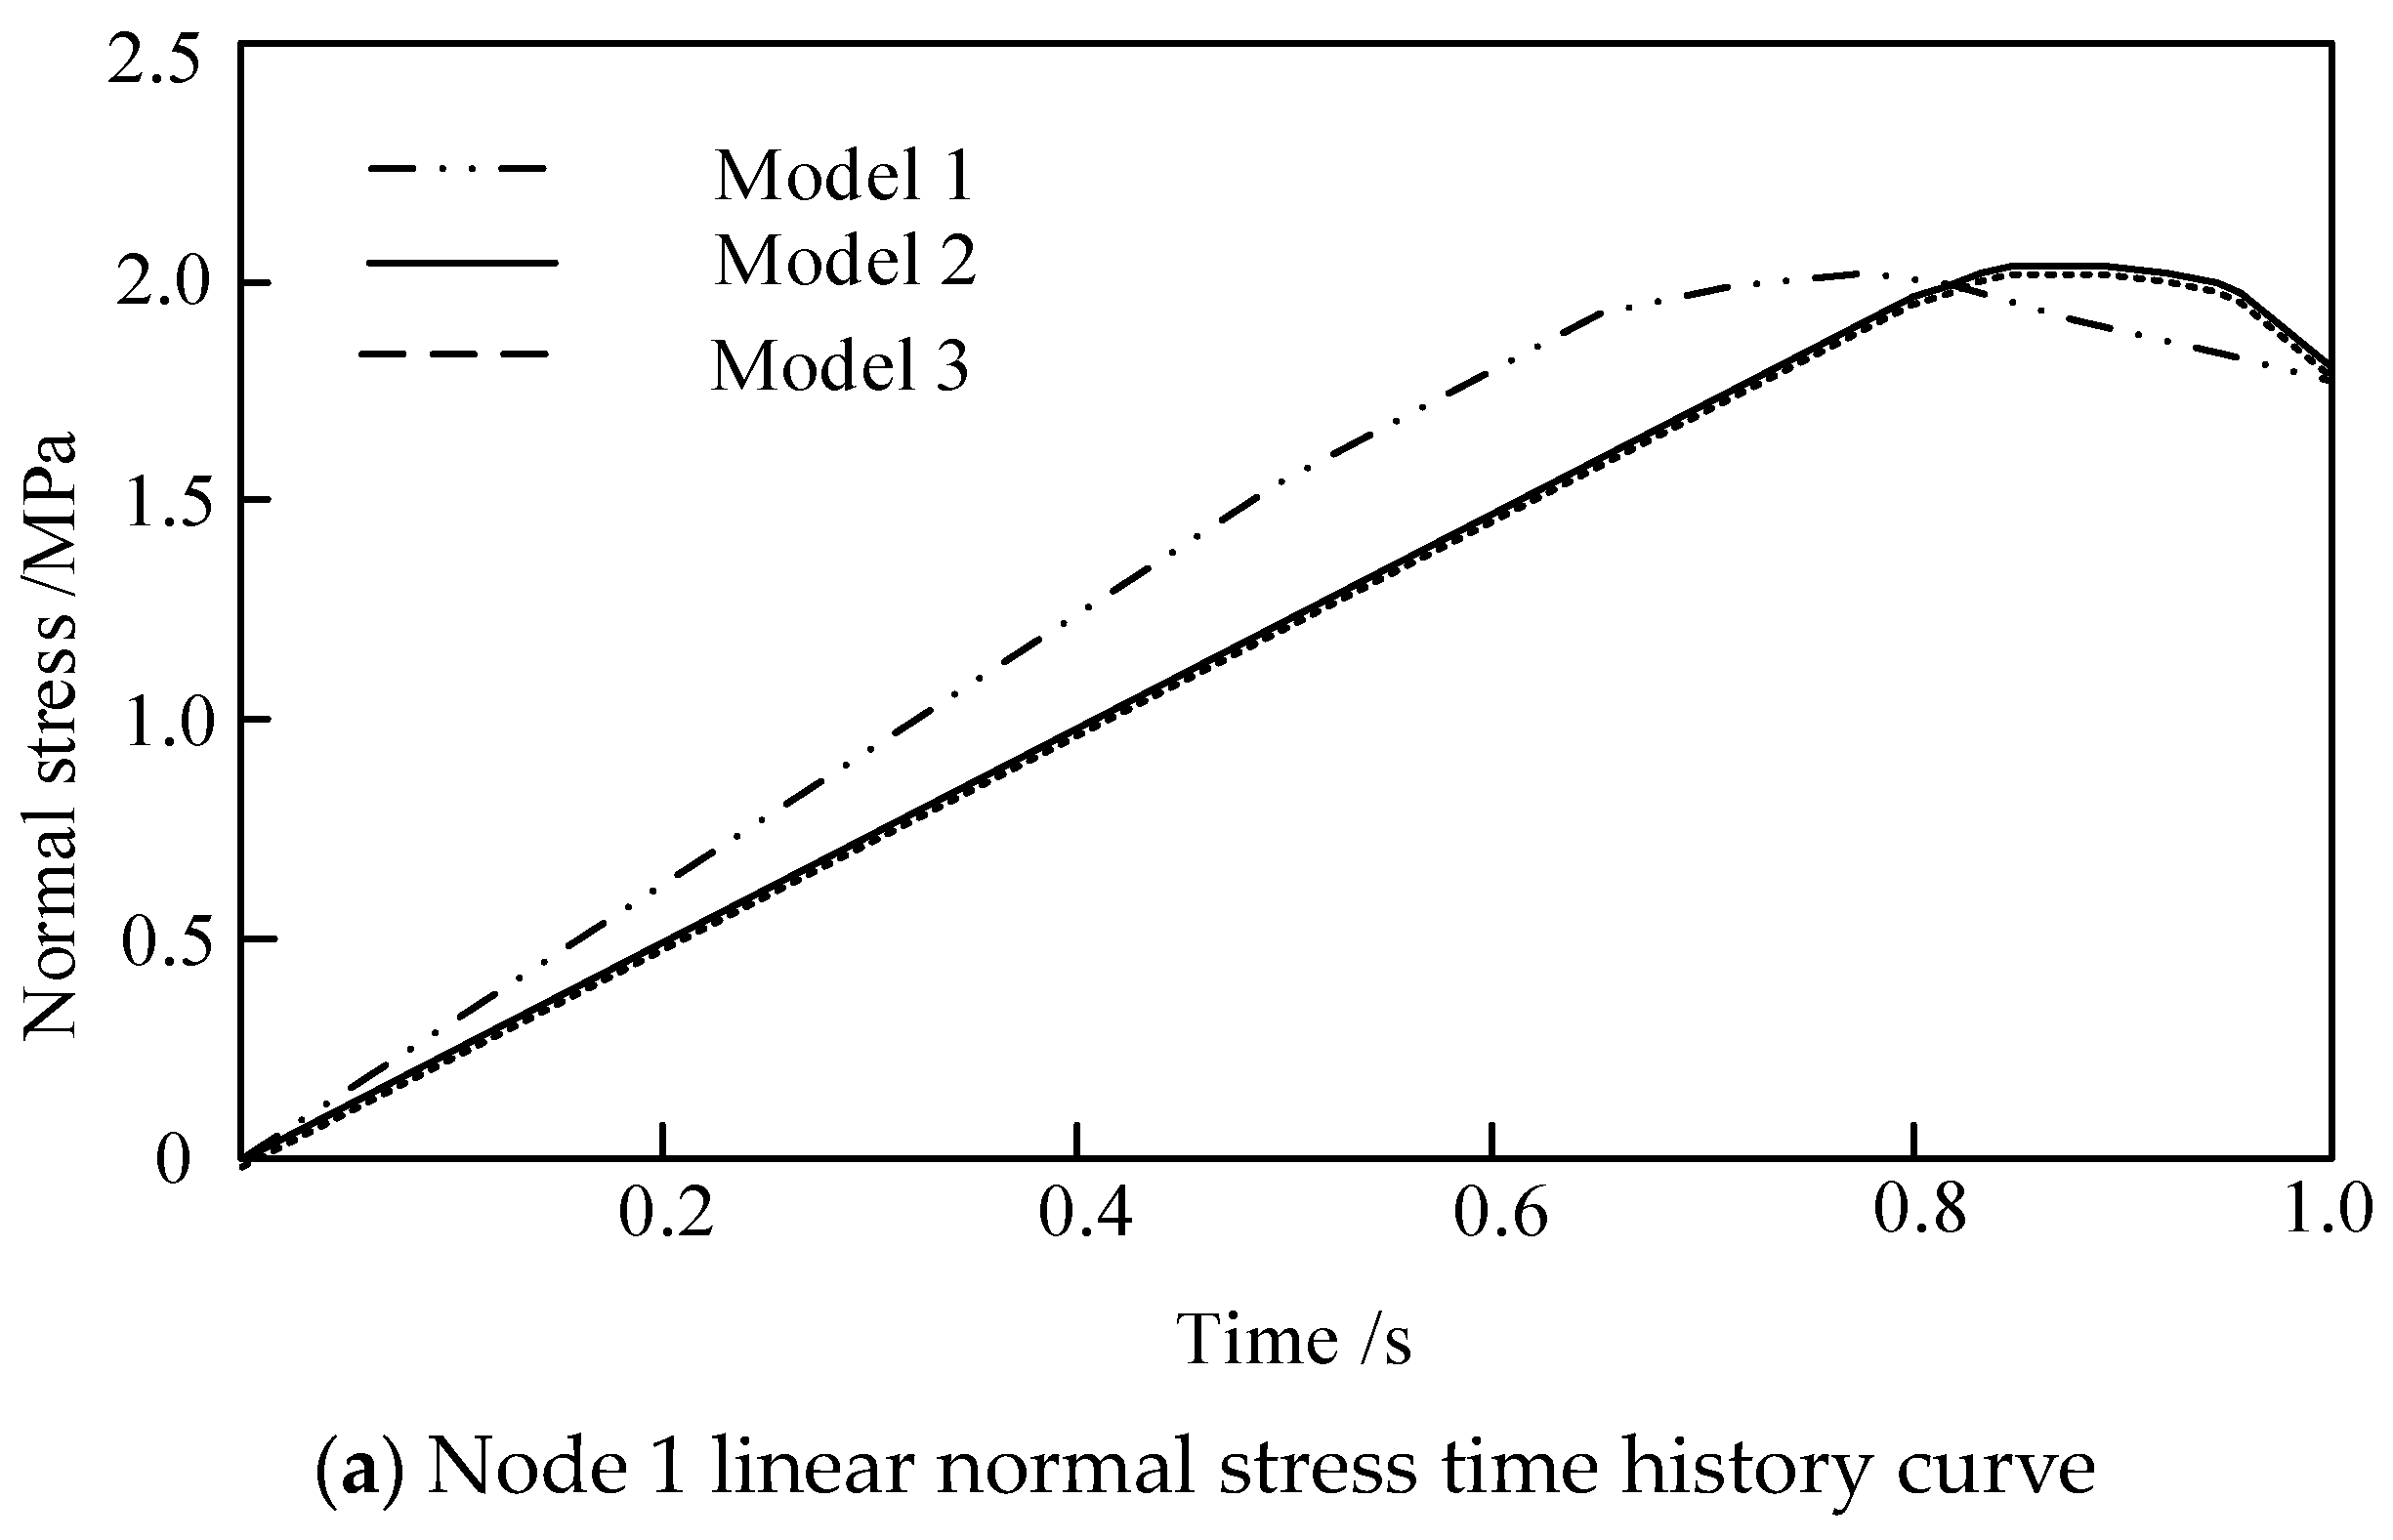
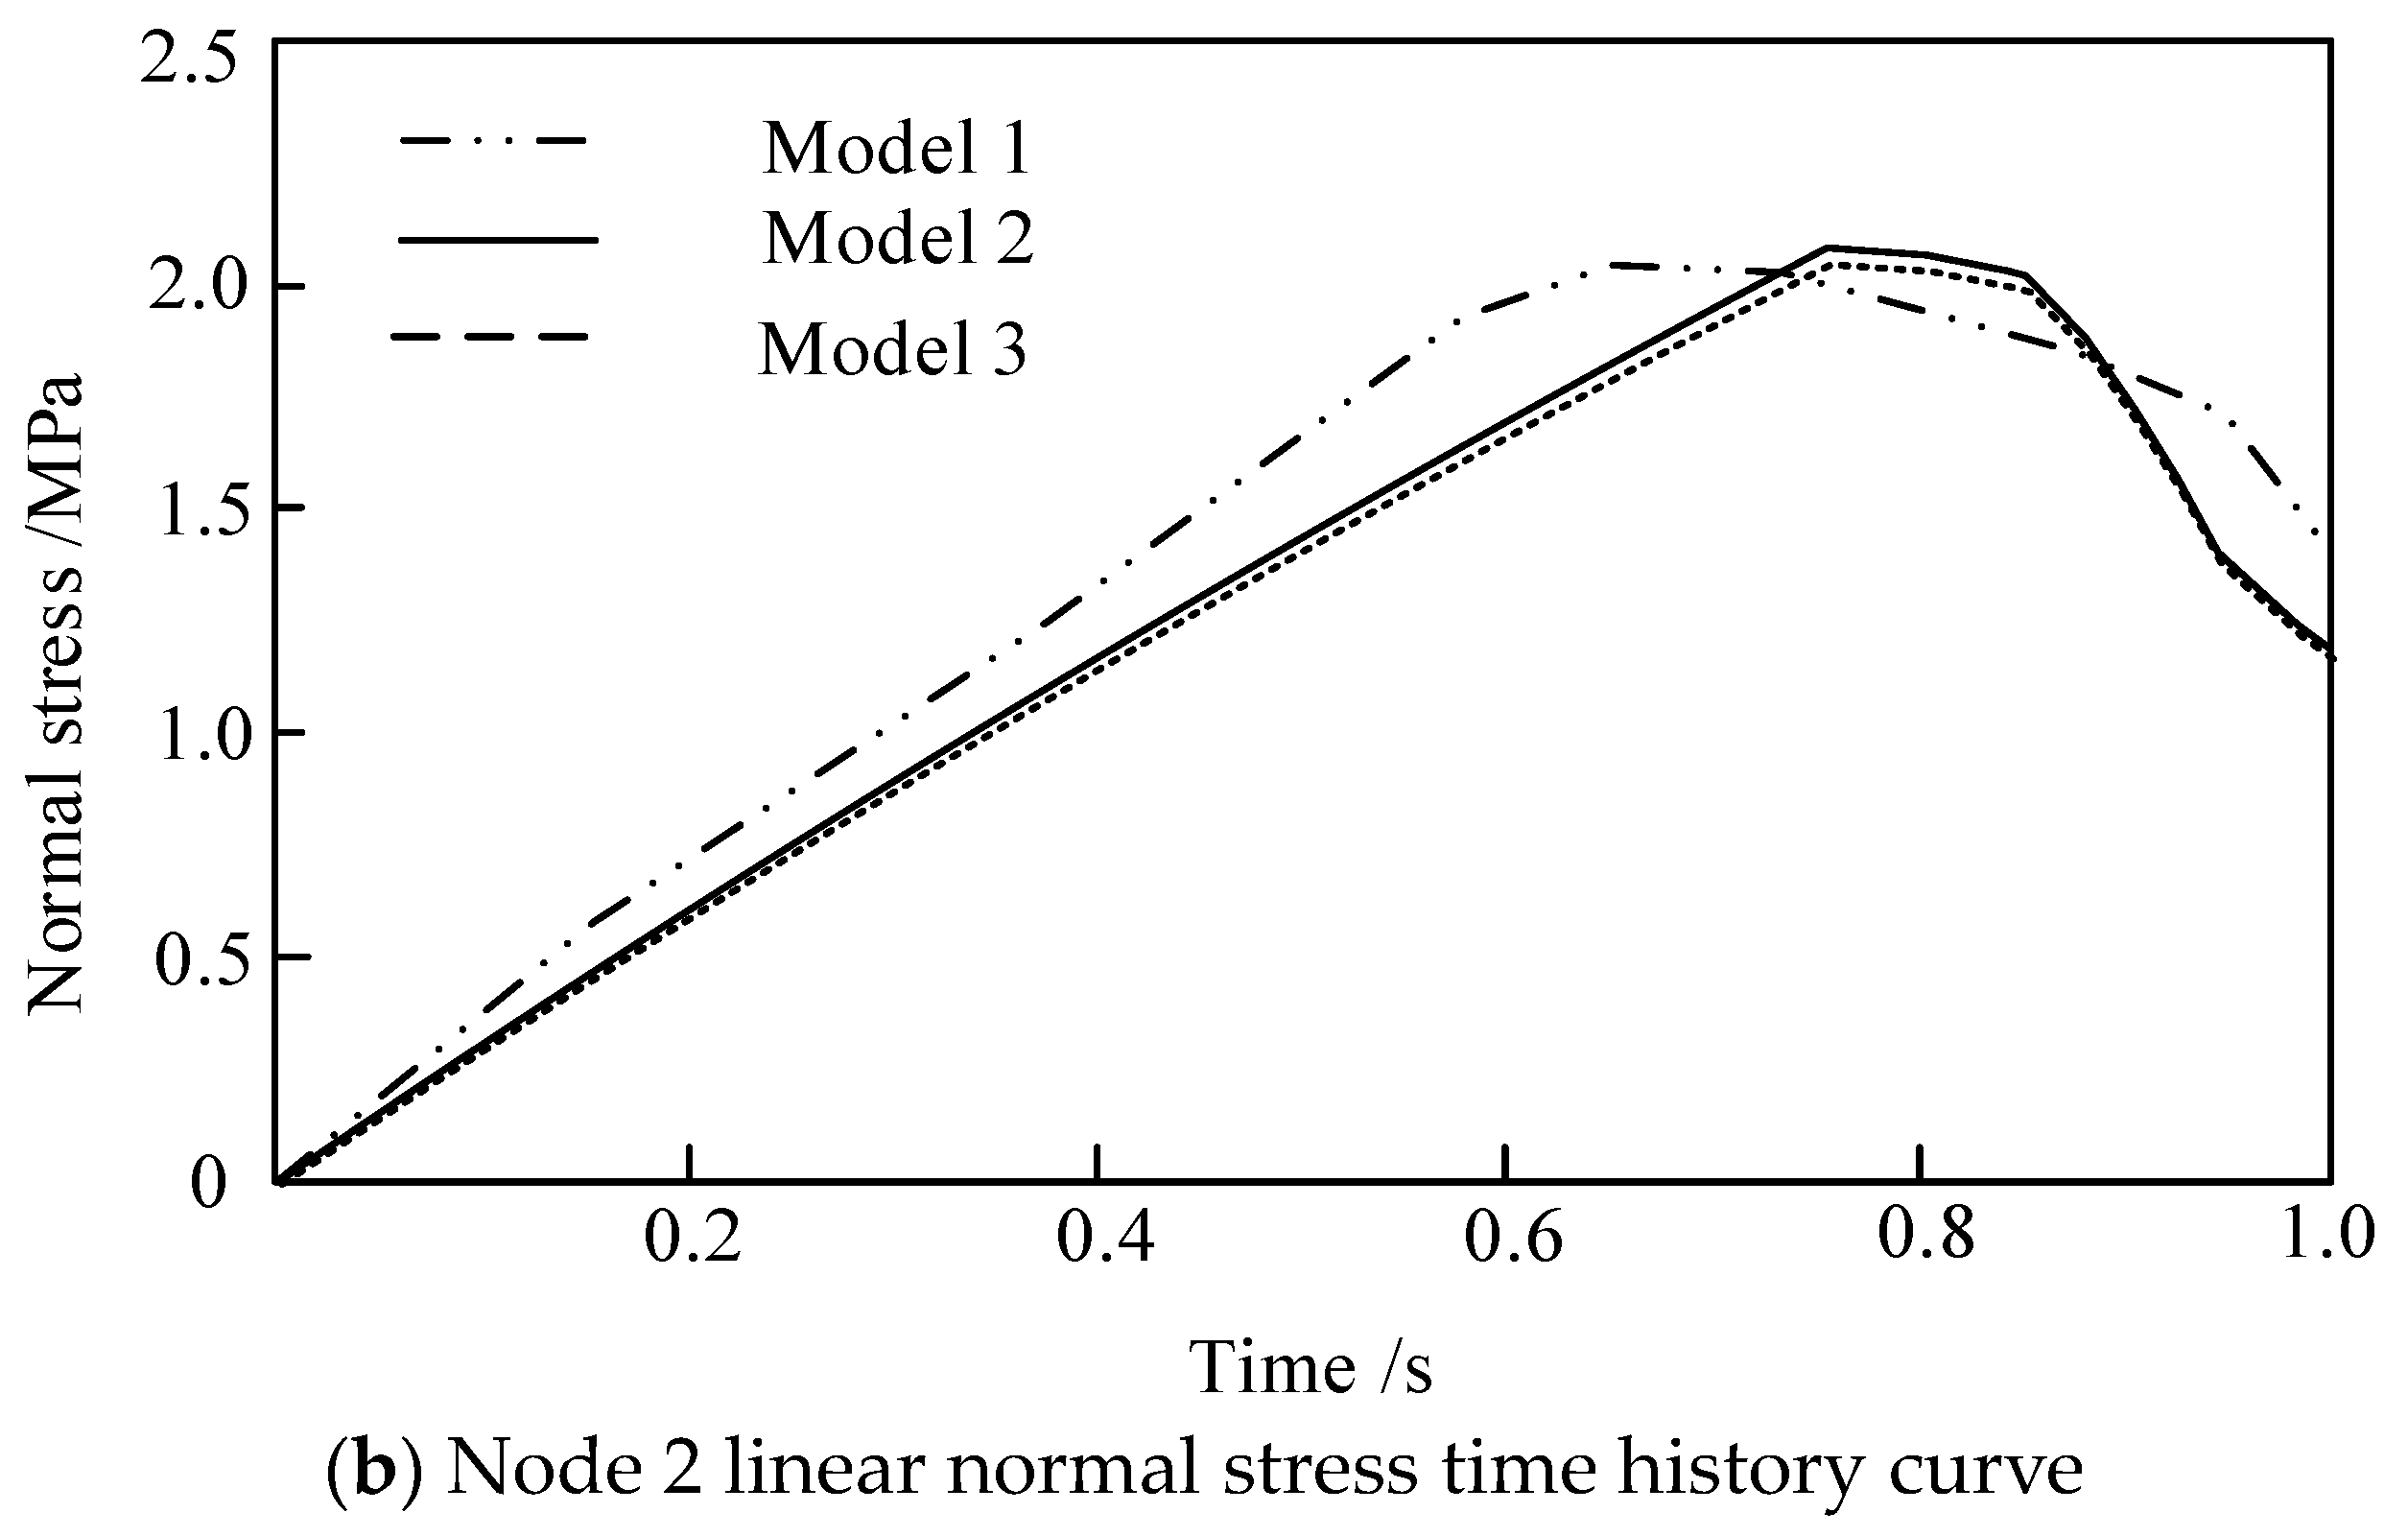
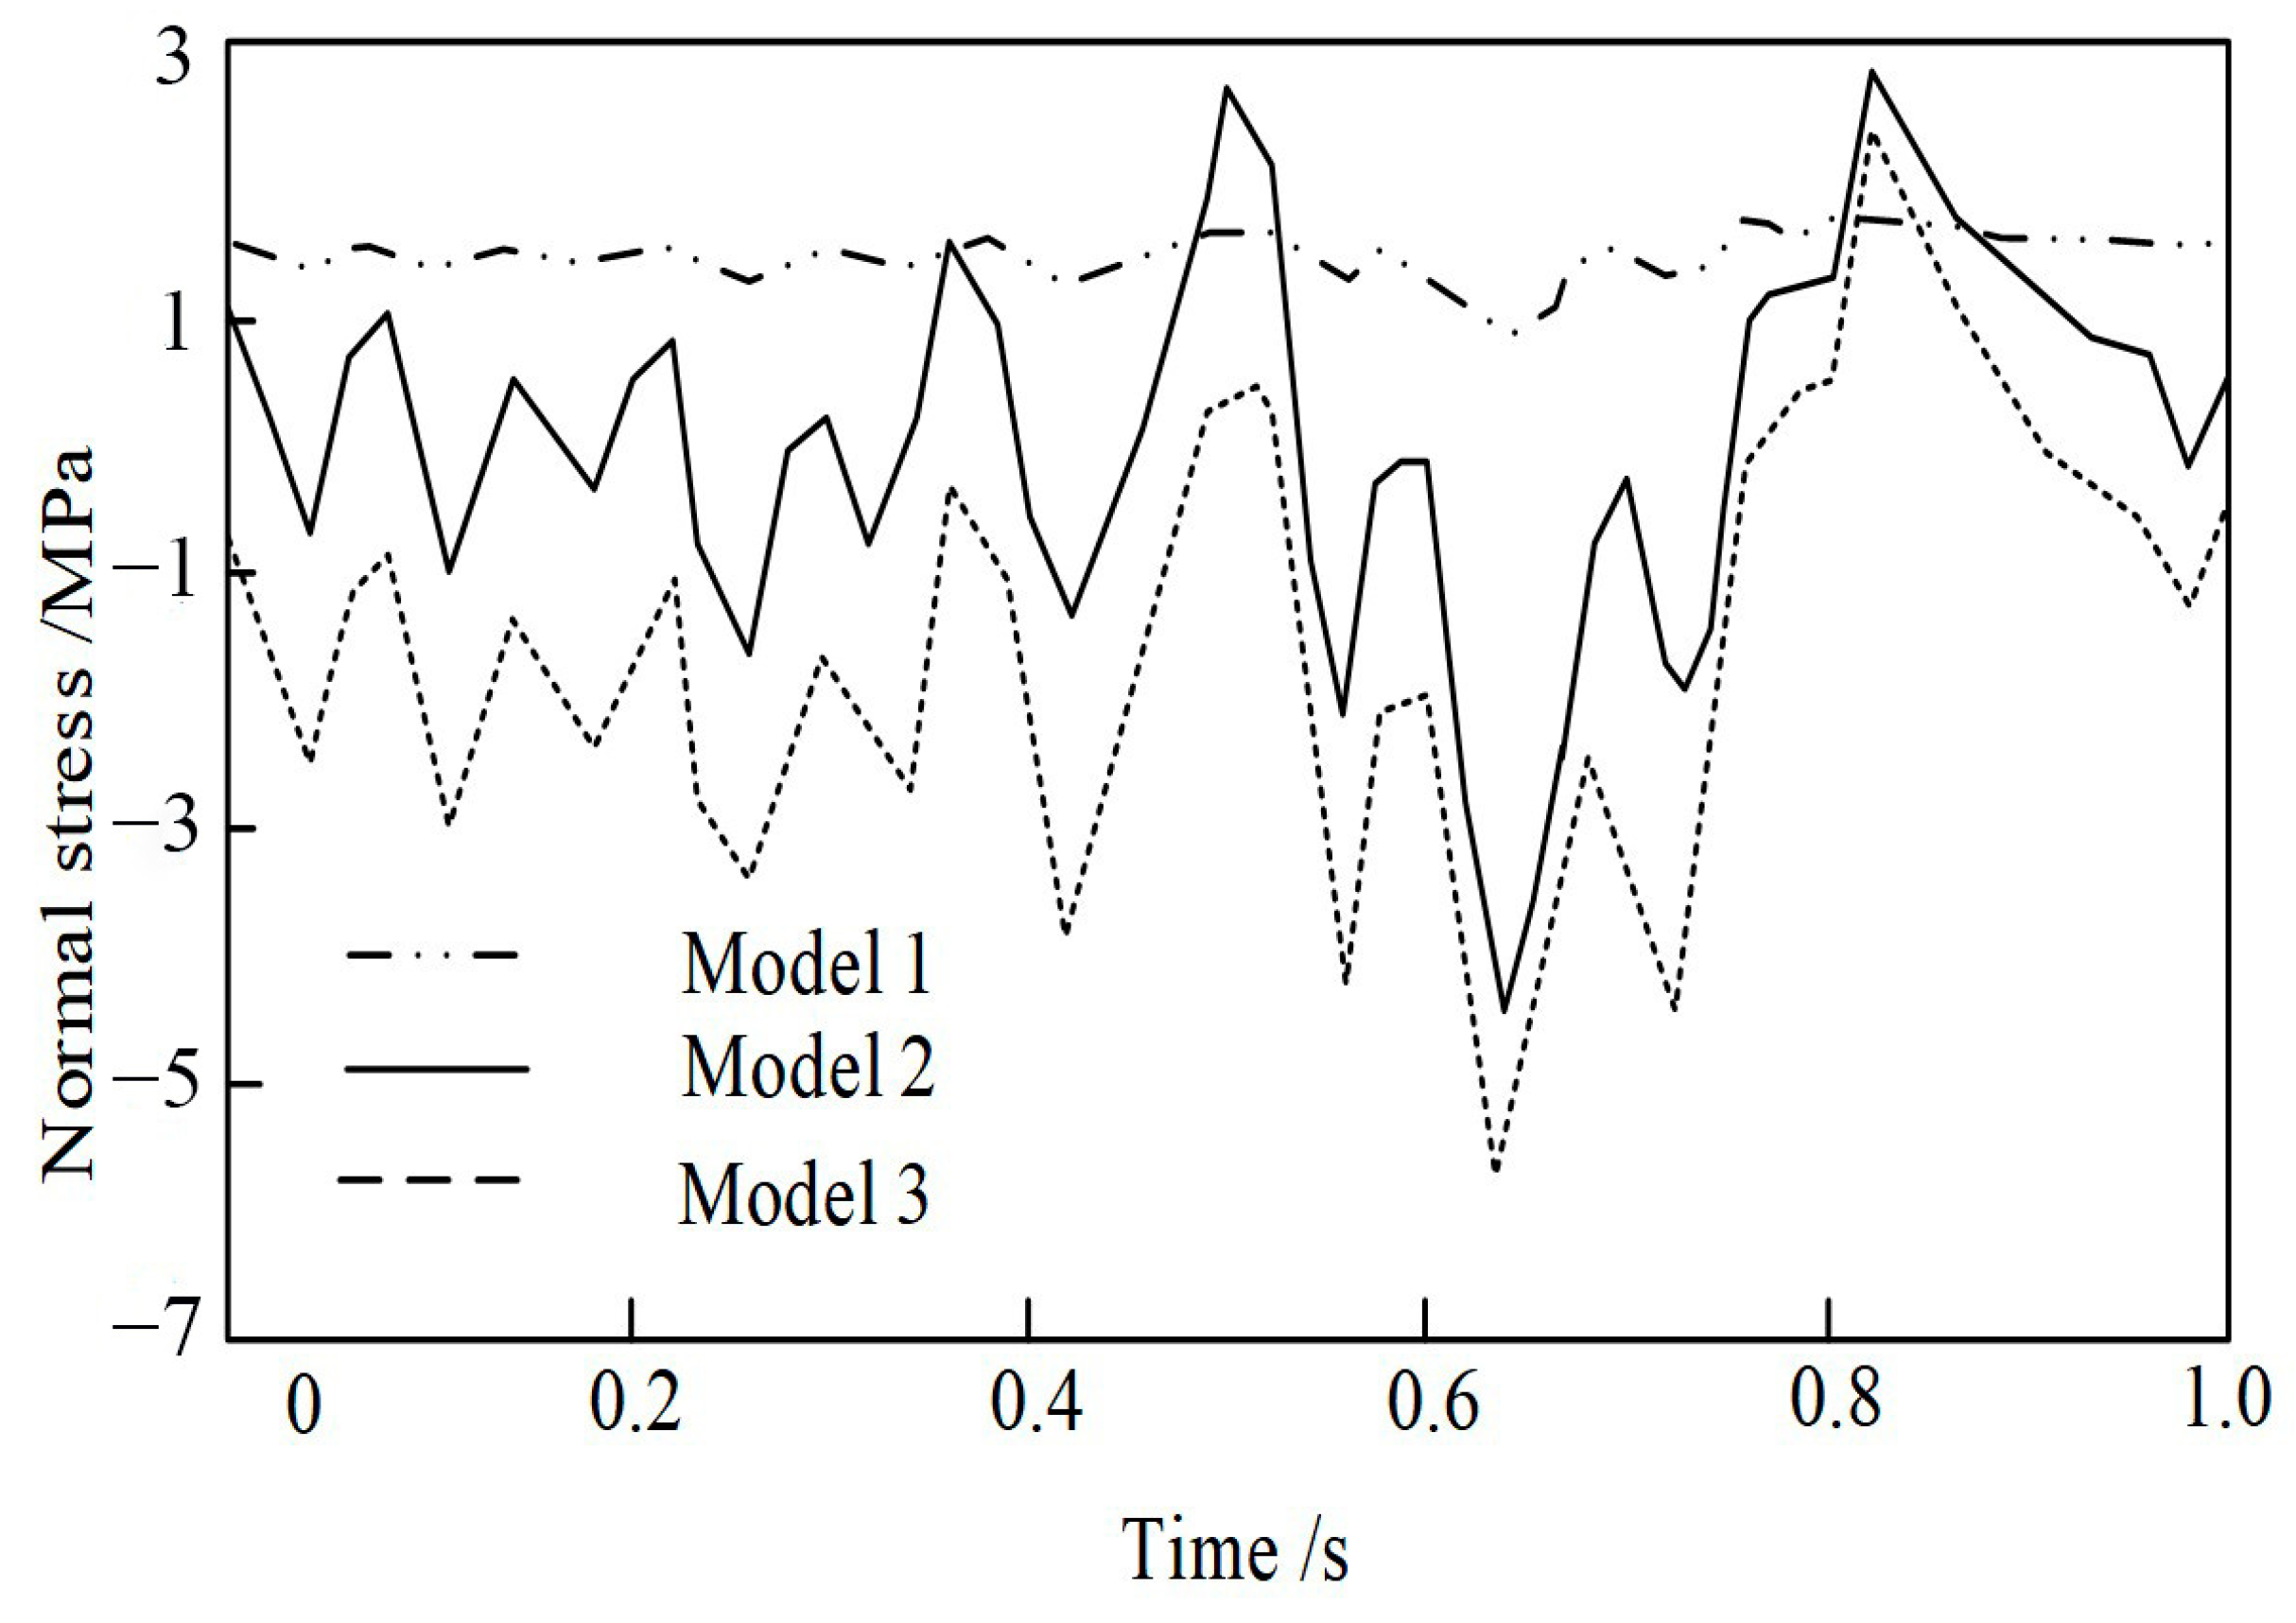
4.1. Analysis of Multi-Scale Modeling Effect

In order to test the accuracy of the multi-scale model used in this method for the modeling of composite reinforced concrete structures, the multi-scale model was tested with various identification methods.
Taking the reinforced concrete four-story three-span plane frame structure of a certain construction project as an example, carbon fiber and epoxy resin were used to reinforce the concrete structure, forming a composite reinforced concrete structure as an experimental object for automatic defect identification. The framework structure monitors the distributed environment using the Hadoop framework configuration, builds a Hadoop node cluster, and implements cluster communication based on the MPI library. The monitoring dataset is written to HDFS.
The specific size of the frame is as follows: the concrete column is 450 mm × 450 mm, the beam Section is 600 mm × 300 mm, the bottom layer is 4.2 m high, the other layers are 3.6 m tall, the spans are 7.2 m, 2.4 m, and 7.2 m respectively, the concrete strength grade is C30, and the steel strength is HRB335.
Carbon fiber includes high-strength and high-elasticity models. The tensile strength of high-strength carbon fiber is 10 times greater than that of reinforcement. The elastic modulus is basically the same as that of reinforcement. The tensile strength of high elastic model carbon fiber is 5 to 10 times larger than that of steel bar. The elastic modulus is 2 to 3 times larger than that of reinforcement, and the properties of carbon fiber materials are shown in Table 1.
The performance of adhesive is the key factor for the success of carbon fiber reinforcement. Generally, three kinds of epoxy resins are used as binders, and their properties are shown in Table 2.
Reinforced with carbon fiber, the material composed of synthetic resin is called carbon fiber composite. Because of the excellent properties of carbon fiber and epoxy resin, only in this way can carbon fiber composites have such excellent mechanical properties, fatigue resistance, and designability.
The main parameters of the frame structure are: the column spacing is 5000 mm; The floor height is 3000 mm; The size, height, and width of the box steel column are 400 mm, and the thickness is 10 mm; The size of the I-shaped steel beam is 300 mm at the edge, 500 mm at the web, and 10 mm at the flange and web. The elastic-plastic analysis software NosaCAD assembles three models of different scales and generates inp files into the finite element analysis software ABAQUS. S4R is used for shell elements of models of different scales, and B31 is used for beam elements. The box steel column and I-shaped steel beam adopt the double broken line follow-up hardening model. The steel yield strength adopts the standard strength value of 345 MPa, and the initial elastic modulus is 206 GPa, which decreases to 1% of the initial elastic modulus after yielding. The calculation models of different scales are shown in Figure 5.
In Figure 5, the first three order periods of the structure are calculated based on this, and by comparing the calculation scales of different models in Figure 5a–c, the content of Table 3 is further obtained. See Table 4 for the comparison results of model quality at different scales.
According to the analysis of the results in Table 3, in the first stage, the cycle time of the rod-system model is 0.701 s, the cycle time of the multi-scale model is 0.694 s, and the cycle time of the fully refined model is 0.671 s. In the second stage, the cycle time of the rod-system model is 0.359 s, the cycle time of the multi-scale model is 0.376 s, and the cycle time of the fully refined model is 0.0392 s. In the third stage, the cycle of the rod-system model is 0.209 s, the cycle of the multi-scale model is 0.215 s, and the cycle of the fully refined model is 0.219 s. Therefore, it can be seen that as the cycle stage deepens, the cycles of all three models continue to shorten. The maximum difference between the period calculated by the multi-scale model and that of the member system element model and the fully refined model will not exceed 5.0%, and the calculation results are basically between the member system element model and the fully refined model. In addition, according to the quality of each scale model listed in Table 4, the difference in size is not more than 1.0%, and the difference is very small. In view of the above two points, it can be basically determined that the connection mode of the multi-scale finite element analysis of the composite reinforced concrete structure constructed in this paper does not affect the overall stiffness of the structure, which can provide a theoretical basis for the automatic identification of defects in composite reinforced concrete structures.
In response to the calculation ideas and analysis perspectives of the above model, reference [7] and reference [8] are introduced as comparative methods for comparative testing and analysis with the method presented in this paper. Three methods were used to construct the model. Reference [7] is Comparative Model 3, reference [8] is Comparative Model 2, and this article’s method is Comparative Model 1. Two points were selected from each of the three models for linear normal stress time history testing, and the results are shown in Figure 6. The normal stress time history curves and free end longitudinal displacement time history curves of the three models under irregular loads are shown in Figure 7 and Figure 8, respectively.
From Figure 6, it can be seen that the time history curve trend of the multi-scale model proposed in this article is very close to that of the fine-scale model, with the time and magnitude of stress reaching yield being basically the same. From Figure 7 and Figure 8, it can be seen that the overall curve changes of the multi-scale model proposed in this article are not significantly different from those of the fine-scale model. The trend of time history curve changes is basically stable, and the parameter values of each node on the multi-scale model are in good agreement with the parameter values set in the experimental environment analysis. However, Model 2, constructed in reference [7], and Model 3, constructed in reference [8], exhibit unstable trends in the time history curve and poor node matching. Therefore, for the purpose of multi-scale analysis of structures, the multi-scale finite element analysis of composite reinforced concrete structures constructed in this paper can effectively ensure the calculation accuracy of key components.
The above three sets of experiments have proven that the model designed in this paper can not only accurately calculate real composite concrete structures but also adapt to irregular loads in actual environments with robustness.

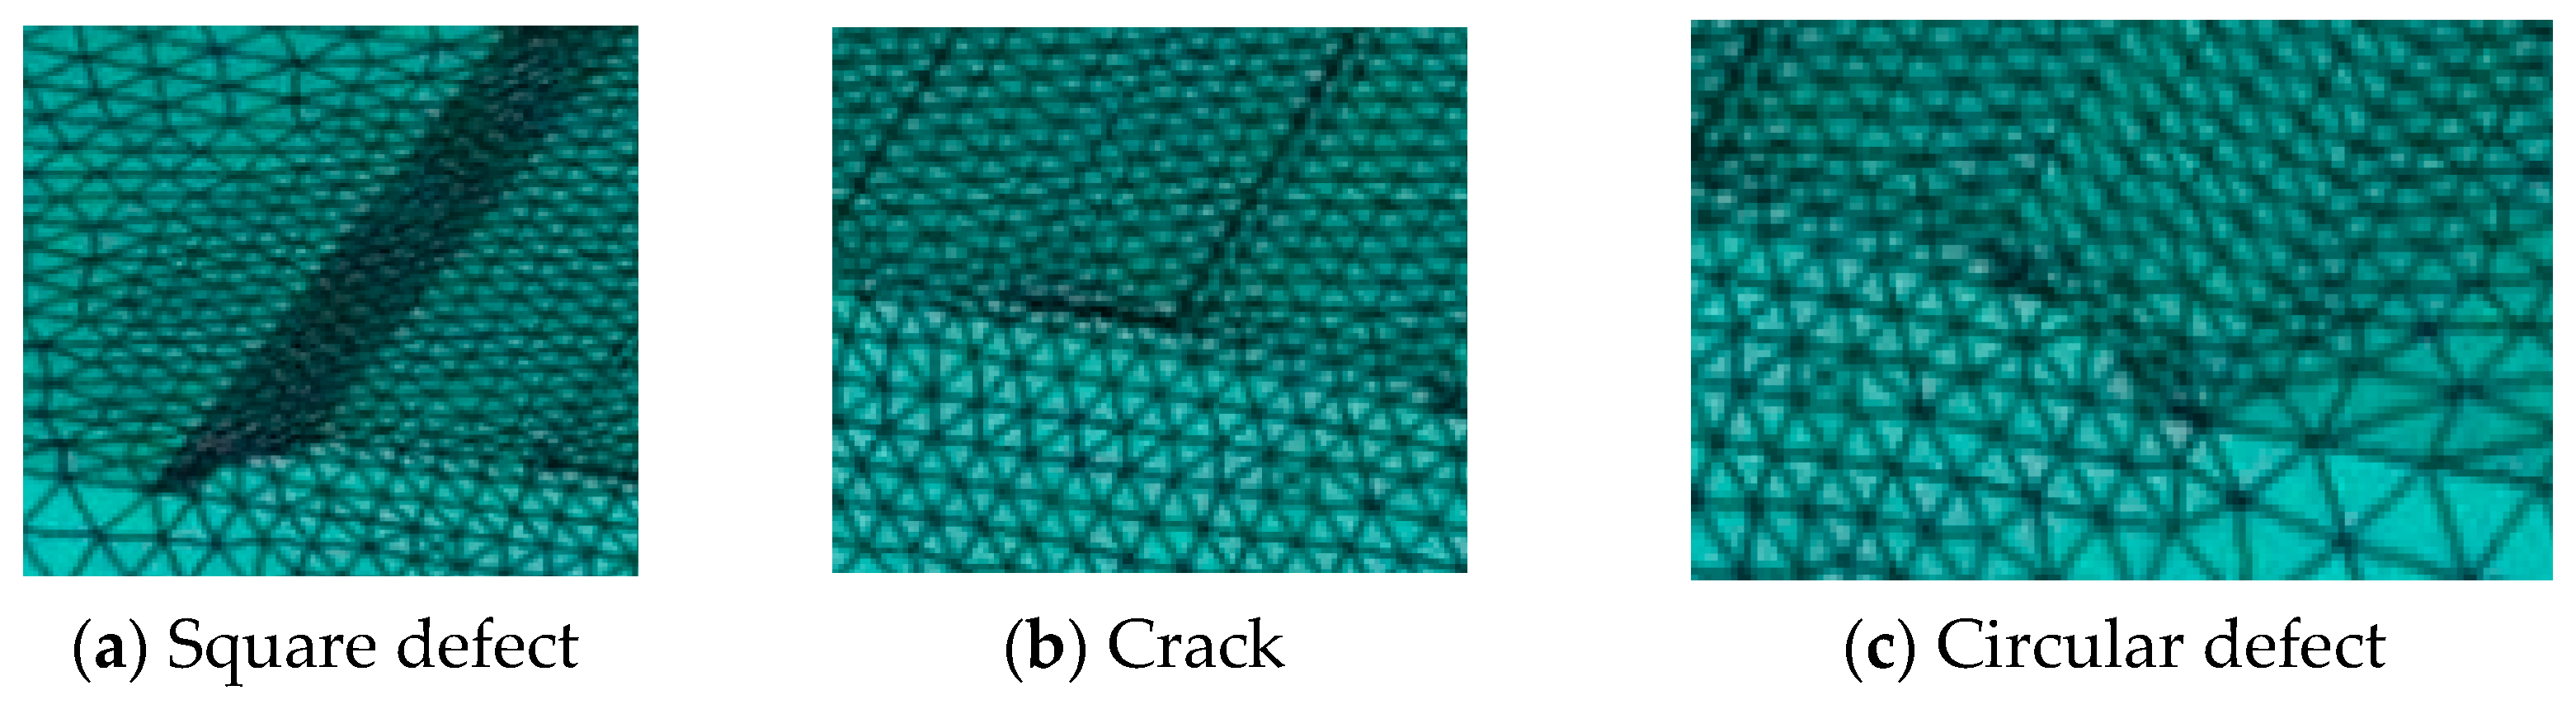
4.2. Analysis of Defect Identification Effect of Concrete Structure Strengthened with Composite Materials

Four finite element models of reinforced concrete composite slab structures with a length of 1000 mm, a width of 600 mm, and a thickness of 200 mm have been established. One group is normal, while the other three groups have cracks, square cavities, and circular cavities, respectively. The length of the crack, the side length of the square cavity, and the diameter of the circular cavity are 10 mm, and the width of the crack is 5 mm. The finite element model of each defect with a buried depth of 200 mm is shown in Figure 9. Apply shock loads to the model and extract the time history waves of nearby nodes for shock echo testing. However, during the testing process, due to the presence of defects (cracks or cavities), the node time history wave signal may be attenuated during propagation, leading to a weakening of the echo signal and resulting in deviation in the final test results. Moreover, if there are multiple defects, the echo signal may reflect and scatter at different defects, which may lead to echo superposition and mutual interference, making it difficult to accurately identify the characteristics of each defect. Considering the possible issues mentioned above, a fast Fourier transform was used during the testing process, and tests were conducted on both symmetrical sides of the model specimen. Therefore, the testable depths of defects were 200 mm, 300 mm, and 400 mm (without considering the joint width), and the unit grid size was 5 mm. Apply a semi-sinusoidal impact load to the unit at the top center of the plate, as shown in Figure 10.
From Figure 9, it can be seen that in Figure 9a, the abnormal situation of the stress or strain field can be observed by checking whether there is a sudden change or abnormality in the stress or strain field at the boundary of the square cavity, observing the abnormal stress or strain distribution corresponding to the length of the square cavity, and identifying the defect. In Figure 9b, abnormal stress or strain fields can be observed using stress or strain observation points to check for localized stress or strain concentration areas. Based on the length and width of cracks, abnormal stress or strain distributions corresponding to these sizes can be found to identify the crack location and identify the defect. In Figure 9c, observe the abnormal situation of the stress or strain field, check whether there is a sudden change or abnormality in the stress or strain field at the boundary of the circular cavity, observe the abnormal stress or strain distribution corresponding to the diameter of the circular cavity, and identify the defect.
Firstly, the impact echo test was carried out on the composite reinforced concrete steel frame without defects; the stress equivalent of the internal stress wave of the material after 55 μ s is shown in Figure 11.
It can be seen from Figure 11 that the stress wave can spread evenly in the composite reinforced concrete steel frame without defects, and it can be seen from the continuous stress wave that the composite reinforced concrete steel frame has no defects.
The impact response time history wave of a node near the impact point on the upper surface of the finite element model is extracted, and the corresponding frequency spectrum curve is obtained by fast Fourier transform, as shown in Figure 12.
Figure 12a shows 1000 μs of the impact echo response waveform within 1s can be clearly seen in its spectrum (Figure 12b) that there is only one significant peak, that is, the thickness frequency peak that appears at 8.53 kHz. According to Equation (7), the frame thickness identified by the impact echo method is 206 mm, and the actual frame thickness is close to 200 mm. The deviation of simulation calculation results is in a reasonable range.
Impact echo testing was carried out on the composite reinforced concrete steel frame with defects. The stress wave cloud diagram of the three defects is shown in Figure 13.
It can be seen from Figure 13 that the stress wave reflects and diffracts when encountering the structural surface of the above three defects. Among them, the square cavity has the largest reflection and diffraction amplitude and the most obvious phenomenon, followed by the crack, and the circular cavity has the smallest phenomenon. This is because the transverse reflection surface of the crack and the square cavity are the same, so their impact echo response is similar. The reflection surface of the circular cavity is curved, and its ability to reflect stress waves will be reduced compared with the plane reflection surface of the square cavity and the crack. However, three kinds of defects can be accurately identified by this method.
In order to verify the application effect of this method, the infrastructure concrete defect detection method based on laser-induced plasma shock wave in reference [7] and the concrete damage detection method based on nonlinear resonance ultrasonic spectroscopy analysis in reference [8] were used as comparative methods. The accuracy of different structural defect identification methods was evaluated by identifying defects and simulating thickness. The comparison results of the accuracy of structural defect identification using different methods are shown in Table 5.
From Table 5, it can be seen that different types of defects are set at different positions in the reinforced concrete composite steel frame. The accuracy of using this method to identify defects has reached 92%, while the accuracy of the reference [7] method is 92%, and the accuracy of the reference [8] method is only 89%. From this, it can be seen that the method proposed in this article can accurately identify defects in reinforced concrete composite structures, with good defect detection performance and excellent practical application results. This is because the method in this article uses the interface connection method based on continuous distribution coupling and the uniform weighting coefficient calculation method to weight the interface nodes, facilitating the determination of the interface connection method and improving the accuracy of stress–strain relationship analysis; The impact echo method was used to analyze the degree of high-frequency stress wave scattering caused by the internal non-uniformity of composite concrete, and the fast Fourier transform algorithm was used to generate amplitude–frequency curves, ultimately improving the accuracy of defect identification.

5. Conclusions

This paper establishes a multi-scale model of reinforced concrete steel frame composite structures. The continuous distribution coupling method was used to determine the interface connection mode, and simulation was conducted on reinforced concrete steel frame composite structures with different defects. The use of the impact echo method for automatic identification of structural defects can accurately identify various defects in simulated composite reinforced concrete steel frames, with an accuracy rate of up to 98%, ensuring high accuracy without affecting subsequent calculation results. However, the precise localization and boundary extraction of defects in composite reinforced concrete structures requires a significant amount of data training. In order to better adapt this study to the current environment, deep learning methods, especially convolutional neural networks and recurrent neural networks, can be used in subsequent research. By training a large amount of structural data, multimodal data fusion can be carried out, further improving the accuracy of defect boundary extraction.

Author Contributions

Conceptualization, X.L. (Xiaoming Lu) and X.L. (Xinyan Lin); methodology, X.L. (Xiaoming Lu); software, X.L. (Xiaoming Lu); validation, X.L. (Xinyan Lin); formal analysis, X.L. (Xinyan Lin); investigation, X.L. (Xinyan Lin); resources, X.L. (Xinyan Lin); data curation, X.L. (Xinyan Lin); writing—original draft preparation, X.L. (Xinyan Lin); writing—review and editing, X.L. (Xiaoming Lu); visualization, X.L. (Xiaoming Lu); supervision, X.L. (Xiaoming Lu); project administration, X.L. (Xinyan Lin); funding acquisition, X.L. (Xinyan Lin). All authors have read and agreed to the published version of the manuscript.

Funding

This research received no external funding.

Institutional Review Board Statement

Not applicable.

Informed Consent Statement

Not applicable.

Data Availability Statement

Data are contained within the article.

Conflicts of Interest

The authors declare no conflict of interest.

References

  1. Sebaibi, N.; Boutouil, M. Reducing energy consumption of prefabricated building elements and lowering the environmental impact of concrete. Eng. Struct. 2020, 213, 110594. [Google Scholar] [CrossRef]
  2. Hallad, S.A.; Banapurmath, N.R.; Bhadrakali, A.S.; Arun, Y.P.; Hunashyal, A.M.; Ganachari, S.V.; Khan, T.M.Y.; Badruddin, I.A.; Soudagar, M.E.M.; Kamangar, S. Nanoceramic Composites for Nuclear Radiation Attenuation. Materials 2022, 15, 262. [Google Scholar] [CrossRef] [PubMed]
  3. Mahdi, S.; Saeed, M.M.; Behzad, G.; Fazel, A.; Masoud, A.; Thoi, T.N.; Shariati, A. A novel hybrid extreme learning machine–grey wolf optimizer (elm-gwo) model to predict compressive strength of concrete with partial replacements for cement. Eng. Comput. 2022, 38, 757–779. [Google Scholar]
  4. Sugiyama, T.; Promentilla, M.A.B. Advancing concrete durability research through X-ray computed tomography. J. Adv. Concr. Technol. 2021, 19, 730–755. [Google Scholar] [CrossRef]
  5. Ghandourah, E.; Khatir, S.; Banoqitah, E.M.; Alhawsawi, A.M.; Benaissa, B.; Wahab, M.A. Enhanced ANN Predictive Model for Composite Pipes Subjected to Low-Velocity Impact Loads. Buildings 2023, 13, 973. [Google Scholar] [CrossRef]
  6. Slimani, M.; Khatir, T.; Tiachacht, S.; Boutchicha, D.; Benaissa, B. Experimental sensitivity analysis of sensor placement based on virtual springs and damage quantification in CFRP composite. J. Mater. Eng. Struct. «JMES» 2022, 9, 207–220. [Google Scholar]
  7. Wakata, S.; Hosoya, N.; Hasegawa, N.; Nishikino, M. Defect detection of concrete in infrastructure based on rayleigh wave propagation generated by laser-induced plasma shock waves. Int. J. Mech. Sci. 2022, 218, 107039–107049. [Google Scholar] [CrossRef]
  8. Matysík, M.; Plšková, I.; Chobola, Z. Sensitivity assessment of the nonlinear resonant ultrasonic spectroscopy for concrete damage detection. Key Eng. Mater. 2020, 868, 51–56. [Google Scholar] [CrossRef]
  9. Chun, P.J.; Izumi, S.; Yamane, T. Automatic detection method of cracks from concrete surface imagery using two-step light gradient boosting machine. Comput.-Aided Civ. Infrastruct. Eng. 2020, 36, 61–72. [Google Scholar] [CrossRef]
  10. Coleman, Z.W.; Schindler, A.K.; Jetzel, C.M. Impact-echo defect detection in reinforced concrete bridge decks without overlays. J. Perform. Constr. Facil. 2021, 35, 4021058–4021069. [Google Scholar] [CrossRef]
  11. Wu, Y.Q.; Wang, Y.P.; Li, D.; Zhang, J. Two-step detection of concrete internal condition using array ultrasound and deep learning. Ndt & E Int. 2023, 139, 102945. [Google Scholar]
  12. Shirinbayan, M.; Rezaei-khamseh, M.; Nikooharf, M.H.; Tcharkhtchi, A.; Fitoussi, J. Multi-scale analysis of mechanical properties and damage behavior of polypropylene composite (GF50-PP) plate at room and cryogenic temperatures. Compos. Struct. 2021, 278, 114713. [Google Scholar] [CrossRef]
  13. Suo, Y.Y.; Wang, X.; Wang, B.; Wang, Q.; Ni, D.; Jia, P. Multi-scale analysis of effect of uncertainties on mechanical properties of particle reinforced metal matrix composites and experimental validation. J. Mater. Eng. 2023, 51, 157–164. [Google Scholar]
  14. Patil, A.Y.; Hegde, C.; Savanur, G.; Kanakmood, S.M.; Contractor, A.M.; Shirashyad, V.B.; Chivate, R.M.; Kotturshettar, B.B.; Mathad, S.N.; Patil, M.B.; et al. Biomimicking Nature-Inspired Design Structures—An Experimental and Simulation Approach Using Additive Manufacturing. Biomimetics 2022, 7, 186. [Google Scholar] [CrossRef] [PubMed]
  15. Caggiano, A.; Schicchi, D.S.; Yang, S.; Harenberg, S.; Koenders, E.A.B. A microscale approach for modelling concrete fatigue damage-mechanisms. Key Eng. Mater. 2020, 827, 73–78. [Google Scholar] [CrossRef]
  16. Ramyar, E.; Cusatis, G. Discrete fresh concrete model for simulation of ordinary, self-consolidating, and printable concrete flow. J. Eng. Mech. 2022, 148, 04021142. [Google Scholar] [CrossRef]
  17. Nimbagal, V.; Banapurmath, N.R.; Sajjan, A.M.; Patil, A.Y.; Ganachari, S.V. Studies on Hybrid Bio-Nanocomposites for Structural Applications. J. Mater. Eng. Perform. 2021, 30, 6461–6480. [Google Scholar] [CrossRef]
  18. GB50010-2010, Standards for Design of Concrete Structures. 2015. Available online: https://www.codeofchina.com/standard/GB50010-2010(2015).html (accessed on 1 November 2023).
  19. Kachanov, V.K.; Sokolov, I.V.; Samokrutov, A.A.; Lunin, V.P.; Fedorenko, S.A. Measuring the acoustic characteristics of compact concrete building structures using the impact echo method. Russ. J. Nondestruct. Test. 2022, 58, 236. [Google Scholar] [CrossRef]
  20. Onate, E.; Cornejo, A.; Zarate, F.; Kashiyama, K.; Franci, A. Combination of the finite element method and particle-based methods for predicting the failure of reinforced concrete structures under extreme water forces. Eng. Struct. 2022, 251, 113510.1–113510.18. [Google Scholar] [CrossRef]
  21. Vo, N.H.; Pham, T.; Bi, K.; Chen, W.; Hao, H. Stress wave mitigation properties of dual-meta panels against blast loads. Int. J. Impact Eng. 2021, 154, 103877. [Google Scholar] [CrossRef]
Figure 1. Overall workflow of finite element analysis.
Coatings 13 02005 g001
Figure 2. Continuous distribution coupling.
Coatings 13 02005 g002
Figure 3. Principle of impact echo detection.
Coatings 13 02005 g003
Figure 4. Stress wave generated by the impact on a concrete slab.
Coatings 13 02005 g004
Figure 5. Computational models at different scales.
Coatings 13 02005 g005
Figure 6. Linear dynamic load normal stress time history curve.
Coatings 13 02005 g006aCoatings 13 02005 g006b
Figure 7. Irregular load node 1 Irregular normal stress time history curve.
Coatings 13 02005 g007
Figure 8. Free end under irregular loading longitudinal displacement time history curve.
Coatings 13 02005 g008
Figure 9. Finite element models of reinforced concrete slabs with different defect composites.
Coatings 13 02005 g009
Figure 10. Shock load time history curve.
Coatings 13 02005 g010
Figure 11. Stress wave cloud diagram subjected to impact for 55 μ s.
Coatings 13 02005 g011
Figure 12. Impact echo of reinforced concrete steel frame with no defect composite material.
Coatings 13 02005 g012
Figure 13. Stress wave cloud maps of three kinds of concrete defects.
Coatings 13 02005 g013
Table 1. Properties of carbon fiber materials.
TypeWCarbon Fiber Material
FiberHigh Tensile Carbon FiberHigh Elastic Modulus Carbon Fiber
Fiber weight (g/cm2)FTS-C1-20FTS-C1-30FTS-C5-30FTS-C6-30FTS-C6-30
Fiber density (g/cm2)200300300300300
Design thickness (mm)1.81.81.82.12.2
Design tensile strength (Mpa)0.110.170.170.141.1
Design tensile elastic die (Mpa)2.35 × 1052.35 × 1053.8 × 1055.0 × 1055.5 × 105
Table 2. Binder Performance.
Resin ClassTensile StrengthBending StrengthCompressive StrengthTensile Shear StrengthPositive Tensile Bonding Strength
Base resin >1.9
Leveling material >34.0>9.0>2.0
Impregnated resin>29.0>39.0 >9.8
Table 3. Model cycles at different scales.
Cycle/sModel
Bar ElementMulti-ScaleFull Refinement
The first stage0.7010.6940.671
The second stage0.3590.3760.392
The third stage0.2090.2150.219
Table 4. Model quality at different scales.
ModelBar ElementMulti-ScaleFull Refinement
Quality/t9.6779.6119.603
Table 5. Test results of different defects.
Test MethodFrame
Thickness/mm
Top of Defect Distance/mmThickness
Frequency/Hz
Defect
Frequency/Hz
Recognition
Accuracy/%
Proposed method2001009531.819,050.698
Reference [7] method2001009523.419,205.892
Reference [8] method2001009496.118,904.289
Disclaimer/Publisher’s Note: The statements, opinions and data contained in all publications are solely those of the individual author(s) and contributor(s) and not of MDPI and/or the editor(s). MDPI and/or the editor(s) disclaim responsibility for any injury to people or property resulting from any ideas, methods, instructions or products referred to in the content.

