Article

Preparation of Microcrystalline Cellulose-Derived Carbon Dots as a Sensor for Fe3+ Detection

1
Department of Chemical Engineering, Textile and Clothing, Shaanxi Polytechnic Institute, Xianyang 712000, China
2
School of Surveying & Testing, Shaanxi Railway Institute, Weinan 714000, China
3
School of Chemistry and Chemical Engineering, Guangzhou University, Guangzhou 510006, China
4
Technology Department, Petrochina Sichuan Petrochemical Co., Ltd., Chengdu 610000, China
5
School of Materials Science & Engineering, Xi’an Polytechnic University, Xi’an 710048, China
*
Authors to whom correspondence should be addressed.
Coatings 2023, 13(12), 1979; https://doi.org/10.3390/coatings13121979
Submission received: 26 September 2023 / Revised: 8 November 2023 / Accepted: 8 November 2023 / Published: 21 November 2023

Abstract

:
In this article, nitrogen-doped carbon dots (N-CDs) were prepared by a hydrothermal method using microcrystalline cellulose as the carbon source and polyethylenimine as the nitrogen source. The ratio of microcrystalline cellulose to polyethylenimine added exerted a great influence on the fluorescence quantum yield of N-CDs. The fluorescence intensity of N-CDs 2 was significantly affected by the solvent type and pH value, but not influenced by the time of irradiation with the UV lamp. Intriguingly, N-CDs 2 could be applied to temperature sensing (30~70 °C). With the addition of Fe3+ (20 ppm), the fluorescence of N-CDs 2 was greatly quenched, and the quenching rate reached 82.84%. The fluorescence intensity of N-CDs 2 showed a good linear relationship (R2 = 0.995) with Fe3+ concentrations (0~14 ppm), and they achieved a limit of detection of 0.21 ppm. In addition, N-CDs 2 could also effectively detect Fe3+ in real water samples, showing a good recovery rate (98.25%~102.75%) and low relative standard deviation (less than 3%). According to the fluorescence lifetime data, the fluorescence quenching of N-CDs by Fe3+ might be a static process.

1. Introduction

As one of the most important trace elements in biological systems, iron ions play a critical role in maintaining living systems [1]. Iron (III) deficiency can cause multiple tissue changes and functional disorders, and even lead to anemia and mental decline [2]. Excessive intake of iron can damage vital organs of the human body such as the heart, liver, and lungs, increasing the risk of tissue inflammation and cancer [3]. In addition, iron ions are also widely present in natural environments, including various animals and plants, soil, and water in watersheds. Iron ions accumulate in soil and water, affecting the growth of animals and plants. Similarly, excessively high levels of iron ions in industrial circulating water can result in serious scaling and endanger production safety. Therefore, a fast, accurate, and low-cost detection method for iron ions is of great significance in protecting human health and preventing metal ion pollution in the environment.
Traditional instrumental analysis methods for detecting Fe3+ include inductively coupled plasma mass spectrometry, electrical techniques, and atomic absorption spectroscopy. However, these methods are time-consuming and expensive, and require technical personnel for operations [4]. Fluorescent sensors have aroused research interest due to their merits of ease of use, low cost, and portability [5]. Although traditional chemical probes such as fluorescent dyes, some metal organic frameworks, and noble-metal nanomaterials can be used to detect Fe3+, they still have the disadvantages of complicated preparation steps, non-renewability, and poor biocompatibility [6,7,8]. Therefore, it is particularly urgent to develop naturally renewable materials that can detect Fe3+ ions.
As a new type of carbon nanomaterial, carbon dots (CDs) can be applied in fields as diverse as metal ion detection, light-emitting diodes, biological imaging, drug carriers, fluorescent inks, and photocatalysis, due to their stable optical properties, excellent water solubility, outstanding biocompatibility, and low toxicity [9]. The preparation methods of CDs include hydrothermal or solvothermal methods, chemical ablation, microwave irradiation, ultrasonic treatment, laser ablation, and electrochemical carbonization [10]. A variety of precursor materials are currently available as carbon sources, such as molecular precursors (e.g., citric acids and sugars), biomass precursors (e.g., watermelon peel and milk), and waste precursors (e.g., carbon paper and soot) [11]. As Fernando put it, CDs are not “picky” about carbon sources because defects determine the excited state properties of CDs [12]. However, low cost, availability, renewability, and environmental protection should all be taken into account when selecting carbon sources for CDs. Raw materials with “zero” greenhouse gas emissions (e.g., carbon dioxide) are recommended as the carbon source of CDs in order to better cope with climate change. Cellulose, produced by plants through photosynthesis, is the cleanest, most abundant, and cheapest biomass resource on the planet [13]. Although there have been many reports on using cellulose as the carbon source in the synthesis of low toxicity CDs, cellulose has the shortcomings of low yield, high residue rate, and low quantum yield [14]. Debora Rosa et al. prepared CDs with bleached eucalyptus pulp as the carbon source, and the product had a quantum yield of only 3.2% [15]. According to the study of Wang Congyue et al., the quantum yield of CDs prepared with microcrystalline cellulose (MCC) as the carbon source and acidic ionic liquid as the catalyst was only 4.7% [16]. The introduction of surface passivation agents or heteroatoms improved the quantum yield and other fluorescence properties of CDs [17,18]. Xie Yadian et al. employed highland barley as the carbon source and ethylenediamine as the nitrogen source in the synthesis of N-CDs, and the resulting product achieved a high quantum yield of 14.4% and selective detection of Hg2+ [19]. In the study of Shen Peilian, the N-CDs made from cellulose powder and urea attained a quantum yield of 21.7% [20]. The introduction of N atoms into CDs can adjust the surface groups and electronic properties of CDs, thus improving their luminescence performance. Polyethylenimine (PEI) is a water-soluble polymer abundant in nitrogen elements, which provides more surface modification sites for CDs [11]. There is still a lack of research on the applications of CDs prepared using MCC as the carbon source in Fe3+ detection and temperature sensing.
In the present study, N-CDs were prepared via a one-step hydrothermal method using MCC as the carbon source and PEI as the nitrogen source. It was found that the prepared N-CDs 2 in which the ratio of MCC to PEI was 1:1 were an efficient fluorescent “turn-off” probe that could highly selectively detect Fe3+ with a low limit of detection (LOD) and a wide linear detection range. In addition, N-CDs 2 were also successfully applied to the detection of Fe3+ ions in real water samples, showing a high recovery rate and low relative standard deviations.

2. Experimental Section

2.1. Chemicals

Microcrystalline cellulose (MCC) powder (CP, China) was supplied by Chengdu Kelong Chemical Reagent Co., Ltd. (Chengdu, China). Polyethylenimine (PEI) (Mw = 600, 99%, China) was bought from Energy Chemical (Shanghai, China). Acetone, methanol, ethanol, N, N-dimethylformamide (DMF), carbon tetrachloride (CCl4), dimethyl sulfoxide (DMSO), Ca(NO3)2·4H2O, Co(NO3)2·6H2O, Cu(NO3)2·3H2O, Fe(NO3)3·9H2O, Mg(NO3)2·6H2O, Pb(NO3)2, Cd(NO3)3·4H2O, Cr(NO3)3·9H2O, Ni(NO3)3·6H2O, Hg(NO3)2·H2O, Al(NO3)3·9H2O and Fe(NO3)2·6H2O were purchased from Tianjin Damao Chemical Reagent Factory (Tianjin, China) and these chemical reagents were analytical reagents (ARs). All the chemical reagents were used without further purification.

2.2. Characterization

The absolute quantum yields of N-CDs 1, N-CDs 2 and N-CDs 3 were measured with an FS5 spectrofluorometer (Edinburgh, UK). Fourier transform-infrared (FTIR) spectra of MCC and N-CDs 2 were recorded with a Bruker Tensor 27 spectrometer (Brooke Group Co., Ltd., Karlsruhe, Germany) using powder-pressed KBr pellets in a range of 500~4000 cm−1. X-ray diffraction (XRD) spectra of MCC and N-CDs 2 were tested using a Bruker D8 Advance spectrometer (Brooke Group Co., Ltd., Karlsruhe, Germany). The TEM morphology of N-CDs 2 was characterized using a transmission electron microscope (FEI Tecnai G2 F20 S-TWIN, Thermo Fisher Scientific Co., Ltd., Hillsboro, OR, USA) at 200 kV. The X-ray photoelectron spectroscopy (XPS) spectra of N-CDs 2 were studied by an X-ray photoelectron spectroscope (AXIS SUPRA, Shimadzu Company, Kyoto, Japan). The content of C, N, and O elements on the surface of N-CDs 2 was analyzed using an energy dispersive spectrometer (EDS, JEOL 7600 F, JEOL Co., Ltd., Tokyo, Japan). The UV-vis spectrum of N-CDs 2 was obtained using a Cary 5000 Agilent (Agilent Technology (China) Co., Ltd., Beijing, China) in a range of 250~700 nm. The fluorescence spectra and fluorescence lifetime of N-CDs 2 after the addition of different metal ions were examined using an FS5 spectrofluorometer (Edinburgh Instrument Co., Ltd., Edinburgh, UK).

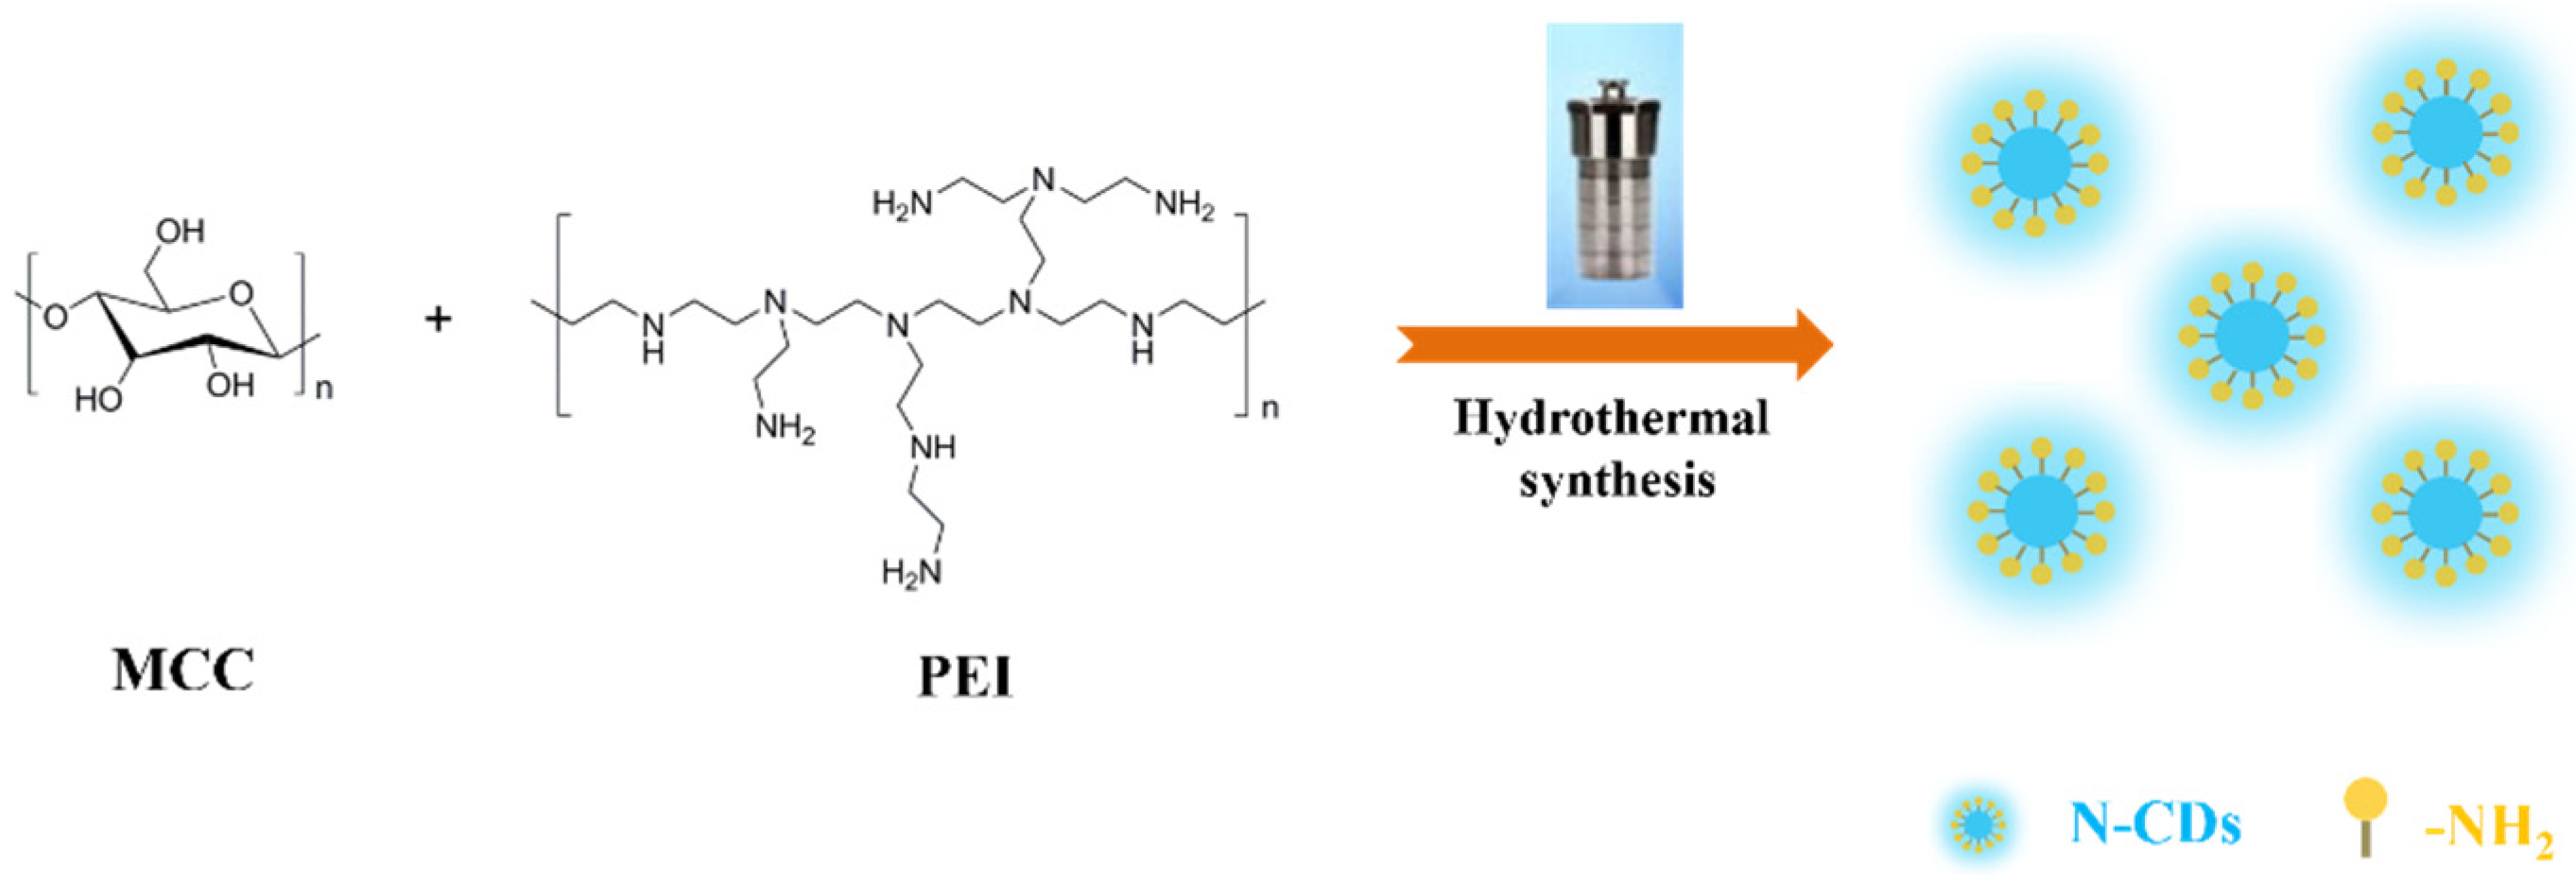
2.3. Preparation Methods

N-CDs 1, N-CDs 2, and N-CDs 3 were prepared using a green, one-step hydrothermal method (Figure 1). Briefly, different proportions (2:1, 1:1, and 1:2) of MCC and PEI were added separately in 50 mL of deionized water, and then mechanically stirred for 30 min with an ultrasonic device. Subsequently, the mixed solution was transferred into a 100 mL Teflon-lined stainless steel autoclave and kept at 200 °C for 6 h. The solution was subjected to centrifugation at 5000 rpm for 10 min, and dialyzed against deionized water for 48 h (MWCO 1000 Da). After freeze-drying, the powder products (N-CDs 1, N-CDs 2, and N-CDs 3) were obtained.

3. Results and Discussion

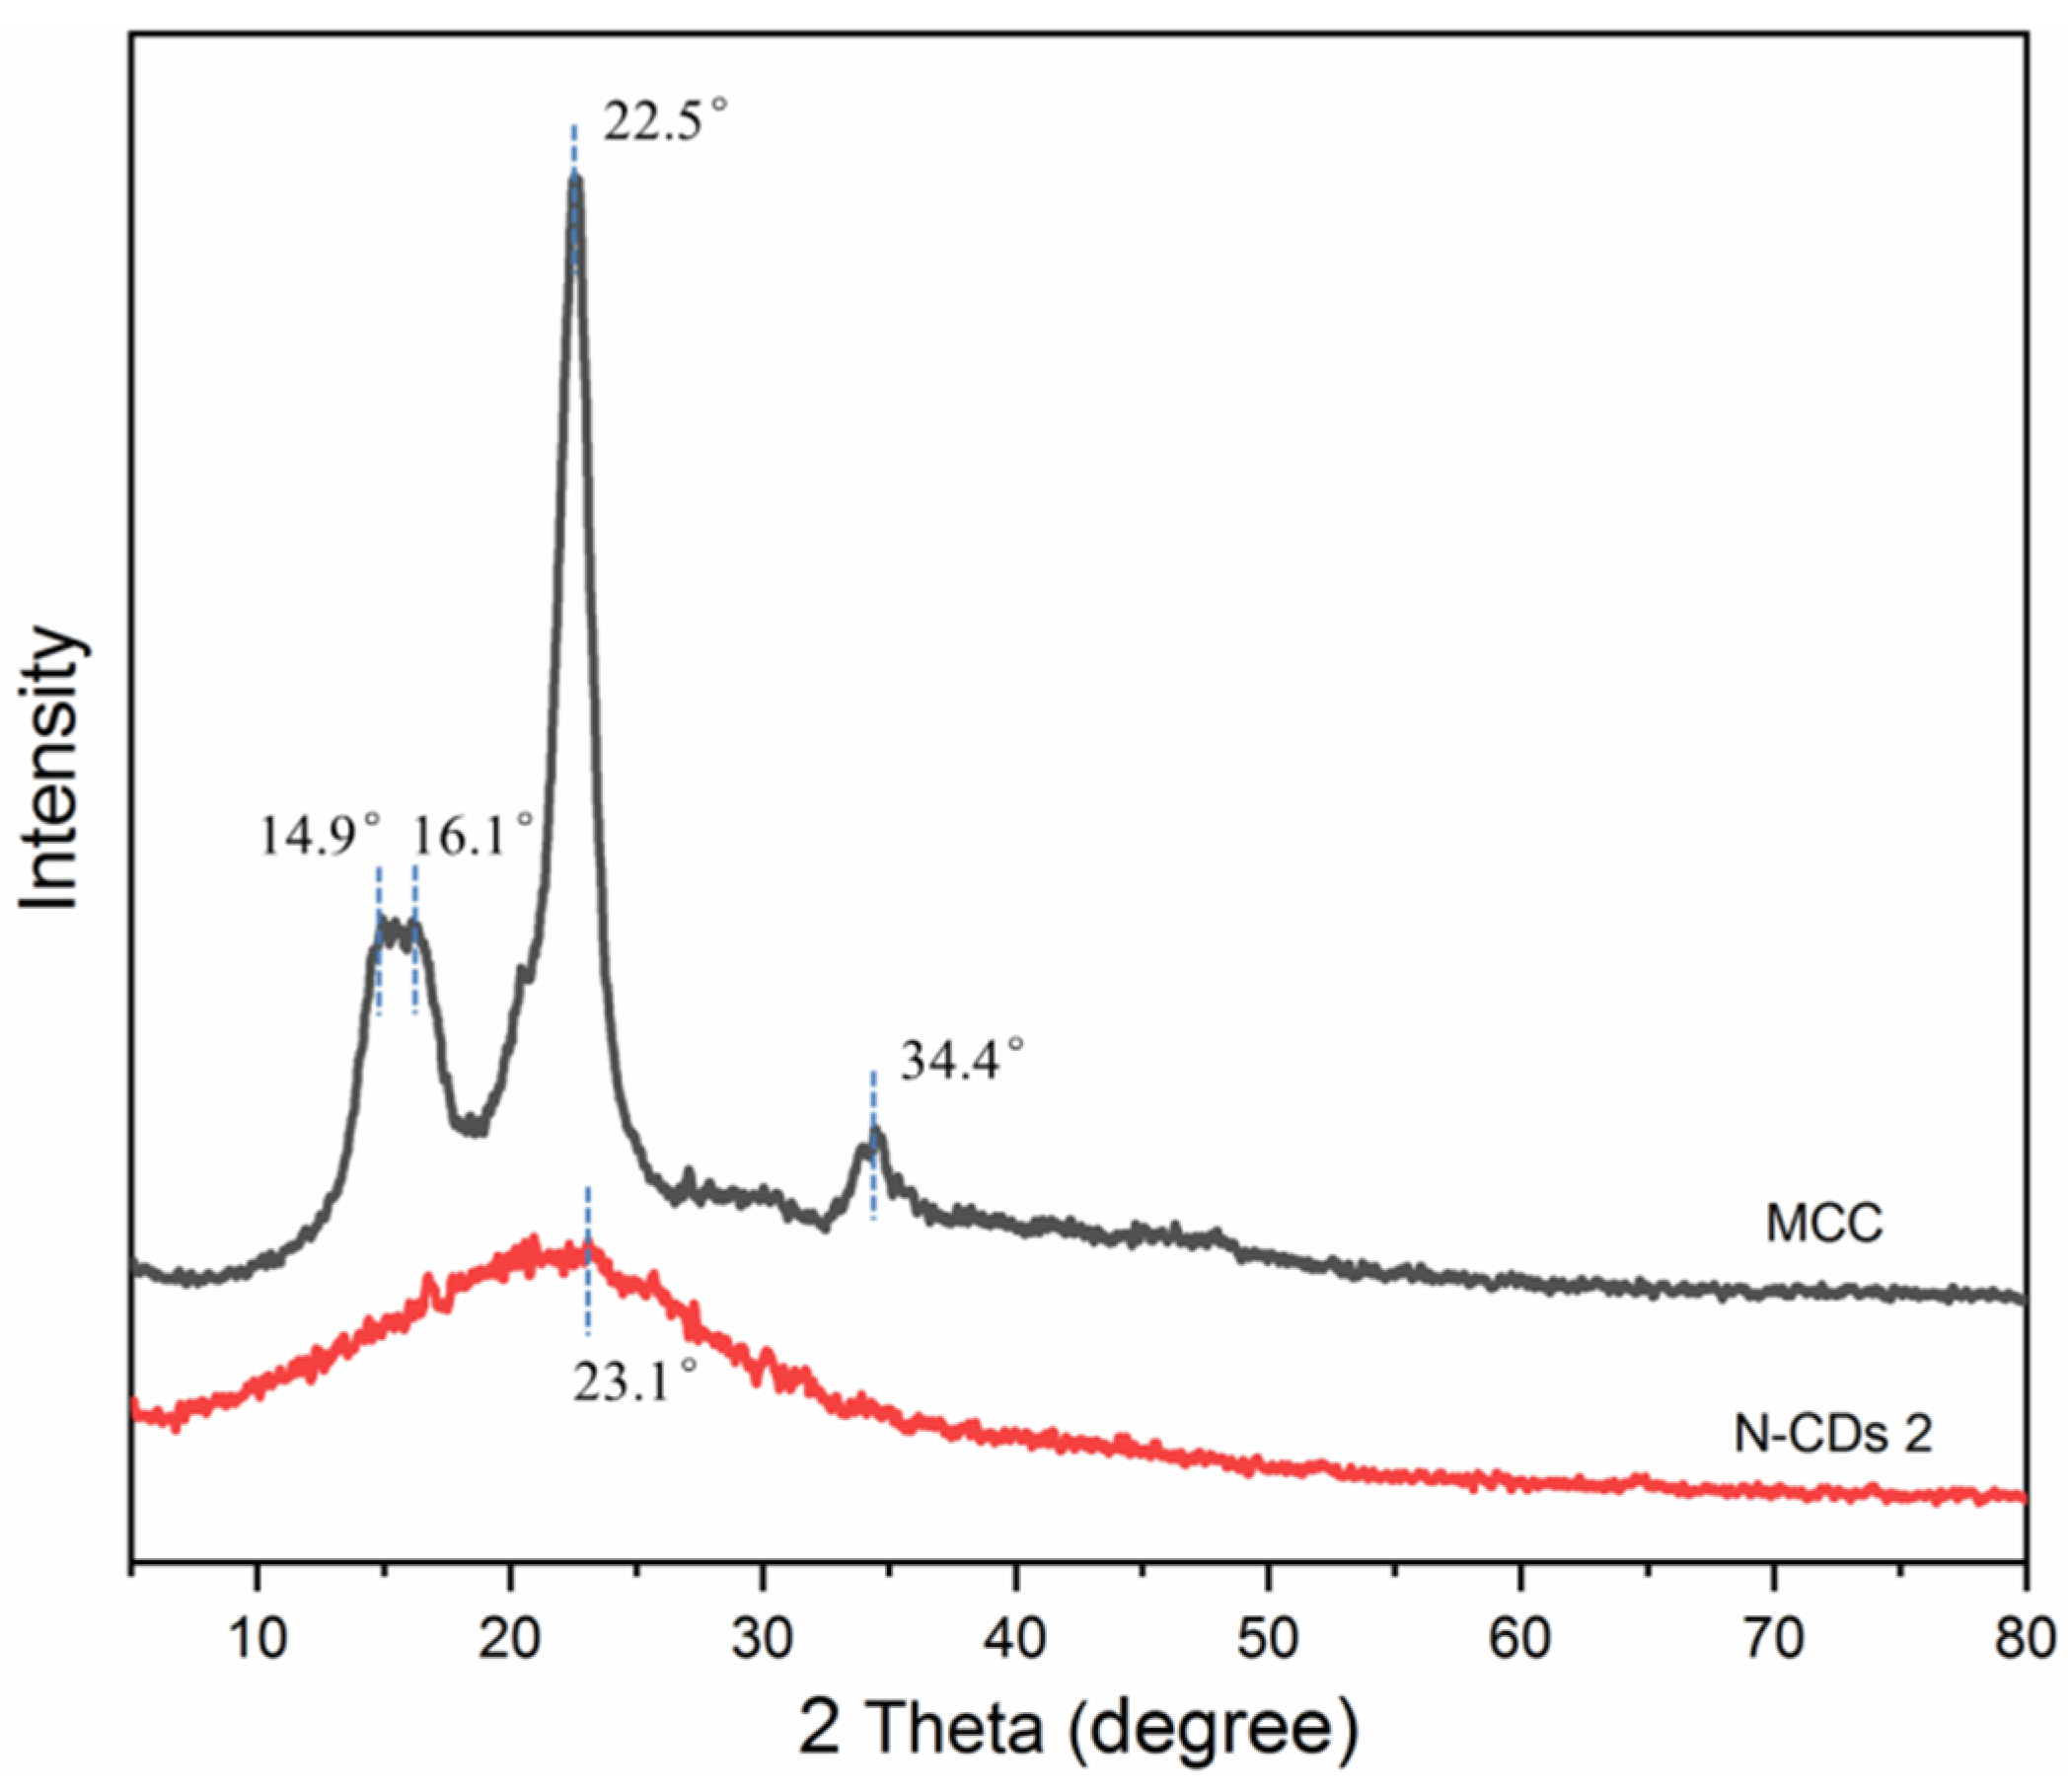
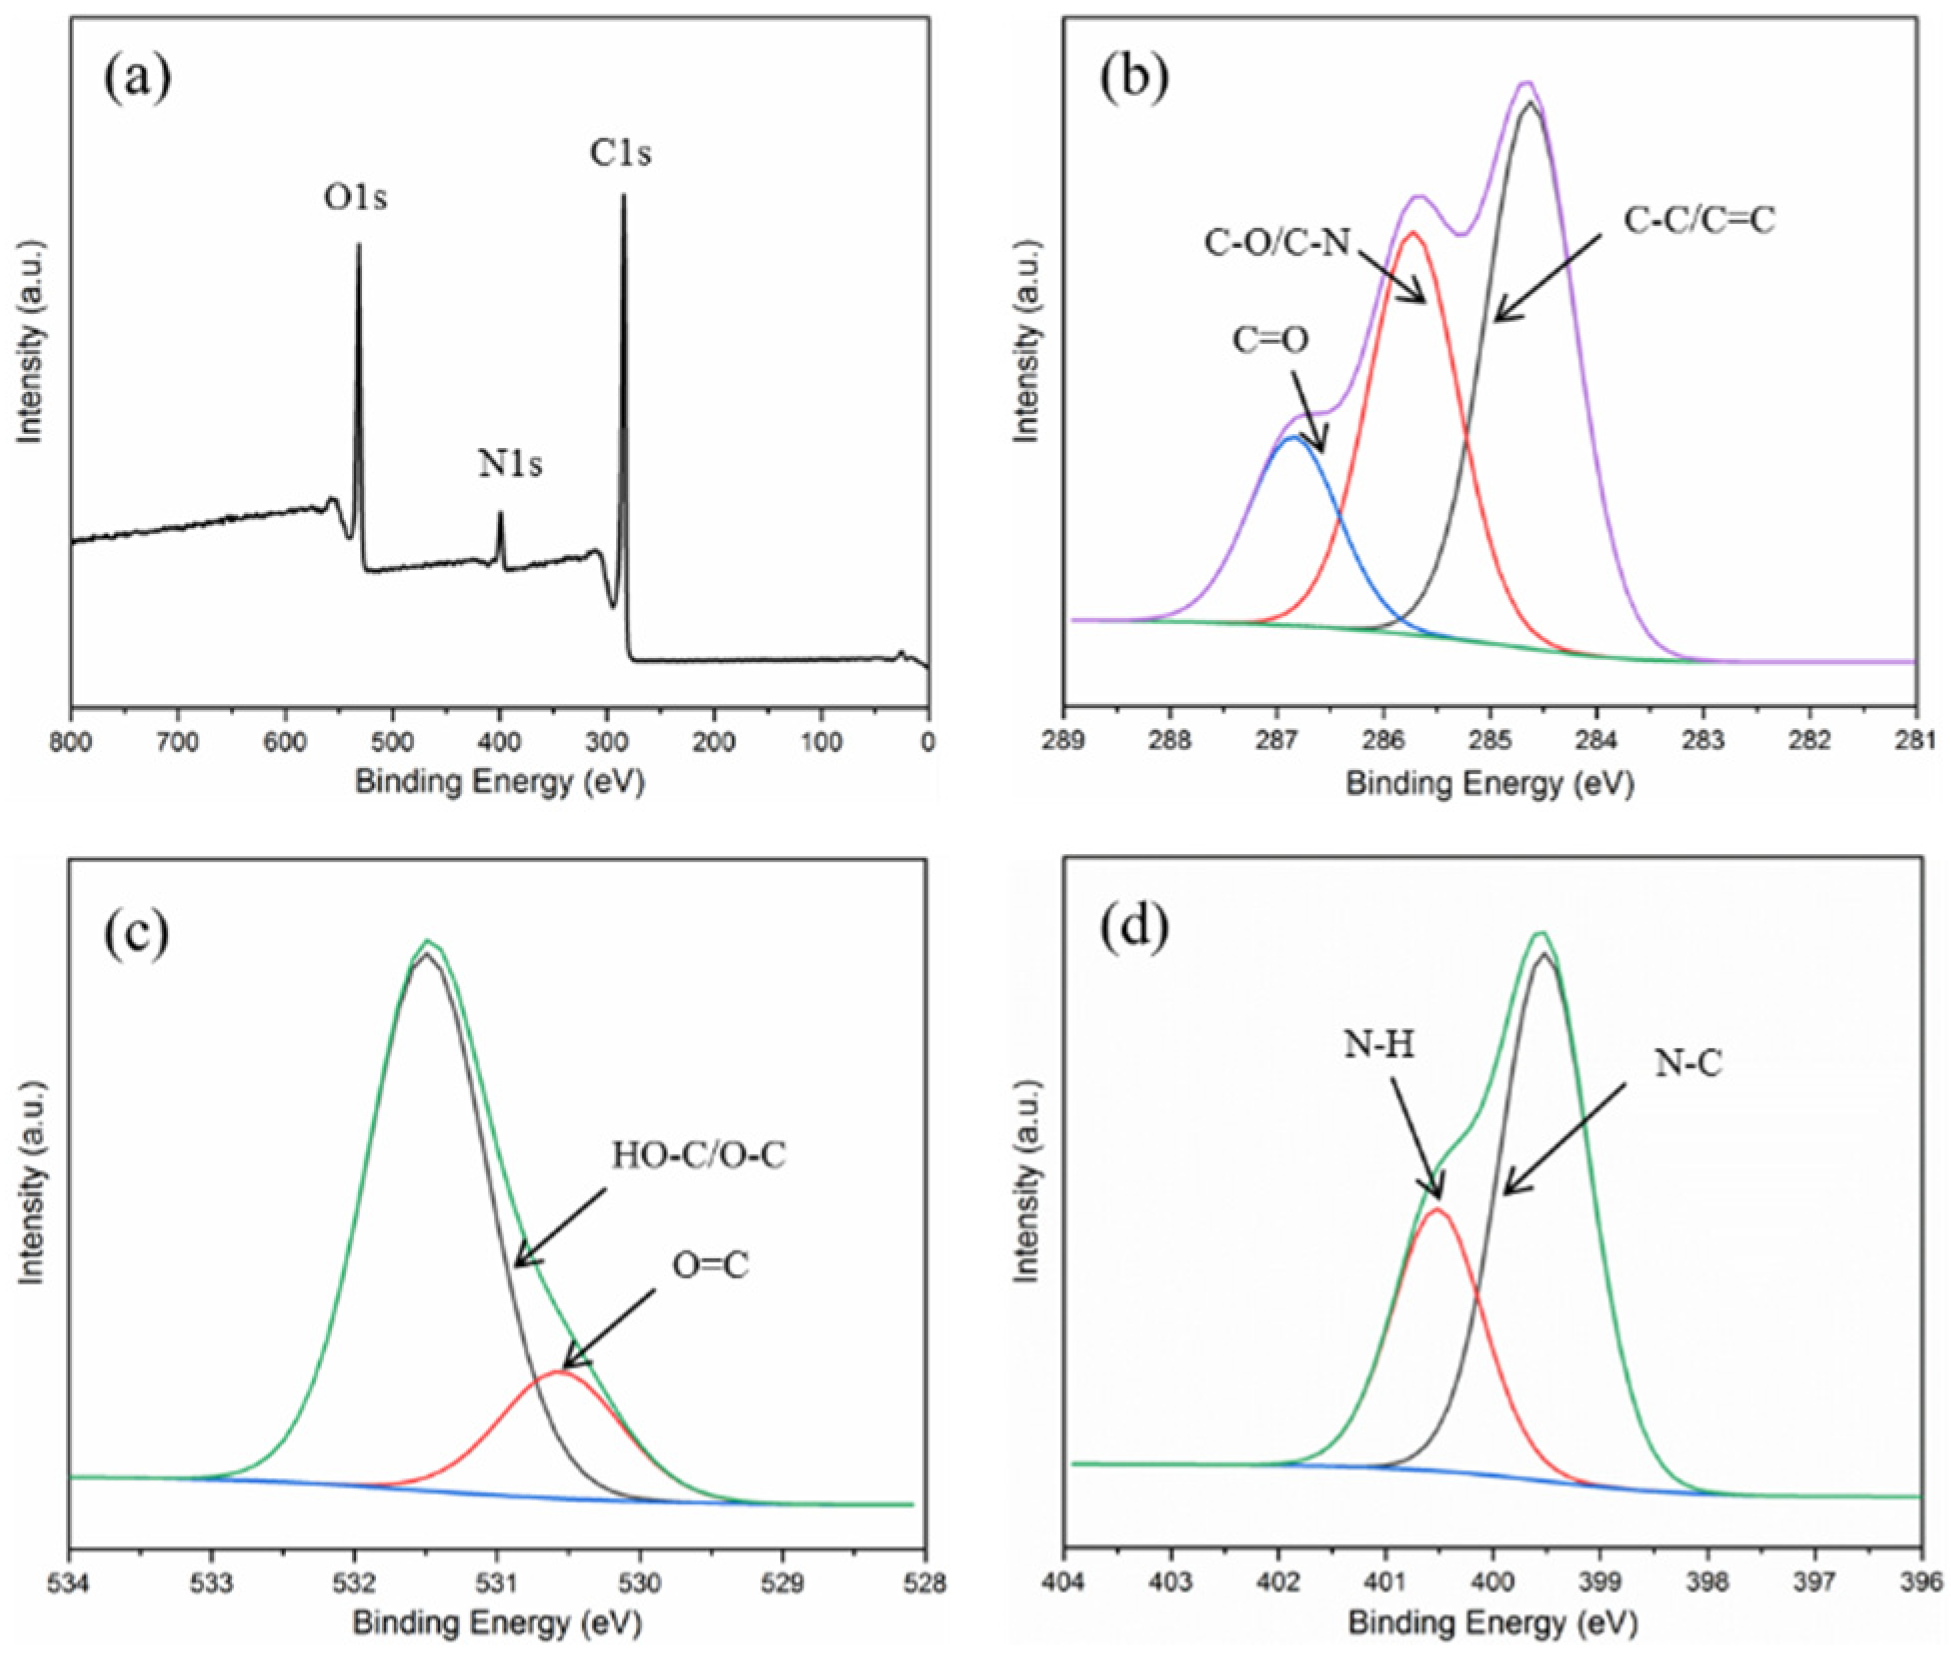
3.1. Characterization of N-CDs

In Figure S1, the fluorescence quantum yields of N-CDs 1, N-CDs 2, and N-CDs 3 prepared with an MCC/PEI ratio of 2:1, 1:1, and 1:2 were 8.86%, 13.52%, and 5.13%, respectively. The results showed that the fluorescence quantum yield of N-CDs 1, N-CDs 2, and N-CDs 3 increased first and then decreased with increasing PEI content. The quantum yield of N-CDs 2 with an MCC/PEI ratio of 1:1 was the highest. The reason might be that excess N atoms easily wrapped N-CDs, reducing defects on the N-CD surface and thus the quantum yield of N-CDs [21]. Therefore, N-CDs 2 were further analyzed.
In the FT-IR spectrum of N-CDs 2 (Figure S2), a characteristic band appeared around 3401 cm−1, which was not observed in the FT-IR spectrum of MCC [4]. This band most likely corresponded to the stretching vibration of O–H/N–H on the surface of N-CDs 2 [4,22]. The absorption bands around 2921 cm−1 and 2879 cm−1 could be attributed to the tensile vibrations of C–H [23]. The absorption peak observed at 1635 cm−1 indicated the presence of the stretching vibration of C=O and the bending vibration of N–H [22]. The peak at 1434 cm−1 was attributed to the C–N stretching vibration [22]. There was a large quantity of hydrophilic functional groups, such as –NH2 and –OH, on the surface of N-CDs 2, greatly improving the water solubility of N-CDs 2. Four diffraction peaks were observed at 14.9°, 16.1°, 22.5,° and 34.4°, which could be assigned to the (1–10), (110), (200) and (004) crystal planes of the MCC structure, respectively (Figure 2) [24,25]. In the spectrum, there was also a wide characteristic peak at 23.1°, which represented the graphite-plane structure. Moreover, the degree of graphitization of N-CDs 2 was relatively low, and they were mainly composed of polycyclic aromatic carbon sheets with an amorphous structure [26,27].
The surface elemental composition of N-CDs 2 is shown in Figure 3. Three different characteristic peaks were observed in the XPS spectra at 284.5, 399.4, and 531.5 eV, corresponding to C1s, N1s, and O1s, respectively (Figure 3a). The content of C, N, and O elements was 76.89%, 5.35%, and 17.76%, respectively. In the XPS spectrum of C1s (Figure 3b), three characteristic peaks occurred at 286.8, 285.7, and 284.6 eV, corresponding to the bonding structure of C=O, C–O/C–N, and C–C/C=C, respectively [28,29]. In the XPS spectrum of O1s (Figure 3c), the two major component bands at 531.4 and 530.5 eV were parallel to the bonding structure of HO–C/O–C and O=C, respectively. There were two evident peaks in the XPS spectrum of N1s at 400.5 and 399.5 eV, which belonged to the N–H and N–C groups, respectively (Figure 3d) [30]. The EDS spectrum of N-CDs 2 was provided in Figure S3. The content of C, O, and N on the surface of N-CDs 2 was 77%, 20%, and 3%, respectively. The XPS and EDS results suggested there was a substantial number of functional groups, such as –C=O, –NH2, and –OH, on the surface of N-CDs 2. The average diameter and surface morphology of N-CDs 2 were examined using TEM technology (Figure S4). The microstructure of N-CDs 2 was spherical-shaped without obvious agglomeration (Figure S4a). The particle size of N-CDs 2 ranged from 1 nm to 9 nm, averaging 4.7 nm, so N-CDs 2 had excellent photophysical and chemical properties. This finding was consistent with previous reports [27].

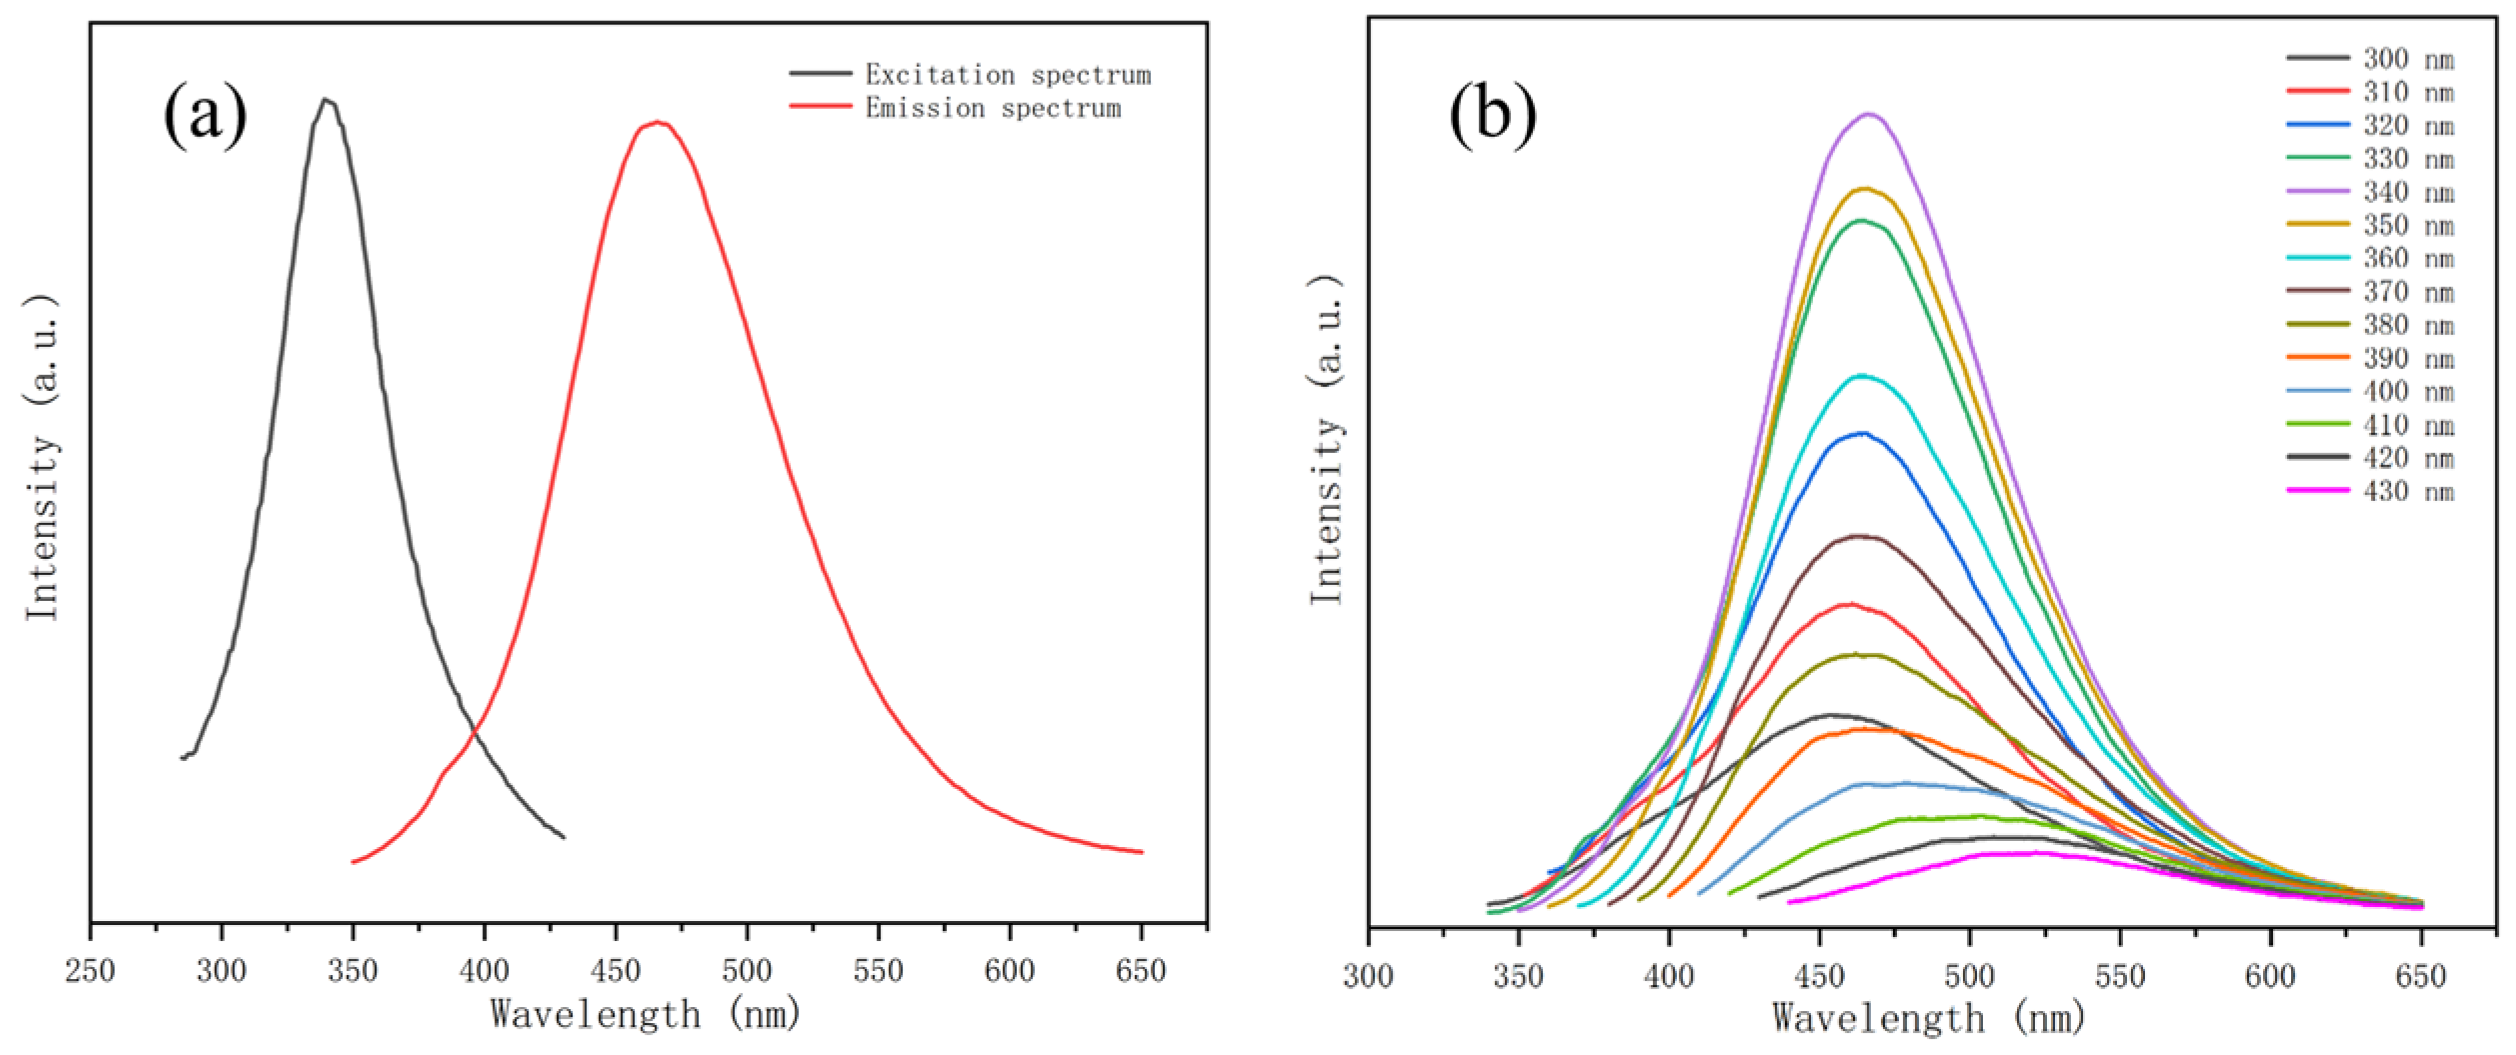
3.2. Optical Properties of N-CDs 2

The UV-vis absorption spectrum of N-CDs 2 aqueous solutions is depicted in Figure S5. There was a weak peak at 293 nm and a strong peak at 328 nm. The peak at 293 nm was the absorption peak of the benzene ring carbon nucleus, which might be attributed to the π–π* electron transition of sp2 hybridization [31]. The peak at 328 nm was ascribed to the n–π* transition of the –NH2 groups on the surface of N-CDs 2 [32,33].
Fluorescence excitation and emission spectra of N-CDs 2 aqueous solutions are shown in Figure 4a. The optimal excitation peak of N-CDs 2 aqueous solutions occurred at 340 nm. At the optimal excitation wavelength, N-CDs 2 exhibited strong fluorescence emission at 466 nm. Figure 4b provides the fluorescence spectra of N-CDs 2 at different excitation wavelengths (300~430 nm). In the excitation wavelength range of 300~340 nm, the fluorescence intensity of N-CDs 2 was enhanced, and the emission peak remained unchanged. The emission intensity of N-CDs 2 decreased as the excitation wavelength increased from 350 to 400 nm, and the emission peak did not change significantly. As the excitation wavelength increased from 410 nm to 420 nm and to 430 nm, the photoluminescence intensity of N-CDs 2 diminished and the emission peak shifted from 466 nm to 522 nm. The results indicated that the fluorescence intensity and emission peak of N-CDs 2 were affected by the excitation wavelength (300~430 nm). N-CDs 2 exhibited multiple emission centers. As the excitation wavelength was increased from 300 to 430 nm, an obvious redshift of the emission wavelength was observed, which confirmed that N-CDs 2 underwent a large Stokes shift. This shift was attributed to different particle sizes, the size distribution, and inhomogeneous chemical states on the surface [34,35,36].
The effects of the solvent type, temperature, UV irradiation, and pH value on the fluorescence properties of N-CDs 2 were investigated. The fluorescence spectra and photoluminescence intensity of N-CDs 2 in different solvents are plotted in Figure S6. The concentration of N-CDs 2 in all the studied solvents was 0.1 mg/mL. In water, the fluorescence intensity of N-CDs 2 was the highest. The fluorescence intensity of N-CDs 2 in ethanol was basically the same as that of N-CDs 2 in methanol. The fluorescence intensity of N-CDs 2 in acetone, DMF, and DMSO was significantly lower than that of N-CDs 2 in water. However, the fluorescence of N-CDs 2 in CCl4 was greatly quenched. The results indicated that the solvent type had a great impact on the fluorescence intensity of N-CDs 2, and the fluorescence intensity of N-CDs 2 in polar solvents was remarkably higher than that of N-CDs 2 in non-polar solvents [37]. When the temperature ranged from 40 to 90 °C, the fluorescence intensity of N-CDs 2 was 93.82%~62.82% of that at 30 °C (Figure 5a). Moreover, the fluorescence intensity of N-CDs 2 showed a good linear relationship (R2 = 0.997) with the temperature in the range of 30 to 70 °C (Figure 5b). The linear equation was fitted as y = −986x + 166,045. The LOD was calculated as 1.58 °C by LOD = 3δ/s, where δ was the standard deviation of blank samples and s was the slope of the linear relationship. Since the temperatures (30~70 °C) at which the linearity holds are higher than the physiological temperature of the human body, N-CDs 2 have broad application prospects in the field of human body temperature sensing [38]. The photostability of N-CDs 2 under continuous UV exposure (1~7 h) was measured (Figure S7). The fluorescence intensity of N-CDs 2 decreased to 99.47% of the original value after being irradiated with the UV lamp for 1 h. After 7 h, the fluorescence intensity of N-CDs 2 decreased to 92.17% of the original value and the attenuation extent did not exceed 10%. The reason for the fluorescence stability of N-CDs 2 aqueous solutions might be that the electrostatic repulsion between charged nanoparticles prevented fluorescence quenching caused by aggregation of N-CDs 2 [39]. The results indicated that N-CDs 2 had excellent photobleaching resistance and UV resistance, and are thus suitable for fluorescence sensing and metal ion detection. The highest fluorescence intensity of N-CDs 2 aqueous solutions was observed at the pH value of 7 (Figure S8). There was no evident fluorescence quenching of N-CDs 2 aqueous solutions in the pH range of 2~12, and the maximum attenuation amplitude was less than 20%. However, large amounts of H+ (pH 1) or OH (pH 13) inhibited the electronic transition in the luminescent center of N-CDs 2, resulting in marked fluorescence quenching [40]. The results showed that N-CDs 2 had strong fluorescence stability and excellent optical performance, and they provided a platform for detecting metal ions.

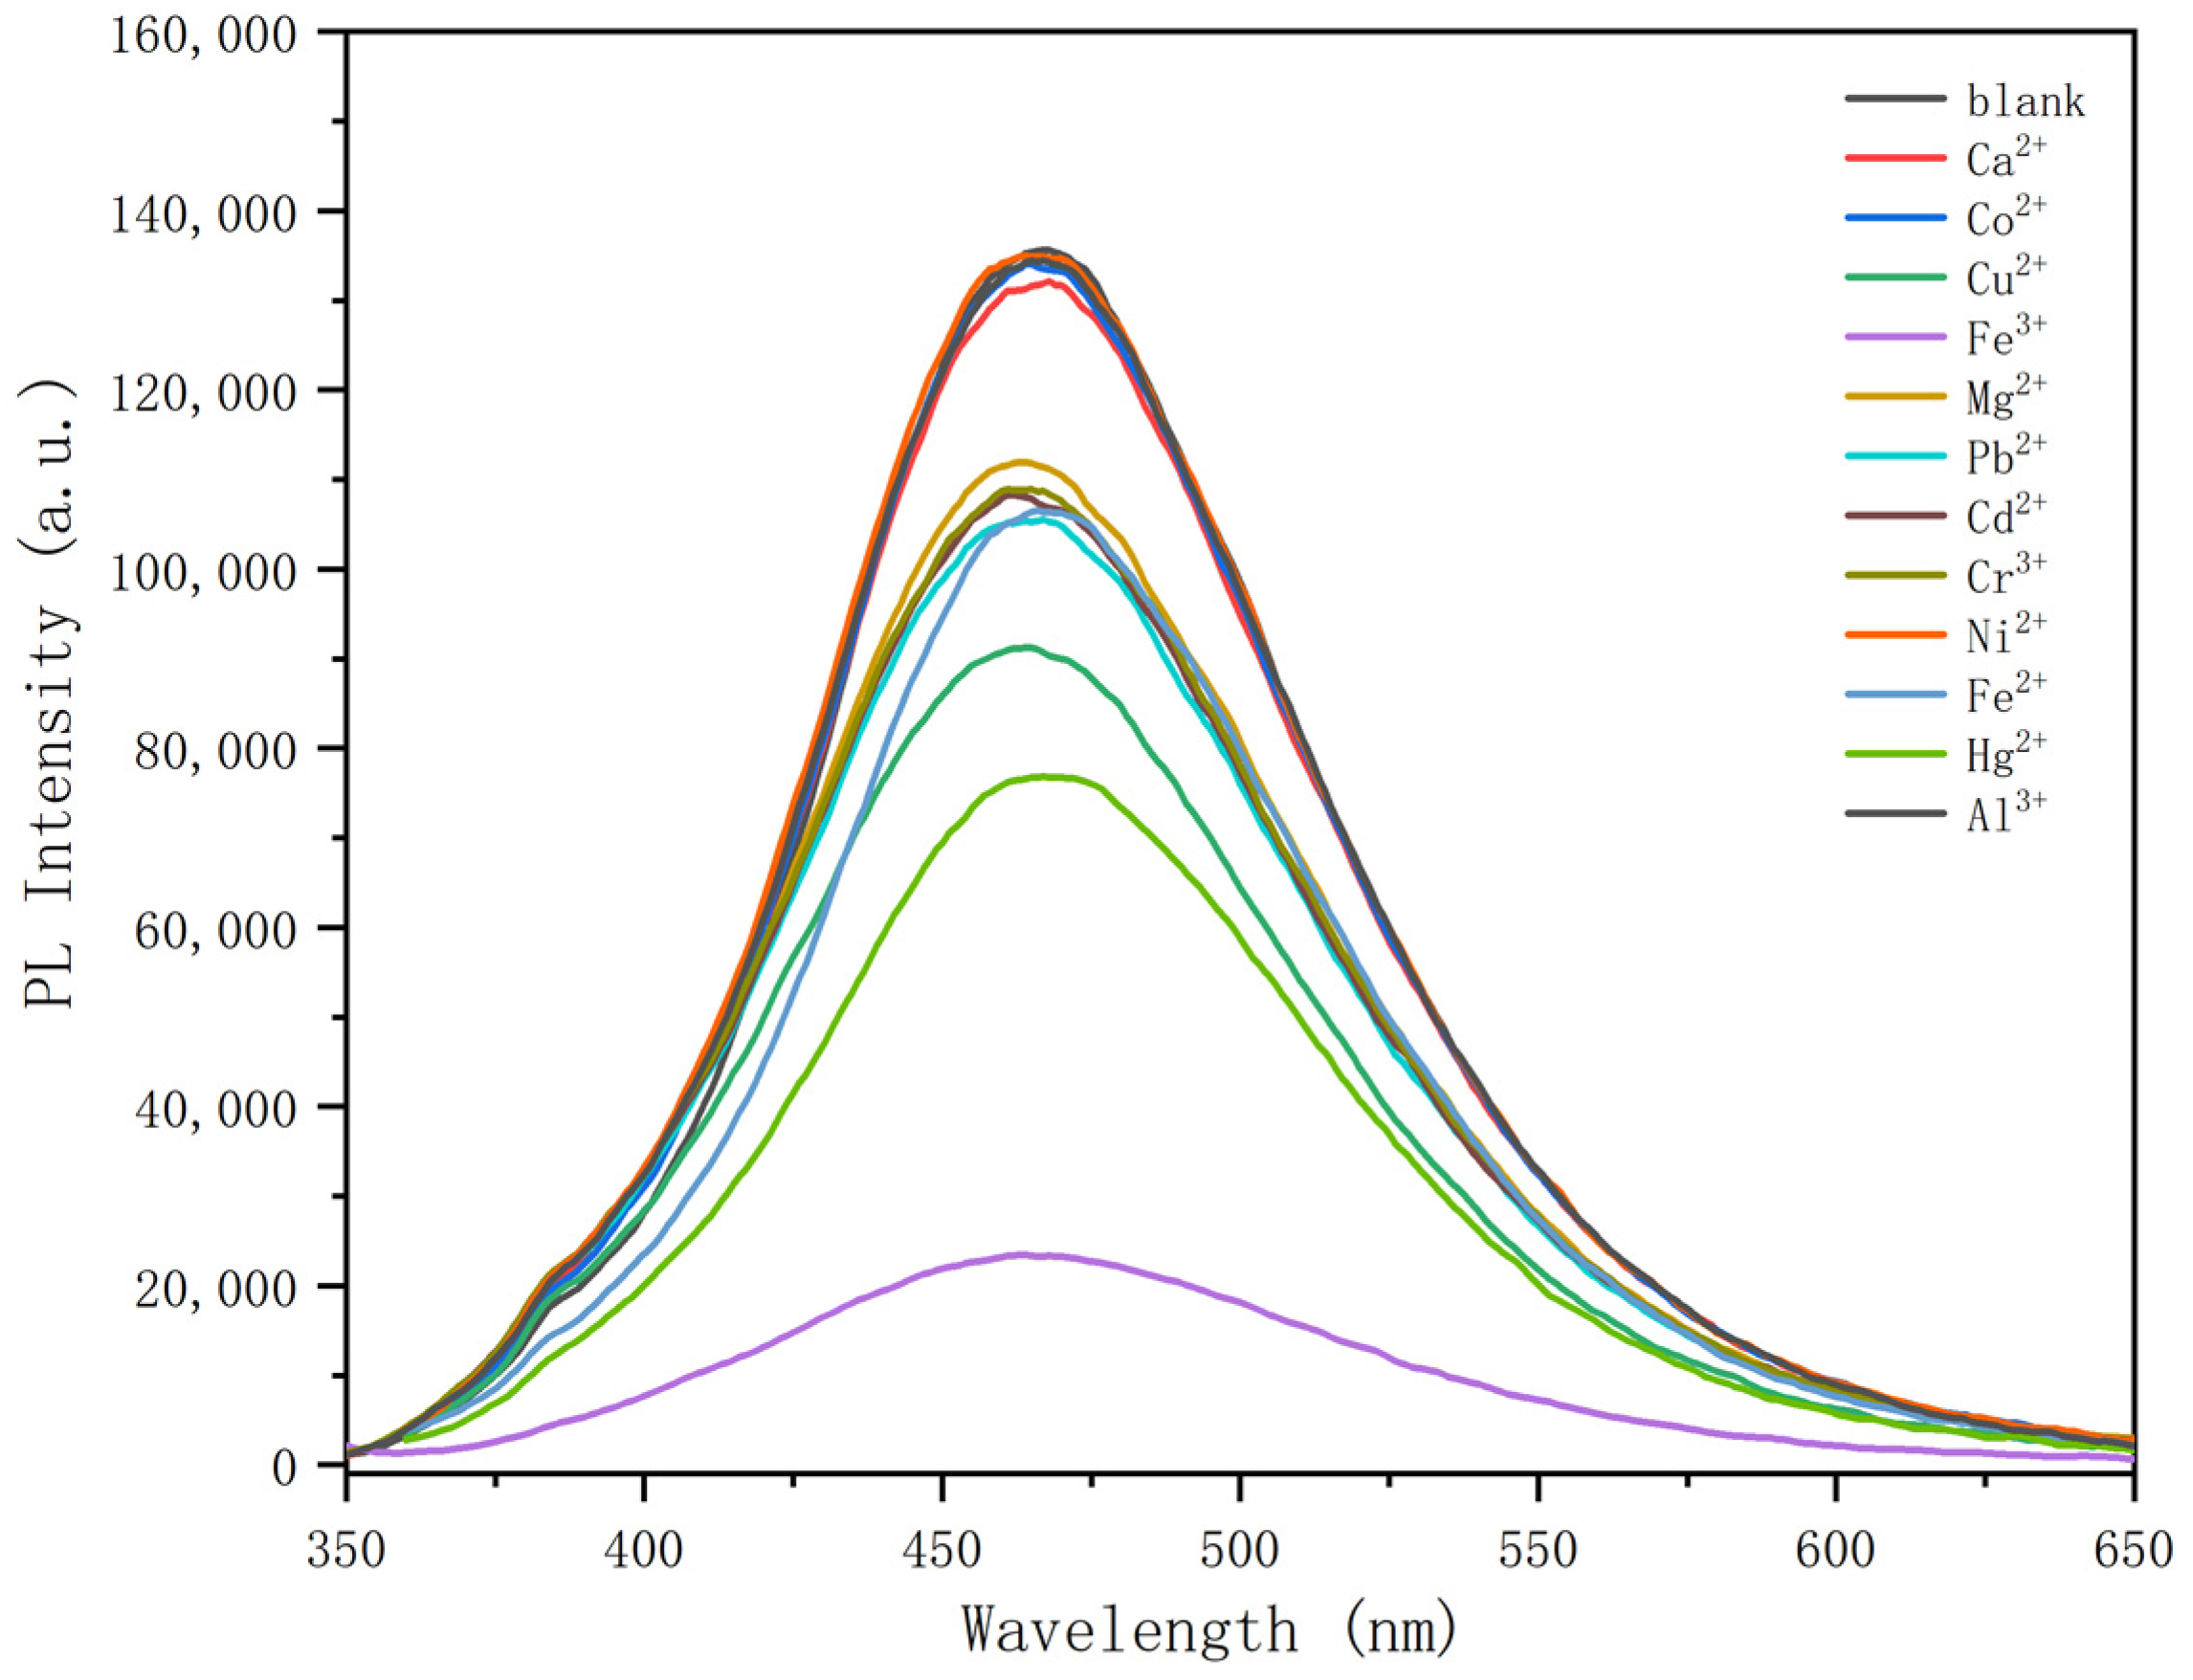
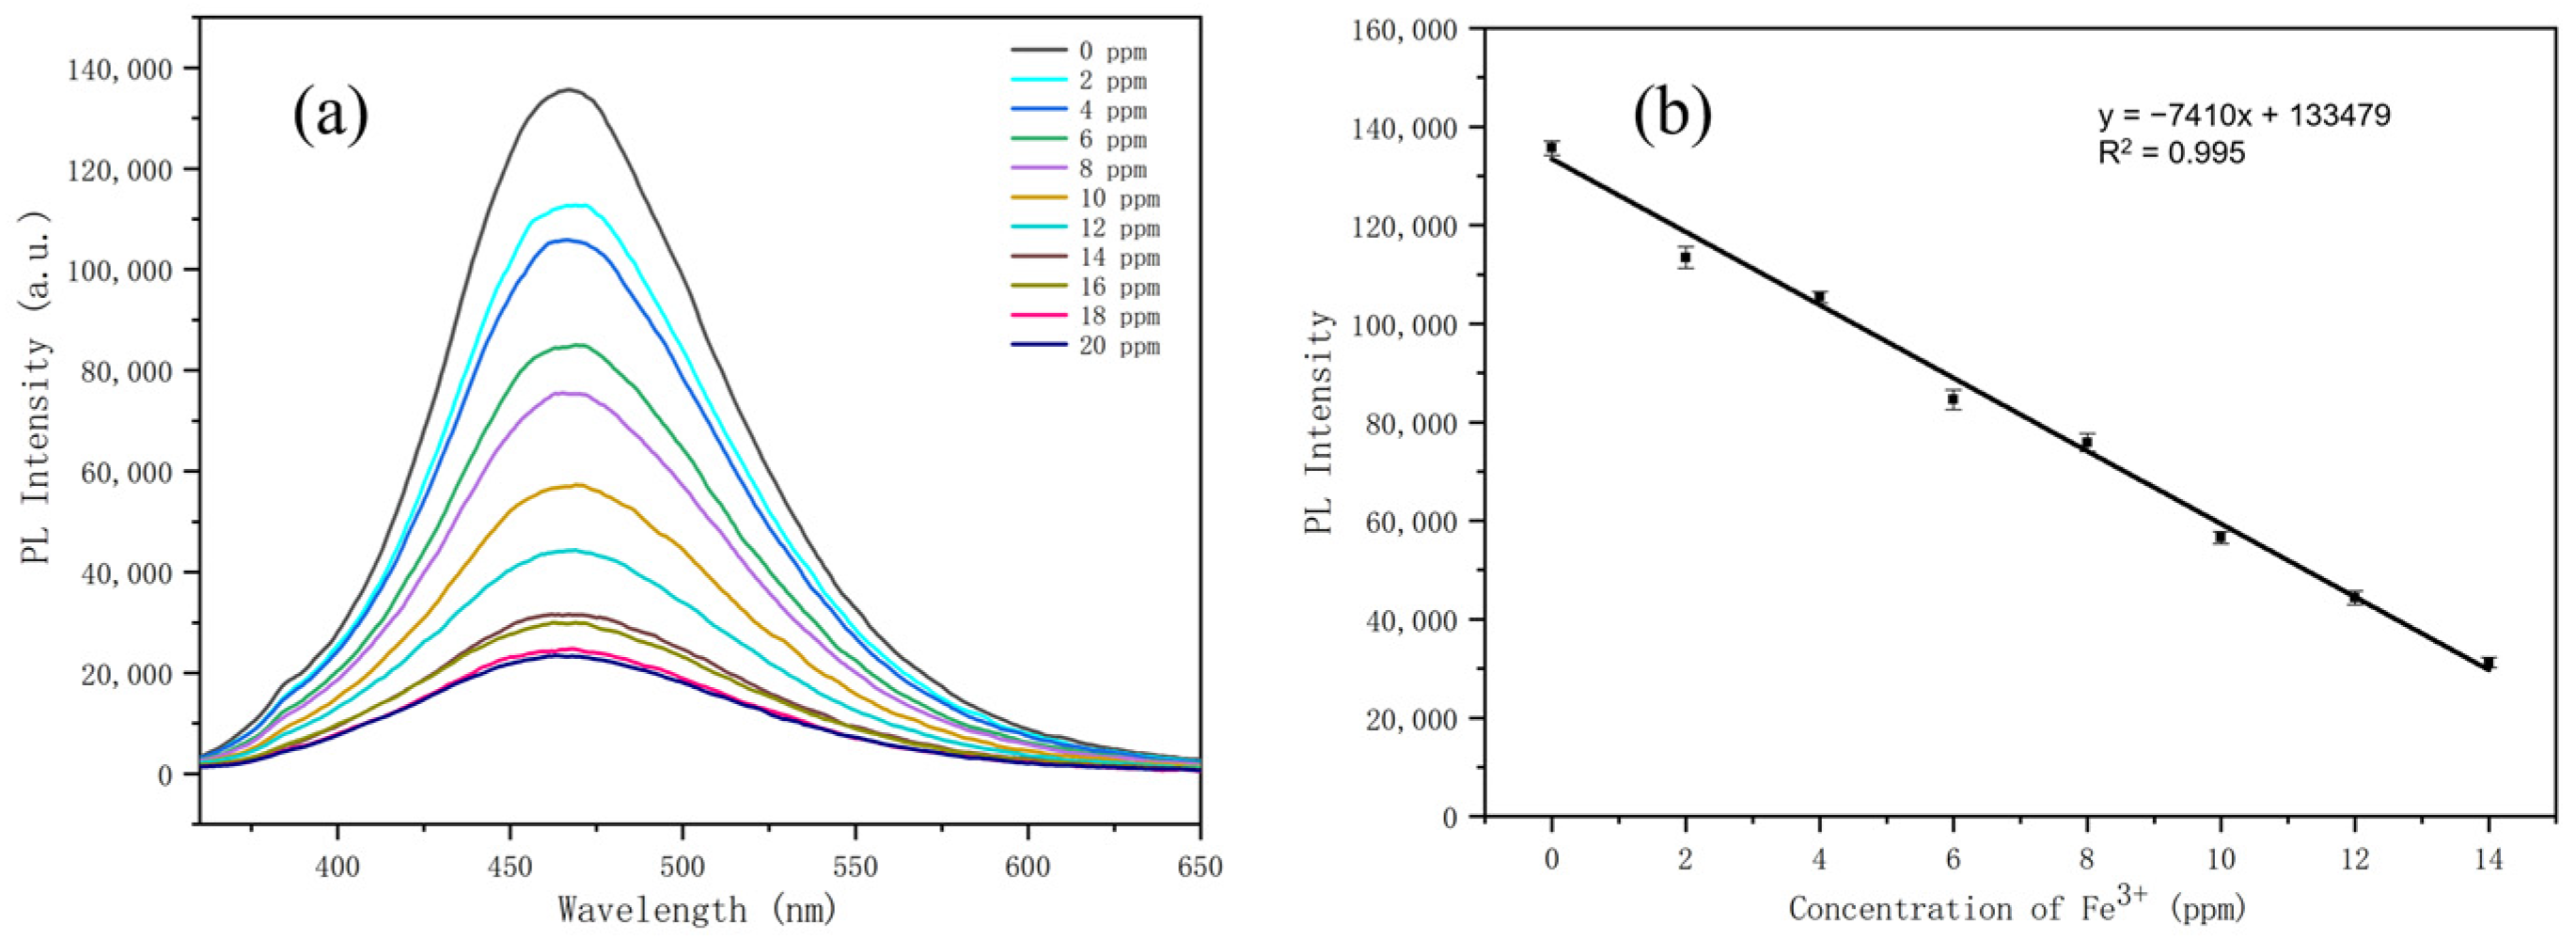
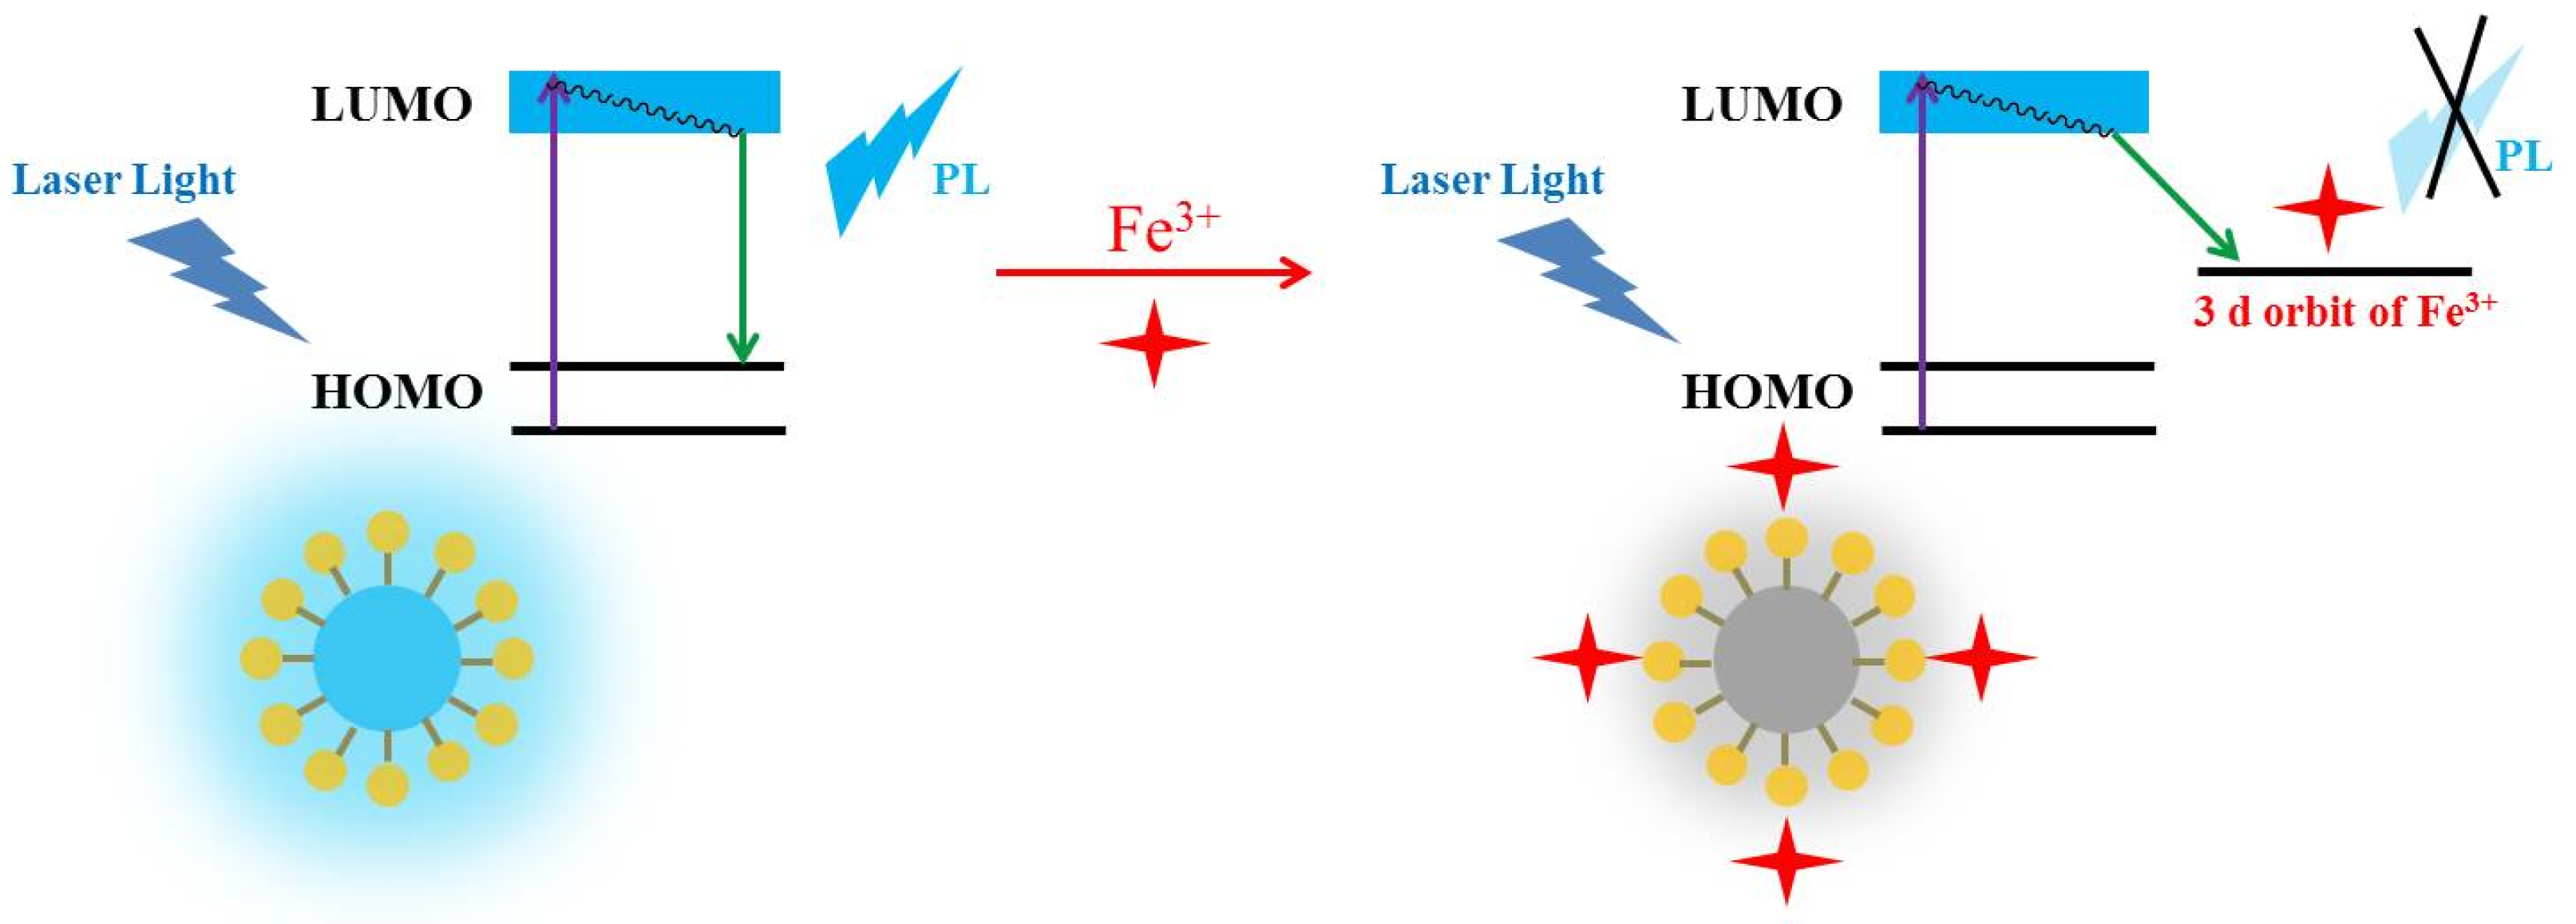
3.3. Detection Properties of N-CDs 2

Figure 6 illustrates the fluorescence spectra of N-CDs 2 aqueous solutions added with different metal ions (20 ppm), such as Ca2+, Co2+, Cu2+, Fe3+, Mg2+, Pb2+, Cd2+, Cr3+, Ni2+, Fe2+, Hg2+, and Al3+ ions. When Ca2+, Co2+, Ni2+, Al3+, Mg2+, Pb2+, Cd2+, Cr3+, or Fe2+ ions were added, the fluorescence of N-CDs 2 aqueous solutions was slightly quenched. With the addition of Cu2+ and Hg2+ ions, the fluorescence intensity of N-CDs 2 decreased to 66.47% and 56.55%, respectively. However, after Fe3+ ions were added, the fluorescence intensity of N-CDs 2 decreased to 17.16%, demonstrating that Fe3+ ions had the greatest influence on the fluorescence quenching of N-CDs 2 aqueous solutions. The results of comparative experiments between N-CDs 2 aqueous solutions added with Fe3+ ions and other metal ions are summarized in Figure S9. After Fe3+ solutions (20 ppm) were added to the mixed systems of N-CDs 2 and other metal ions, the fluorescence intensity of the mixed systems decreased significantly. The results indicated that Fe3+ could highly selectively quench the fluorescence of N-CDs 2 and resist the interference by other metal ions such as Ca2+, Co2+, and Cu2+.
The fluorescence spectra of N-CDs 2 aqueous solutions containing different concentrations of Fe3+ (0–20 ppm) are shown in Figure 7a. When the Fe3+ concentration ranged from 0 to 14 ppm, the fluorescence quenching rate of N-CDs 2 was relatively high. However, the fluorescence quenching rate of N-CDs 2 declined drastically as the Fe3+ concentrations increased from 14 to 20 ppm. In the range of 0~14 ppm, a linear relationship was achieved between the fluorescence intensity at 466 nm of N-CDs 2 and the Fe3+ concentration, with a correlation coefficient of R2 = 0.995 (Figure 7b). The linear equation was fitted as y = −7410x + 133479. The LOD was calculated as 0.21 ppm by LOD = 3δ/s, where δ was the standard deviation of blank samples and s was the slope of the linear relationship. Since the LOD of the nanoprobe of N-CDs 2 was below the World Health Organization’s limit for Fe3+ content in drinking water (0.28 ppm), N-CDs 2 are a promising candidate for Fe3+ detection in water samples. Table 1 compares the sensing performance between N-CDs 2 and some previously reported Fe3+ sensors. N-CDs 2 were superior to other CDs for detecting Fe3+ in the detection range and in LOD. With a wide source of raw materials and relatively simple and efficient preparation methods, N-CDs 2 have broad application prospects.
The practical applications of N-CDs 2 to Fe3+ detection in real water samples (e.g., tap water and pool water) were also investigated. Each sample was measured for three replicates. As shown in Table 2, the recoveries of N-CDs 2 from different samples varied between 98.25% and 102.75%, and the relative standard deviation (RSD) was less than 3%. Recoveries represent the ratio of the Found values using this detection method to the Added concentrations of Fe3+ ions in real water samples. The above results proved that N-CDs 2 could be a reliable and simple sensor for monitoring Fe3+ in real water samples.
There were active functional groups on the surface of N-CDs 2, such as hydroxyl and amine units, which could form stable complexes with Fe3+ ions, leading to a highly selective fluorescence quenching of N-CDs 2 as a result of the electron transfer phenomenon [54,55,56,57]. The mechanism by which Fe3+ ions quenched the fluorescence of N-CDs 2 aqueous solutions might be related to the electron transfer in N-CDs 2 (Figure 8) [58]. The electrons in N-CDs 2 would have moved from LUMO orbitals to HOMO orbitals in a radiative electron/hole recombination manner, and released energy by emitting fluorescence. Therefore, N-CDs 2 aqueous solutions exhibited a strong fluorescence intensity. However, due to the chelation interactions between N-CDs 2 and Fe3+, a stable N-CDs 2-Fe3+ system was formed, where electrons moved from LUMO orbitals to the 3D orbital of Fe3+. As a result, the recombination of electrons with holes was non-radiative and no fluorescence was emitted. Therefore, the fluorescence of N-CDs 2 aqueous solutions was quenched by Fe3+. Generally speaking, fluorescence quenching caused by the interactions between fluorophores and quenching agents can be divided into dynamic quenching and static quenching [59]. The lifetime of N-CDs 2 and N-CDs 2-Fe3+ is presented in Figure S10. The average lifetime of N-CDs 2 and N-CDs 2-Fe3+ was 5.04 ns and 4.76 ns, respectively. The results suggested that the fluorescence quenching of the N-CDs 2-Fe3+ system might be a static process, which verified the electron transfer mechanism presented in Figure 7 [60,61,62].

4. Conclusions

Nitrogen-doped CDs were synthesized from MCC and PEI using the facile one-pot hydrothermal carbonization method. The N-CDs 2 prepared with an MCC-to-PEI ratio of 1:1 had the highest quantum yield of 13.52%. The surface of N-CDs 2 was rich in functional groups such as amino and hydroxyl groups, which made N-CDs 2 highly water-soluble. The results of TEM showed that N-CDs 2 had a spherical structure and a wide range of size distribution, from 1 to 9 nm. The fluorescence properties of N-CDs 2 were affected by the excitation wavelength (300~430 nm). When the excitation wavelength was 340 nm, N-CDs 2 exhibited the strongest fluorescence emission, at 466 nm. The fluorescence intensity of N-CDs 2 was linearly (R2 = 0.997) related to the temperature in the range of 30~70 °C. The sensor N-CDs 2 displayed good selectivity and high sensitivity of 0.21 ppm in Fe3+ ion detection. The results of relative standard deviations (less than 3%) and recovery rates (98.25%~102.75%) obtained by tap water and pool water sample experiments demonstrated that the sensor N-CDs 2 could be recycled, reused, and applied to accurate monitoring of Fe3+ in future practical fields.

Supplementary Materials

The following supporting information can be downloaded at: https://www.mdpi.com/article/10.3390/coatings13121979/s1. Figure S1. Quantum yield of nitrogen doped carbon dots (1, N-CDs 1; 2, N-CDs 2; 3, N-CDs 3). Figure S2. FT-IR spectrum of N-CDs 2. Figure S3. EDS spectrum of N-CDs 2. Figure S4. (a) TEM image of N-CDs 2 (b) size distribution histogram of N-CDs 2. Figure S5. UV-vis absorption spectrum of N-CDs 2 aqueous solutions (0.1 mg/mL). Figure S6. (a) Fluorescence spectra of N-CDs 2 at different solvents (0.1 mg/mL) (b) the relationship between fluorescence intensity of N-CDs 2 with different solvents (0.1 mg/mL). Figure S7. (a) Fluorescence spectra of N-CDs 2 aqueous solutions (0.1 mg/mL) under different irradiation time of UV lamp (b) the relationship between fluorescence intensity of N-CDs 2 aqueous solutions (0.1 mg/mL) with different irradiation time of UV lamp. Figure S8. (a) Fluorescence spectra of N-CDs 2 aqueous solutions (0.1 mg/mL) at different pH values (b) the relationship between fluorescence intensity of N-CDs 2 aqueous solutions (0.1 mg/mL) with different pH values. Figure S9. Comparative experiments of N-CDs 2 aqueous solutions (0.1 mg/mL) in the presence of Fe3+ ions with other metal ions (1, N-CDs 2 as blank; 2, Fe3+; 3, Ca2+; 4, Co2+; 5, Cu2+; 6, Mg2+; 7, Pb2+; 8, Cd2+; 9, Cr3+; 10, Ni2+; 11, Fe2+; 12, Hg2+; 13, Al3+). Figure S10. The PL decay plot of N-CDs 2 aqueous solutions (0.1 mg/mL) in the absence and presence of Fe3+ ions.

Author Contributions

Software, Y.W.; Formal analysis, Q.Z.; Investigation, X.C.; Writing—review & editing, J.F.; Supervision, L.K.; Project administration, J.G. All authors have read and agreed to the published version of the manuscript.

Funding

This article was supported by Scientific Research Program Funded by Education Department of Shaanxi Provincial Government (23JK0313).

Institutional Review Board Statement

Not applicable.

Informed Consent Statement

Not applicable.

Data Availability Statement

Data are contained within the article.

Conflicts of Interest

Qing Zhang were employed by the company Petrochina Sichuan Petrochemical Co., Ltd., The remaining authors declare that the research was conducted in the absence of any commercial or financial relationships that could be construed as a potential conflict of interest.

References

  1. Pang, S.; Liu, S. Dual-emission carbon dots for ratiometric detection of Fe (3+) ions and acid phosphatase. Anal. Chim. Acta 2020, 1105, 155–161. [Google Scholar] [CrossRef] [PubMed]
  2. Chang, V.C.; Cotterchio, M.; Khoo, E. Iron intake, body iron status, and risk of breast cancer: A systematic review and meta-analysis. BMC Cancer 2019, 19, 543. [Google Scholar] [CrossRef] [PubMed]
  3. Liu, Z.; Shen, H.C.; Lian, T.H.; Mao, L.; Tang, S.X.; Sun, L.; Huang, X.Y.; Guo, P.; Cao, C.J.; Yu, S.Y.; et al. Iron deposition in substantia nigra: Abnormal iron metabolism, neuroinflammatory mechanism and clinical relevance. Sci. Rep. 2017, 7, e14973. [Google Scholar] [CrossRef]
  4. Fan, J.; Zhang, S.; Xu, Y.; Wei, N.; Wan, B.; Qian, L.; Liu, Y. A polyethylenimine/salicylaldehyde modified cellulose Schiff base for selective and sensitive Fe (3+) detection. Carbohydr. Polym. 2020, 228, e115379. [Google Scholar] [CrossRef]
  5. Gao, X.X.; Zhou, X.; Ma, Y.F.; Wang, C.P.; Chu, F.X. A fluorometric and colorimetric dual-mode sensor based on nitrogen and iron co-doped graphene quantum dots for detection of ferric ions in biological fluids and cellular imaging. New J. Chem. 2018, 42, 14751–14756. [Google Scholar] [CrossRef]
  6. Upadhyay, Y.; Anand, T.; Babu, L.T.; Paira, P.; Kumar Sk, A.; Kumar, R.; Sahoo, S.K. Combined use of spectrophotometer and smartphone for the optical detection of Fe (3+) using a vitamin B6 cofactor conjugated pyrene derivative and its application in live cells imaging. J. Photochem. Photobiol. A Chem. 2018, 361, 34–40. [Google Scholar] [CrossRef]
  7. Zhang, N.; Zhang, D.; Zhao, J.; Xia, Z. Fabrication of a dual-emitting dye-encapsulated metal-organic framework as a stable fluorescent sensor for metal ion detection. Dalton Trans. 2019, 48, 6794–6799. [Google Scholar] [CrossRef]
  8. Xiao, N.; Dong, J.X.; Liu, S.G.; Li, N.; Fan, Y.Z.; Ju, Y.J.; Li, N.B.; Luo, H.Q. Multifunctional fluorescent sensors for independent detection of multiple metal ions based on Ag nanoclusters. Sens. Actuators B Chem. 2018, 264, 184–192. [Google Scholar] [CrossRef]
  9. Meng, W.; Bai, X.; Wang, B.; Liu, Z.; Lu, S.; Yang, B. Biomass-Derived Carbon Dots and Their Applications. Energy Environ. Mater. 2019, 2, 172–192. [Google Scholar] [CrossRef]
  10. Fan, J.; Kang, L.; Liu, D.; Zhang, S. Modification of Carbon Dots for Metal-Ions Detection. ChemistrySelect 2023, 8, e202300062. [Google Scholar] [CrossRef]
  11. Fan, J.; Kang, L.; Cheng, X.; Liu, D.; Zhang, S. Biomass-Derived Carbon Dots and Their Sensing Applications. Nanomaterials 2022, 12, e4473. [Google Scholar] [CrossRef]
  12. Fernando, K.A.; Sahu, S.; Liu, Y.; Lewis, W.K.; Guliants, E.A.; Jafariyan, A.; Wang, P.; Bunker, C.E.; Sun, Y.P. Carbon quantum dots and applications in photocatalytic energy conversion. ACS Appl. Mater. Interfaces 2015, 7, 8363–8376. [Google Scholar] [CrossRef]
  13. Fan, J.; Zhang, S.; Li, F.; Shi, J. Cellulose-based sensors for metal ions detection. Cellulose 2020, 27, 5477–5507. [Google Scholar] [CrossRef]
  14. Kang, C.; Huang, Y.; Yang, H.; Yan, X.F.; Chen, Z.P. A Review of Carbon Dots Produced from Biomass Wastes. Nanomaterials 2020, 10, e2316. [Google Scholar] [CrossRef]
  15. Da Silva Souza, D.R.; Caminhas, L.D.; de Mesquita, J.P.; Pereira, F.V. Luminescent carbon dots obtained from cellulose. Mater. Chem. Phys. 2018, 203, 148–155. [Google Scholar] [CrossRef]
  16. Wang, C.; Wang, C.; Xu, P.; Li, A.; Chen, Y.; Zhuo, K. Synthesis of cellulose-derived carbon dots using acidic ionic liquid as a catalyst and its application for detection of Hg (2+). J. Mater. Sci. 2016, 51, 861–867. [Google Scholar] [CrossRef]
  17. Lim, S.Y.; Shen, W.; Gao, Z. Carbon quantum dots and their applications. Chem. Soc. Rev. 2015, 44, 362–381. [Google Scholar] [CrossRef] [PubMed]
  18. Wang, Y.; Hu, A. Carbon quantum dots: Synthesis, properties and applications. J. Mater. Chem. C 2014, 2, 6921–6939. [Google Scholar] [CrossRef]
  19. Xie, Y.; Cheng, D.; Liu, X.; Han, A. Green Hydrothermal Synthesis of N-doped Carbon Dots from Biomass Highland Barley for the Detection of Hg (2+). Sensors 2019, 19, e3169. [Google Scholar] [CrossRef]
  20. Shen, P.; Gao, J.; Cong, J.; Liu, Z.; Li, C.; Yao, J. Synthesis of Cellulose-Based Carbon Dots for Bioimaging. ChemistrySelect 2016, 1, 1314–1317. [Google Scholar] [CrossRef]
  21. Wang, J.; Zhang, P.; Huang, C.; Liu, G.; Leung, K.C.; Wang, Y.X. High Performance Photoluminescent Carbon Dots for In Vitro and In Vivo Bioimaging: Effect of Nitrogen Doping Ratios. Langmuir 2015, 31, 8063–8073. [Google Scholar] [CrossRef] [PubMed]
  22. Feng, X.; Jiang, Y.; Zhao, J.; Miao, M.; Cao, S.; Fang, J.; Shi, L. Easy synthesis of photoluminescent N-doped carbon dots from winter melon for bio-imaging. RSC Adv. 2015, 5, 31250–31254. [Google Scholar] [CrossRef]
  23. Xu, Q.; Pu, P.; Zhao, J.; Dong, C.; Gao, C.; Chen, Y.; Chen, J.; Liu, Y.; Zhou, H. Preparation of highly photoluminescent sulfur-doped carbon dots for Fe (3+) detection. J. Mater. Chem. A 2015, 3, 542–546. [Google Scholar] [CrossRef]
  24. French, A.D. Idealized powder diffraction patterns for cellulose polymorphs. Cellulose 2013, 21, 885–896. [Google Scholar] [CrossRef]
  25. Fahma, F.; Iwamoto, S.; Hori, N.; Iwata, T.; Takemura, A. Isolation, preparation, and characterization of nanofibers from oil palm empty-fruit-bunch (OPEFB). Cellulose 2010, 17, 977–985. [Google Scholar] [CrossRef]
  26. Nie, H.; Li, M.; Li, Q.; Liang, S.; Tan, Y.; Sheng, L.; Shi, W.; Zhang, S.X. Carbon Dots with Continuously Tunable Full-Color Emission and Their Application in Ratiometric pH Sensing. Chem. Mater. 2014, 26, 3104–3112. [Google Scholar] [CrossRef]
  27. Gong, X.; Lu, W.; Paau, M.C.; Hu, Q.; Wu, X.; Shuang, S.; Dong, C.; Choi, M.M. Facile synthesis of nitrogen-doped carbon dots for Fe (3+) sensing and cellular imaging. Anal. Chim. Acta 2015, 861, 74–84. [Google Scholar] [CrossRef]
  28. Ye, Q.; Yan, F.; Luo, Y.; Wang, Y.; Zhou, X.; Chen, L. Formation of N, S-codoped fluorescent carbon dots from biomass and their application for the selective detection of mercury and iron ion. Spectrochim. Acta A Mol. Biomol. Spectrosc. 2017, 173, 854–862. [Google Scholar] [CrossRef]
  29. Zhang, H.; Kang, S.; Wang, G.; Zhang, Y.; Zhao, H. Fluorescence Determination of Nitrite in Water Using Prawn-Shell Derived Nitrogen-Doped Carbon Nanodots as Fluorophores. ACS Sens. 2016, 1, 875–881. [Google Scholar] [CrossRef]
  30. Shi, J.; Ni, G.; Tu, J.; Jin, X.; Peng, J. Green synthesis of fluorescent carbon dots for sensitive detection of Fe (2+) and hydrogen peroxide. J. Nanoparticle Res. 2017, 19, e209. [Google Scholar] [CrossRef]
  31. Wang, R.; Wang, X.; Sun, Y. One-step synthesis of self-doped carbon dots with highly photoluminescence as multifunctional biosensors for detection of iron ions and pH. Sens. Actuators B Chem. 2017, 241, 73–79. [Google Scholar] [CrossRef]
  32. Li, H.; He, X.; Kang, Z.; Huang, H.; Liu, Y.; Liu, J.; Lian, S.; Tsang, C.H.; Yang, X.; Lee, S.T. Water-soluble fluorescent carbon quantum dots and photocatalyst design. Angew. Chem. Int. Ed. Engl. 2010, 49, 4430–4434. [Google Scholar] [CrossRef]
  33. Dhenadhayalan, N.; Lin, K.C.; Suresh, R.; Ramamurthy, P. Unravelling the Multiple Emissive States in Citric-Acid-Derived Carbon Dots. J. Phys. Chem. C 2016, 120, 1252–1261. [Google Scholar] [CrossRef]
  34. Zhang, R.; Chen, W. Nitrogen-doped carbon quantum dots: Facile synthesis and application as a “turn-off” fluorescent probe for detection of Hg (2+) ions. Biosens. Bioelectron. 2014, 55, 83–90. [Google Scholar] [CrossRef] [PubMed]
  35. Zhu, S.; Meng, Q.; Wang, L.; Zhang, J.; Song, Y.; Jin, H.; Zhang, K.; Sun, H.; Wang, H.; Yang, B. Highly photoluminescent carbon dots for multicolor patterning, sensors, and bioimaging. Angew. Chem. Int. Ed. Engl. 2013, 52, 3953–3957. [Google Scholar] [CrossRef] [PubMed]
  36. Sun, X.; Bruckner, C.; Lei, Y. One-pot and ultrafast synthesis of nitrogen and phosphorus co-doped carbon dots possessing bright dual wavelength fluorescence emission. Nanoscale 2015, 7, 17278–17282. [Google Scholar] [CrossRef]
  37. Wang, X.C.; Bai, P.X.; Luo, X.M.; Li, J. Synthesis of Carbon Quantum Dots Based on Gelatin and Study on It’s Optical Property. Spectrosc. Spectr. Anal. 2019, 4, 1154–1161. [Google Scholar]
  38. Macairan, J.R.; Jaunky, D.B.; Piekny, A.; Naccache, R. Intracellular ratiometric temperature sensing using fluorescent carbon dots. Nanoscale Adv. 2019, 1, 105–113. [Google Scholar] [CrossRef]
  39. Huang, H.; Lv, J.J.; Zhou, D.L.; Bao, N.; Xu, Y.; Wang, A.J.; Feng, J.J. One-pot green synthesis of nitrogen-doped carbon nanoparticles as fluorescent probes for mercury ions. RSC Adv. 2013, 3, 21691–21696. [Google Scholar] [CrossRef]
  40. Cheng, C.; Xing, M.; Wu, Q. A universal facile synthesis of nitrogen and sulfur co-doped carbon dots from cellulose-based biowaste for fluorescent detection of Fe (3+) ions and intracellular bioimaging. Mater. Sci. Eng. C 2019, 99, 611–619. [Google Scholar] [CrossRef]
  41. Pu, Z.F.; Wen, Q.L.; Yang, Y.J.; Cui, X.M.; Ling, J.; Liu, P.; Cao, Q.E. Fluorescent carbon quantum dots synthesized using phenylalanine and citric acid for selective detection of Fe (3+) ions. Spectrochim. Acta A Mol. Biomol. Spectrosc. 2020, 229, e117944. [Google Scholar] [CrossRef]
  42. Chin, S.F.; Tan, S.C.; Pang, S.C.; Ng, S.M. Nitrogen doped carbon nanodots as fluorescent probes for selective detection and quantification of Ferric (III) ions. Opt. Mater. 2017, 73, 77–82. [Google Scholar] [CrossRef]
  43. Khan, W.U.; Wang, D.; Zhang, W.; Tang, Z.; Ma, X.; Ding, X.; Du, S.; Wang, Y. High Quantum Yield Green-Emitting Carbon Dots for Fe (III) Detection, Biocompatible Fluorescent Ink and Cellular Imaging. Sci. Rep. 2017, 7, e14866. [Google Scholar] [CrossRef]
  44. Liu, Y.; Liu, Y.; Park, S.J.; Zhang, Y.; Kim, T.; Chae, S.; Park, M.; Kim, H.Y. One-step synthesis of robust nitrogen-doped carbon dots: Acid-evoked fluorescence enhancement and their application in Fe (3+) detection. J. Mater. Chem. A 2015, 3, 17747–17754. [Google Scholar] [CrossRef]
  45. Yu, J.; Xu, C.; Tian, Z.; Lin, Y.; Shi, Z. Facilely synthesized N-doped carbon quantum dots with high fluorescent yield for sensing Fe (3+). New J. Chem. 2016, 40, 2083–2088. [Google Scholar] [CrossRef]
  46. Radhakrishnan, K.; Panneerselvam, P.; Marieeswaran, M. A green synthetic route for the surface-passivation of carbon dots as an effective multifunctional fluorescent sensor for the recognition and detection of toxic metal ions from aqueous solution. Anal. Methods 2019, 11, 490–506. [Google Scholar] [CrossRef]
  47. Zhang, J.; Yan, J.; Wang, Y.; Zhang, Y. One-Step Hydrothermal Approach to Synthesis Carbon Dots from D-Sorbitol for Detection of Iron (III) and Cell Imaging. J. Nanosci. Nanotechnol. 2018, 18, 4457–4463. [Google Scholar] [CrossRef]
  48. Shen, J.; Shang, S.; Chen, X.; Wang, D.; Cai, Y. Facile synthesis of fluorescence carbon dots from sweet potato for Fe (3+) sensing and cell imaging. Mater. Sci. Eng. C 2017, 76, 856–864. [Google Scholar] [CrossRef]
  49. Atchudan, R.; Edison, T.; Aseer, K.R.; Perumal, S.; Karthik, N.; Lee, Y.R. Highly fluorescent nitrogen-doped carbon dots derived from Phyllanthus acidus utilized as a fluorescent probe for label-free selective detection of Fe (3+) ions, live cell imaging and fluorescent ink. Biosens. Bioelectron. 2018, 99, 303–311. [Google Scholar] [CrossRef] [PubMed]
  50. Yin, H.; Gao, D.; Qiu, Y.; Yi, G.; Li, J.; Dong, Y.; Zhang, K.; Xia, Z.; Fu, Q. Carbon source self-heating: Ultrafast, energy-efficient and room temperature synthesis of highly fluorescent N, S-codoped carbon dots for quantitative detection of Fe (iii) ions in biological samples. Nanoscale Adv. 2020, 2, 1483–1492. [Google Scholar] [CrossRef]
  51. Hong, D.; Deng, X.; Liang, J.; Li, J.; Tao, Y.; Tan, K. One-step hydrothermal synthesis of down/up-conversion luminescence F-doped carbon quantum dots for label-free detection of Fe (3+). Microchem. J. 2019, 151, e104217. [Google Scholar] [CrossRef]
  52. Desai, M.L.; Basu, H.; Saha, S.; Singhal, R.K.; Kailasa, S.K. Investigation of silicon doping into carbon dots for improved fluorescence properties for selective detection of Fe (3+) ion. Opt. Mater. 2019, 96, e109374. [Google Scholar] [CrossRef]
  53. Tammina, S.K.; Wan, Y.; Li, Y.; Yang, Y. Synthesis of N, Zn-doped carbon dots for the detection of Fe (3+) ions and bactericidal activity against Escherichia coli and Staphylococcus aureus. J. Photochem. Photobiol. B 2020, 202, e111734. [Google Scholar] [CrossRef] [PubMed]
  54. Singh, M.; Kumar, G.; Neogi, S. Devising Mixed-Ligand Based Robust Cd (II)-Framework From Bi-Functional Ligand for Fast Responsive Luminescent Detection of Fe (3+) and Cr (VI) Oxo-Anions in Water With High Selectivity and Recyclability. Front. Chem. 2021, 9, e651866. [Google Scholar] [CrossRef]
  55. Singh, M.; Senthilkumar, S.; Rajput, S.; Neogi, S. Pore-Functionalized and Hydrolytically Robust Cd (II)-Metal-Organic Framework for Highly Selective, Multicyclic CO2 Adsorption and Fast-Responsive Luminescent Monitoring of Fe (III) and Cr (VI) Ions with Notable Sensitivity and Reusability. Inorganic. Chem. 2020, 5, 3012–3025. [Google Scholar] [CrossRef] [PubMed]
  56. Chen, Y.; Sun, X.; Pan, W.; Yu, G.; Wang, J. Fe (3+)-Sensitive Carbon Dots for Detection of Fe (3+) in Aqueous Solution and Intracellular Imaging of Fe (3+) Inside Fungal Cells. Front. Chem. 2020, 7, e911. [Google Scholar] [CrossRef]
  57. Sailaja Prasannakumaran Nair, S.; Kottam, N.; SG, P.K. Green Synthesized Luminescent Carbon Nanodots for the Sensing Application of Fe (3+) Ions. J. Fluoresc. 2020, 30, 357–363. [Google Scholar] [CrossRef]
  58. Li, S.; Li, Y.; Cao, J.; Zhu, J.; Fan, L.; Li, X. Sulfur-doped graphene quantum dots as a novel fluorescent probe for highly selective and sensitive detection of Fe (3+). Anal. Chem. 2014, 86, 10201–10207. [Google Scholar] [CrossRef]
  59. Shangguan, J.; Huang, J.; He, D.; He, X.; Wang, K.; Ye, R.; Yang, X.; Qing, T.; Tang, J. Highly Fe (3+)-Selective Fluorescent Nanoprobe Based on Ultrabright N/P-Codoped Carbon Dots and Its Application in Biological Samples. Anal. Chem. 2017, 89, 7477–7484. [Google Scholar] [CrossRef]
  60. Wang, C.; Hu, T.; Wen, Z.; Zhou, J.; Wang, X.; Wu, Q.; Wang, C. Concentration-dependent color tunability of nitrogen-doped carbon dots and their application for iron (III) detection and multicolor bioimaging. J. Colloid Interface Sci. 2018, 521, 33–41. [Google Scholar] [CrossRef]
  61. Wu, F.; Su, H.; Wang, K.; Wong, W.K.; Zhu, X. Facile synthesis of N-rich carbon quantum dots from porphyrins as efficient probes for bioimaging and biosensing in living cells. Int. J. Nanomed. 2017, 12, 7375–7391. [Google Scholar] [CrossRef] [PubMed]
  62. Jiang, Y.; Han, Q.; Jin, C.; Zhang, J.; Wang, B. A fluorescence turn-off chemosensor based on N-doped carbon quantum dots for detection of Fe (3+) in aqueous solution. Mater. Lett. 2015, 141, 366–368. [Google Scholar] [CrossRef]
Figure 1. Preparation process of N-CDs.
Coatings 13 01979 g001
Figure 2. XRD pattern of MCC and N-CDs 2.
Coatings 13 01979 g002
Figure 3. XPS spectra of N-CDs 2: (a) broadband spectra (b) C1s (c) O1s (d) N1s.
Coatings 13 01979 g003
Figure 4. (a) PL excitation and emission spectra of N-CDs 2 aqueous solutions (0.1 mg/mL) (b) fluorescence spectra of N-CDs 2 aqueous solutions (0.1 mg/mL) at different excitation wavelengths.
Coatings 13 01979 g004
Figure 5. (a) Fluorescence spectra of N-CDs 2 aqueous solutions (0.1 mg/mL) at different temperatures (b) the relationship between fluorescence intensity of N-CDs 2 aqueous solutions (0.1 mg/mL) with different temperatures (30~70 °C).
Coatings 13 01979 g005
Figure 6. Fluorescence spectra of N-CDs 2 aqueous solutions (0.1 mg/mL) with different metal ions.
Coatings 13 01979 g006
Figure 7. (a) PL spectrum of N-CDs 2 aqueous solutions (0.1 mg/mL) upon incremental addition of different Fe3+ concentrations (0~20 ppm) (b) The relationship between the fluorescence emission intensity at 466 nm of N-CDs 2 aqueous solutions (0.1 mg/mL) with Fe3+ ion concentrations (0~14 ppm).
Coatings 13 01979 g007
Figure 8. Mechanism diagram of fluorescence quenching of N-CDs 2 with Fe3+ ions.
Coatings 13 01979 g008
Table 1. Comparison of different CDs for Fe3+ ion detection performances.
SensorDetection Range/ppmLOD/ppmReference
Phe-CDs0.28~27.780.04[41]
N-CDs11.11~277.784.11[42]
CDs1.39~16.671.06[43]
N-CDs0.0~2.780.61[44]
N-CDs0~2.780.26[45]
N, O/Iy-CDs0~3.330.34[46]
CDs1.39~19.440.06[47]
CDs0.056~5.560.018[48]
N-CDs0.11~1.390.05[49]
N, S-CDs0.011~33.330.005[50]
F-CDs0.056~5.560.0006[51]
Si-CDs0.0006~0.1390.0001[52]
N, Zn-CDs0.014~6.940.008[53]
N-CDs 20~140.21This work
Table 2. Results of Fe3+ ion detection in real water samples.
SampleAdded/ppmFound/ppmRecoveries/%RSD/%
4.004.11102.751.29
Tap water8.007.9799.631.39
12.0012.09100.751.03
4.003.9398.252.33
Pool water8.007.8998.631.91
12.0012.05100.421.76
Disclaimer/Publisher’s Note: The statements, opinions and data contained in all publications are solely those of the individual author(s) and contributor(s) and not of MDPI and/or the editor(s). MDPI and/or the editor(s) disclaim responsibility for any injury to people or property resulting from any ideas, methods, instructions or products referred to in the content.

