Article

Surface Modification of Fast-Growing Wood with a Titanium-Dioxide-Based Nanocoating to Improve Weathering Resistance

1
Department of Forest Products, Faculty of Forestry and Environment, IPB University, Bogor 16680, Indonesia
2
Department of Chemistry, Faculty of Mathematics and Natural Sciences, IPB University, Bogor 16680, Indonesia
3
INRAE, Laboratoire d'Études et de Recherche sur le Matériau Bois (LERMAB), Faculté des Sciences et Technologies, Université de Lorraine, 54000 Nancy, France
*
Author to whom correspondence should be addressed.
Coatings 2023, 13(11), 1924; https://doi.org/10.3390/coatings13111924
Submission received: 5 September 2023 / Revised: 6 November 2023 / Accepted: 7 November 2023 / Published: 10 November 2023

Abstract

:
Acacia mangium requires the addition of a finishing material to increase its resistance to weathering. Herein, the effectiveness of a nanocoating containing titanium dioxide nanoparticles (TiO2-NPs) as a finishing material for mangium wood was investigated. The coating material formulations used were oil-based (V1) and water-based (V2) varnishes with TiO2-NP concentrations of 1% (CT1), 5% (CT5), and 10% (CT10) (w/v). The uncoated and coated samples were subjected to weathering periods of 0, 2, and 4 months. The results showed that the addition of TiO2 nanoparticles to the V1 and V2 varnishes resulted in more gradual colour changes after the weathering period. The surface of the mangium wood also became smoother after being coated. However, the surface roughness increased with the duration of the weathering period. The wettability (K-value) of the sample decreased after coating, indicating that the coated sample was more hydrophobic than the uncoated sample. The results of a photocatalyst test, which analysed the effectiveness of the coatings, showed that the best coating material formulas were V1-CT10 and V2-CT10, as they degraded 75.21% and 71.03% of methylene blue content, respectively. Fourier transform infrared analysis showed that mangium wood did not undergo rapid weathering after the nanocoating treatment, as indicated by an insignificant decrease in the peak absorption intensity of the main structural functional groups of wood.

1. Introduction

Wood is used worldwide for various purposes, including in the construction and art industries [1,2,3]. In our country, teakwood, mahogany, and mangium (Acacia mangium) are widely utilized for those industries due to attractive appearance and a distinctive pattern. Mangium also used to manufacture engineered wood products and lightweight construction materials (floors, wallboards, and poles) [4]. Mangium has a specific gravity ranging from 0.43–0.66 and is classified into class II-III. Nugroho et al. [5] reported that the tangential diameter of vessel lumina and vessels per square millimetre of A. mangium from Indonesia are 132–142 μ m and 7–9/mm2, respectively.
On the other hand, wood including mangium can often be subjected to degradation or deterioration—such as discolouration, surface roughness changes, and cracks—due to weather exposure (especially when used outdoors). According to Rowel [6], the gradual degradation of materials owing to weather exposure factors can be referred to as weathering. Wood degradation can be caused by a number of factors, including ultraviolet (UV) radiation, rainwater, temperature, humidity, and wind abrasion. Wood surfaces can be protected from weathering via a finishing process by paint application, varnish or water repellent [7]. Finishing is the process of coating wood surfaces with one or more coating materials to protect the wood and maintain its appearance [8,9]. Varnish could bring up the beautiful wood texture and pattern and used for interior purposes, while pigmented paint covers wood surfaces and used for exterior. In this study, we propose to use varnish for exterior application by using nanocoating. Thus, wood still can have its natural texture and pattern for exterior application and yet protected.
Nanoparticles can be added to coating materials to increase the weather resistance. Even coating materials containing a small proportion of nanoparticles (less than 10%) can significantly reduce degradation and maintain a high wood quality [10]. Nanoparticle materials are used to obtain transparent coatings and improve interactions between the coating material and wood surface. Nanoparticles are widely used for transparent coatings since they have a large surface area and very small particle size (<100 nm). Several studies have applied coating materials containing nanoparticles, such as nano-SiO2 [11], nano-ZnO [12,13], and nano-CeO2 coatings [14], to wood surfaces for a high resistance to weathering. In addition, titanium dioxide nanoparticles (TiO2-NPs) [15] have been used to formulate nanocoatings for wood finishing. In this study, we propose the application of nanocoating technology to formulate a varnish for exterior applications that can improve the weather resistance of mangium wood and yet still keep its natural color and texture. Numerous TiO2 nanocoatings have been developed previously to prevent weathering. According to Wang et al. [16], anatase TiO2 is more suitable as a photocatalyst, whereas rutile TiO2 is preferred for blocking UV irradiation. Additionally, TiO2-NPs are considered chemically stable and non-toxic [17,18]. Therefore, TiO2-NPs can increase the dimensional stability of wood [19,20] and photocatalysts [20] and prevent weathering [21,22,23,24]. Most TiO2-NPs used originate from the market. However, the use of TiO2-NPs synthesis using hydrothermal methods has not been widely developed.
Hydrothermal synthesis is performed in a closed system at high pressure and low temperature, using water as the medium [25]. The hydrothermal method is a simple and environmentally friendly synthesis process. The synthesised materials can be stored at room temperature and reused [26]. Moreover, hydrothermal processes (bottom-up techniques) enable catalyst-free growth and particle size control at low temperatures and thus are economical [20,27,28]. The factors affecting a hydrothermal process are the reaction time and temperature at the synthesis stage. The temperature at this stage influences the diameter, crystal size, and homogeneity of the synthesised particles [29,30]. According to Saputra and Noerochim [31], the reaction time affects the homogeneity of the material produced. Aneesh et al. [32] also reported that particle properties, such as morphology and size, could be controlled during hydrothermal synthesis by controlling the reaction temperature, time, and precursor concentration.
In this study, we propose clear nanocoating technology for exterior applicationsThe objectives was to determine the effectiveness of nanocoatings containing TiO2-NPs as finishing materials to improve the weathering resistance of mangium wood.

2. Materials and Methods

A ten-year-old mangium wood sample was obtained from a plantation forest managed by Perhutani, a state-owned enterprise, in the Banten area of West Java, Indonesia. The mangium wood was then cut into 100-cm-long pieces to conduct multiple experiments. The chemicals used in this study included bulk anatase TiO2 (Pure®, Lindon, UT, USA), ethanol (Mallinckrodt chemical®, Missouri, UK), deionised water, methylene blue (MB), and oil-based (V1) and water-based (V2) varnishes.

2.1. Sample Preparation

Mangium wood was cut using chain and table saws without distinguishing between sapwood and heartwood. A sample size of 15 cm × 7.5 cm × 2 cm was used for testing the colour change, roughness, and effect of photocatalyst, and a sample size of 10 cm × 5 cm × 2 cm was used to test the wettability and surface free energy of the coated mangium wood.

2.2. Synthesis of Anatase TiO2-NP Using the Hydrothermal Method

TiO2-NPs were synthesised by weighing 7 g of bulk TiO2 and adding it to a beaker, along with 75 mL of deionised water. The prepared solution was reacted in a Teflon stainless steel autoclave at 75 °C for 4 h in the oven, after which the solution was gradually cooled to room temperature over 24 h. The resulting precipitate was separated into a porcelain dish and then washed with ethanol and calcined for 3 h at 500 °C in a furnace [20,33].

2.3. Characterization of Synthesised TiO2-NPs

TiO2-NPs synthesised via the hydrothermal method were characterised in a previous study [23]. In this study, particle size and zeta potential analyses were conducted. Hydrothermally synthesised TiO2-NPs (10 mg) were dissolved in 100 mL of demineralised water and stirred for 15 min using a sonicator [34]. The solution, with a concentration of 100 mg kg−1 of TiO2-NPs, was analysed for particle size and zeta potential using a particle size analyser (Beckman Coulter LS 13 320 XR, Pasadena, CA, USA). Furthermore, the TiO2-NPs were characterised via UV-Vis spectrophotometry, Fourier-transform infrared (FTIR) spectroscopy, and X-ray diffraction (XRD). [35]. The spectra and diffractogram data were processed using the Origin 8.5 software (Northampton, MA, USA). The inorganic compounds were elucidated using the QualX version 2.0 (Rome, Italy) and Mercury version 4.2.0 (Cambridge, UK) softwares.
The optical properties were characterised using a UV-Vis spectrophotometer (Shimadzu UV-1800, Kyoto, Japan) by dissolving anatase TiO2-NPs at a concentration of 0.1 M) in demineralised water, before measuring the absorbance in the UV wavelength range of 200–400 nm [36]. These measurement data were also used for the bandgap energy analysis using the Tauc method. Characterisation of the NPs using FTIR (Perkin-Elmer Spectrum One, Waltham, MA, USA) and XRD (PANalytical Empyrean, Almelo, The Netherlands) was carried out by initially screening anatase TiO2-NPs in the powder form using a 100-mesh sieve. Subsequently, FTIR analysis was conducted via the pellet method using KBr in the wave number range of 400–4000 cm−1, while XRD analysis was conducted via the powder measurement method for a 2θ angle range of 5–90°.

2.4. Preparation and Coating Application of Nanocoating Materials

The coating solution was prepared from a mixture of TiO2-NPs and oil- (V1) and water-based (V2) varnishes. The nanocoating materials used were prepared at concentrations of 1% (CT1), 5% (CT5), and 10% (CT10) (w/v). The nanocoating solution was homogenised for 30 min using a sonicator. Subsequently, the nanocoating materials were applied on one side of the wood surface. The wood samples were exposed at a weathering station for four months, and the samples were evaluated every two months.

2.5. Colour Change Test

Colour changes in the test samples were analysed using the CIELab method with the Adobe Photoshop CS6 version 13.1.2 software. All uncoated and coated test samples were scanned using a scanner at 0, 2, and 4 months. Each test-sample image was acquired from five locations. L, a, and b were the parameters for measuring the colour change. The colour change (ΔE) was calculated using Equations (1)–(4):
Δ L =   L t   L u ,
Δ a =   a t   a u ,
Δ b =   b t   b u ,
Δ E   = [ Δ L 2 + Δ a 2 + Δ b 2 ] ,
where ΔL is the difference in brightness, Δa is the difference in red or green, and Δb is the difference in yellow or blue colours. The L u , a u , and b u values are the L, a, and b values of the samples before weathering (after 0 months). L t , a t , and b t are the L, a, and b values of the samples after weathering (after 2 months and 4 months). ΔE is the total colour change. The amount of discolouration in the wood was determined according to the guidelines listed in Table 1.

2.6. Surface Roughness Test

Surface roughness was measured according to ISO 4287:1997 [38] by attaching a sensor to the wood surface at three different locations perpendicular to the grain. The measurement was performed with a cut-off of 0.8 mm, tracing length of 6 mm, and measuring speed of 0.5 mm s−1. Arithmetic mean roughness (Ra) was used as the surface roughness measurement parameter.

2.7. Contact Angle Measurement

The contact angle measurements were performed at three different locations on each surface of the test sample. The drop shape on the wood was recorded for 180 s. Each recorded video was cut using GOM Player version 2.3.79.5344 software with a cutting interval of 10 s for a water-based coating and 0.1 s for an oil-based coating. The contact angles were analysed using ImageJ 1.46, with drop snake plugin analysis on each image stack. Subsequently, the contact angles were calculated on both sides (right and left) of the droplet and averaged. The contact angle results are presented as a curve depicting the change in the contact angle over time.

2.8. Determination of Equilibrium Contact Angles and Wettability Values

The wettability value was determined by measuring the constant or equilibrium contact angle between the liquid and surface of the uncoated and coated wood samples. The equilibrium contact angle value was determined based on the segmented regression equation between time (x) and contact angle (y) using the PROC NLN program in the SAS statistical version 9.0 software. The contact angle change rate (K-value) from the S/G model [39] was used to evaluate wettability. A non-linear regression model was used to calculate the K-value using a defined function to fit the S/G equation in XLSTAT Addinsoft. The S/G model used Equation (5),
θ = θ i · θ e θ i + θ e     θ i exp   K   θ e θ e     θ i   t   ,
where θ is the contact angle at a time t, θi is the initial contact angle, θe is the equilibrium contact angle, and K is the constant contact angle change rate.

2.9. Photocatalyst Activity Test

After the coating treatment, 0.1 g (100 mesh) of the wood surface sample was added to 10 mL of MB solution at a concentration of 10 mg kg−1 and then stirred until homogeneity. The mixed solutions were simultaneously irradiated with UV light at wavelengths of 254 and 366 nm for 60 min. Subsequently, the absorbance of the mixed solution was measured at 665 nm [40] using a UV-Vis spectrophotometer (Shimadzu UV-1800). The tests were performed on uncoated and coated mangium wood samples after 0, 2, and 4 months of weathering.
The consumption of electrical energy as an energy source for the UV lamp is an important criterion in the MB degradation photocatalysis reaction process. The consumption of a large amount of electrical energy increases the operational cost of the testing process. Thus, electrical energy consumption can be used as the basis for cost calculations for large-scale applications. The measured value was the electrical energy per order, which is defined as the number of kWh of electrical energy required to reduce the concentration of MB by one order (i.e., 90% degradation) in 1 m3 of sample [41]. The electrical energy per order, that is EEO (kWh/m3/order), can be estimated using Equation (6) for a single-batch reactor [42]:
E EO = P   ×   t   × 1000 V   × 60 ×   log   C o C f   ,
where P is the energy of the UV lamp used in kW, t is the radiation time by the UV lamp in min, V is the volume of MB solution used in the study in L, Co is the initial concentration of MB solution in mg L−1, and Cf is the final concentration of MB solution after the photocatalyst reaction process in mg L−1.

2.10. FTIR Spectrometry

Uncoated and coated wood samples were ground to a particle size of 200 mesh and formed into pellets with KBr (at a ratio of 1:100). The pellets were analysed via FTIR (Nicolet 6700 Thermo Scientific, Waltham, MA, USA) spectrometry in the range of 4000 to 400 cm−1 at a resolution of 4 cm−1 for 32 scans. The results were converted into absorbance units. The samples were analysed before and after a 4-month weathering period.
Degradation analysis of biopolymers, such as wood, was performed by identifying the absorption patterns of wood functional groups in the FTIR spectrum. Quantitative analysis was performed by calculating the ratio index of the absorption bands of the functional groups using Equation (7) [43],
and   Index   Ratio = I A I B ,
where IA is the absorption value for a certain functional group before weathering, and IB is the absorption value for a certain functional group after weathering. A decreasing value of the band index ratio indicates wood degradation.

2.11. Data Analysis

This study used two-way analysis of variance (ANOVA) for a completely randomised statistical analysis of two factors: weathering time and treatment variation. Two way-ANOVA was performed to characterise the values of the colour change parameters (L, a, and b), total colour change, surface roughness, equilibrium contact angle, and K-value, followed by Duncan’s multiple-range test at a significance level of 5%. Statistical testing was performed using the IBM Statistical Package for Service Solutions (SPSS) Statistics program version 25.0, Stanford, CA, USA.

3. Results

3.1. Synthesised TiO2-NP

3.1.1. Particle Size and Zeta Potential Analysis

Particle size analysis (see Figure 1a) shows that TiO2-NPs synthesised using the hydrothermal method had a mean particle size of 75.34 nm with most particles having a size of 65.8 nm and the particles with the lowest intensity having a size of 128.6 nm. In addition, zeta potential analysis was performed to measure the stability of the TiO2-NPs when dispersed in water (see Figure 1b). The mean zeta potential was −63.17 mV, while the highest intensity of zeta potential was observed at −65.65 mV and the lowest intensity at −99.30 mV. A similar result was reported by Li et al. [44] who successfully synthesised TiO2-NPs with a zeta potential value ranging from −56.63 mV to −119.32 mV. Based on the particle size and zeta potential analyses, the synthesised TiO2 particles were classified as nanosized, since they had a mean particle size smaller than 100 nm [45] and a particle stability of more than −61 mV when dispersed in a solution [46]. These results indicate that the TiO2-NPs were successfully synthesised using the hydrothermal method. Moreover, according to Jasmani et al. [47], particle (nano)size and stability are very important criteria for active compounds in nanocoating materials. Hence, TiO2-NPs can be used as an active compound in nanocoating materials on wood to increase its resistance to weathering.

3.1.2. FTIR Result

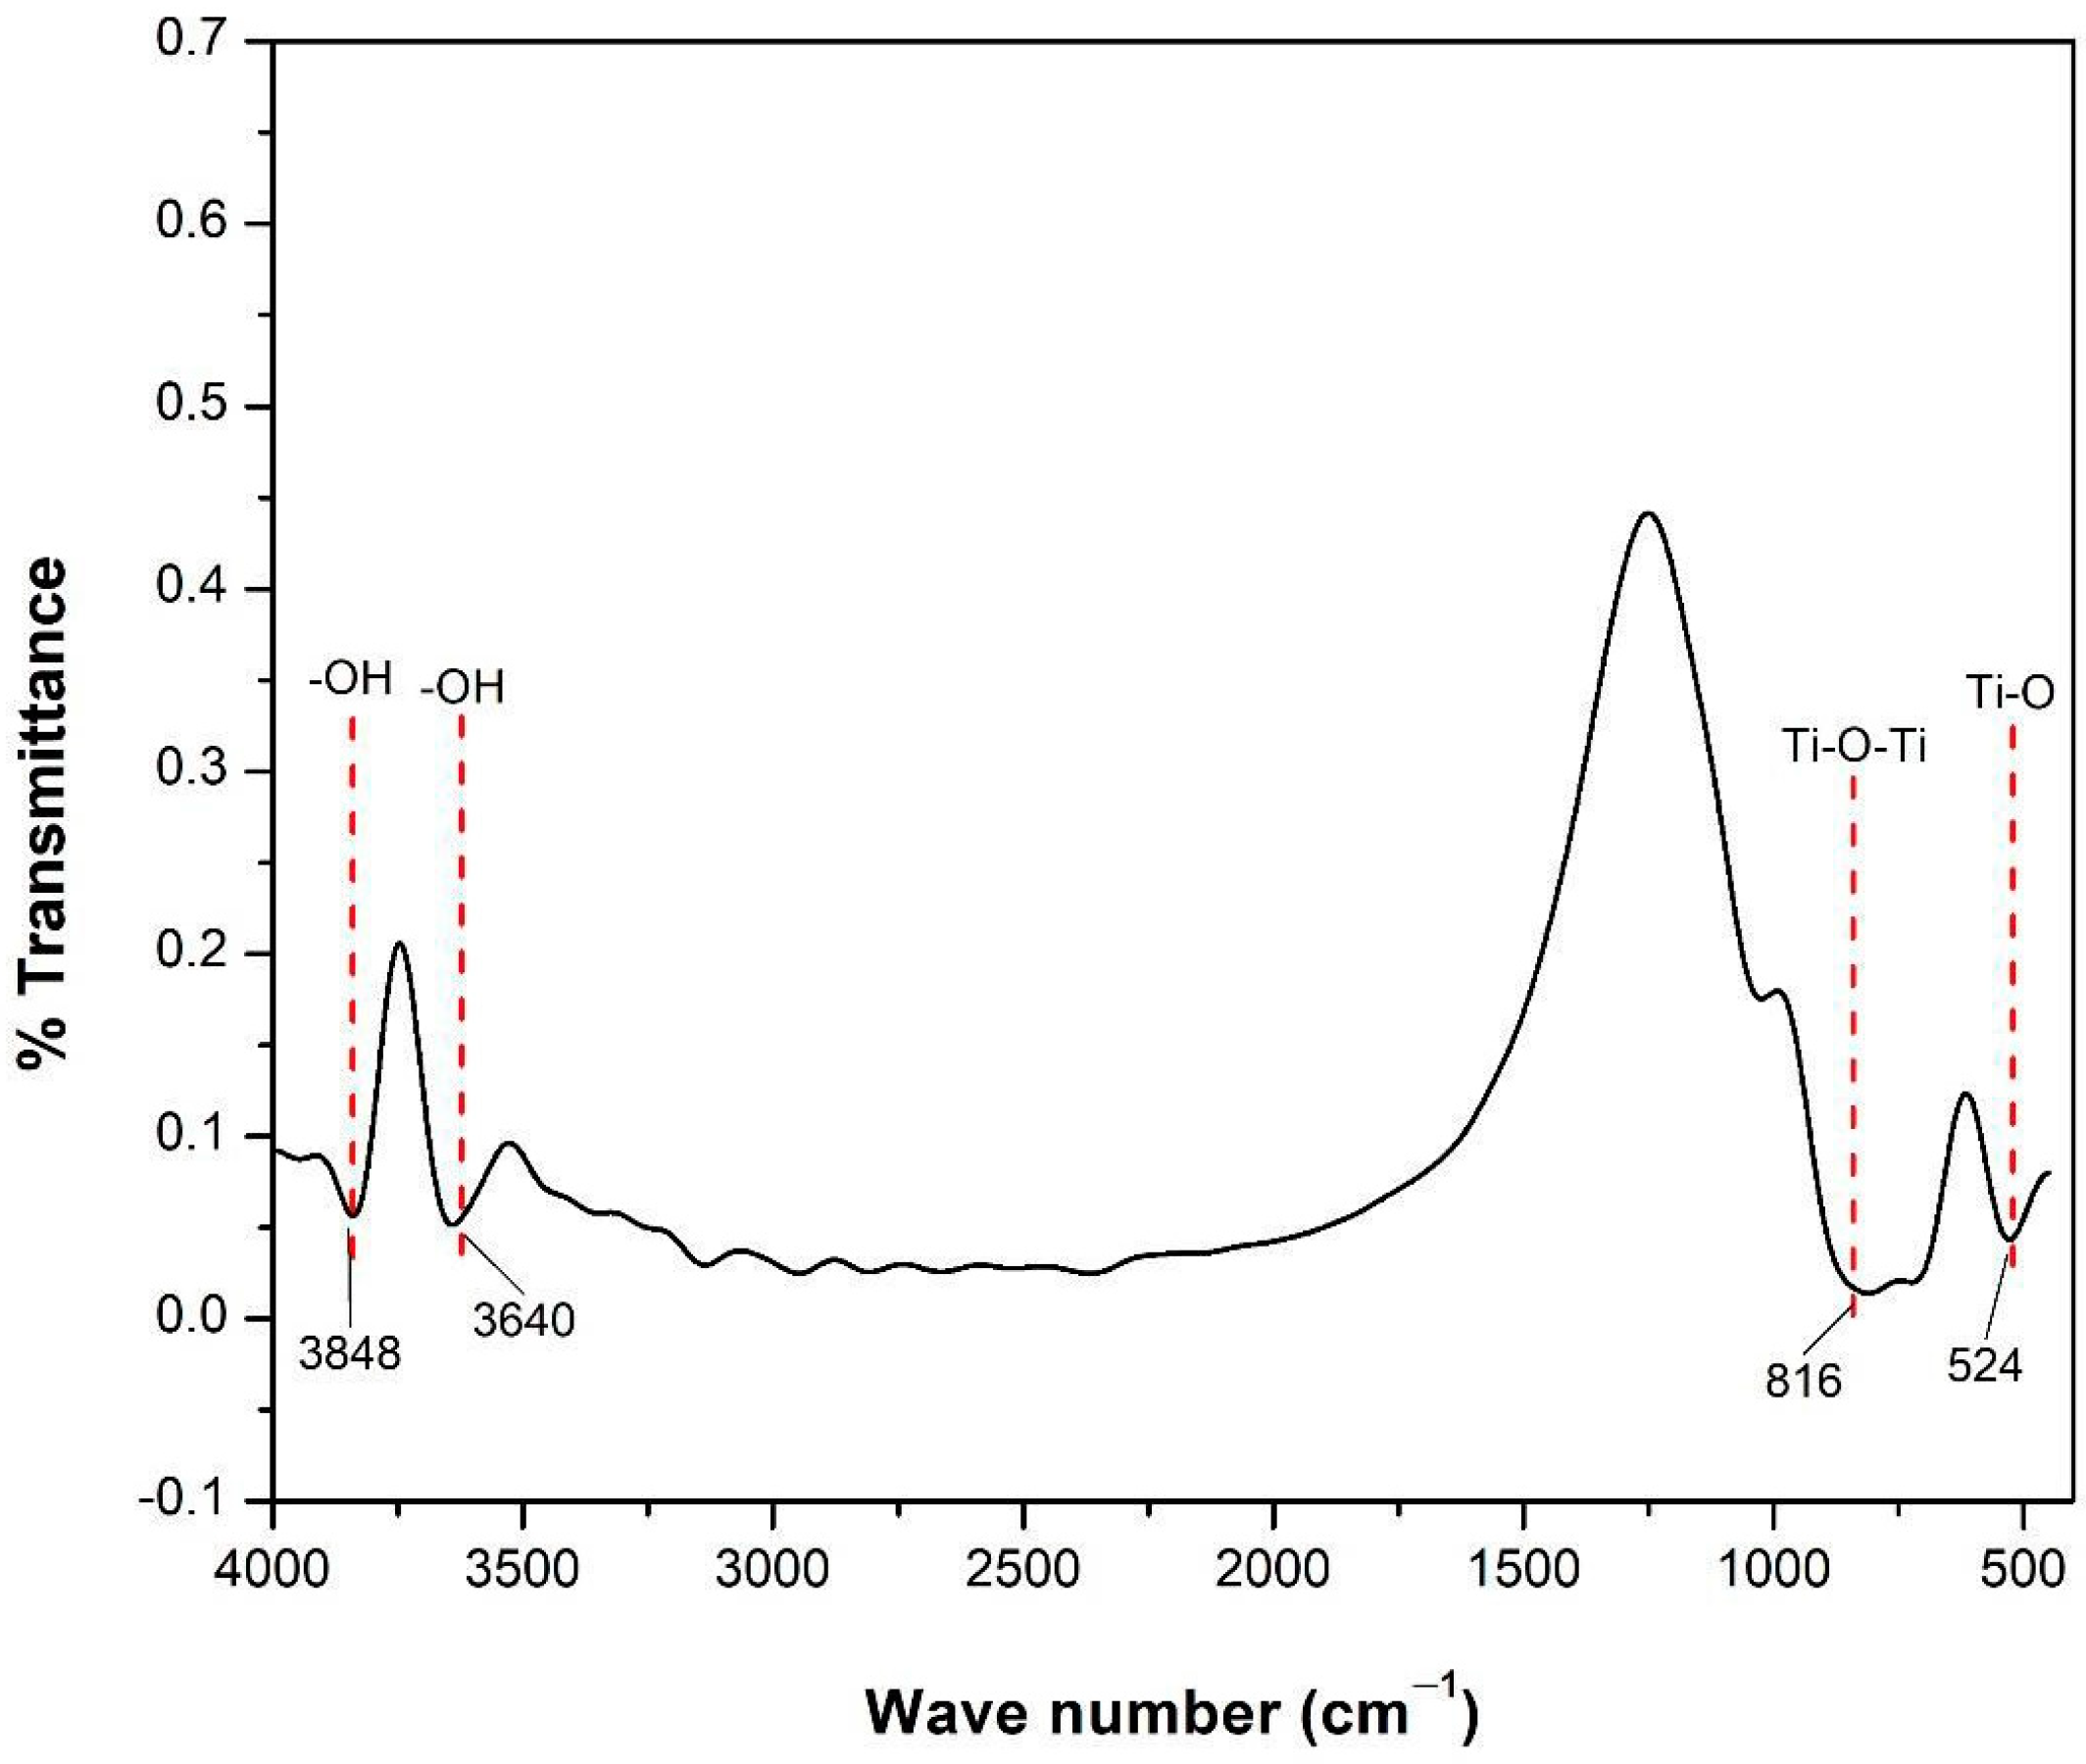
The results of the analysis of the FTIR spectrum of the TiO2-NPs (Figure 2) identified the functional groups of Ti-O at a wave number of 524 cm−1 and Ti-O-Ti at a wave number of 816 cm−1 which were bonds formed in the framework of the TiO2 compound. The spectrum of TiO2 shows intense peaks at 3640 and 3848 cm−1, owing to the stretching of the OH group of the H2O molecule from the air that binds to the TiO2 compound through the adsorption process [48]. This indicates that the material synthesised via the hydrothermal method was a TiO2 compound.

3.1.3. XRD Result

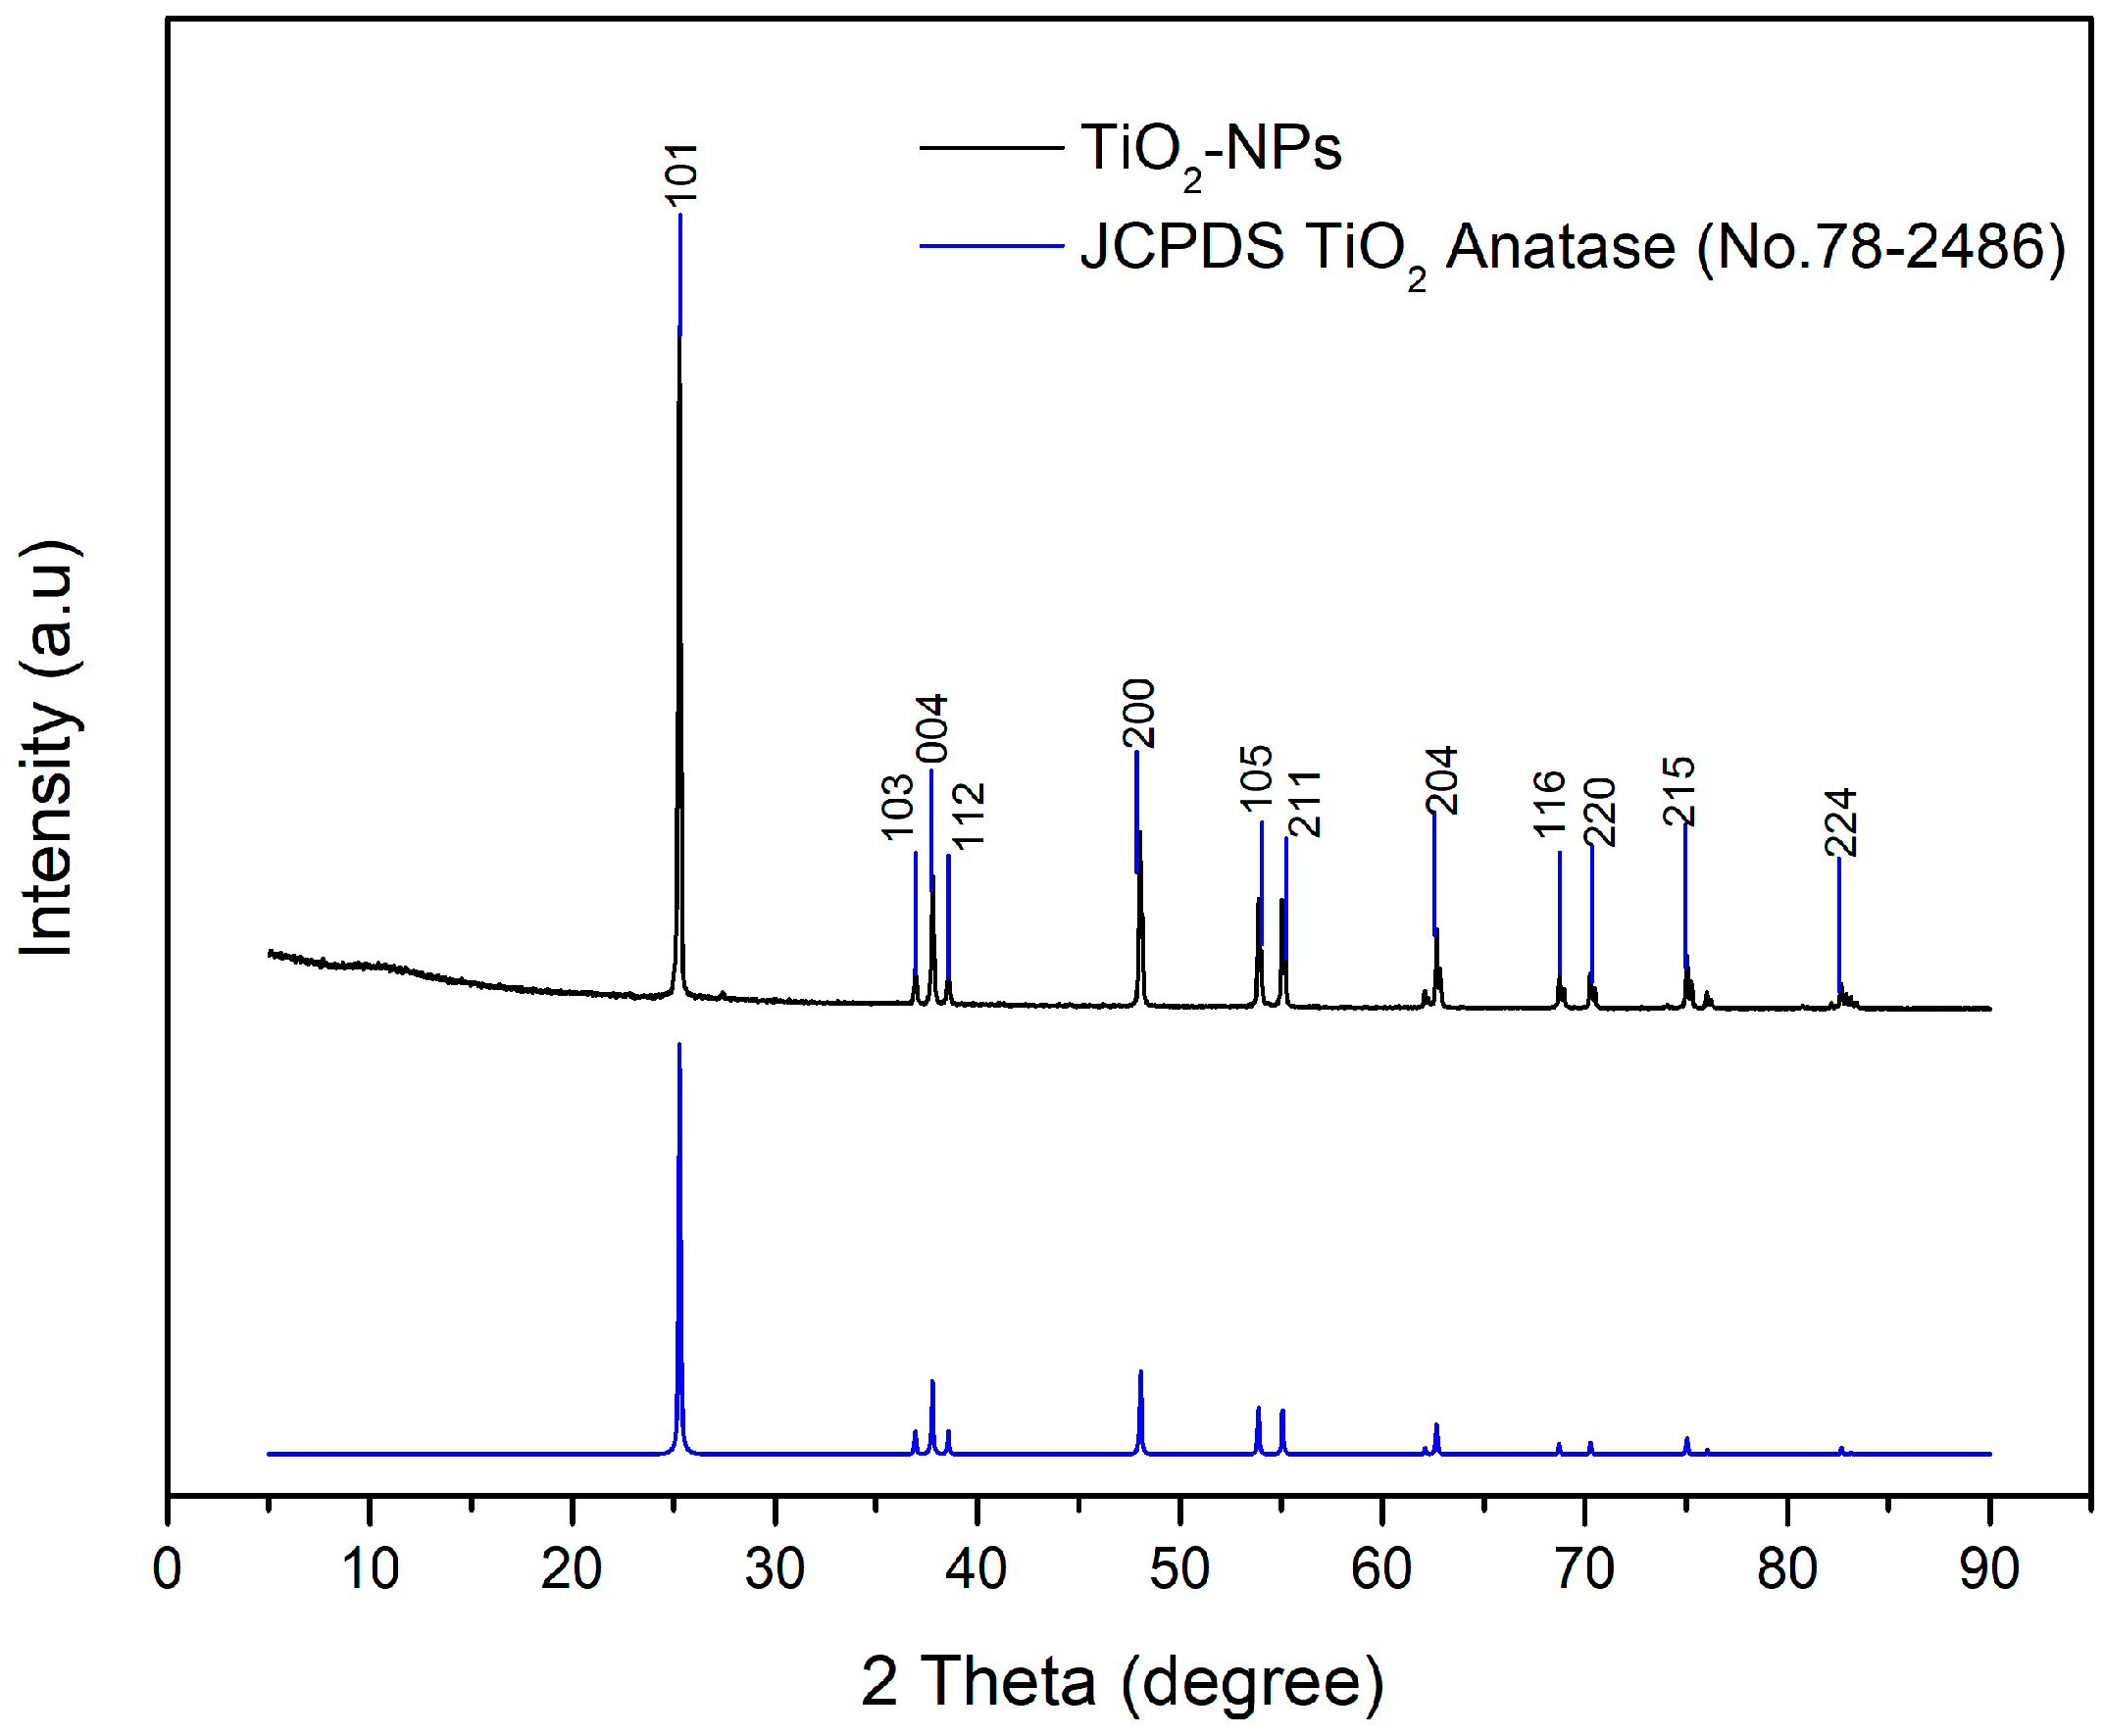
XRD analysis was used to determine the phase and degree of crystallinity of the TiO2-NPs synthesised using the hydrothermal method. The diffractogram (Figure 3) shows peaks at 2θ values of 25.20°, 36.83°, 37.67°, 38.67°, 47.91°, 54.02°, 55.22°, 62.75°, 68.63°, 70.47°, 74.96°, and 82.55°. Based on a comparative analysis of the standard diffractogram of anatase TiO2 JCPDS card number 78-2486 [35], these peaks can be attributed to anatase TiO2 compounds synthesised via the hydrothermal method. The degree of crystallinity of the TiO2-NPs was determined by comparing the crystalline lattice with the total number of lattices in the diffractogram (amorphous and crystalline). The degree of crystallinity is crucial since it is closely related with the reactivity and optical properties of the TiO2-NPs. The higher the degree of crystallinity of a material, the better its reactivity and optical properties when applied as a catalyst or advanced material [49]. The calculated results show that the synthesised TiO2-NPs have a high degree of crystallinity (99.75%).

3.1.4. UV-Vis Spectrophotometer Result

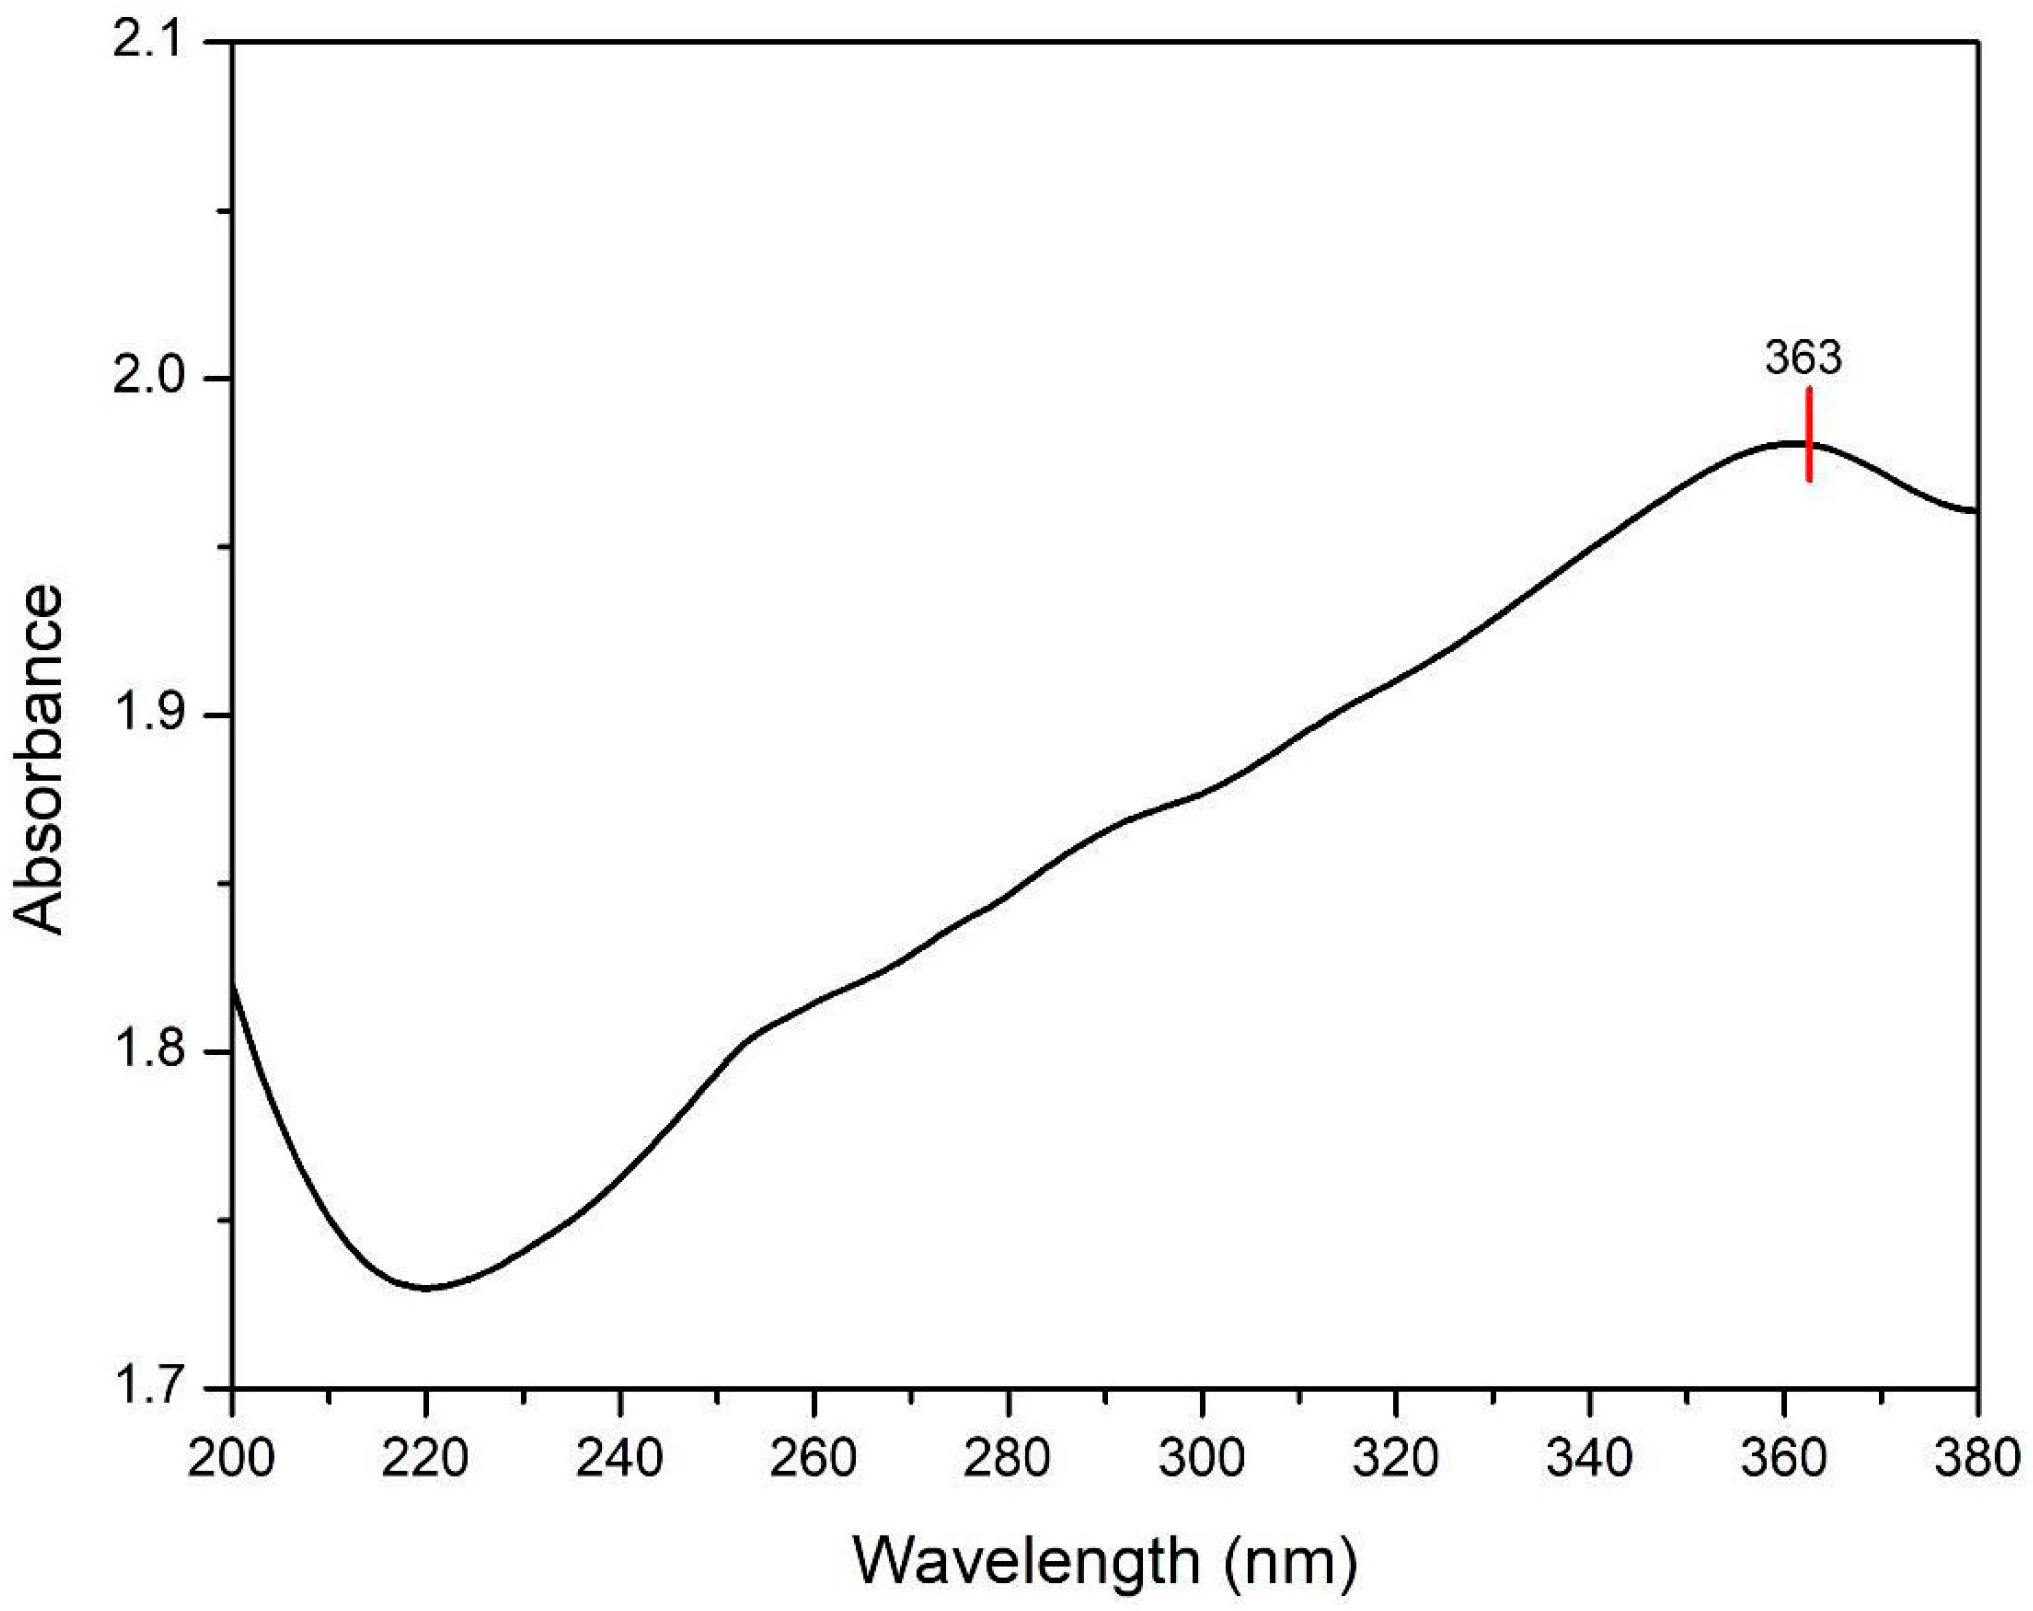
The results of the UV spectrum analysis of the TiO2-NPs (see Figure 4) showed a wavelength with a maximum absorbance value of 363 nm. This result is consistent with the results of Li et al. [50] that TiO2-NPs synthesised via the hydrothermal method have a maximum wavelength in the UVA range of 320–400 nm. TiO2 compounds have valence bands derived from the 2p orbitals of the O atoms and conduction bands derived from the 3d orbitals of the Ti atoms. Maximum absorbance occurs when electrons are excited from the valence band to the conduction band [51].
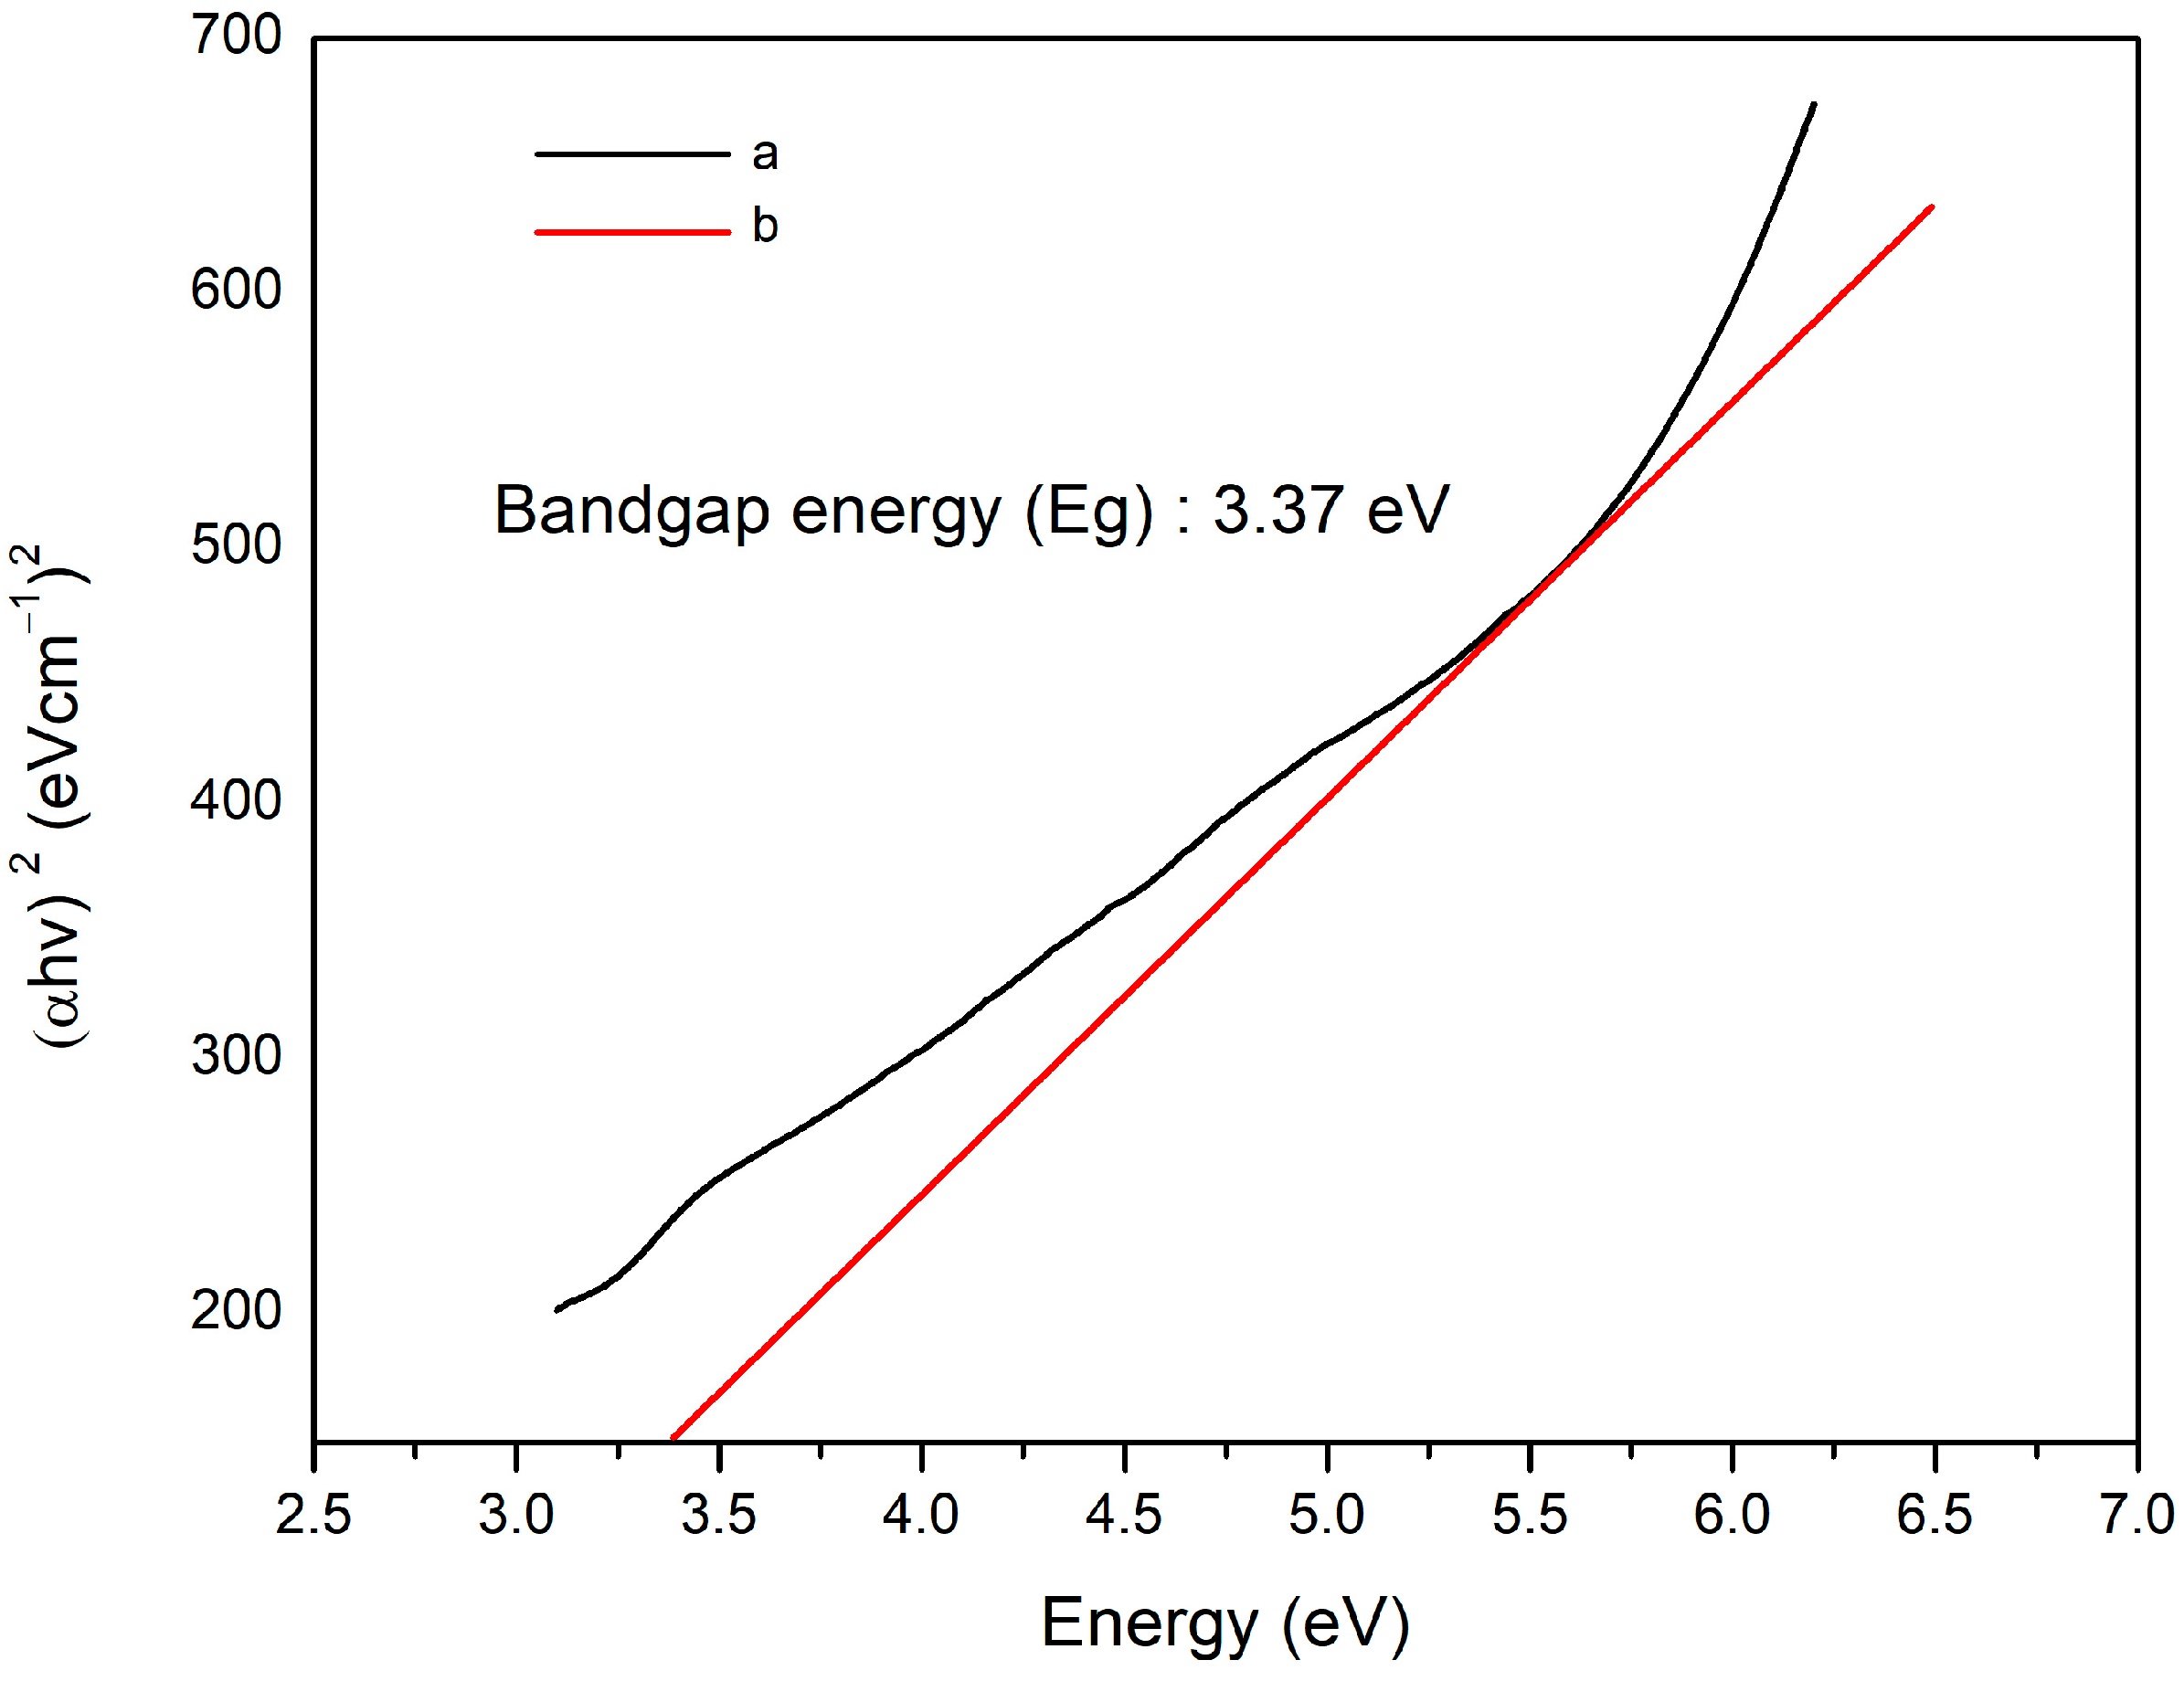
The optical properties of a material are determined by its interaction with electromagnetic radiation. These optical properties can be tested in the UV, visible-light, and infrared wavelength ranges for semiconductors such as TiO2. The optical properties strongly depend on the bandgap energy [52]. Band gap energy analysis can be performed via the Tauc method (see Figure 5), based on the assumption that the energy affected by the absorbance coefficient (α) can be determined by the following:
(𝛼·ℎ𝜈)γ = 𝐵(ℎ𝜈−𝐸g),
where h is Planck’s constant, ν is the photon frequency, Eg is the bandgap energy, and B is a constant. The factor γ depends on the value of the natural electron transition, which is equivalent to ½ or 2 for indirect and direct transitions in the band gap energy, respectively [53]. The results of the direct bandgap energy analysis of the synthesised TiO2-NPs showed a value of 3.37 eV. This value is greater than the band gap value of bulk-phase TiO2 anastase which is 3.22 eV. This result confirms that the particle size is inversely proportional to the band gap. Smaller particles exhibit larger bandgaps as fewer molecular orbitals are added to the energy ground state of the particles for interaction. Therefore, absorption occurs at higher radiant energies, resulting in a shift towards shorter wavelengths [35].
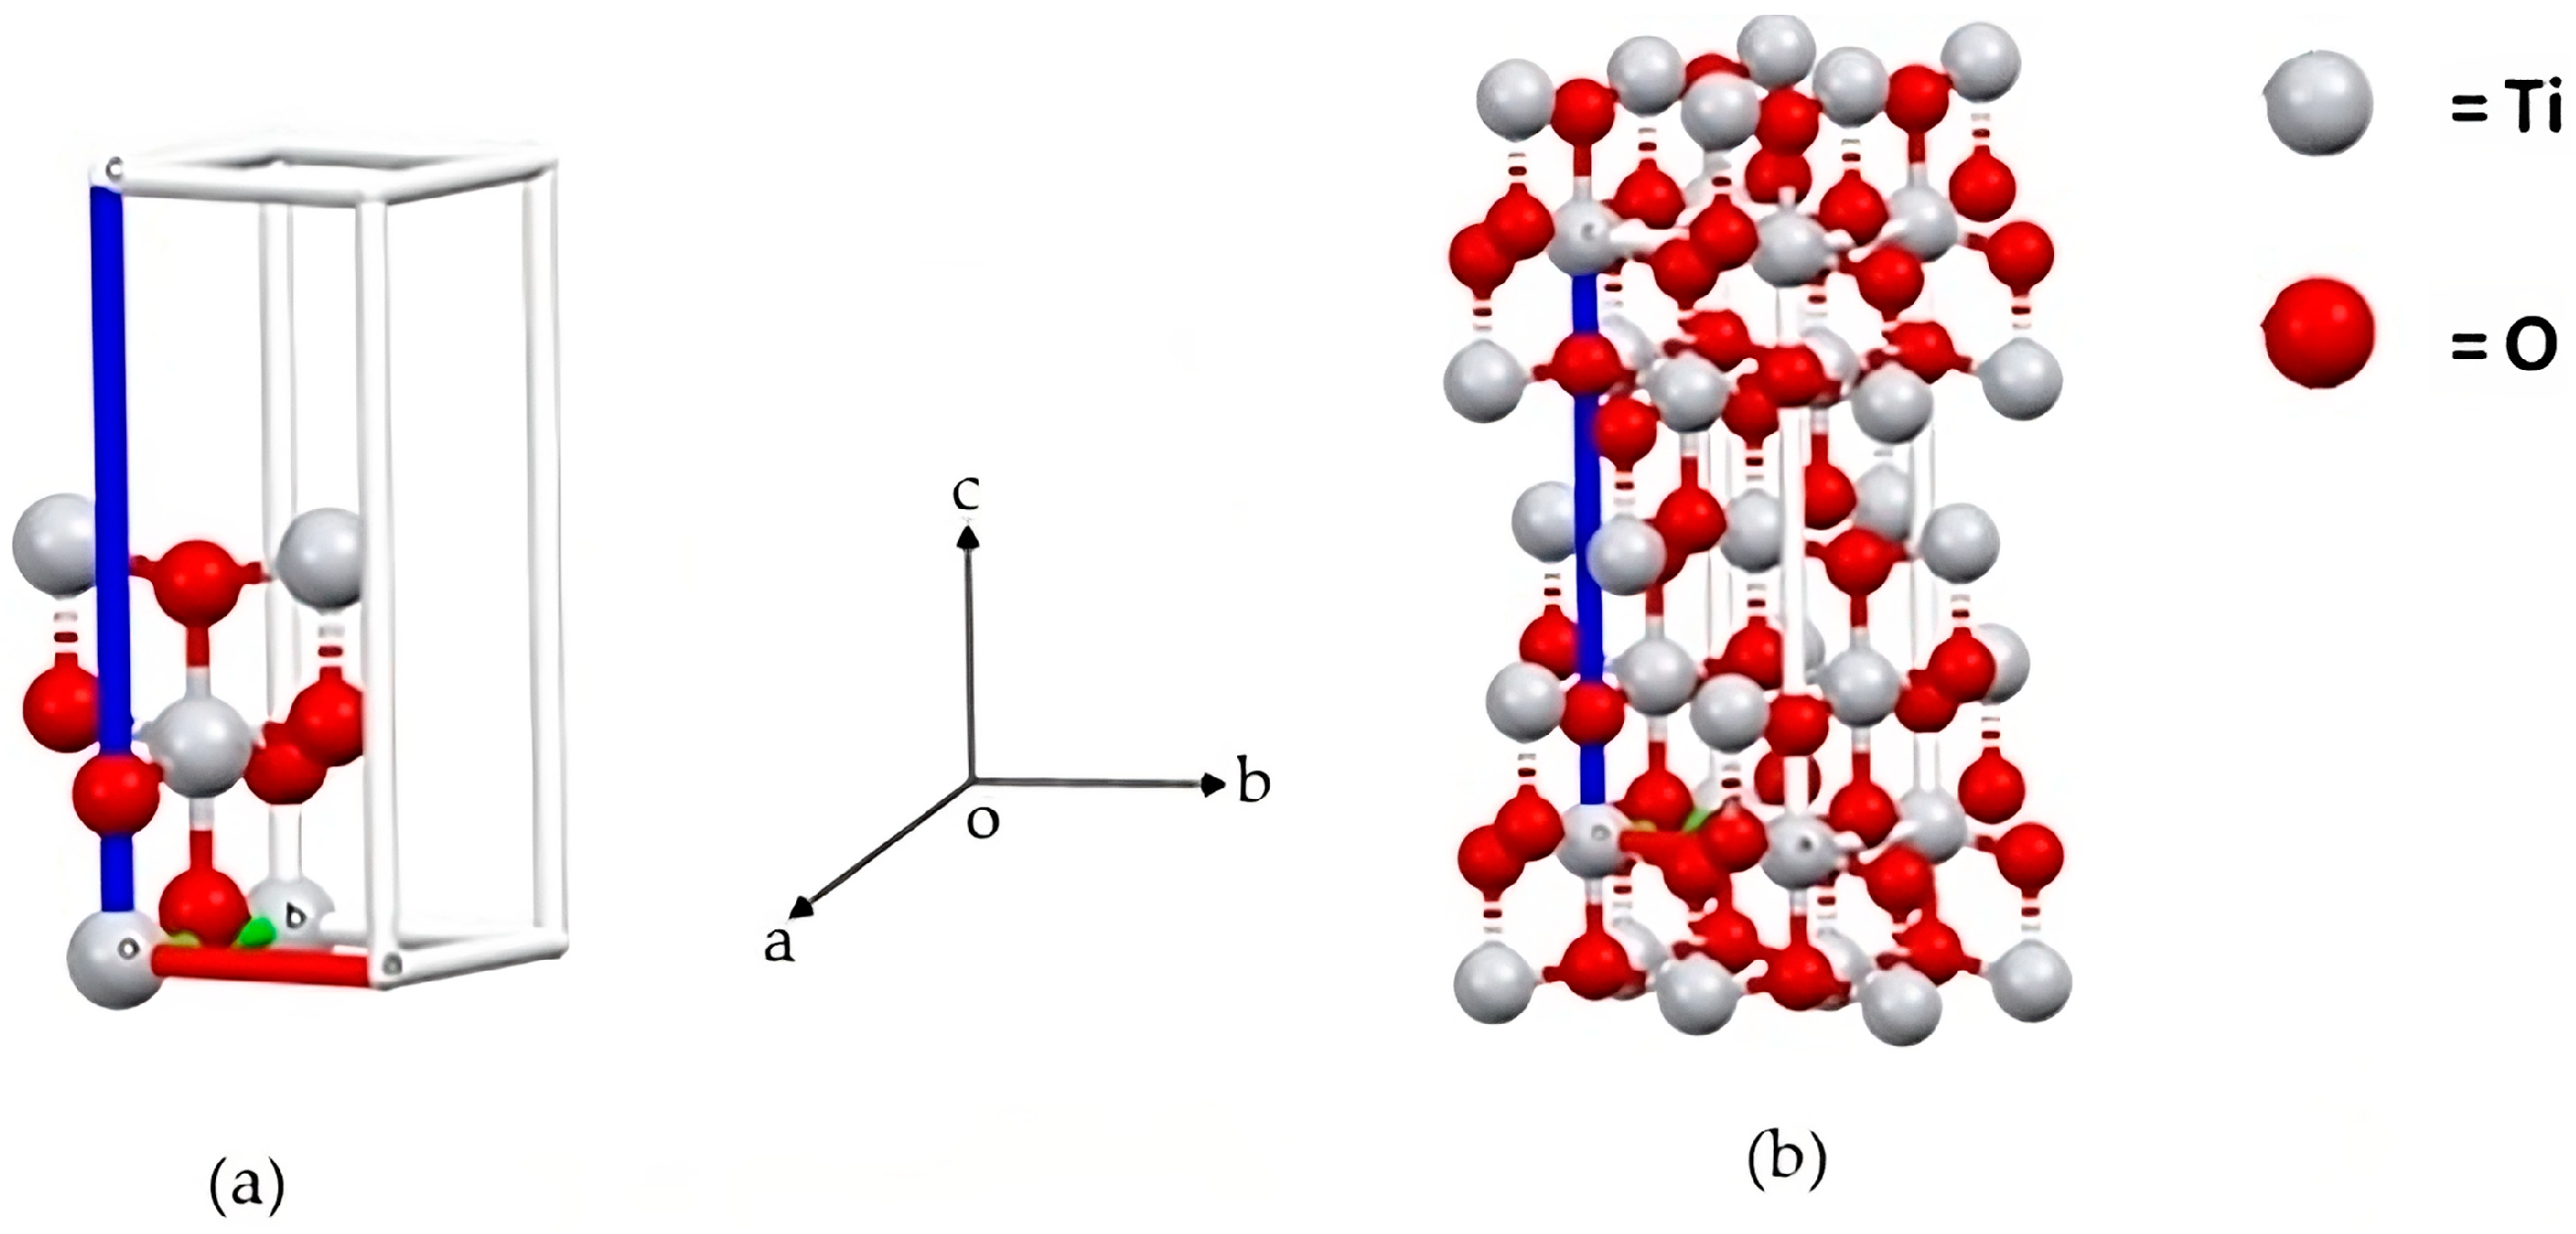
The crystal structure of the TiO2-NPs was determined using the QualX software version 2.0 developed by Altomare et al. [54] and computerised using Mercury software version 4.2.0. Based on the results of the crystal structure analysis, a tetragonal crystal shape was obtained (see Figure 6). This result is in agreement with the research conducted by Opoku et al. [55] which found that anatase TiO2 has a body-centred tetragonal crystal structure, lattice parameters a = b = 3.782 Å and c = 59.502 Å, and an I 41/amd space group.

3.2. Colour Changes of Mangium Wood

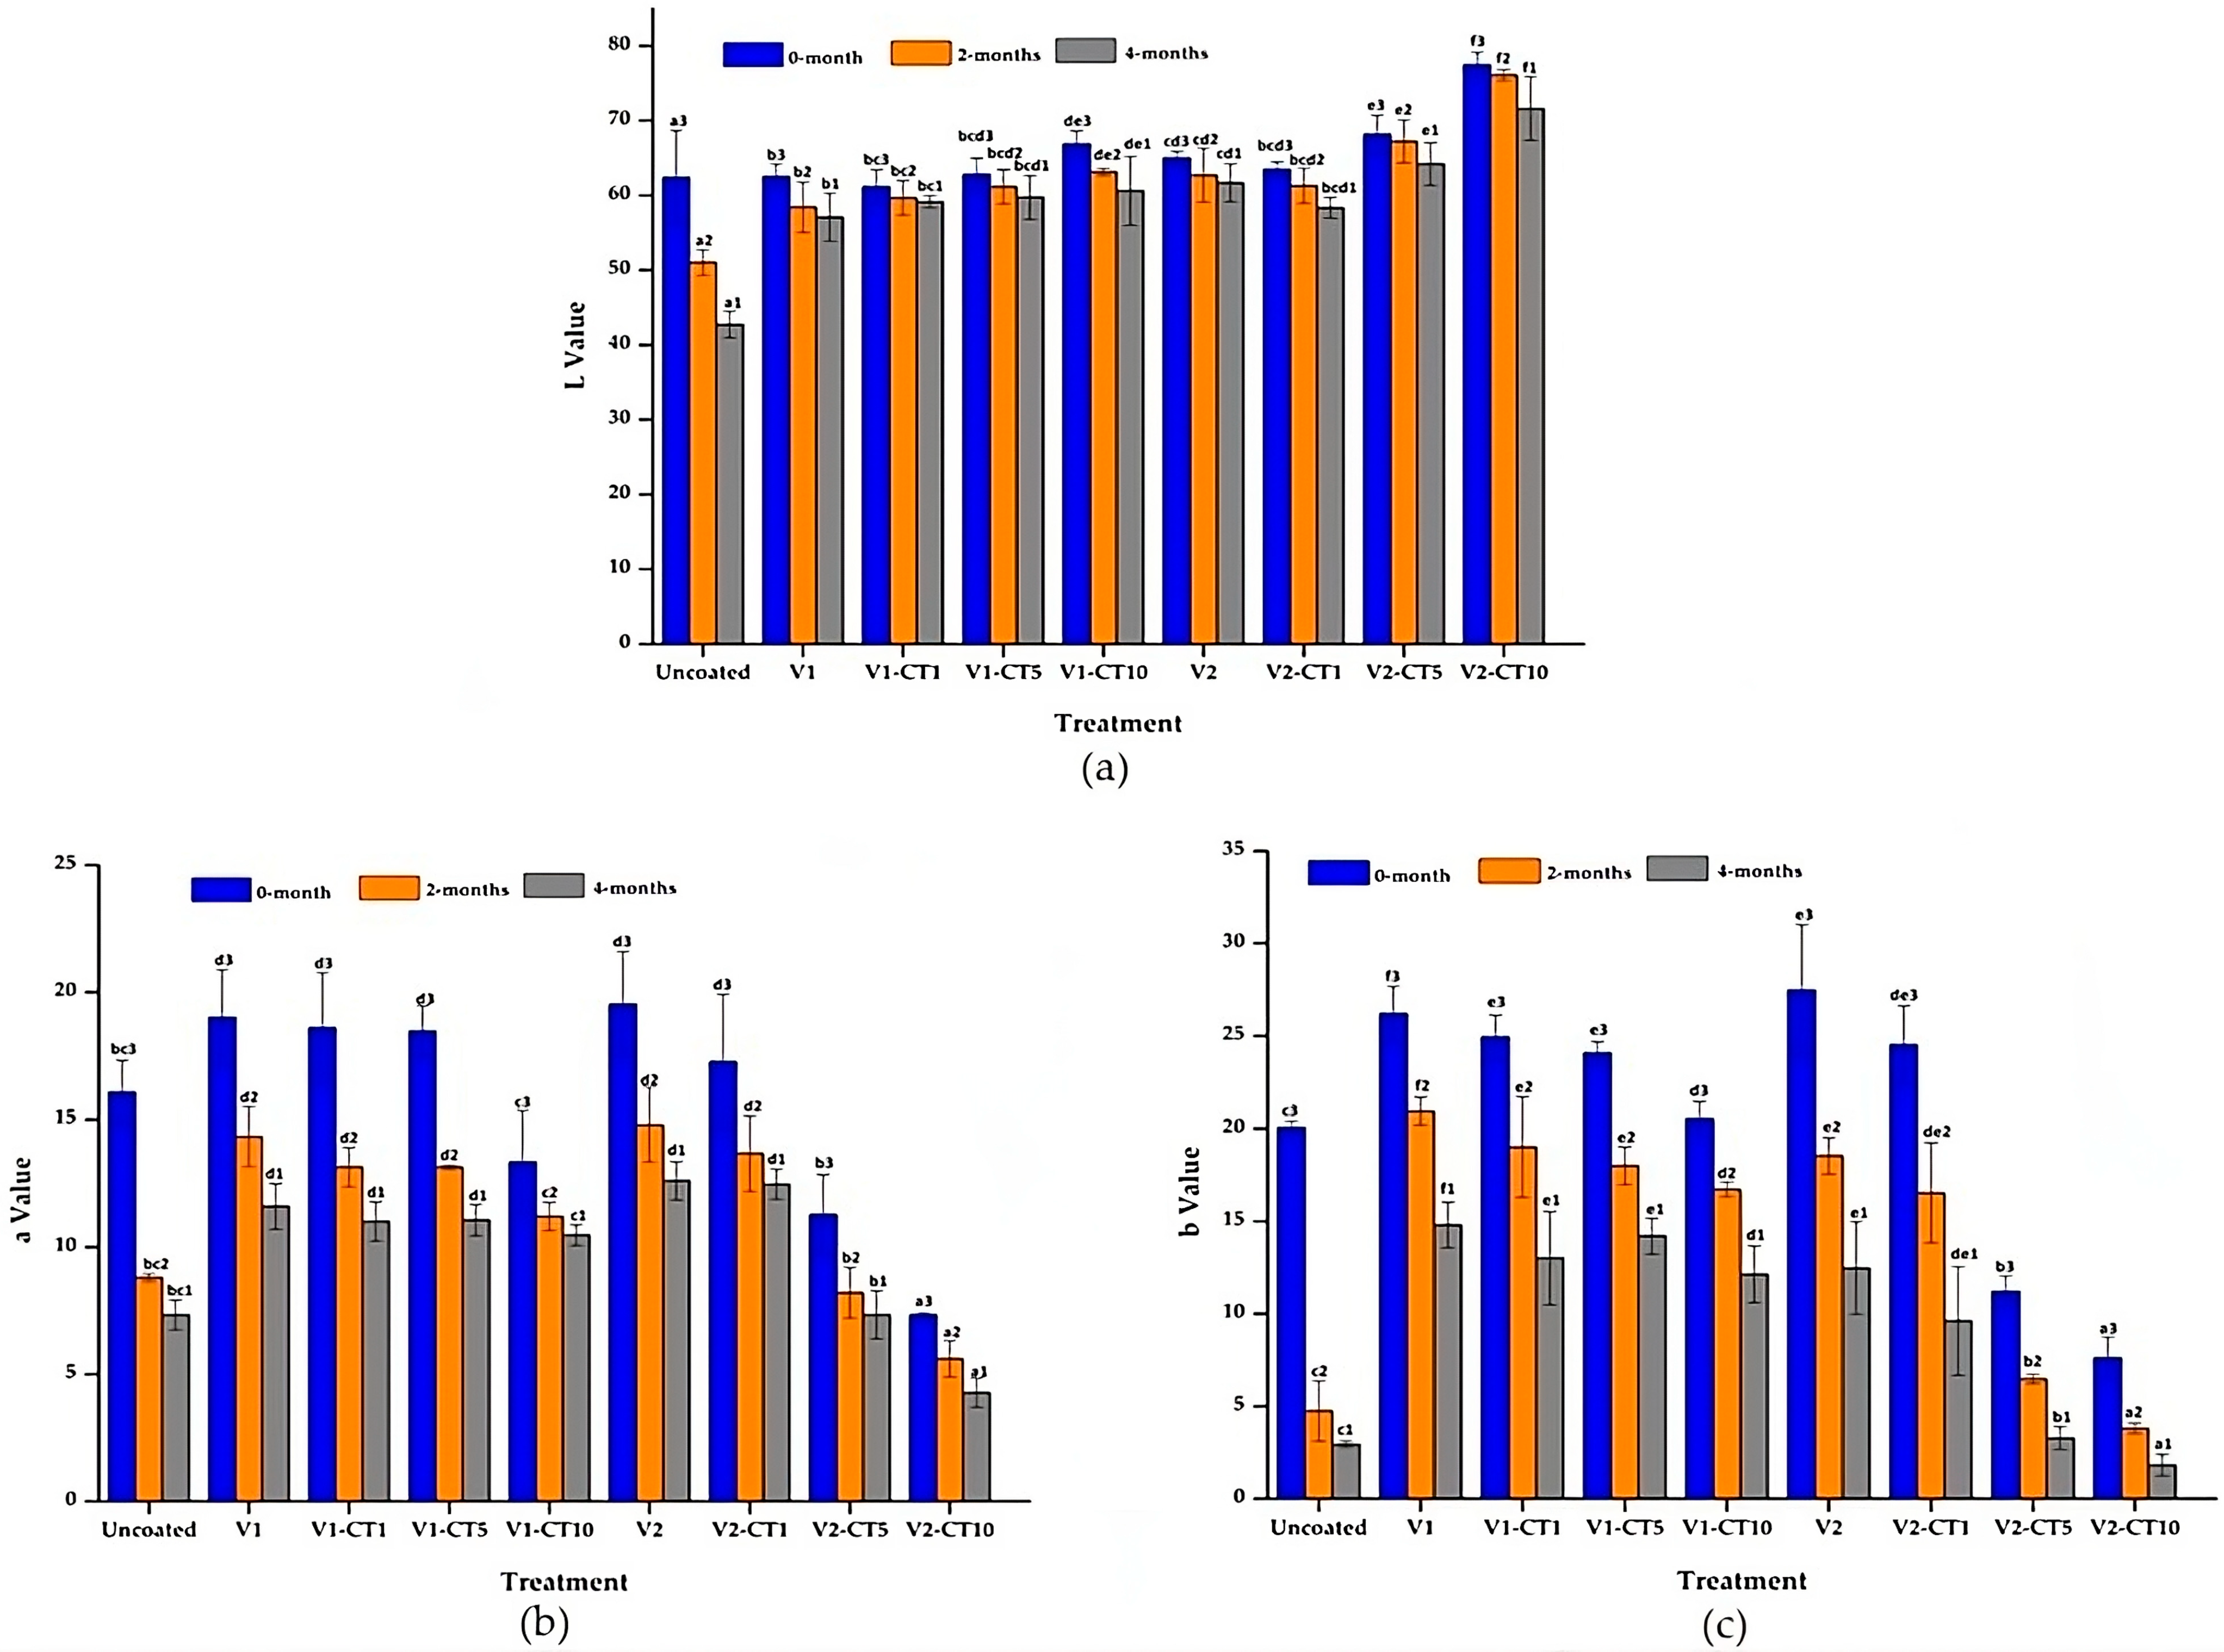
The colour change parameters (L, a, and b) of mangium wood coated with oil- and water-based varnishes (V1, V2), and oil- and water-based varnishes containing concentrations of TiO2-NPs (V1-CT, V2-CT), at each concentration before and after weathering are shown in Figure 7. The L value of mangium wood decreased as the weathering period increased. The L values of uncoated mangium wood after 0, 2, and 4 months were 62, 51, and 43, respectively. The coatings using oil- and water-based varnishes increased the L value. The water-based varnish (V2) exhibited an L value higher than that of the oil-based varnish (V1). Nanocoatings with a 10% concentration of TiO2-NPs (CT10), produced the highest L value at 0, 2, and 4 months compared to the other treatments for both oil- and water-based varnishes. The L values of the V1-CT10-treated coating were 67 (0 months), 63 (2 months), and 61 (4 months), while the L values of the V2-CT10 treated coating were 77 (0 month), 76 (2 months) and 72 (4 months). The a and b values also decreased as the weathering period increased. The a values for the V1-CT10 treatment at 0, 2, and 4 months were 13.3, 11.2, and 10.5, respectively. The a values for the V2-CT10 treatment at 0, 2, and 4 months were 7.3, 5.6 and 4.3, respectively. The b values for the V1-CT10 treatment at 0, 2, and 4 months were 20.5, 16.7, and 12.1, respectively. The b values for the V2-CT10 treatment at 0, 2, and 4 months were 7.6, 3.8, and 1.9, respectively.
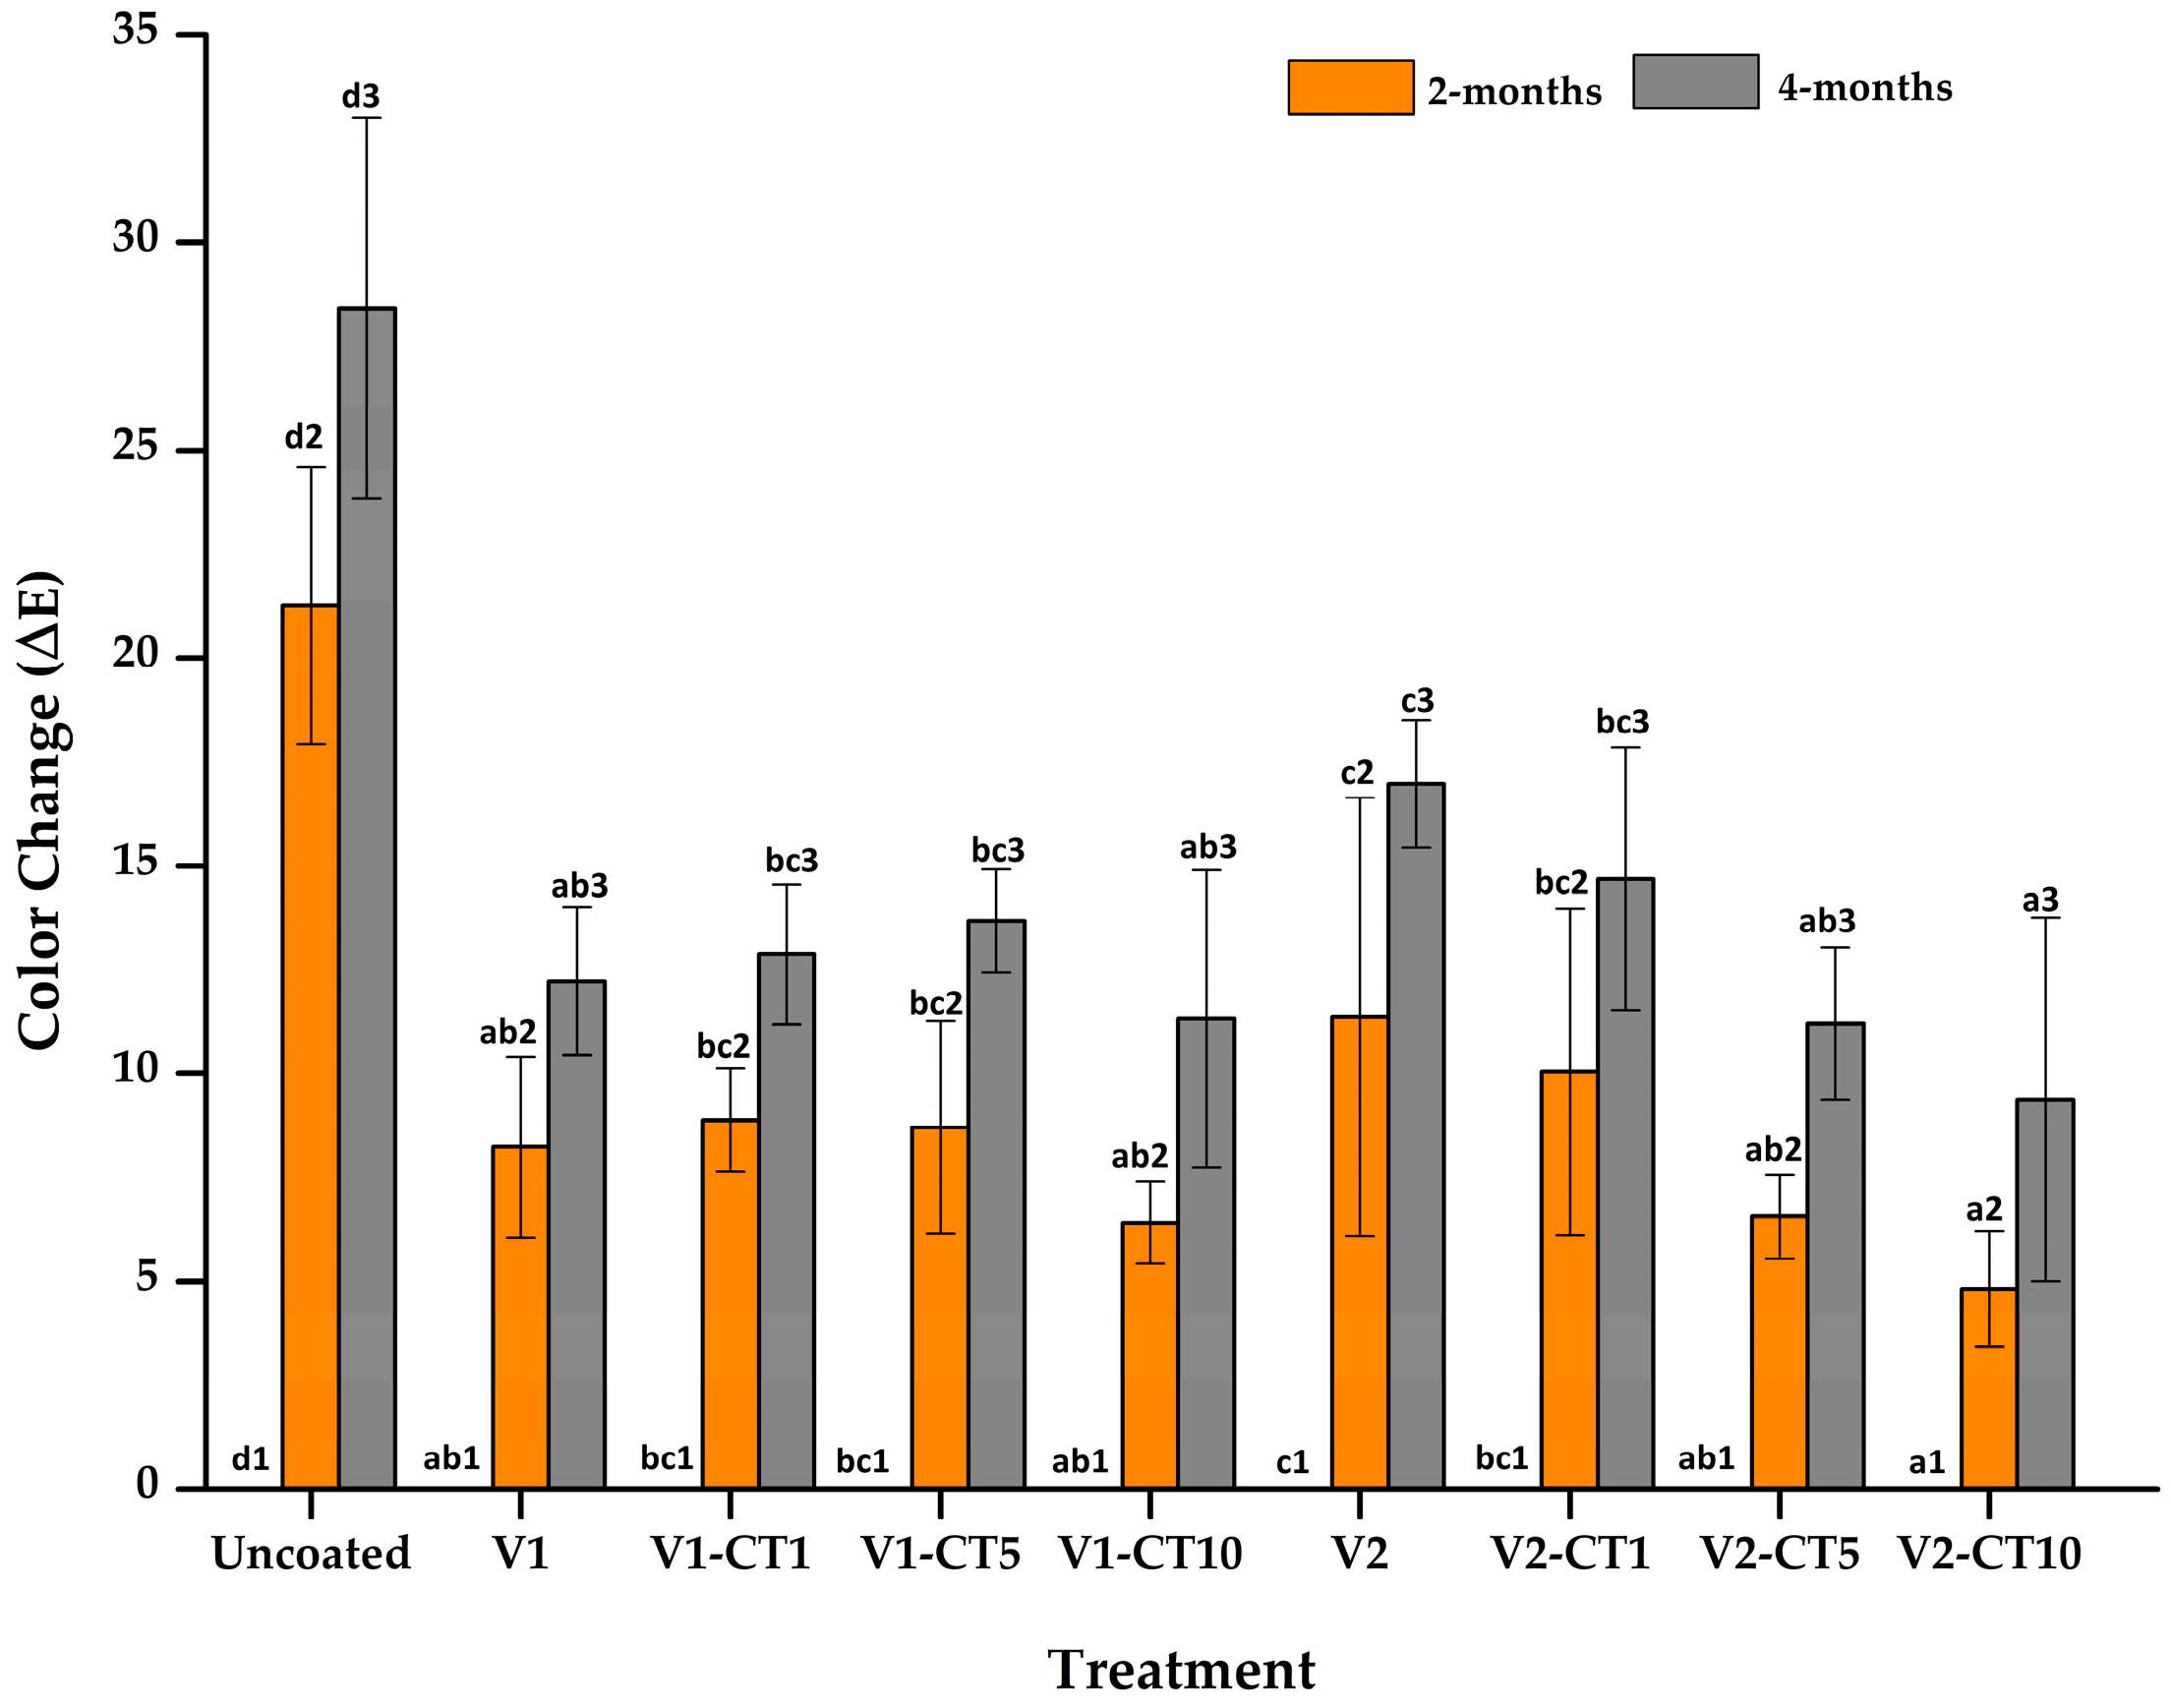
According to the Hunter Lab classification [37], the total colour changes (Figure 8) of mangium wood, both uncoated and coated, were very large ( Δ E > 6). The total colour change increased after the weathering tests. The uncoated mangium wood produced the highest colour change (20.31 after 2 months and 27.47 after 4 months. The mangium wood coated with a nanocoating (CT samples) had a low total colour change, especially at a concentration of 10%. The total colour changes of the V1-CT10 treatment were 6.2 after 2 months and 11.31 after 4 months. Meanwhile, the total colour changes for the V2-CT10 treatment were 5.6 after 2 months and 9.3 after 4 months.
Figure 9 shows the colours of the uncoated and coated wood samples at 0, 2, and 4 months. The colour of the uncoated mangium wood became progressively darker as the weathering period increased. The coating-treated mangium wood exhibited low discolouration during weathering. These results indicate that the varnishes and nanocoating material protected the wood surface from degradation by UV light and rainwater. Similar results were found in previous studies [56,57], where finishing materials protected the wood surface from discolouration.

3.3. Surface Roughness of Mangium Wood

The Ra values of the uncoated and coated mangium wood with the varnish and nanocoating materials are shown in Figure 10. The Ra values of uncoated mangium wood after 0, 2, and 4 months were 13.03, 15.29, and 19.85 µm, respectively. The wood surface became increasingly rough as the weathering period increased. The Ra values of the V1-treated samples were 15.36, 17.26, and 21.18 µm after 0, 2, and 4 months, respectively. Meanwhile, the Ra values of the V2-treated samples were 15.85, 6.87, and 10.56 µm after 0, 2, and 4 months, respectively. The coating treatment decreased the Ra value, indicating that the surface of the mangium wood became smoother. Wood coated with the oil-based varnish had a rougher surface than that coated with the water-based varnish. This may be due to the fact that the oil-based varnish was volatile and non-viscous; consequently, it did not easily form a layer on the surface of the wood.
The addition of TiO2-NPs increased the Ra value in both the oil- and water-based varnishes, which shows that the mangium wood surface became rougher with an increase in the concentration of TiO2-NPs. The Ra values of the V1-CT10 treatment were 2.95, 24.58, and 26.31 µm after 0, 2, and 4 months, respectively, while the Ra values of the V2-CT10 treatment were 11.57, 13.92, and 16.48 µm for 0, 2, and 4 months, respectively. These results agree with the findings of Lu and Hu [58], who reported that the surface roughness of wood increased after its surface was coated with TiO2-NPs.

3.4. Equilibrium Contact Angle and Wettability of Mangum Wood

The equilibrium contact angle values of the coated and uncoated mangium wood samples after 0, 2, and 4 months are shown in Table 2. The equilibrium contact angle tended to decrease with longer weathering periods. Moreover, the equilibrium contact angle increased after the wood surface was coated with the varnish and nanocoating. However, the addition of the TiO2-NPs decreased the equilibrium contact angle. This relationship may be influenced by the surface roughness, as the wood surface became rougher after being treated with the TiO2-NP coating. Čolović et al. [59] stated that rough surfaces produce lower contact angles compared to smoother surfaces. Hence, the equilibrium contact angle decreases with an increase in the Ra value [60]. This is due to the fact that the liquid easily spreads and penetrates the wood.
The K-value is an indicator of the ability of a liquid to spread over and penetrate a wood surface. Darmawan et al. [61] reported that the greater the K-value, the shorter the time required to reach the equilibrium contact angle, and the faster the coating material spreads over and penetrates the wood surface. The K-values of the uncoated and coated mangium wood at 0, 2, and 4 months are shown in Table 2. The results show that the equilibrium contact angle decreased as the K-value increased [60]; in other words, the K-value is inversely proportional to the equilibrium contact angle. Table 2 shows that the K values of mangium wood coated with varnish and nanocoating decreased relative to the uncoated sample. A higher K-value indicates better wettability. The K-value increased after weathering tests for 2 and 4 months, which indicates that the wettability of the samples improved as the weathering tests progressed. Rowel [62] reported that weathering causes hydrophobic lignin to be degraded via continuous exposure to UV light and rainwater, so that the surface becomes more hydrophilic or easily wettable. As shown in Table 2, the mangium wood exhibited hydrophobic properties when coated with oil- and water-based varnishes and those containing TiO2-NPs at a concentration of 1%.

3.5. Microscopic and Macroscopic Mangium Wood

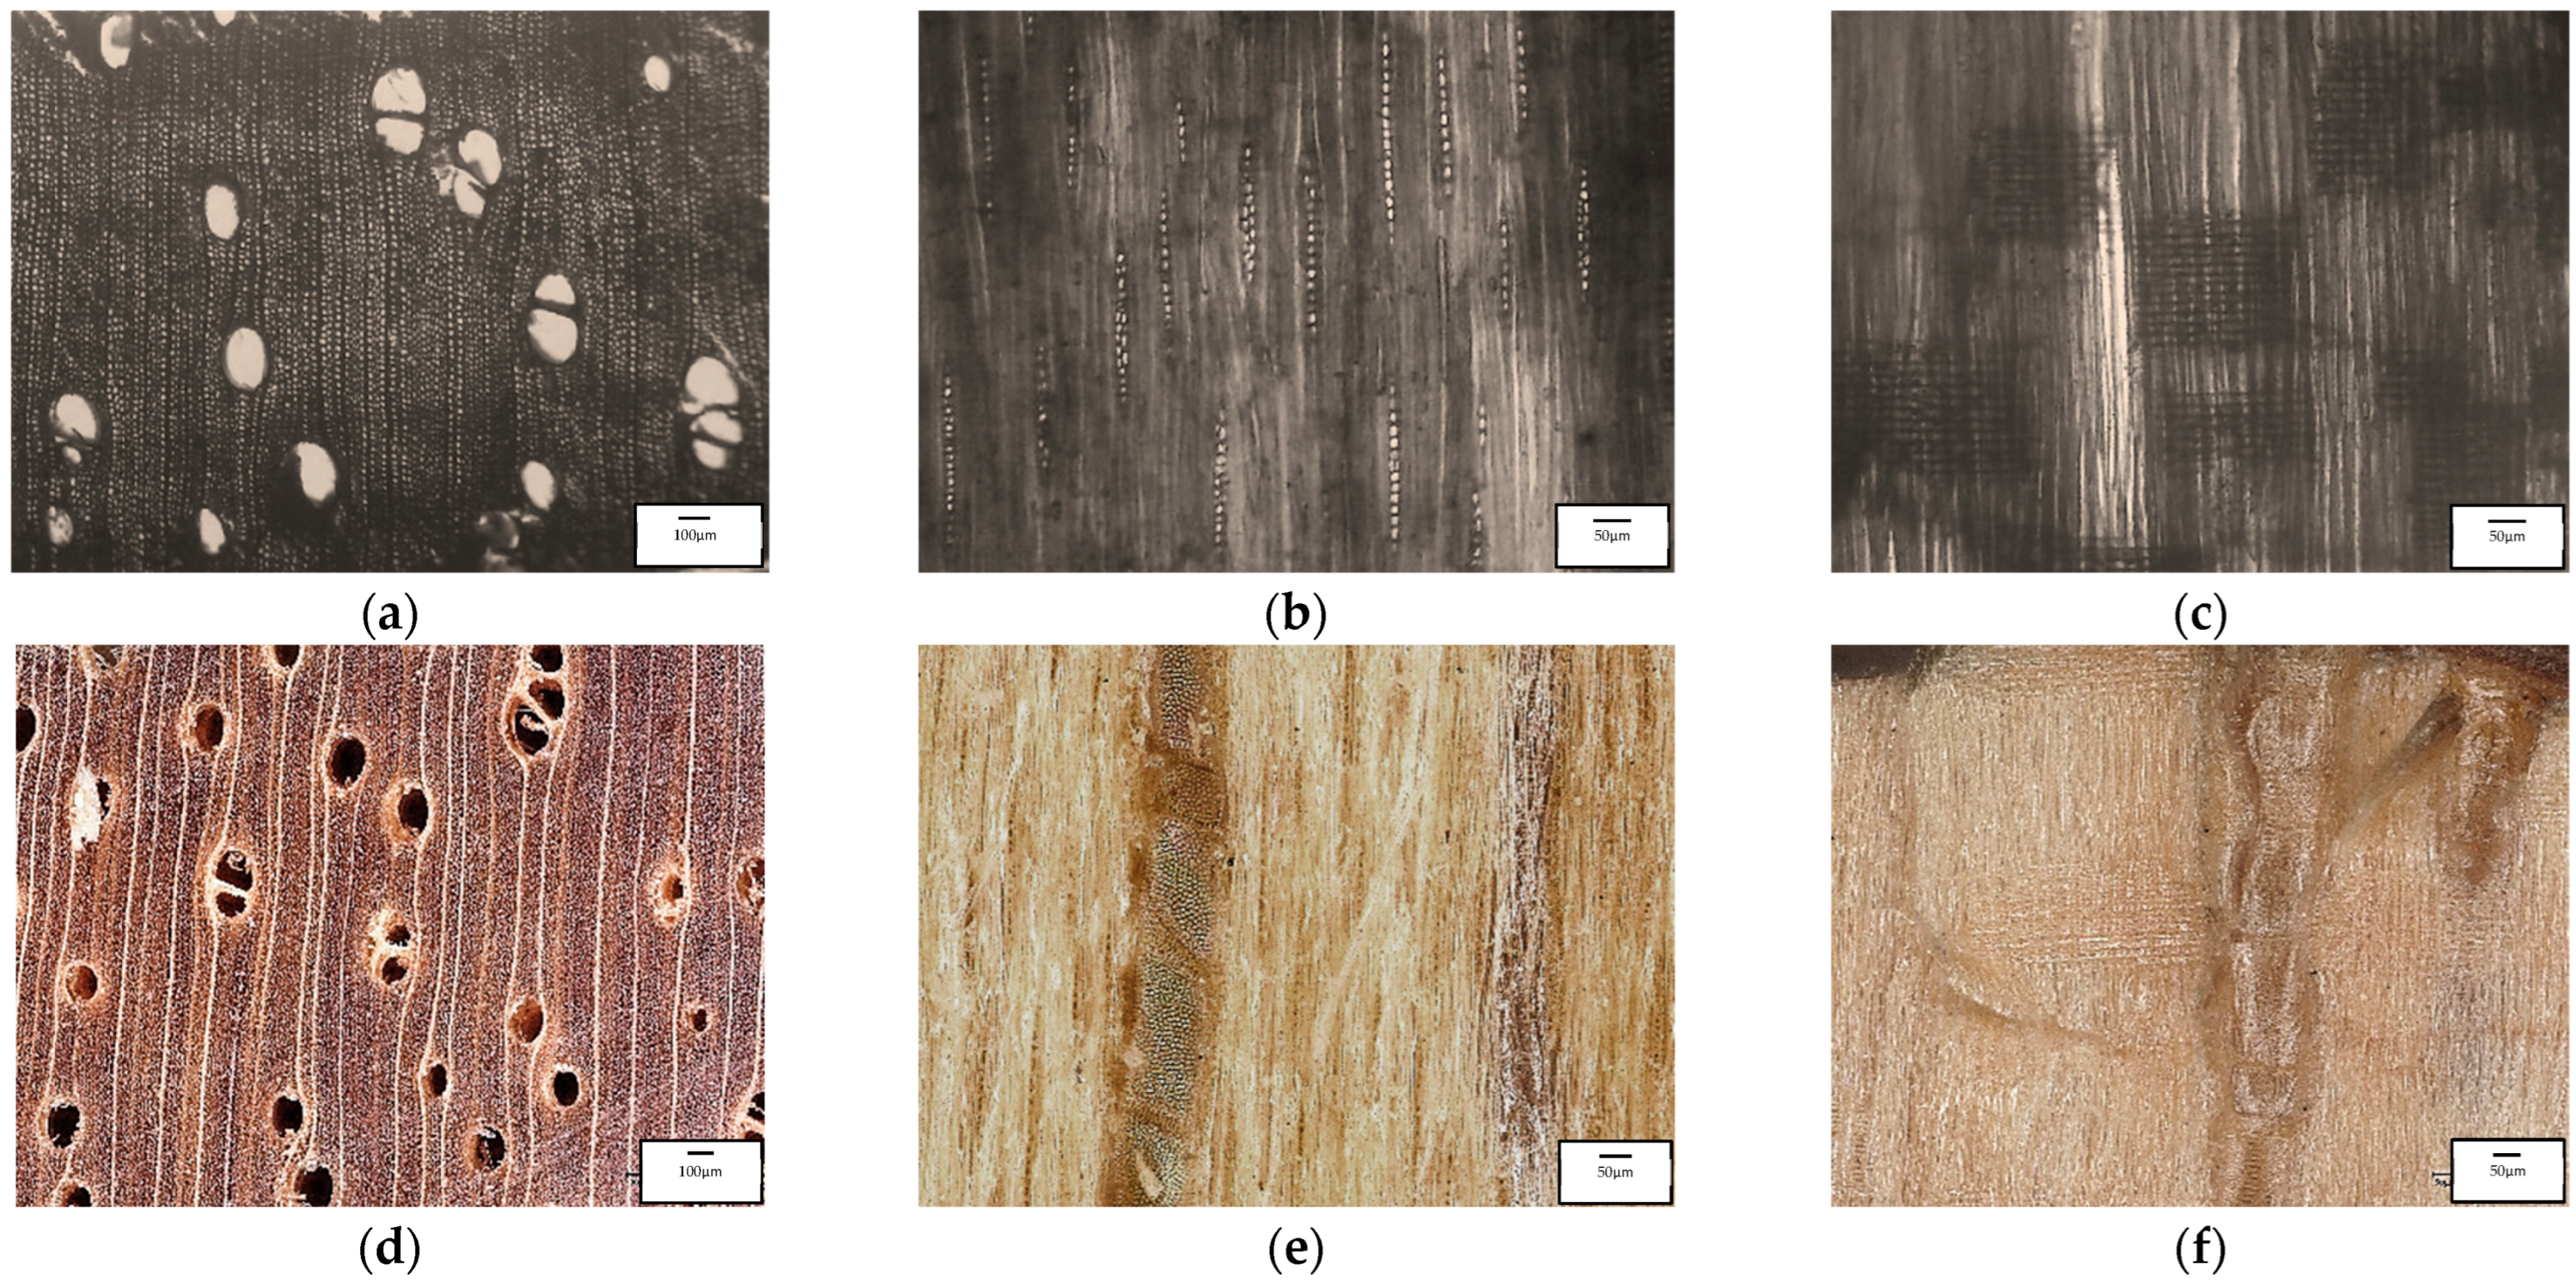
The microscopic and macroscopic anatomical structure of mangium wood is displayed in Figure 11. Mangium wood is a diffuse-porous species that has small vessel element cells and an even vessel distribution throughout an annual ring. Vessels in mangium wood have a solitary arrangement, while some are combined together in 2–3 vessels. The tangential solitary vessel diameter of mangium wood is approximately 166.1 µm, whereas the pore distribution is 4–6 vessels/mm2. Mangium wood has simple perforation plates. Intervessel pits in mangium wood are arranged in an alternate intervessel pit pattern, with a size of approximately 6.4 µm in vertical diameter. Rays of mangium wood are usually 1–2 seriate but are sometimes 1–3 seriate depending on the mangium wood sample observed. The axial parenchyma is not very abundant; it can sometimes only be identified by a pale colour around the vessel. In the radial section, a radius composition consisting of procumbent and upright cells can be observed.
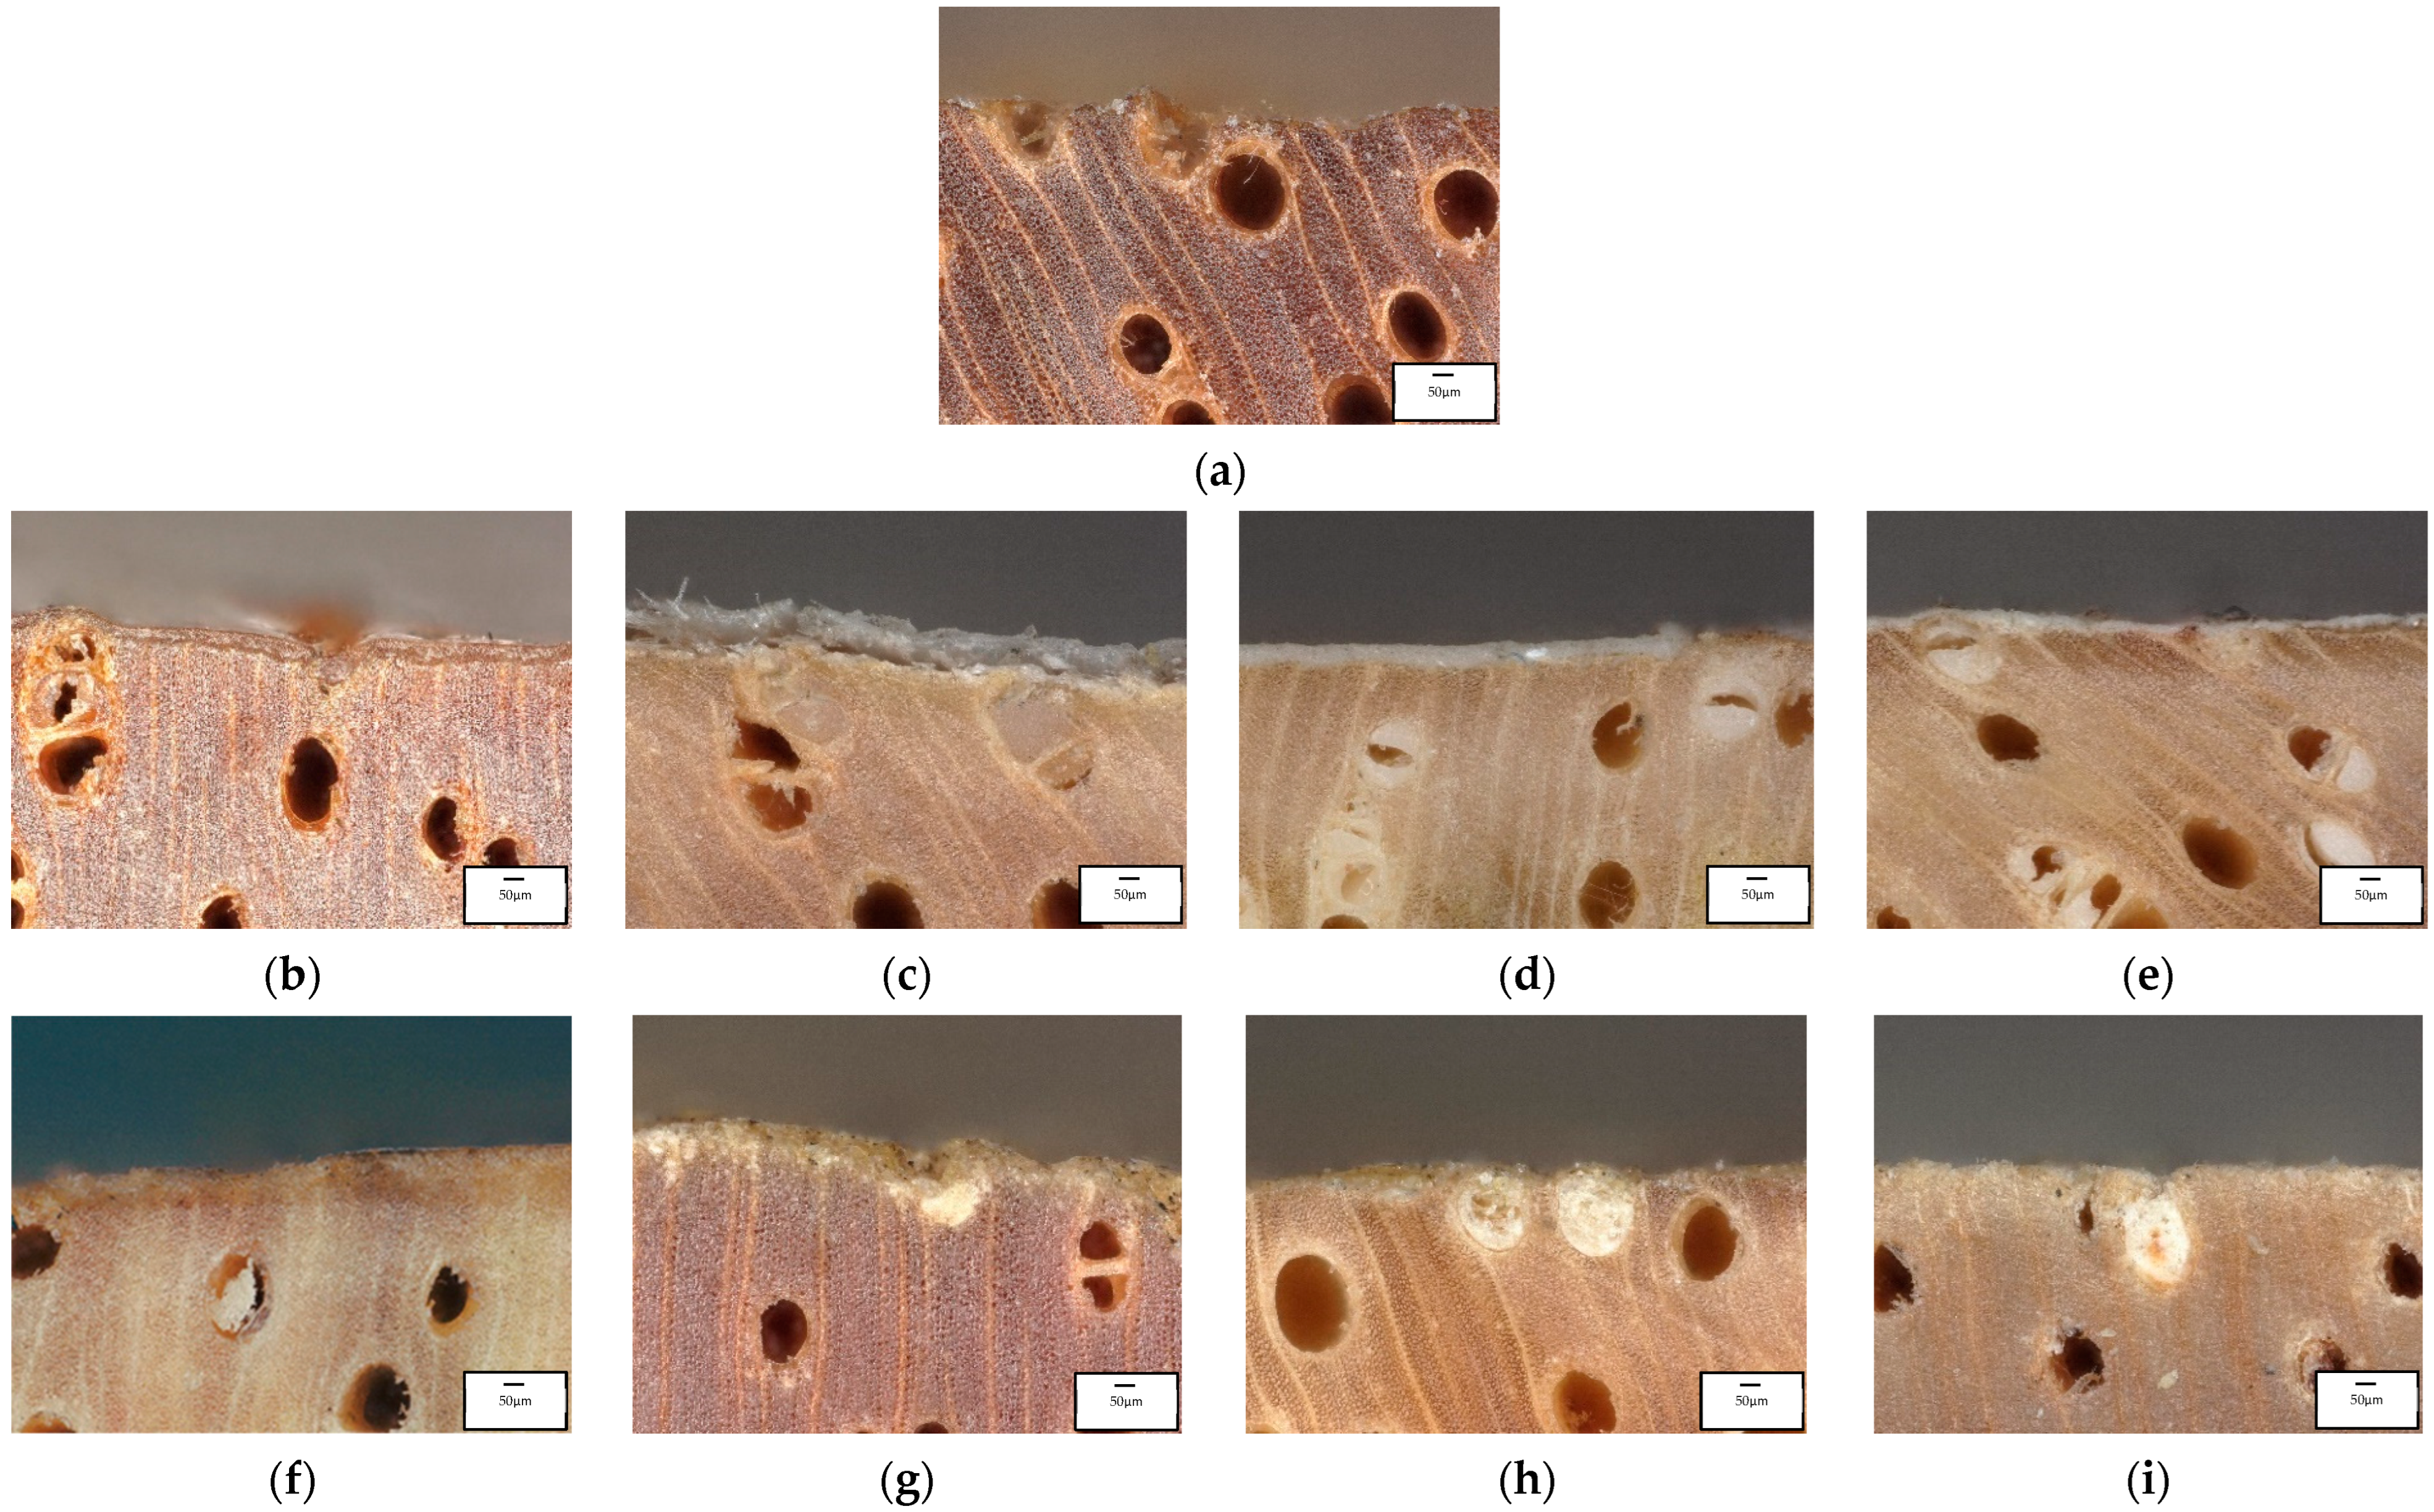
The macroscopic results for the uncoated and coated wood are shown in Figure 12. Figure 12a shows a macroscopic image (100×) of the uncoated mangium sample. Figure 12b–e show the coating treatment comprising a water-based varnish material and different concentrations of TiO2-NPs for the V2, V2-CT1, V2-CT5, and V2-CT10 coatings, respectively. The addition of the TiO2-NPs is evidenced by a thin layer of white coating material on the surface of the wood in Figure 12c–e. This white coating possibly indicates the presence of a layer of TiO2 as a coating material, as reported by Svora et al. [63]. Figure 12f–i show the coating treatment comprising an oil-based varnish material and different concentrations of TiO2-NPs for the V1, V1-CT1, V1-CT5, and V1-CT10 coatings, respectively. In these images, the coating material does not appear to coat the surface of the wood but appears to be absorbed directly into the wood. After the addition of the TiO2-NPs to the water-based and oil-based varnish coating materials, the coating material and TiO2-NPs penetrate the wood and fill in the pores. Based on the microscopic and macroscopic results, only a small number of features can be determined, such as the size of the pore diameter, intervessel pits, visible nanocoating deposits in the pores, and nanocoating layer on the surface of the wood. In addition to the presence of deposits or layers of TiO2-NPs and coating materials, Figure 12 also shows that the wood samples treated with nanocoating materials and tested for weathering for four months do not exhibit damage to their surfaces.

3.6. Degradation Ability of MB Compound

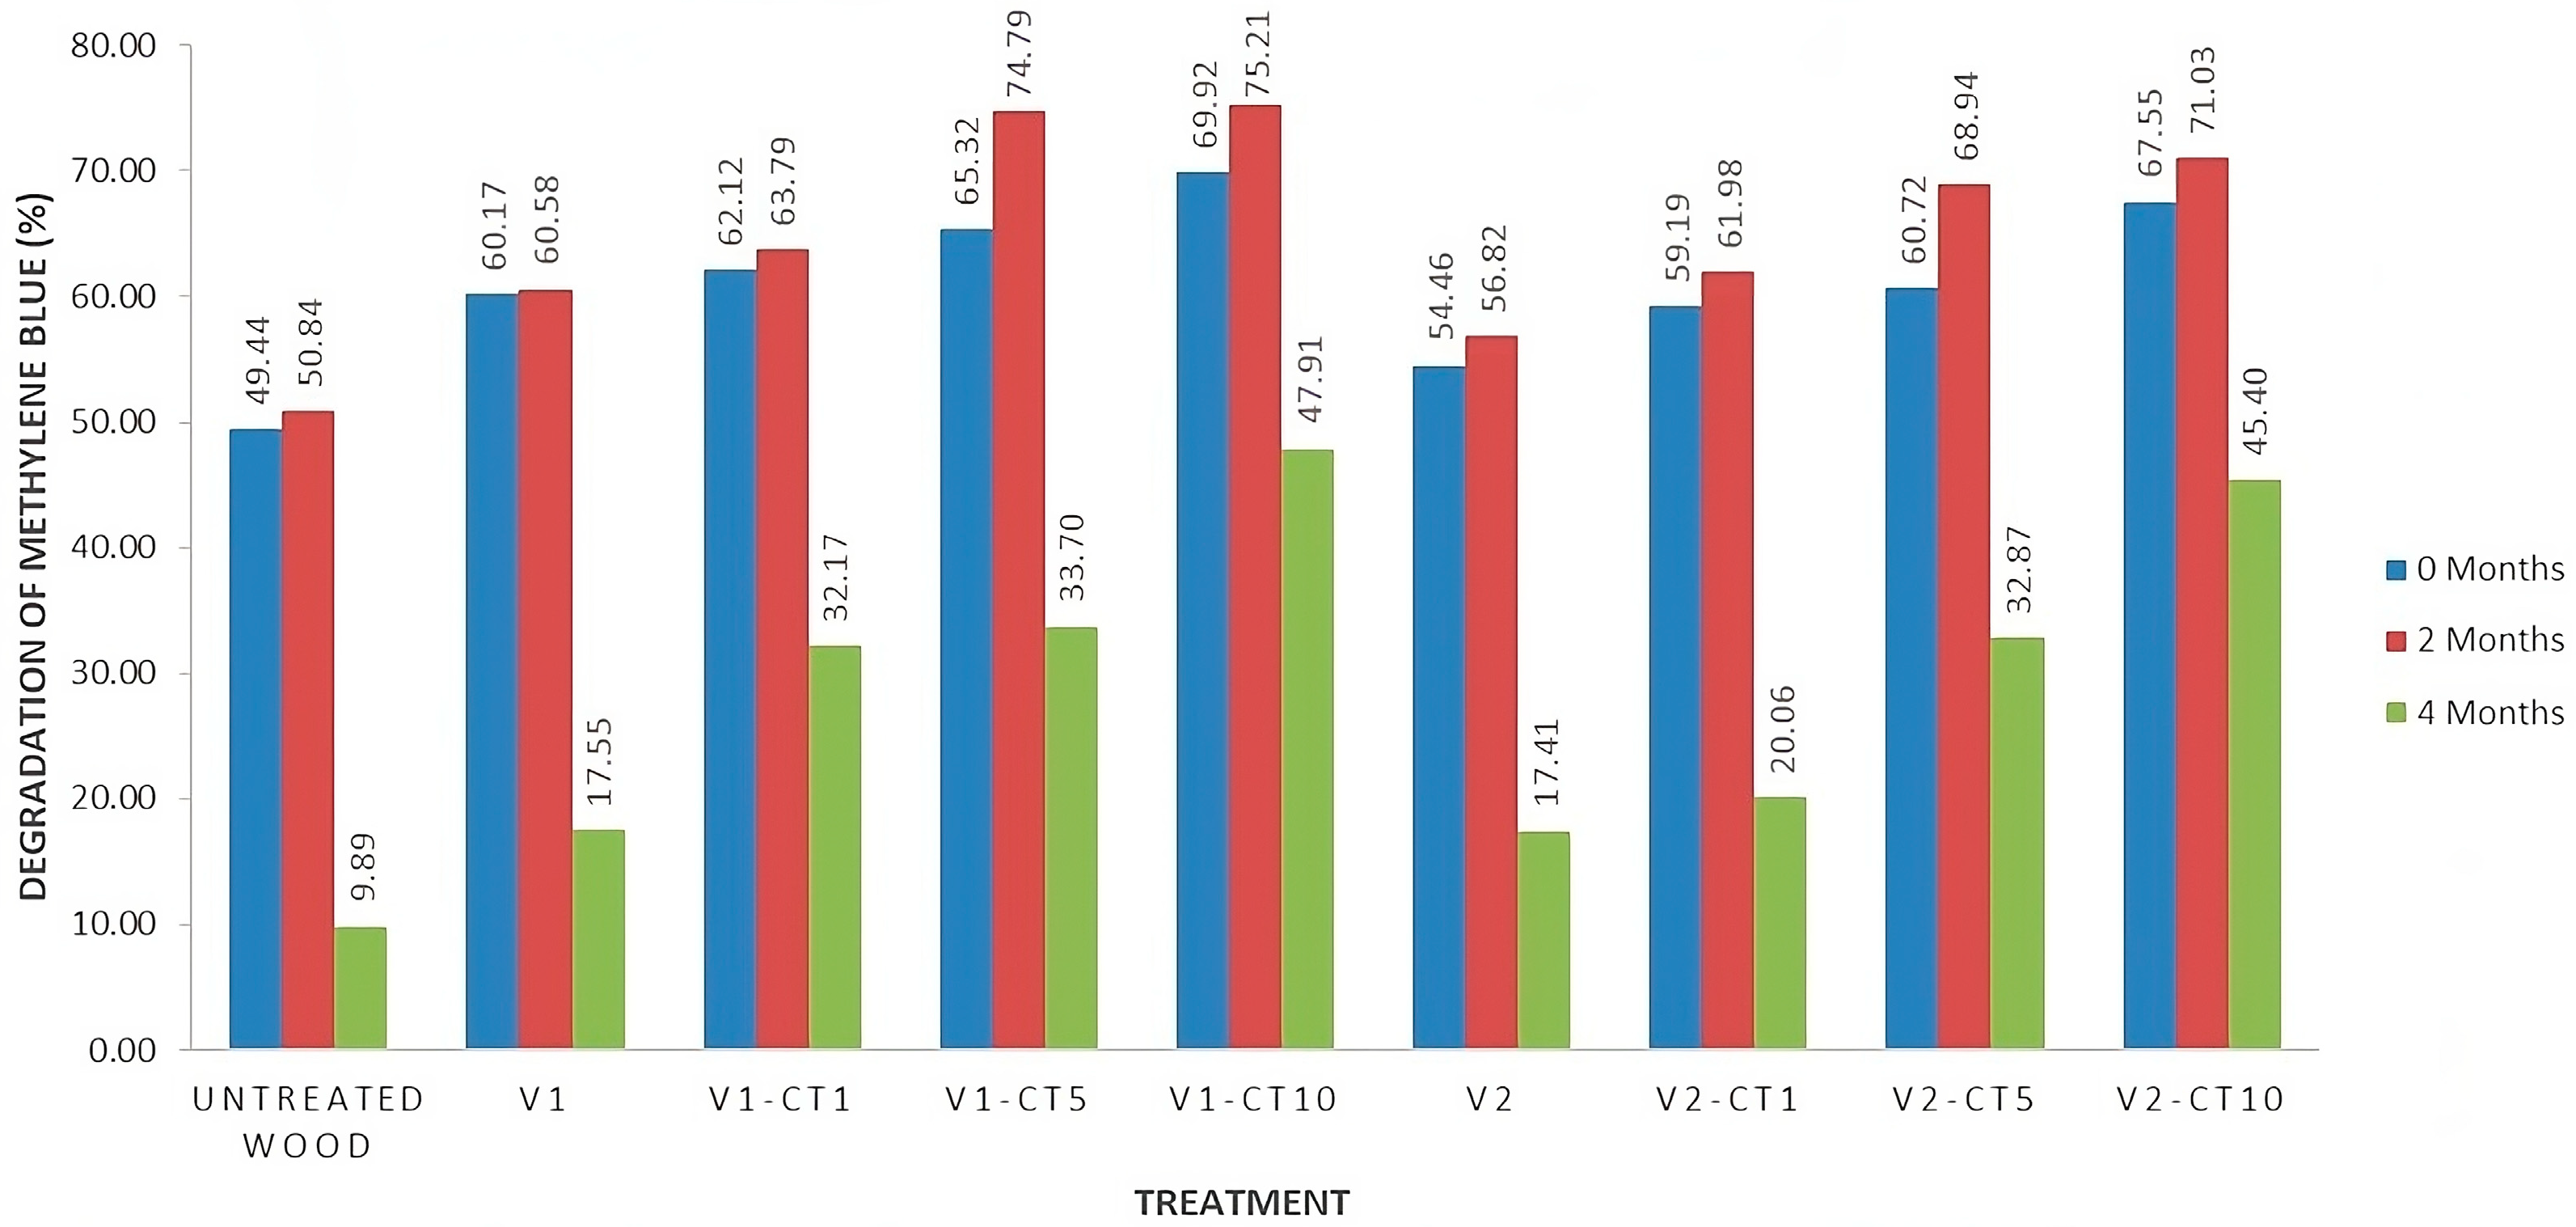
An investigation into the effectiveness of photocatalyst activity with varying amounts of active compounds of TiO2-NPs was carried out by testing the degradation of MB (Figure 13). MB is highly stable and requires a long time to degrade in conditions without catalysts [64]. The result obtained in Figure 11 indicates that the nanocoating sample containing TiO2-NPs had a higher photocatalyst activity compared to that of the uncoated wood and V1- and V2-coated wood samples. The samples with the highest percentage MB degradation values were the V1-CT10 and V2-CT10 samples subject to two months of weathering, at 75.21% and 71.03%, respectively. This indicates that the concentration of the active compound TiO2-NPs was positively correlated with the photocatalyst activity to degrade MB. These results are similar to and corroborate the research conducted by Akkuş et al. [65].

3.7. Evaluation of the Energy Efficiency of Coating Materials in Degrading MB Compounds

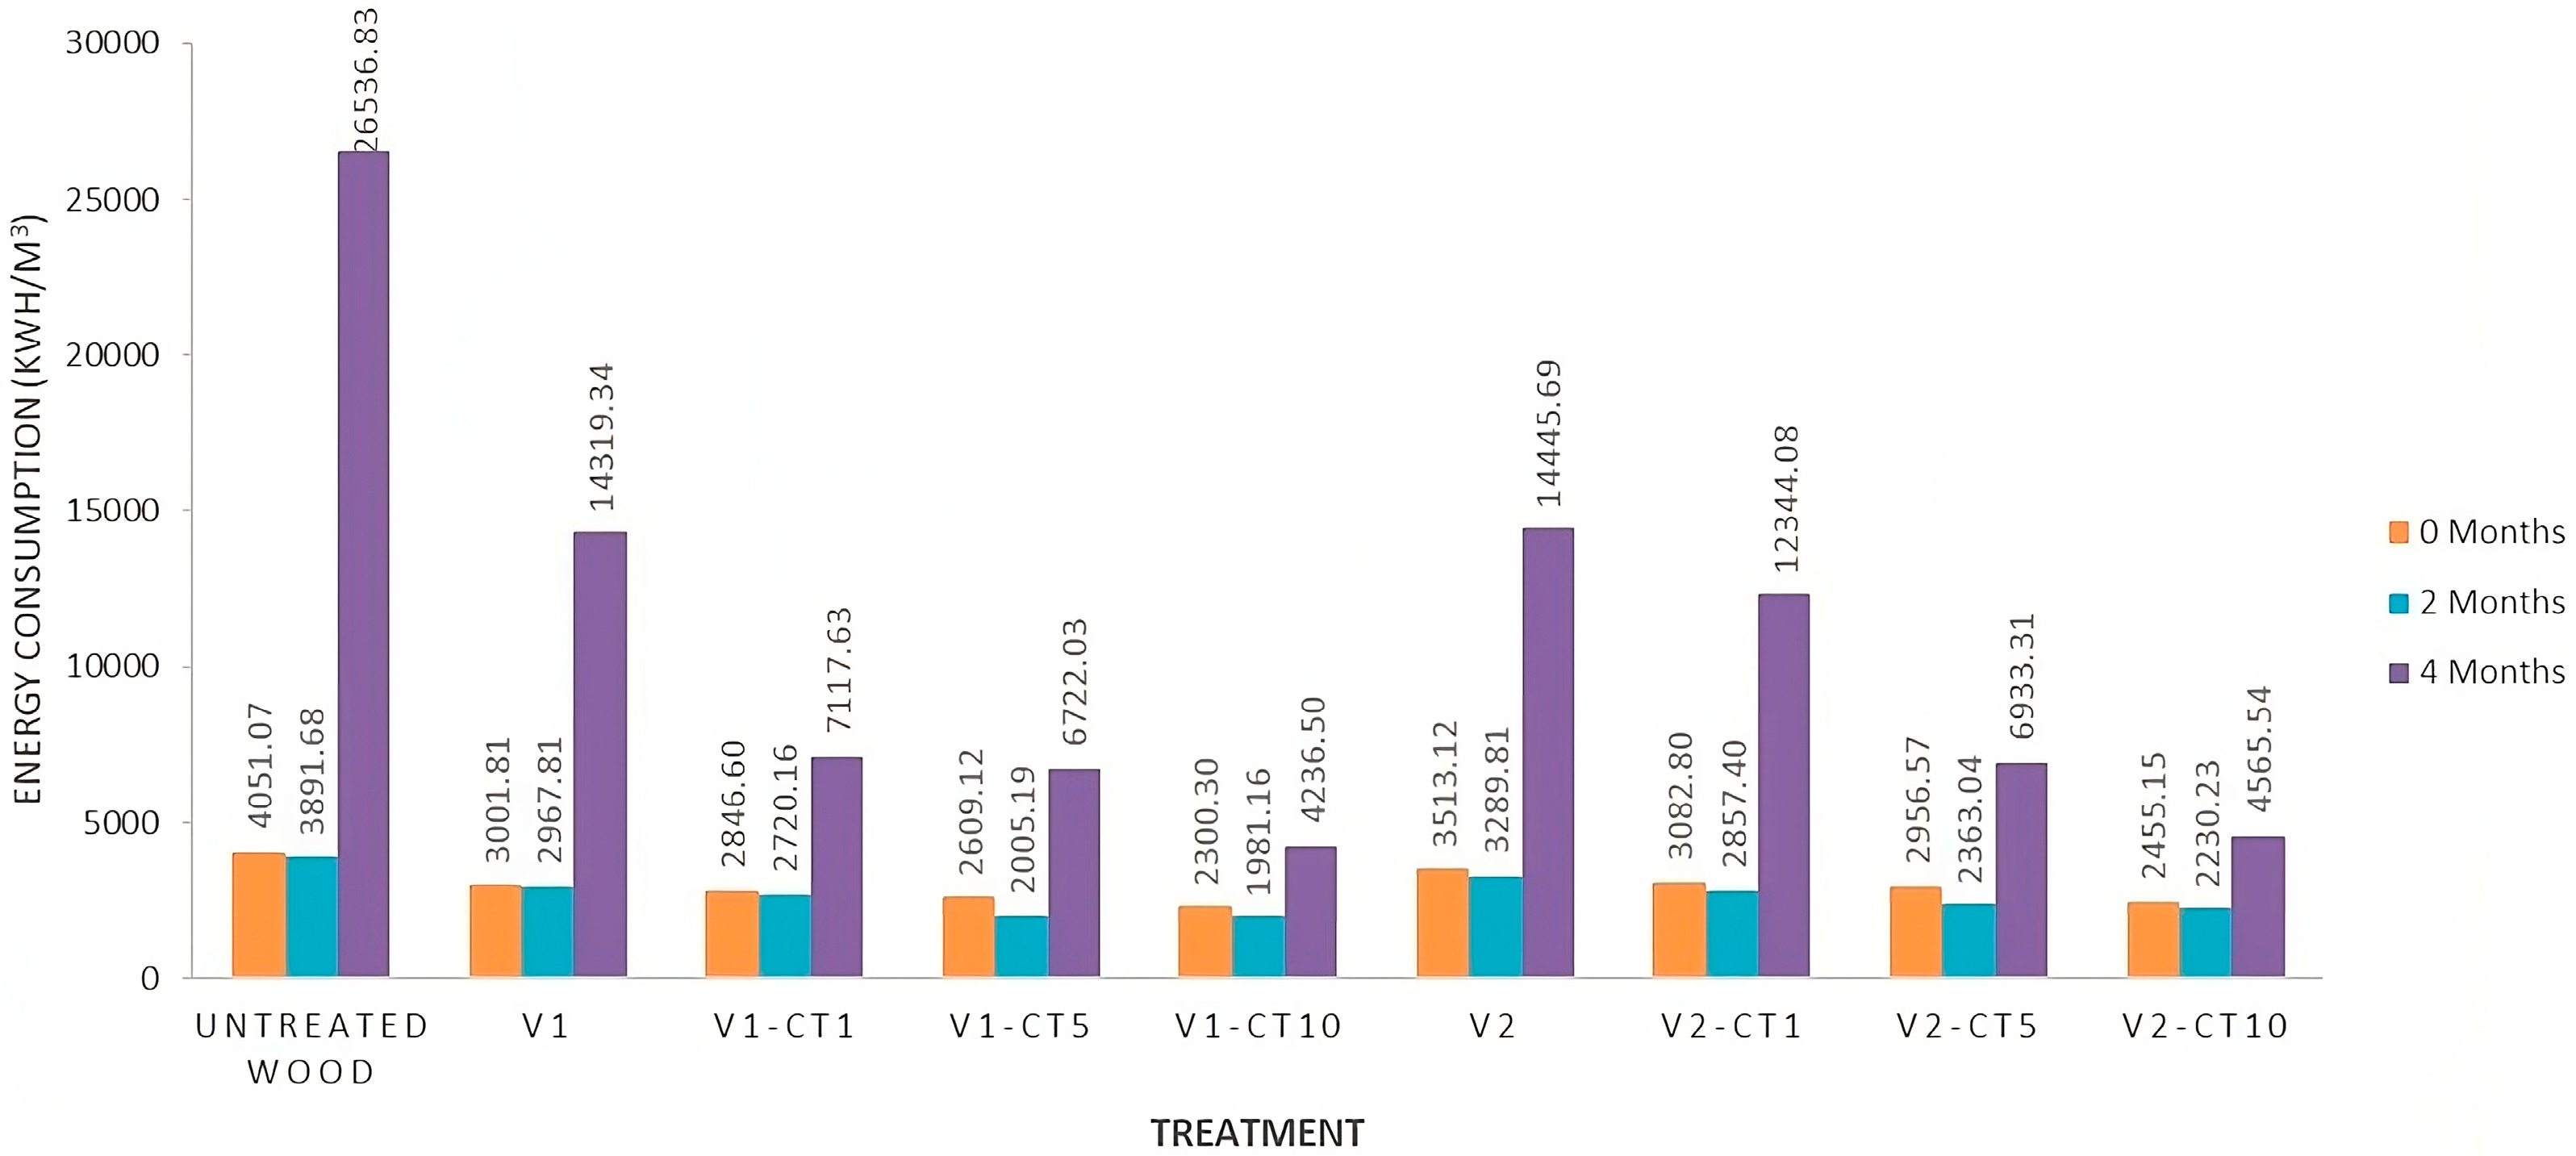
Analysis of the energy consumption EEO of the photocatalyst activity process indicated fluctuations which decreased in the second month and increased in the fourth month for all samples. This may have occurred due to the fact that the degradation percentage was inversely proportional to the energy consumption level. A high degradation percentage indicated that the MB degradation was high in the same volume of MB solution and UV radiation time, as in other sample treatments with a lower degradation percentage. Thus, to achieve the same level of degradation, more energy is required [66].
The results of energy consumption calculations on the activity of nanocoating photocatalysts based on anatase TiO2-NPs (see Figure 14) had a greater value in all treatments compared with the results of the research conducted by Rahayu et al. [20]. The authors reported that the energy consumption at the same concentration value as a polymer nanocomposite material (PNC) were 1166.68 kWh m−3 for TiO2-NPs, 2030.65 kWh m−3 for a PNC with a TiO2-NP concentration of 1%, and 1585.59 kWh m−3 for a PNC with a TiO2-NP concentration of 5%. The active ingredient TiO2-NP was mixed with water- and oil-based coating materials in a liquid phase that prevented it from interacting with the surface of the MB substrate molecules [67]. Varma et al. [68] reported that the energy consumption of bulk TiO2 anatase was 3000 kWh m−3. The energy consumption of the nanocoating in all of the treated samples was lower at 0 and 2 months. This could be due to the fact that TiO2 was used as the active ingredient in the nanocoating formulation, and it led to a nanoparticle with a large surface area [69]. Thus, it had a higher photocatalytic activity than its bulk phase [70] and could reduce the activation energy to degrade the MB substrate [71].

3.8. FTIR Testing and Functional Group Absorption Band Ratio Index Calculation

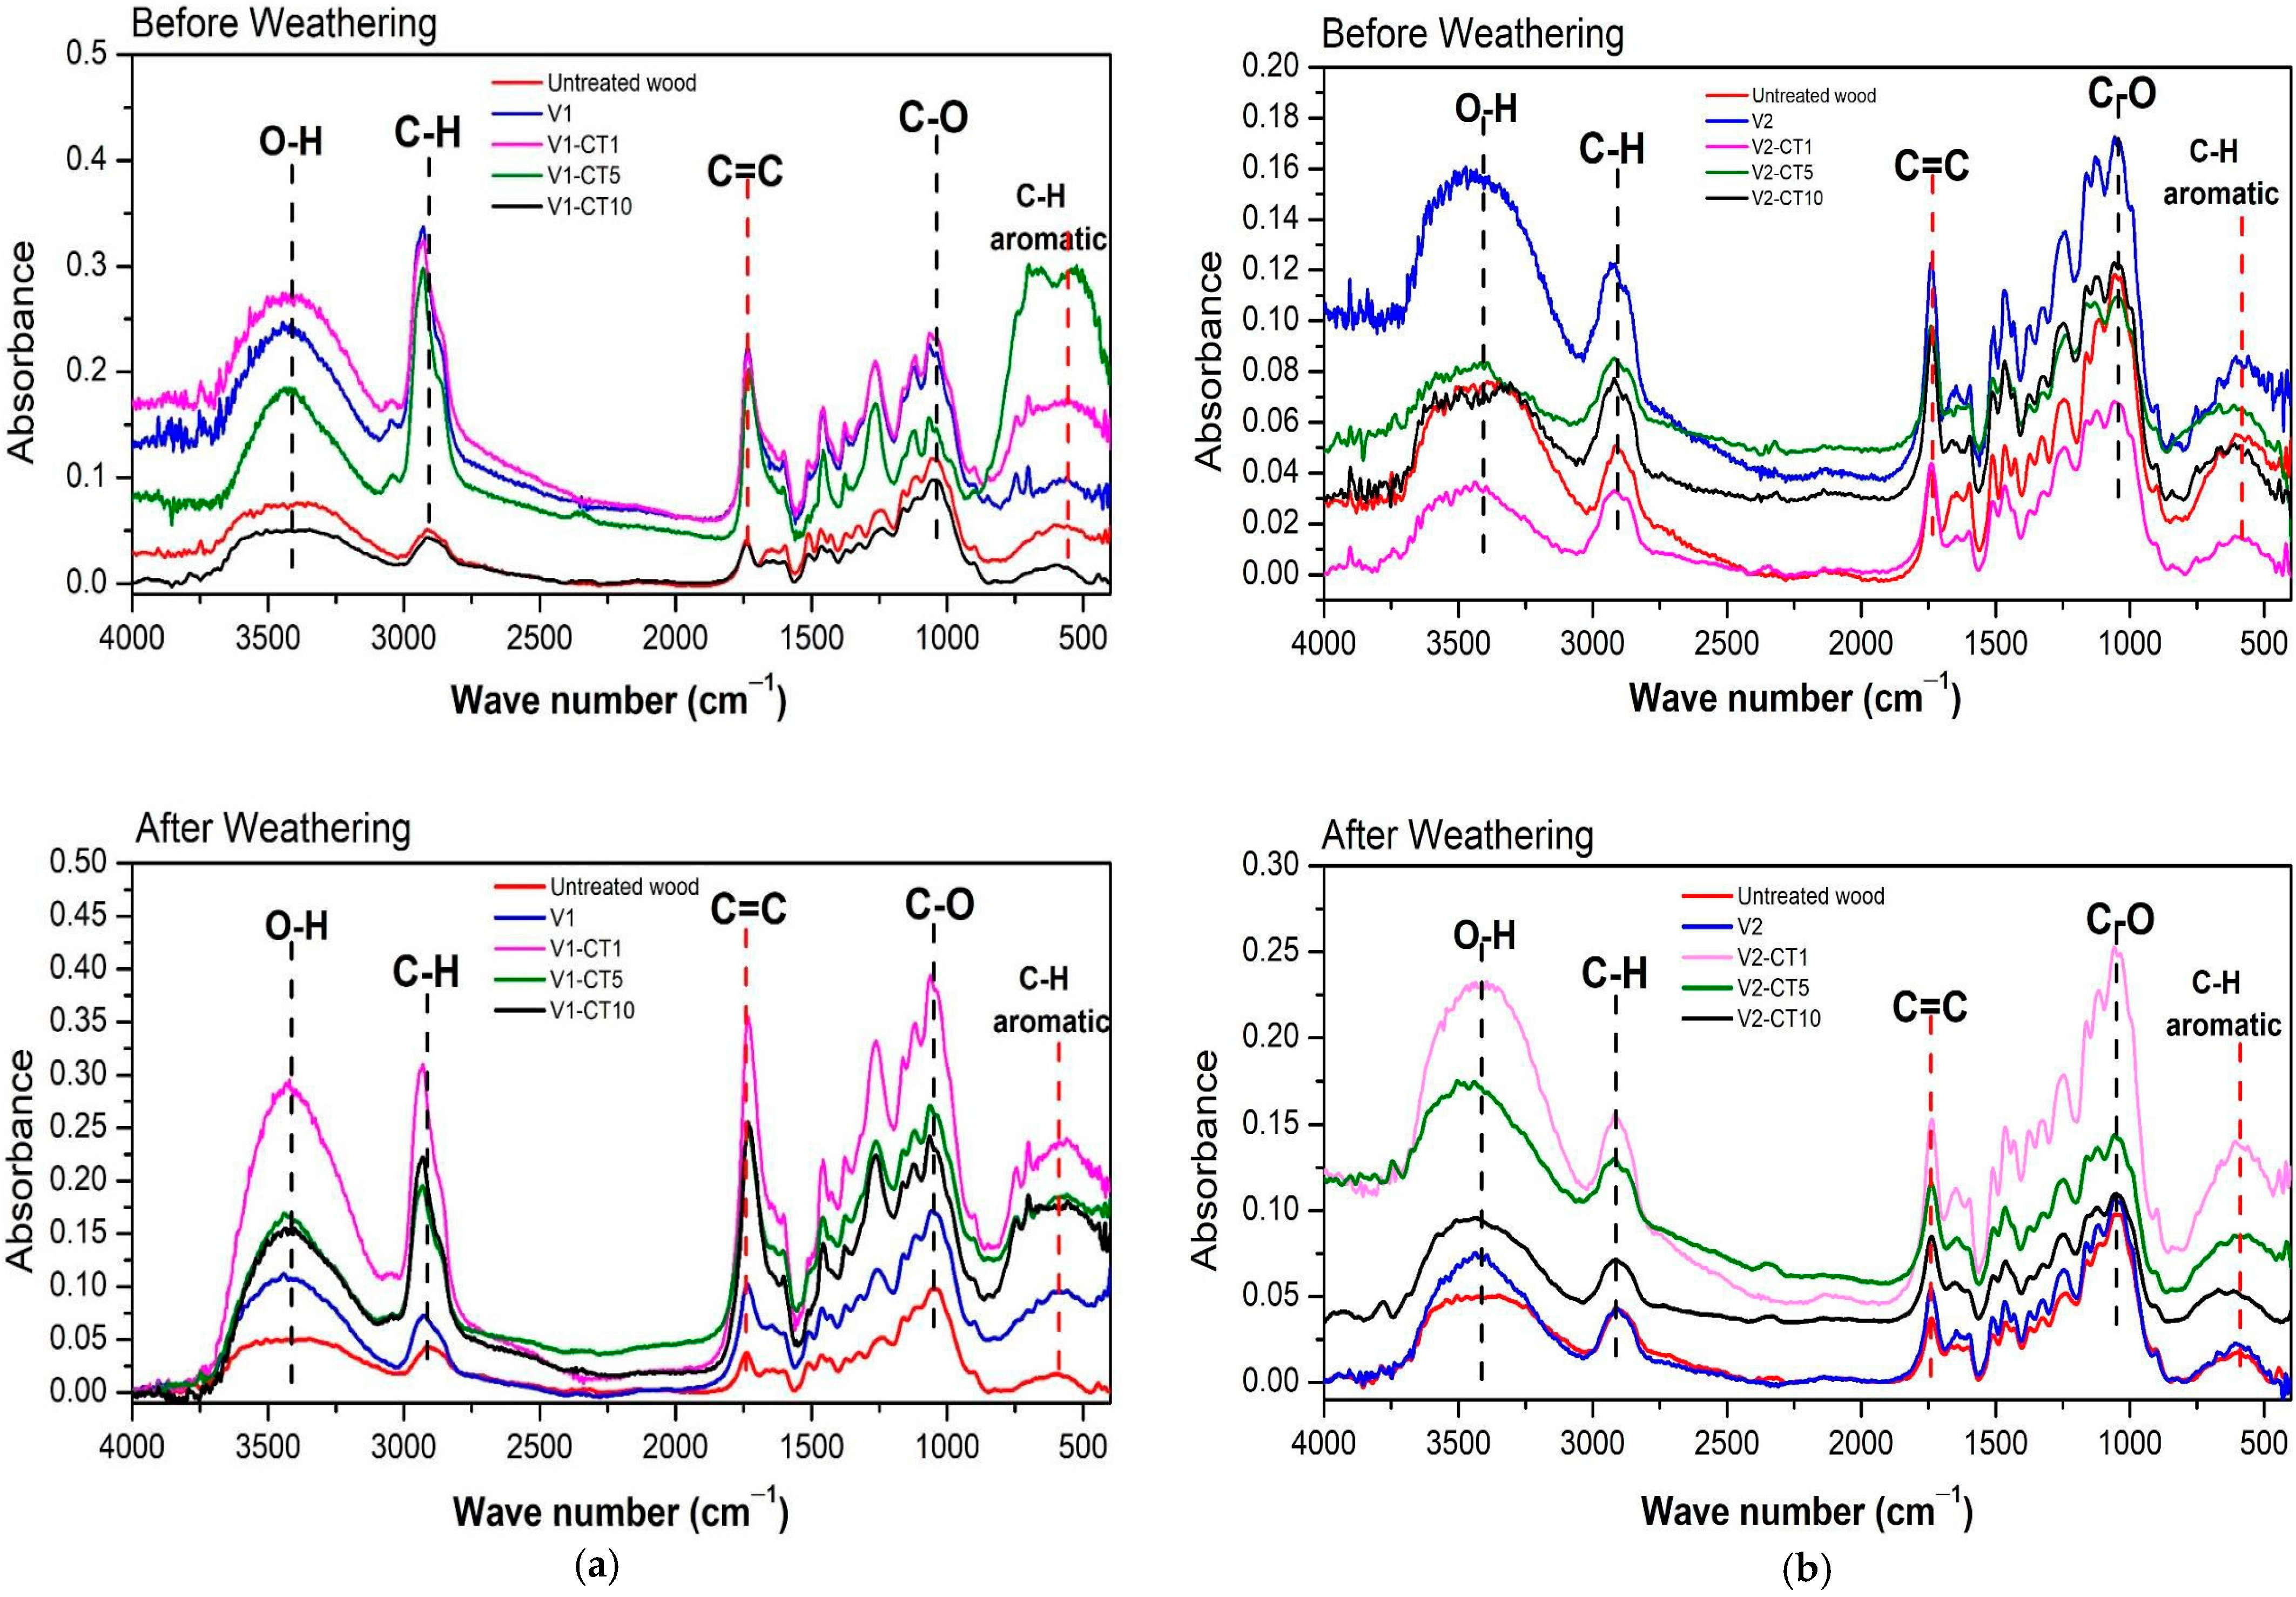
FTIR analysis was performed to identify the functional groups present in the wood samples after the coating treatment (see Figure 15). The FTIR spectra of the uncoated wood showed the C-H functional group of the aromatic compound framework at 584 cm−1, the C-O functional group at 1048 cm−1, the C=C functional group at 1736 cm−1, the C-H functional group at 2912 cm−1, and the O-H functional group at 3428 cm−1 [72].
There was an increase in the ratio index value of the C-H, C-O, C=C, and C-H aromatic functional groups and a decrease in the OH functional groups for the V1-CT, V1-CT1, and V1-CT10 treatments (see Figure 16a). The peak of the V1-CT10 sample increased with an increasing ratio index value. This relationship may have occurred since the combination of an oil-based varnish and highest concentration of TiO2-NPs could reduce the intensity of water absorption in the mangium wood. This phenomenon can occur by preventing the formation of hydrogen bonds between cellulose and water molecules [73]. Moreover, there was an increase in the ratio index value in all of the functional groups for the V2-CT1, V2-CT5, and V2-CT10 samples (see Figure 16b) compared to the uncoated and V2 samples. The combination of the water-based varnish and lowest concentration of TiO2-NPs could increase the intensity of water absorption and the dipole moment of the wood functional groups. This phenomenon can occur via the formation of hydrogen bonds between water, the coating base material, and cellulose [74].

4. Discussion

4.1. Colour Changes of Mangium Wood

A pale yellow colour appeared in the uncoated and coated mangium wood. This colour indicates the lignin content in the wood [75]. Changes in the L value are the most sensitive parameters of wood surface quality [76]. The colour change results show that there was a decrease in L after four months of weathering. This indicates that the wood surface became darker compared to its value before weathering. Based on Baysal et al. [77], a decrease in the L value indicates that the colour of wood becomes darker. In addition, lignin depolymerisation can cause darkening of the wood surface [77,78,79].
The increased L value of the mangium wood indicated an increase in the surface brightness of the mangium wood owing to the coating and nanocoating treatments. According to Muflihati et al. [80], the larger the L value, the higher the brightness of the surface material, and vice versa. The brightness of the wood surface increased with an increase in the concentrations of V1-CT and V2-CT, and the a and b values decreased with increasing concentrations of V1-CT and V2-CT, respectively. This might be due to the addition of white TiO2-NPs to the V1 and V2 varnishes. As the varnishes were cream (V1) or white (V2), and varnishes with TiO2-NPs at high concentrations were coated and bonded to the wood surface, the wood surface became brighter.
The total colour change (ΔE) of the wood to a grey colour was clearly visible in the uncoated mangium wood sample. However, the coated wood still retained its natural colour. According to Krisdianto et al. [56], wood exposed to weather undergoes periodic changes in temperature and humidity due to rain, dew, and sunlight, resulting in the delignification of the wood surface. Discolouration on the wood surface occurs due to changes in the wood moisture content, humidity, and temperature [81,82,83]. Changes in the colour of mangium wood from brown or yellow to grey are caused by changes in the lignin content during weathering [81,84,85]. Hence, the increase in discolouration at two months and four months occurred since some wood components or TiO2-NPs started to disappear as a result of the effects of exposure to solar radiation and rain. This composition change may allow lignin degradation to begin, causing the coated wood to become discoloured [86].
In this study, coating materials containing a white pigment derived from TiO2-NPs formed a layer or film on the wood surface, reducing the amount of radiation reaching the wood surface. This reduction in radiation led to a decrease in the lignin content present on the wood surface. The pigments within the coating, combined with the nanocoating materials, allow for the reflection and partial absorption of light energy, effectively shielding the wood surface from UV radiation [87,88]. The efficacy of the coating varies depending on its ability to protect the wood surface from UV radiation. The addition of nanoparticles and higher concentrations of the nanocoating material on the wood surface could protect the mangium wood sample from discolouration. According to Wang et al. [89], treatment using TiO2-NPs in coating materials can significantly increase the photostability of wood. Experiments with higher concentrations of TiO2-NPs revealed that a greater quantity of these particles coated the wood surface, resulting in improved UV protection and colour preservation, consequently enhancing the material’s durability [15,90].

4.2. Surface Roughness of Mangium Wood

Pfeffer et al. [91] reported that the degradation of wood polymers into lignin components can cause an increase in surface roughness. The surface roughness of the mangium wood coated with TiO2-NPs was higher than that of the mangium wood coated with varnishes without nanoparticles. In addition, the surface roughness of the wood samples coated with nanoparticles increased with increasing TiO2-NP concentration. Moreover, increasing the concentration of inorganic particles on the wood surface allows for the detection of nanoparticles and their groups, which significantly increases the average surface roughness value [92]. Based on Poljaček et al. [93], the addition of different concentrations of TiO2 to the fluorescent layer caused an increase in surface roughness. Similar results have been reported by Jnido et al. [94]. The authors reported that the wood surface became rougher due to the TiO2 deposition process, which facilitated the TiO2-NP coating of the wood surface.

4.3. Equilibrium Contact Angle and Wettability of Mangum Wood

Mangium wood coated with varnishes and a TiO2 nanocoating presented an increase in the equilibrium contact angle. This result indicates that the surface roughness of the wood surface became smoother. Hence, the lower the surface roughness, the higher the contact angle [95]. Similar results have been reported by Ayrilmis et al. [96]. The results also indicate that the better the wood surface wettability, the lower the contact angle. After the weathering test, the equilibrium contact angle decreased and the K-value increased. Kishino and Nakano [97] reported that lignin degradation caused cellulose to increase its absorbable hydroxyl groups.
As per Unsal et al. [98], the wettability of wood is influenced by various macroscopic characteristics, including density, surface roughness, and water content. The K-value is directly proportional to wood’s roughness, meaning a greater wood surface roughness corresponds to a higher K-value. Consequently, the oil-based varnish yielded a higher K-value compared to the water-based varnish, likely due to the lower viscosity of the oil-based varnish. An increase in liquid viscosity leads to a decrease in the wettability of the wood surface [99].
As shown in Table 2, the coated mangium wood had a higher equilibrium contact angle value and a lower K-value than the uncoated wood sample, indicating that the mangium wood had hydrophobic properties after the coating treatment. The water-based varnish was more hydrophobic than the oil-based varnish due to its higher equilibrium contact angle. According to Lopes et al. [100], wood surfaces with high contact angles exhibit hydrophobic properties and low wettability. Pfeffer et al. [101] also reported that low equilibrium contact angles resulted in high surface hydrophilicity. Moreover, the addition of TiO2-NPs also increased the hydrophobicity of the wood. Based on the statement of Chu et al. [102], the TiO2 coating component can result in wood becoming hydrophobic. The TiO2-NP mechanism in the wood-coating process involves the formation of a layer on the wood surface that originates from the deposition of suspended particles [103]. Consequently, the precipitated particles remain on the surface. Therefore, it is necessary to test the hydrophobicity and photocatalytic activity of the coated samples to determine the effectiveness of the coating process with active TiO2-NP compounds on both water- and oil-based finishing materials.

4.4. Microscopic and Macroscopic Mangium Wood

Mangium wood has a solitary vessel arrangement, and in some cases, up to 2–3 vessels are radially multiplied. The tangential diameter of the solitary vessel is 210 (150–208) µm and the vessel’s distribution is about 4–9/mm2. Intervessel pits of 7 (6.5–7.5) µm in vertical diameter have an alternate pattern and rays on usually a 1–2 series, sometimes a 1–3 series depending on the type of mangium wood [104]. The tangential diameter of the vessel lumina and vessels per square millimetre of A. mangium from Indonesia are 132–142 μ m and 7–9/mm2, respectively [5]. Based on the microscopic and macroscopic results, only a small portion was observed, as described above. According to Svora et al. [63], most research on TiO2 as a wood preservative or wood quality improvement material shows results in the form of changes in colour or mechanical properties, but little is known about the microscopic and molecular changes that occur.

4.5. Degradation Ability of the MB Compound

The crystal phase of the TiO2-NPs used in the nanocoating formulation was anatase. The anatase crystal phase was chosen since it has the highest photocatalytic activity over the rutile and brookite phases [55]. The MB degradation percentage parameter of the coating material describes its ability to degrade organic pollutants, which can accelerate the weathering process in biomaterials such as wood [105].
The fluctuation pattern of the degradation percentage of MB showed the same trend in all coating treatments, increasing in the second month and decreasing in the fourth month. This could be due to the fact that the time and intensity of sunlight exposure increased in the second month (April–May) with sunnier weather during the day before decreasing in the fourth month (June–July) with cloudier and rainier weather. The TiO2-NPs can absorb solar radiation energy and can be used in solar cell systems and photocatalytic reactions [106]. The solar intensity increased as the energy was stored, and the effectiveness of the photocatalyst activity increased, even though all treatments received the same simultaneous UV radiation treatment in laboratory testing. MB degradation also occurred in the uncoated wood samples without nanoparticles. This did not occur as a result of the photocatalytic reaction mechanism, but through the irreversible adsorption of MB as a dye by the main structural building blocks of wood: cellulose, hemicellulose, and lignin [107]. In addition, the heat produced by UV radiation during simultaneous testing can result in the slow degradation of MB, even without a catalyst present [69].

4.6. Evaluation of the Energy Efficiency of Coating Materials in Degrading MB Compounds

In the fourth month of the weathering process, the percentage degradation value of the MB decreased, and the energy consumption increased significantly. A possible explanation for this behaviour could be that the nanocoating layer was leached due to heat exposure from sunlight and high humidity from rainwater, while the uncoated wood underwent a process of cellulose cell wall degradation that could decrease the MB absorption capacity. Similar results have been reported in previous studies [99,100]. According to the MB degradation percentage and energy consumption values, the higher values were always obtained for the V1-based coatings over the V2-based coatings, both in the initial conditions and during the experimental period. Non-polar oil-based materials can better dissolve the active ingredients of TiO2-NPs and are not easily leached from rain by water [108]. In contrast, water-based materials that are polar in nature cannot completely dissolve the active ingredients of TiO2-NPs and are easily leached from rain by water [109]. This relationship is also related to the solubility properties of chemical compounds, where polar compounds dissolve in polar compounds and nonpolar compounds dissolve in nonpolar compounds [110].

4.7. FTIR Testing and Functional Group Absorption Band Ratio Index Calculation

The identification of the functional groups revealed that the C-H stretching emanated from cellulose and hemicellulose, involving aromatic C-H stretching and C=C in the lignin skeleton [111], O-H stretching in cellulose, and C-O stretching in hemicellulose [112]. All functional groups identified in the uncoated wood were also identified in the coated wood. However, there was a change in the magnitude of the absorption intensity after the weathering process lasting four months. In this study, the index ratios calculated for the functional groups were all identified in the wood (OH, C-H, C-O, C=C, and aromatic C-H). The results of the index ratio calculation showed that the absorbance value decreased for all functional groups in the uncoated wood and coated wood samples without nanoparticles (V1 and V2). This could be due to the absence of protection from the active ingredients of TiO2-NPs against UV radiation and organic pollutants, which could accelerate wood degradation. Wood degradation can be initiated by lignin, which is very sensitive to UV radiation [63] and is characterised by a decrease in the absorbance of the aromatic C-H and C=C functional groups.

5. Conclusions

Clear coating materials, particularly varnish TiO2-NP-based coatings, when applied to mangium wood, offer protection to the wood surface against weathering-induced degradation. The addition of these nanocoatings help minimize discoloration in mangium wood following weathering. Higher concentrations of nanoparticles in the coating resulted in lower total colour changes. The surface roughness of the wood coated with the water-based varnish was smoother than that coated with the oil-based varnish. Both water- and oil-based varnishes, along with 1% TiO2-NP coatings display hydrophobic properties. However, water-based nanocoatings demonstrate higher hydrophobic properties compared to their oil-based counterparts. Varnishes containing TiO2-NP as active compounds exhibited high photocatalytic activity, as indicated by the high percentage of MB degradation and low energy consumption. The results of the FTIR analysis confirm that treating the wood surface with the TiO2-NP coating materials effectively shields the wood from UV radiation and organic pollutants.

Author Contributions

Conceptualization, I.R.; Methodology, I.R., D.S.N., E.P. and R.I.; Software, R.I.; Validation, W.D., E.P. and R.I.; Formal analysis, D.S.N., E.P., R.I. and G.D.L.; Investigation, I.R., W.D., D.S.N., E.P., R.I., G.D.L. and R.M.; Data curation, G.D.L. and R.M.; Writing—original draft, I.R., E.P., R.I. and G.D.L.; Writing—review & editing, I.R., W.D., D.S.N. and R.M.; Visualization, E.P., R.I., G.D.L. and R.M.; Supervision, E.P.; Project administration, I.R. All authors have read and agreed to the published version of the manuscript.

Funding

This research was funded by Ministry of Education, Culture and Research and Technology of Indonesia, Contract Number 001/E5/PG.02.00.PL/2023 and 15851/IT3.D10/PT.01.02/P/T/2023.

Institutional Review Board Statement

Not applicable.

Informed Consent Statement

Not applicable.

Data Availability Statement

The data presented in this study are available on request from the corresponding author.

Conflicts of Interest

The authors declare no conflict of interest.

References

  1. Hunt, D. Properties of wood in the conservation of historical wooden artifacts. J. Cult. Herit. 2012, 13, S10–S15. [Google Scholar] [CrossRef]
  2. Mazzanti, P.; Togni, M.; Uzielli, L. Drying shrinkage and mechanical properties of poplar wood (Populus alba L.) across the grain. J. Cult. Herit. 2012, 13, S85–S89. [Google Scholar] [CrossRef]
  3. Marcon, B.; Mazzanti, P.; Uzielli, L.; Cocchi, L.; Dureisseix, D.; Gril, J. Mechanical study of a support system for cupping control of panel paintings combining crossbars and springs. J. Cult. Herit. 2012, 13, S109–S117. [Google Scholar] [CrossRef]
  4. Pandit, I.K.N.; Kurniawan, D. Wood Anatomy: Wood Structure, Wood as Raw Material and Diagnostic Characteristics of Indonesian Trade Wood; Bogor Agricultural Institute: Bogor, Indonesia, 2008. [Google Scholar]
  5. Nugroho, W.D.; Marsoem, S.N.; Yasue, K.; Fujiwara, T.; Nakajima, T.; Hayakawa, M.; Nakaba, S.; Yamagishi, Y.; Jin, H.O.; Kubo, T.; et al. Radial variations in the anatomical characteristics and density of the wood of Acacia mangium of five different provenances in Indonesia. J. Wood Sci. 2012, 58, 185–194. [Google Scholar] [CrossRef]
  6. Rowel, R.M. Handbook of Wood Chemistry and Wood Composites, 2nd ed.; CRC Press: Boca Raton, FL, USA, 2013; ISBN 978-1-4398-5381-8. [Google Scholar] [CrossRef]
  7. Feist, W.C. Outdoor Wood Weathering and Protection; Forest Products Laboratory: Madison, WI, USA, 1990.
  8. Darmawan, W.; Rahayu, I.S.; Padlinurjaji, I.M.; Pandit, K.N. Woodworking: Supporting Sciences and Process Technology; IPB Press: Bogor, Indonesia, 2011. [Google Scholar]
  9. Hoadley, R.B. Understanding Wood: A Craftsman’s Guide to Wood Technology; The Taunton Press: Newtown, CT, USA, 2000. [Google Scholar]
  10. Fufa, S.M.; Jelle, B.P.; Hovde, P.J.; Rorvik, P.M. Coated wooden claddings and the influence of nanoparticles on the weathering performance. Prog. Org. Coat. 2012, 75, 72–78. [Google Scholar] [CrossRef]
  11. Tu, K.; Kong, L.; Wang, X.; Liu, J. Semitransparent, durable superhydrophobic polydimethylsiloxane/SiO2 nanocomposite coatings on varnished wood. Holzforschung 2016, 70, 1039–1045. [Google Scholar] [CrossRef]
  12. Guo, H.; Fuchs, P.; Cabane, E.; Michen, B.; Hagendorfer, H.; Romanyuk, Y.E.; Burgert, I. UV-protection of wood surfaces by controlled morphology fine-tuning of ZnO nanostructures. Holzforschung 2016, 70, 699–708. [Google Scholar] [CrossRef]
  13. Salla, J.; Pandey, K.K.; Srinivas, K. Improvement of UV resistance of wood surfaces by using ZnO nanoparticles. Polym. Degrad. Stab. 2012, 97, 592–596. [Google Scholar] [CrossRef]
  14. Auffan, M.; Masion, A.; Labille, J.; Diot, M.A.; Liu, W.; Olivi, L.; Proux, O.; Ziarelli, F.; Chaurand, P.; Geantet, C.; et al. Long-term aging of a CeO2 based nanocomposite used for wood protection. Environ. Pollut. 2014, 188, 1–7. [Google Scholar] [CrossRef] [PubMed]
  15. Veronovski, N.; Verhovšek, D.; Godnjavec, J. The influence of surface-treated nano-TiO2 (rutile) incorporation in water-based acrylic coatings on wood protection. Wood Sci. Technol. 2013, 47, 317–328. [Google Scholar] [CrossRef]
  16. Wang, B.; Feng, M.; Zhan, H. Improvement of wood properties by impregnation with TiO2 via ultrasonic-assisted sol-gel process. RSC Adv. 2014, 4, 56355–56360. [Google Scholar] [CrossRef]
  17. Chen, X.D.; Wang, Z.; Liao, Z.F.; Mai, Y.L.; Zhang, M.Q. Roles of anatase and rutile TiO2 nanoparticles in photooxidation of polyurethane. Polym. Test. 2007, 26, 202–208. [Google Scholar] [CrossRef]
  18. Kim, T.K.; Lee, M.N.; Lee, S.H.; Park, Y.C.; Jung, C.K.; Boo, J.H. Development of surface coating technology of TiO2 powder and improvement of photocatalytic activity by surface modification. Thin Solid Film. 2005, 475, 171–177. [Google Scholar] [CrossRef]
  19. Sun, Q.; Yu, H.; Liu, Y.; Li, J.; Lu, Y.; Hunt, J.F. Improvement of water resistance and dimensional stability of wood through titanium dioxide coating. Holzforschung 2010, 64, 757–761. [Google Scholar] [CrossRef]
  20. Rahayu, I.; Darmawan, W.; Nawawi, D.S.; Prihatini, E.; Ismail, R.; Laksono, G.D. Physical Properties of Fast-Growing Wood-Polymer Nano Composite Synthesized through TiO2 Nanoparticle Impregnation. Polymers 2022, 14, 4463. [Google Scholar] [CrossRef] [PubMed]
  21. Mahltig, B.; Swaboda, C.; Roessler, A.; Böttcher, H. Functionalising wood by nanosol application. J. Mater. Chem. 2008, 18, 3180–3192. [Google Scholar] [CrossRef]
  22. Rassam, G.; Abdi, Y.; Abdi, A. Deposition of TiO2 nano-particles on wood surfaces for UV and moisture protection. J. Exp. Nanosci. 2012, 7, 468–476. [Google Scholar] [CrossRef]
  23. Schmalzl, K.J.; Evans, P.D. Wood surface protection with some titanium, zirconium and manganese compounds. Polym. Degrad. Stab. 2003, 82, 409–419. [Google Scholar] [CrossRef]
  24. Tshabalala, M.A.; Libert, R.; Schaller, C.M. Photostability and moisture uptake properties of wood veneers coated with a combination of thin sol-gel films and light stabilizers. Holzforschung 2011, 65, 215–220. [Google Scholar] [CrossRef]
  25. Meng, L.Y.; Wang, B.; Ma, M.G.; Lin, K.L. The progress of microwave-assisted hydrothermal method in the synthesis of functional nanomaterials. Mater. Today Chem. 2016, 1–2, 63–83. [Google Scholar] [CrossRef]
  26. Liu, S.X.; Chen, X.Y.; Chen, X. A TiO2/AC composite photocatalyst with high activity and easy separation prepared by a hydrothermal method. J. Hazard. Mater. 2007, 143, 257–263. [Google Scholar] [CrossRef]
  27. Park, Y. A new paradigm shift for the green synthesis of antibacterial silver nanoparticles utilizing plant extracts. Toxicol. Res. 2014, 30, 169–178. [Google Scholar] [CrossRef]
  28. Karthikeyan, K.T.; Nithya, A.; Jothivenkatachalam, K. Photocatalytic and antimicrobial activities of chitosan-TiO2 nanocomposite. Int. J. Biol. Macromol. 2017, 104, 1762–1773. [Google Scholar] [CrossRef] [PubMed]
  29. Oktaviani, Y.; Muttaqin, A. Pengaruh Temperatur Hidrotermal Terhadap Konduktivitas Listrik Zeolit Sintetis Dari Abu Dasar Batubara Dengan Metode Alkali Hidrotermal. J. Fis. Unand 2015, 4, 358–364. [Google Scholar]
  30. Famia, A.M.; Muldarisnur, M. Pengaruh Temperatur Sintesis Hidrotermal Terhadap Diameter Nanopartikel Seng Oksida. J. Fis. Unand 2019, 8, 127–132. [Google Scholar] [CrossRef]
  31. Sapputra, G.P.A.; Noerochim, L. Pengaruh Waktu Hidrotermal pada Proses Sintesis Lithium Mangan Oksida Spinel (LiMn2O4) Nanopartikel terhadap Efisiensi Adsorpsi dan Desorpsi Ion Lithium dari Lumpur Sidoarjo. J. Tek. Pomits 2014, 3, 163–167. [Google Scholar]
  32. Aneesh, P.M.; Vanaja, K.A.; Jayaraj, M.K. Synthesis of ZnO nanoparticles by hydrothermal method. Nanophotonic Mater. IV 2007, 6639, 66390J. [Google Scholar] [CrossRef]
  33. Shahat, A.M.; El-Hossary, F.M.; Ghitas, A.; Abd El-Rahman, A.M.; Ebnalwaled, A.A. Low-temperature Hydrothermal Synthesis of Titanium Dioxide Nanoparticles for Photocatalytic Applications. IOP Conf. Ser. Mater. Sci. Eng. 2021, 1171, 012008. [Google Scholar] [CrossRef]
  34. Gerasimov, A.; Eremina, O.; Cherkasova, M.; Dmitriev, S. Application of particle-size analysis in various industries. J. Phys. Conf. Ser. 2021, 1728, 12003. [Google Scholar] [CrossRef]
  35. Bagheri, S.; Shameli, K.; Abd Hamid, S.B. Synthesis and characterization of anatase titanium dioxide nanoparticles using egg white solution via Sol-Gel method. J. Chem. 2013, 2013, 6–11. [Google Scholar] [CrossRef]
  36. Hong, S.; Lee, S.; Jung, H.J.; Yu, Y.; Shin, J.; Kwon, K.-Y.; Choi, M. Simple Preparation of Anatase TiO2 Nanoparticles via Pulsed Laser Ablation in Liquid. Bull. Korean Chem. Soc. 2013, 34, 279–282. [Google Scholar] [CrossRef]
  37. ISO 4287-1997; Geometrical Product Specifications (GPS) Surface Texture: Profile Method. Terms, Definitions and Surface Texture Parameters. International Organization for Standardization: Geneva, Switzerland, 1997.
  38. Hunter Lab. Color Scale. 2008. Available online: https://www.hunterlab.com (accessed on 13 August 2021).
  39. Shi, S.Q.; Gardner, D.J. Dynamic adhesive wettability of wood. Wood Fiber Sci. 2001, 33, 58–68. [Google Scholar]
  40. Alsubaie, N.; Alshamrani, R.; Domyati, D.; Alahmadi, N.; Bannani, F. Methylene Blue Dye Adsorption onto Polyoxometalate Ionic Liquid Supported on Bentonite: Kinetic, Equilibrium and Thermodynamic Studies. Open J. Phys. Chem. 2021, 11, 106–127. [Google Scholar] [CrossRef]
  41. Ghavi, A.; Bagherian, G.; Vahidian, H. Investigating the Synergistic Effect of UV/PS/TiO2 and UV/PI/TiO2 Processes on Paraquat Herbicide Degradation in Media Aqueous: Statistical Optimization, Kinetic Study, and Estimation of Electrical Energy Consumption. 2021. Available online: https://www.researchsquare.com/article/rs-277799/v1 (accessed on 6 September 2023).
  42. Makhatova, A.; Ulykbanova, G.; Sadyk, S.; Sarsenbay, K.; Atabaev, T.S.; Inglezakis, V.J.; Poulopoulos, S.G. Degradation and mineralization of 4-tert-butylphenol in water using Fe-doped TiO2 catalysts. Sci. Rep. 2019, 9, 19284. [Google Scholar] [CrossRef] [PubMed]
  43. Gupta, B.S.; Jelle, B.; Gao, T. Application of ATR-FTIR Spectroscopy to Compare the Cell Materials of Wood Decay Fungi with Wood Mould Fungi. Int. J. Spectrosc. 2015, 2015, 521938. [Google Scholar] [CrossRef]
  44. Li, Y.; Qin, Z.; Guo, H.; Yang, H.; Zhang, G.; Ji, S.; Zeng, T. Low-Temperature Synthesis of Anatase TiO2 Nanoparticles with Tunable Surface Charges for Enhancing Photocatalytic Activity. PLoS ONE 2014, 9, e114638. [Google Scholar] [CrossRef]
  45. Khan, I.; Saeed, K.; Khan, I. Nanoparticles: Properties, applications and toxicities. Arab. J. Chem. 2019, 12, 908–931. [Google Scholar] [CrossRef]
  46. Kumar, A.; Dixit, C.K. Methods for characterization of nanoparticles. In Advances in Nanomedicine for the Delivery of Therapeutic Nucleic Acids; Nimesh, S., Chandra, R., Gupta, N., Eds.; Woodhead Publishing: Sawston, UK, 2017; pp. 43–58. ISBN 978-0-08-100557-6. [Google Scholar]
  47. Jasmani, L.; Rusli, R.; Khadiran, T.; Jalil, R.; Adnan, S. Application of Nanotechnology in Wood-Based Products Industry: A Review. Nanoscale Res. Lett. 2020, 15, 207. [Google Scholar] [CrossRef]
  48. Sharfudeen, B.F.J.M.; Latheef, A.F.A.; Ambrose, R.V. Synthesis and characterization of TiO2 nanoparticles and investigation of antimicrobial activities against human pathogens. J. Pharm. Sci. Res. 2017, 9, 1604–1608. [Google Scholar]
  49. Hartland, G.V. Nanoparticle crystallinity: Is perfect better? Nat. Mater. 2007, 6, 716–718. [Google Scholar] [CrossRef]
  50. Li, Z.; Shen, W.; He, W.; Zu, X. Effect of Fe-doped TiO2 nanoparticle derived from modified hydrothermal process on the photocatalytic degradation performance on methylene blue. J. Hazard. Mater. 2008, 155, 590–594. [Google Scholar] [CrossRef]
  51. Rathod, P.B.; Waghuley, S.A. Synthesis and UV-Vis spectroscopic study of TiO2 nanoparticles. Int. J. Nanomanuf. 2015, 11, 185–193. [Google Scholar] [CrossRef]
  52. Zanatta, A.R. Revisiting the optical bandgap of semiconductors and the proposal of a unified methodology to its determination. Sci. Rep. 2019, 9, 11225. [Google Scholar] [CrossRef]
  53. Makuła, P.; Pacia, M.; Macyk, W. How To Correctly Determine the Band Gap Energy of Modified Semiconductor Photocatalysts Based on UV-Vis Spectra. J. Phys. Chem. Lett. 2018, 9, 6814–6817. [Google Scholar] [CrossRef]
  54. Altomare, A.; Corriero, N.; Cuocci, C.; Falcicchio, A.; Moliterni, A.; Rizzi, R. QUALX2.0: A qualitative phase analysis software using the freely available database POW-COD. J. Appl. Crystallogr. 2015, 48, 598–603. [Google Scholar] [CrossRef]
  55. Opoku, F.; Govender, K.K.; van Sittert, C.G.C.E.; Govender, P.P. Understanding the synergistic effects, optical and electronic properties of ternary Fe/C/S-doped TiO2 anatase within the DFT + U approach. Int. J. Quantum Chem. 2018, 118, e25505. [Google Scholar] [CrossRef]
  56. Krisdianto, K.; Satiti, E.R.; Supriadi, A. Perubahan Warna Dan Lapisan Finishing Lima Jenis Kayu Akibat Pencuacaan. J. Penelit. Has. Hutan 2018, 36, 205–210. [Google Scholar] [CrossRef]
  57. Turkoglu, T.; Baysal, E.; Kureli, I.; Toker, H.; Ergun, M.E. The effects of natural weathering on hardness and gloss of impregnated and varnished Scots pine and Oriental beech wood. Wood Res. 2015, 60, 833–844. [Google Scholar]
  58. Lu, X.; Hu, Y. Layer-by-layer deposition of TiO2 nanoparticles in the wood surface and its superhydrophobic performance. BioResources 2016, 11, 4605–4620. [Google Scholar] [CrossRef]
  59. Čolović, B.; Kisić, D.; Jokanović, B.; Rakočević, Z.; Nasov, I.; Petkoska, A.T.; Jokanović, V. Wetting properties of titanium oxides, oxynitrides and nitrides obtained by DC and pulsed magnetron sputtering and cathodic arc evaporation. Mater. Sci. Pol. 2019, 37, 173–181. [Google Scholar] [CrossRef]
  60. Martha, R.; Dirna, F.C.; Hasanusi, A.; Rahayu, I.S.; Darmawan, W. Surface free energy of 10 tropical woods species and their acrylic paint wettability. J. Adhes. Sci. Technol. 2020, 34, 167–177. [Google Scholar] [CrossRef]
  61. Darmawan, W.; Nandika, D.; Noviyanti, E.; Alipraja, I.; Lumongga, D.; Gardner, D.; Gérardin, P. Wettability and bonding quality of exterior coatings on jabon and sengon wood surfaces. J. Coat. Technol. Res. 2018, 15, 95–104. [Google Scholar] [CrossRef]
  62. Rowel, R.M. Handbook of Wood Chemistry and Wood Composites, 1st ed.; CRC Press: Boca Raton, FL, USA, 2005; ISBN 9780429209000. [Google Scholar] [CrossRef]
  63. Svora, P.; Svorová Pawełkowicz, S.; Ecorchard, P.; Plocek, J.; Schieberová, A.; Prošek, Z.; Ptáček, P.; Pošta, J.; Targowski, P.; Kuklík, P.; et al. Study of Interactions between Titanium Dioxide Coating and Wood Cell Wall Ultrastructure. Nanomaterials 2022, 12, 2678. [Google Scholar] [CrossRef] [PubMed]
  64. Baeissa, E.S. Photocatalytic degradation of methylene blue dye under visible light irradiation using In/ZnO nanocomposite. Front. Nanosci. Nanotechnol. 2016, 2, 1–5. [Google Scholar] [CrossRef]
  65. Akkus, C.; Ozturk, A.; Kalem, V.; Park, J. Influence of TiO2 Content on the Photocatalytic Activity of TiO2-B2O3 Glasses Prepared by the Sol-Gel Process. In Proceedings of the 18th Metallurgy and Materials Congress, Istanbul, Turkey, 29 September–1 October 2016. [Google Scholar]
  66. Wang, C.; Bai, H.; Kang, X. Optimization Study on Synergistic System of Photocatalytic Degradation of AR 26 and UV-LED Heat Dissipation. Catalysts 2023, 13, 669. [Google Scholar] [CrossRef]
  67. Li, F.; Kong, W.; Zhao, X.; Pan, Y. Multifunctional TiO2-Based Superoleophobic/Superhydrophilic Coating for Oil–Water Separation and Oil Purification. ACS Appl. Mater. Interfaces 2020, 12, 18074–18083. [Google Scholar] [CrossRef]
  68. Varma, K.S.; Tayade, R.J.; Shah, K.J.; Joshi, P.A.; Shukla, A.D.; Gandhi, V.G. Photocatalytic degradation of pharmaceutical and pesticide compounds (PPCs) using doped TiO2 nanomaterials: A review. Water-Energy Nexus 2020, 3, 46–61. [Google Scholar] [CrossRef]
  69. Raheb, I.; Manlla, M.S. Kinetic and thermodynamic studies of the degradation of methylene blue by photo-Fenton reaction. Heliyon 2021, 7, e07427. [Google Scholar] [CrossRef]
  70. Azeez, F.; Al-Hetlani, E.; Arafa, M.; Abdelmonem, Y.; abdel nazeer, A.; Amin, M.; Madkour, M. The effect of surface charge on photocatalytic degradation of methylene blue dye using chargeable titania nanoparticles. Sci. Rep. 2018, 8, 7104. [Google Scholar] [CrossRef]
  71. Milani Moghaddam, H.; Nasirian, S. Dependence of activation energy and lattice strain on TiO2 nanoparticles. J. Exp. Nanosci. 2012, 1, 201–212. [Google Scholar] [CrossRef]
  72. Coates, J. Interpretation of Infrared Spectra, A Practical Approach. In Encyclopedia of Analytical Chemistry; Wiley: Hoboken, NJ, USA, 2006. [Google Scholar]
  73. Pánek, M.; Oberhofnerová, E.; Zeidler, A.; Šedivka, P. Efficacy of Hydrophobic Coatings in Protecting Oak Wood Surfaces during Accelerated Weathering. Coatings 2017, 7, 172. [Google Scholar] [CrossRef]
  74. Wohlert, M.; Benselfelt, T.; Wågberg, L.; Furó, I.; Berglund, L.A.; Wohlert, J. Cellulose and the role of hydrogen bonds: Not in charge of everything. Cellulose 2022, 29, 1–23. [Google Scholar] [CrossRef]
  75. Butylina, S.; Hyvärinen, M.; Kärki, T. A study of surface changes of wood-polypropylene composites as the result of exterior weathering. Polym. Degrad. Stab. 2012, 97, 337–345. [Google Scholar] [CrossRef]
  76. Baysal, E. Surface characteristics of CCA treated scots pine after accelerated weathering. Wood Res. 2012, 57, 375–382. [Google Scholar]
  77. Baysal, E.; Dizman Tomak, E.; Ozbey, M.; Altin, E. Surface properties of impregnated and varnished Scots pine wood after accelerated weathering. Color. Technol. 2014, 130, 140–146. [Google Scholar] [CrossRef]
  78. Temiz, A.; Yildiz, U.C.; Aydin, I.; Eikenes, M.; Alfredsen, G.; Çolakoglu, G. Surface roughness and color characteristics of wood treated with preservatives after accelerated weathering test. Appl. Surf. Sci. 2005, 250, 35–42. [Google Scholar] [CrossRef]
  79. Ghosh, S.C.; Militz, H.; Mai, C. Natural weathering of scots pine (Pinus sylvestris L.) boards modified with functionalised commercial silicone emulsions. BioResources 2009, 4, 659–673. [Google Scholar] [CrossRef]
  80. Muflihati; Nawawi, D.S.; Rahayu, I.S.; Syafii, W. Perubahan Warna Kayu Jabon Terwarnai Ekstrak Kulit Kayu Samak (Syzygium inophyllum). J. Ilmu Teknol. Kayu Trop. 2014, 12, 14–15. [Google Scholar]
  81. Temiz, A.; Terziev, N.; Eikenes, M.; Hafren, J. Effect of accelerated weathering on surface chemistry of modified wood. Appl. Surf. Sci. 2007, 253, 5355–5362. [Google Scholar] [CrossRef]
  82. Deka, M.; Petric, M. Modified and Non-Modified Wood During Artificial Light Exposure. BioResources 2008, 3, 346–362. [Google Scholar] [CrossRef]
  83. Hansmann, C.; Deka, M.; Wimmer, R.; Gindl, W. Artificial weathering of wood surfaces modified by melamine formaldehyde resins. Holz Als Roh Werkst. 2006, 64, 198–203. [Google Scholar] [CrossRef]
  84. Ozgenc, O.; Hiziroglu, S.; Yildiz, U.C. Weathering properties of wood species treated with different coating applications. BioResources 2012, 7, 4875–4888. [Google Scholar] [CrossRef]
  85. Pandey, K.K. Study of the effect of photo-irradiation on the surface chemistry of wood. Polym. Degrad. Stab. 2005, 90, 9–20. [Google Scholar] [CrossRef]
  86. Vlad Cristea, M.; Riedl, B.; Blanchet, P. Enhancing the performance of exterior waterborne coatings for wood by inorganic nanosized UV absorbers. Prog. Org. Coat. 2010, 69, 432–441. [Google Scholar] [CrossRef]
  87. Nejad, M.; Ung, T.; Cooper, P. Protocol comparison: Laboratory versus natural weathering tests for performance evaluation of coatings on preservative-treated wood. For. Prod. J. 2012, 62, 177–183. [Google Scholar] [CrossRef]
  88. Schaller, C.; Rogez, D.; Braig, A. Hydroxyphenyl-s-triazines: Advanced multipurpose UV-absorbers for coatings. J. Coat. Technol. Res. 2008, 5, 25–31. [Google Scholar] [CrossRef]
  89. Wang, X.; Liu, S.; Chang, H.; Liu, J. Sol-gel deposition of TiO2 nanocoatings on wood surfaces with enhanced hydrophobicity and photostability. Wood Fiber Sci. 2014, 46, 109–117. [Google Scholar]
  90. Moya, R.; Rodríguez-Zúñiga, A.; Vega-Baudrit, J.; Puente-Urbina, A. Effects of adding TiO2 nanoparticles to a water-based varnish for wood applied to nine tropical woods of Costa Rica exposed to natural and accelerated weathering. J. Coat. Technol. Res. 2017, 14, 141–152. [Google Scholar] [CrossRef]
  91. Pfeffer, A.; Mai, C.; Militz, H. Weathering characteristics of wood treated with water glass, siloxane or DMDHEU. Eur. J. Wood Wood Prod. 2012, 70, 165–176. [Google Scholar] [CrossRef]
  92. Acosta, A.P.; Zanatta, P.; Gallio, E.; Freire, N.; Lazarotto, M.; Jardim, P.L.G.; Gatto, D.A.; Moreira, M.L. TiO2-Modified Pinus Elliottii: A Pine Wood Presenting Increased Resistance to Water and Ultraviolet Radiation. Maderas Cienc. Tecnol. 2021, 23, 1–12. [Google Scholar] [CrossRef]
  93. Mahović Poljaček, S.; Tomašegović, T.; Leskovšek, M.; Stanković Elesini, U. Effect of SiO2 and TiO2 nanoparticles on the performance of uv visible fluorescent coatings. Coatings 2021, 11, 928. [Google Scholar] [CrossRef]
  94. Jnido, G.; Ohms, G.; Viöl, W. Deposition of TiO2 thin films on wood substrate by an air atmospheric pressure plasma jet. Coatings 2019, 9, 441. [Google Scholar] [CrossRef]
  95. Buyuksari, U.; Avci, E.; Ayrilmis, N.; Akkilic, H. Effect of pine cone ratio on the wettability and surface roughness of particleboard. BioResources 2010, 5, 1824–1833. [Google Scholar] [CrossRef]
  96. Ayrilmis, N.; Candan, Z.; Akbulut, T.; Balkiz, O.D. Effect of sanding on surface properties of medium density fiberboard. Drv. Ind. 2010, 61, 175–181. [Google Scholar]
  97. Kishino, M.; Nakano, T. Artificial weathering of tropical woods. Part 2: Color change. Holzforschung 2004, 58, 558–565. [Google Scholar] [CrossRef]
  98. Unsal, O.; Candan, Z.; Korkut, S. Wettability and roughness characteristics of modified wood boards using a hot-press. Ind. Crop. Prod. 2011, 34, 1455–1457. [Google Scholar] [CrossRef]
  99. Monni, J.; Alvila, L.; Pakkanen, T.T. Structural and physical changes in phenol-formaldehyde resol resin, as a function of the degree of condensation of the resol solution. Ind. Eng. Chem. Res. 2007, 46, 6916–6924. [Google Scholar] [CrossRef]
  100. Lopes, J.d.O.; Garcia, R.A.; do Nascimento, A.M. Wettability of the surface of heat-treated juvenile teak wood assessed by drop shape analyzer. Maderas Cienc. Tecnol. 2018, 20, 249–256. [Google Scholar] [CrossRef]
  101. Piao, C.; Winandy, J.E.; Shupe, T.F. From Hydrophilicity To Hydrophobicity: A Critical Review: Part I. Wettability and Surface Behavior. Wood Fiber Sci. 2010, 42, 490–510. [Google Scholar]
  102. Van Chu, T.; Van Chuong, P.; Tuong, V.M. Wettability of Wood Pressure-treated with TiO2 Gel under Hydrothermal Conditions. BioResources 2014, 9, 2396–2404. [Google Scholar] [CrossRef]
  103. Mashtalyar, D.V.; Imshinetskiy, I.M.; Nadaraia, K.V.; Gnedenkov, A.S.; Suchkov, S.N.; Opra, D.P.; Pustovalov, E.V.; Yu Ustinov, A.; Sinebryukhov, S.L.; Gnedenkov, S.V. Effect of TiO2 nanoparticles on the photocatalytic properties of PEO coatings on Mg alloy. J. Magnes. Alloys 2023, 11, 735–752. [Google Scholar] [CrossRef]
  104. Ogata, K.; Fujii, T.; Abe, H.; Baas, P. Identification of the Timbers of Southeast Asia and the Western Pacific; Kaiseisha Press: Tsukuba, Japan, 2008; Volume 62, p. 765. [Google Scholar] [CrossRef]
  105. Tsang, C.H.A.; Li, K.; Zeng, Y.; Zhao, W.; Zhang, T.; Zhan, Y.; Xie, R.; Leung, D.Y.C.; Huang, H. Titanium oxide based photocatalytic materials development and their role of in the air pollutants degradation: Overview and forecast. Environ. Int. 2019, 125, 200–228. [Google Scholar] [CrossRef] [PubMed]
  106. Sivaramalingam, A.; Thankaraj Salammal, S.; Soosaimanickam, A.; Sakthivel, T.; Paul David, S.; Sambandam, B. Role of TiO2 in Highly Efficient Solar Cells BT—Metal, Metal-Oxides and Metal Sulfides for Batteries, Fuel Cells, Solar Cells, Photocatalysis and Health Sensors; Rajendran, S., Karimi-Maleh, H., Qin, J., Lichtfouse, E., Eds.; Springer International Publishing: Cham, Switzerland, 2021; pp. 147–168. ISBN 978-3-030-63791-0. [Google Scholar]
  107. Udrea, M.; Ion, R.-M. Modelling of Methylene Blue Dye Adsorption on Beech and Fir Wood Sawdust as Adsorbent Support Materials. J. Sci. Arts 2019, 19, 675–686. [Google Scholar]
  108. Vidholdová, Z.; Slabejová, G.; Šmidriaková, M. Quality of Oil- and Wax-Based Surface Finishes on Thermally Modified Oak Wood. Coatings 2021, 11, 143. [Google Scholar] [CrossRef]
  109. Lou, F.; Qian, X.; Jin, Y.; Zhou, M. Characterisation of water-soluble TiO2 and its photocatalytic activity under visible light. Mater. Res. Innov. 2015, 19, S8-693–S8-696. [Google Scholar] [CrossRef]
  110. Hart, H.; Hadad, C.M.; Craine, L.E.; Hart, D.J. Organic Chemistry: A Short Course; Cengage Learning: Boston, MA, USA, 2011; ISBN 9781133172833. [Google Scholar]
  111. Vartanian, E.; Barres, O.; Roque, C. FTIR spectroscopy of woods: A new approach to study the weathering of the carving face of a sculpture. Spectrochim. Acta Part A Mol. Biomol. Spectrosc. 2014, 136PC, 1255–1259. [Google Scholar] [CrossRef]
  112. Hazarika, A.; Maji, T.K. Properties of softwood polymer composites impregnated with nanoparticles and melamine formaldehyde furfuryl alcohol copolymer. Polym. Eng. Sci. 2014, 54, 1019–1029. [Google Scholar] [CrossRef]
Figure 1. Particle distribution (a) and zeta potential (b) of TiO2-NPs synthesised via the hydrothermal method.
Coatings 13 01924 g001
Figure 2. FTIR spectrum of TiO2-NPs.
Coatings 13 01924 g002
Figure 3. Diffractogram of the synthesised TiO2-NPs.
Coatings 13 01924 g003
Figure 4. Absorption spectrum of the synthesised TiO2-NPs.
Coatings 13 01924 g004
Figure 5. Band gap analysis curve of the TiO2-NPs using the Tauc method. Black line (a) is plotting graph of the (αhυ)2 with hυ value and red line (b) is the extrapolation in the linear area across the energy.
Coatings 13 01924 g005
Figure 6. Crystal structure of anatase TiO2-NPs with a 3D spacefill pattern (a) single unit and (b) atomic packing in tetragonal crystal structure. a, b, c, and o are the notations for a 3D coordinate system containing the origin (o) and three mutually perpendicular coordinate axes: x-axis (a), y-axis (b), and z-axis (c).
Coatings 13 01924 g006
Figure 7. (a) L value, (b) a value, and (c) b value for uncoated and coated mangium wood during a weathering test lasting 4 months, with tests at 0, 2, and 4 months. V1 and V2 denote oil- and water-based varnishes applied to the wood, respectively. CT1, CT5, and CT10 denote 1, 5, and 10% concentrations of TiO2 nanoparticles in the coating. Note: The letters (a, b, etc.) and numbers (1, 2, etc.) followed by the same letters and numbers do not differ significantly (α = 0.05) based on the Duncan multiple-range test.
Coatings 13 01924 g007
Figure 8. Total colour change for uncoated and coated mangium wood after a weathering test lasting 0, 2, and 4 months. V1 and V2 denote oil- and water-based varnishes applied to the wood, respectively. CT1, CT5, and CT10 denote 1, 5, and 10% concentrations of TiO2 nanoparticles in the coating. Note: The letters (a, b, etc.) and numbers (1, 2, etc.) followed by the same letters and numbers do not differ significantly (α = 0.05) based on the Duncan multiple-range test.
Coatings 13 01924 g008
Figure 9. Colours of uncoated and coated mangium wood during the weathering test lasting 4 months for uncoated and different coated mangium samples.
Coatings 13 01924 g009
Figure 10. Surface roughness for uncoated and coated mangium wood during the weathering test. V1 and V2 denote oil- and water-based varnishes applied to the wood, respectively. CT1, CT5, and CT10 denote 1, 5, and 10% concentrations of TiO2 nanoparticles in the coating. Note: The letters (a, b, etc.) and numbers (1, 2, etc.) followed by the same letters and numbers do not differ significantly (α = 0.05) based on the Duncan multiple-range test.
Coatings 13 01924 g010
Figure 11. (a) Microscopic cross section of an uncoated mangium wood sample (100×), (b) Microscopic tangential section (100×), (c) Microscopic radial section (100×), (d) Macroscopic cross-section (100×), (e) Macroscopic tangential section (200×), and (f) Macroscopic radial section (200×).
Coatings 13 01924 g011
Figure 12. Macroscopic images (100×) of the (a) uncoated, (b) V2, (c) V2-CT1, (d) V2-CT5, (e) V2-CT10, (f) V1, (g) V1-CT1, (h) V1-CT5, and (i) V1-CT10 mangium wood samples.
Coatings 13 01924 g012
Figure 13. Graph illustrating the MB degradation ability for the uncoated and nanocoated mangium wood samples.
Coatings 13 01924 g013
Figure 14. Energy consumption of the photocatalyst activity process on mangium samples subjected to weathering.
Coatings 13 01924 g014
Figure 15. FTIR spectra of wood samples with (a) an oil-based coating base (V1) and (b) a water-based coating base (V2) before and after weathering.
Coatings 13 01924 g015
Figure 16. Index ratio in the FTIR spectral bands of nanocoating-treated wood functional groups for the (a) oil-based coating and (b) water-based coating mangium wood samples.
Coatings 13 01924 g016
Table 1. Effect of the difference in the value of ΔE [37].
Colour Change (ΔE)Effect
<2.0Not visible
2.0–1.0Very low
1.0–3.0Low
3.0–6.0Moderate
>6.0High
Table 2. Equilibrium contact angle, θe, and the K-value of the uncoated and coated mangium wood samples during the weathering test.
Treatment0 Months2 Months4 Months
ΘeKθeKΘeK
Uncoated51.1 ± 0.4a31.2 ± 0.0e119.4 ± 0.6a21.5 ± 0.0e216.3 ± 0.6a11.6 ± 0.0e3
V172.2 ± 0.2d30.3 ± 0.0b160.2 ± 0.0d20.3 ± 0.0b254.5 ± 5.9d10.5 ± 0.1b3
V1-CT171.0 ± 0.4c30.3 ± 0.1b131.9 ± 0.6c20.4 ± 0.0b229.2 ± 0.6c10.6 ± 0.03b3
V1-CT570.3 ± 0.1c30.4 ± 0.0c129.9 ± 7.4c20.5 ± 0.3c227.8 ± 2.0c10.7 ± 0.0c3
V1-CT1065.4 ± 0.3b30.5 ± 0.0d122.1± 0.51b20.5 ± 0.2d222.4 ± 4.4b10.9 ± 0.0d3
V281.7 ± 0.2g30.0 ± 0.0a173.9 ± 0.7g20.0 ± 0.0a273.7 ± 1.1g10.0 ± 0.0a3
V2-CT178.9 ± 0.0f30.0 ± 0.0a172.4 ± 0.7f20.0 ± 0.0a268.7 ± 0.1f10.0 ± 0.0a3
V2-CT576.1 ± 1.2e30.0 ± 0.0a167.5 ± 3.6e20.0 ± 0.0a264.0 ± 0.7e10.0 ± 0.0a3
V2-CT1073.4 ± 0.5e30.0 ± 0.0a165.5 ± 0.3e20.0 ± 0.0a260.8 ± 0.0e10.0 ± 0.0a3
Note: The letters (a, b, etc.) and numbers (1, 2, etc.) followed by the same letters and numbers do not differ significantly (α = 0.05) based on the Duncan multiple-range test.
Disclaimer/Publisher’s Note: The statements, opinions and data contained in all publications are solely those of the individual author(s) and contributor(s) and not of MDPI and/or the editor(s). MDPI and/or the editor(s) disclaim responsibility for any injury to people or property resulting from any ideas, methods, instructions or products referred to in the content.