Article

Investigation of Physical and Chemical Properties of Bitumen Modified with Waste Vegetable Oil and Waste Agricultural Ash for Use in Flexible Pavements

1
Department of Civil Engineering, Faculty of Engineering and Architecture, Erzincan Binali Yıldırım University, Erzincan 24002, Turkey
2
College of Engineering and Technology, American University of the Middle East, Egaila 54200, Kuwait
3
Department of Civil Engineering, Faculty of Engineering and Architecture, Erzurum Technical University, Erzurum 25100, Turkey
*
Author to whom correspondence should be addressed.
Coatings 2023, 13(11), 1866; https://doi.org/10.3390/coatings13111866
Submission received: 27 September 2023 / Revised: 27 October 2023 / Accepted: 29 October 2023 / Published: 31 October 2023

Abstract

:
The rapid growth of the world population and the rapid diversification of consumption habits due to technological advancements have increased waste production. An investigation of the effects of biomass products, such as waste vegetable oil and waste agricultural ash, on bitumen’s physical and chemical properties was conducted in this study. By recycling biomass products, this study aimed to improve the performance and stability of bituminous hot mixtures, optimize the number of additives, and create more economical designs. Using the Taguchi method, 0%, 2%, 4% by weight of waste vegetable oil and 0%, 3%, and 6% by weight of waste agricultural ash were added to 70/100 penetration pure bitumen with an orthogonal array of L9. For 10, 20, and 30 min, modified bitumen samples were prepared at 170 °C, 180 °C, and 190 °C with a constant mixing speed of 3000 RPM. The samples were tested for penetration, softening point, flash point, rolling thin film oven (RTFOT), FTIR, and Marshall Design stability and flow. Based on the obtained performance statistics, 95% confidence levels were assigned to the predictions. The stability and softening point values decreased as the oil content increased, while flash and penetration values increased. With increasing ash content, stability, flash, and softening point values increased, and penetration values decreased. Compared to oil and ash additives, mixing temperature and time had relatively little effect on the modification process. Overall, the optimum parameter levels were 4% for oil, 0% for ash, 170 °C for temperature, and 10 min for time.

1. Introduction

Global population has increased from about 2.5 billion in 1950 to almost 7.9 billion in 2021, a three-fold increase since the middle of the twentieth century. Based on estimates by the United Nations, the global population could reach almost 11 billion by 2050 [1].
The production of energy from renewable energy sources has become increasingly widespread to meet the increasing energy demand caused by rapid population growth worldwide. It is apparent from the directives of the European Directive 2009/28/EC for all member states of the European Union to obtain energy from renewable sources that the use of renewable energy sources is rapidly gaining in popularity [2].
In conjunction with population growth, people’s mobility needs are increasing, and there is a growing demand for flexible, accessible, modern, and sustainable transportation solutions. Road transportation, which occupies a superior position among modern transportation systems, continues to improve its speed, comfort, safety, convenience, and demand. Road transportation relies heavily on flexible pavements. A common form of construction material is asphalt binders, which are widely used in flexible pavements. Almost 100% of asphalt binder sources rely on imports in Europe. The total amount of asphalt produced in Europe between 2008 and 2020 is approximately 276.9 million tons, as given in Figure 1.
With the rapid development of urbanization and the dramatic increase in traffic loads, volumes, and speeds, permanent deformations of flexible pavements have increased significantly [4,5]. Flexible pavements should have high stability and performance, a long service life, and low repair costs. A flexible pavement should meet these expectations by eliminating significant defects, such as permanent deformations, fatigue cracks, cracks formed at low temperatures, water stripping of aggregate from the asphalt pavement, rutting and low strength. Bituminous binder, one of the flexible pavement materials, is generally modified to achieve these changes. As a result, certain additives are added to the asphalt or asphalt binder mixture in particular proportions and under certain conditions to improve the performance. Various materials have been used to develop modified bituminous mixtures in recent years to improve the performance of hot bituminous mixtures.
Alternative modified binders must be explored to ensure asphalt’s sustainability in the future [6,7,8]. Most renewable resources in the bitumen modification process come in biomass products, including waste cooking oils and agricultural ashes.
In energy production, biomass is derived from renewable resources, such as organic waste, vegetable oil waste, agricultural harvest residues, and by-products of processing agricultural and forestry products. As an environmentally friendly energy source, this type of energy is considered one of the most important energy sources for the future [9].
The waste of agricultural ash is obtained by burning woody and herbaceous plants derived from biomass products. It is essential in terms of its utility in the growing production of renewable energy worldwide. Because of its favorable chemical and physical properties, it can be used as a raw material in the construction industry. Consequently, it is not disposed of in rubbish tips or landfills and does not pose a health or environmental threat [10]. Waste agricultural ash is primarily used as a binder component or a filler material, depending on its modifiable properties [11].
Waste vegetable oils are produced from frying vegetable oils used in the food industry. Human nutrition relies heavily on vegetable cooking oils. With the increase in oil consumption, the problem of waste frying oils, which are classified as hazardous waste, naturally arises. There can be severe environmental consequences when the collection, transportation, and disposal of these oils cannot be ensured through the methods stipulated by the regulations [12]. Approximately 15 million tons of waste vegetable oil are produced yearly, but only a tiny percentage is properly disposed of and recycled [13].
Scientists have, therefore, been investigating ways to convert waste vegetable oil into energy or a secondary raw material. Producing large quantities of vegetable oil waste is not environmentally friendly; therefore, finding sustainable ways to use it requires the creation of an advantageous process [14].

1.1. Purpose and Importance of the Study

This study aimed to investigate the physical and chemical properties of asphalt binders for flexible pavements by modifying asphalt binders with waste vegetable oil and agricultural ash products. Various amounts of additives were added to the mixture at different percentages by weight of bitumen, at different temperatures, and at different mixing times. The penetration, softening, flash points, stability and flow values, chemical structure, and mass loss values were studied. The optimum parameters and levels were determined according to results obtained with the Taguchi method. It was found that the modifications made positively impacted the performance of the asphalt binder. Increasing energy costs have drawn attention to the relationship between energy and the economy in general. Most of the world’s energy needs are met by fossil fuels globally. This has some implications for the relationship between energy, environment, and climate change [15]. Through the sustainable use of biomass in the field of energy, countries strengthen their socio-economic structure by taking part in the transition to low-carbon economies, contributing to the reduction of foreign dependence on total energy consumption, utilizing unused wastes to create added value, providing employment, finding innovative solutions at a local level to energy needs, and reducing energy imports to improve the foreign trade balance. In this study, waste vegetable oil and waste agricultural ash, both sustainable materials, were used to enhance the performance of bitumen in most flexible highway pavements worldwide.

1.2. Literature Studies on Modifications of Bituminous Binders with Waste Vegetable Oil, Waste Agricultural Ash, and Other Modifiers
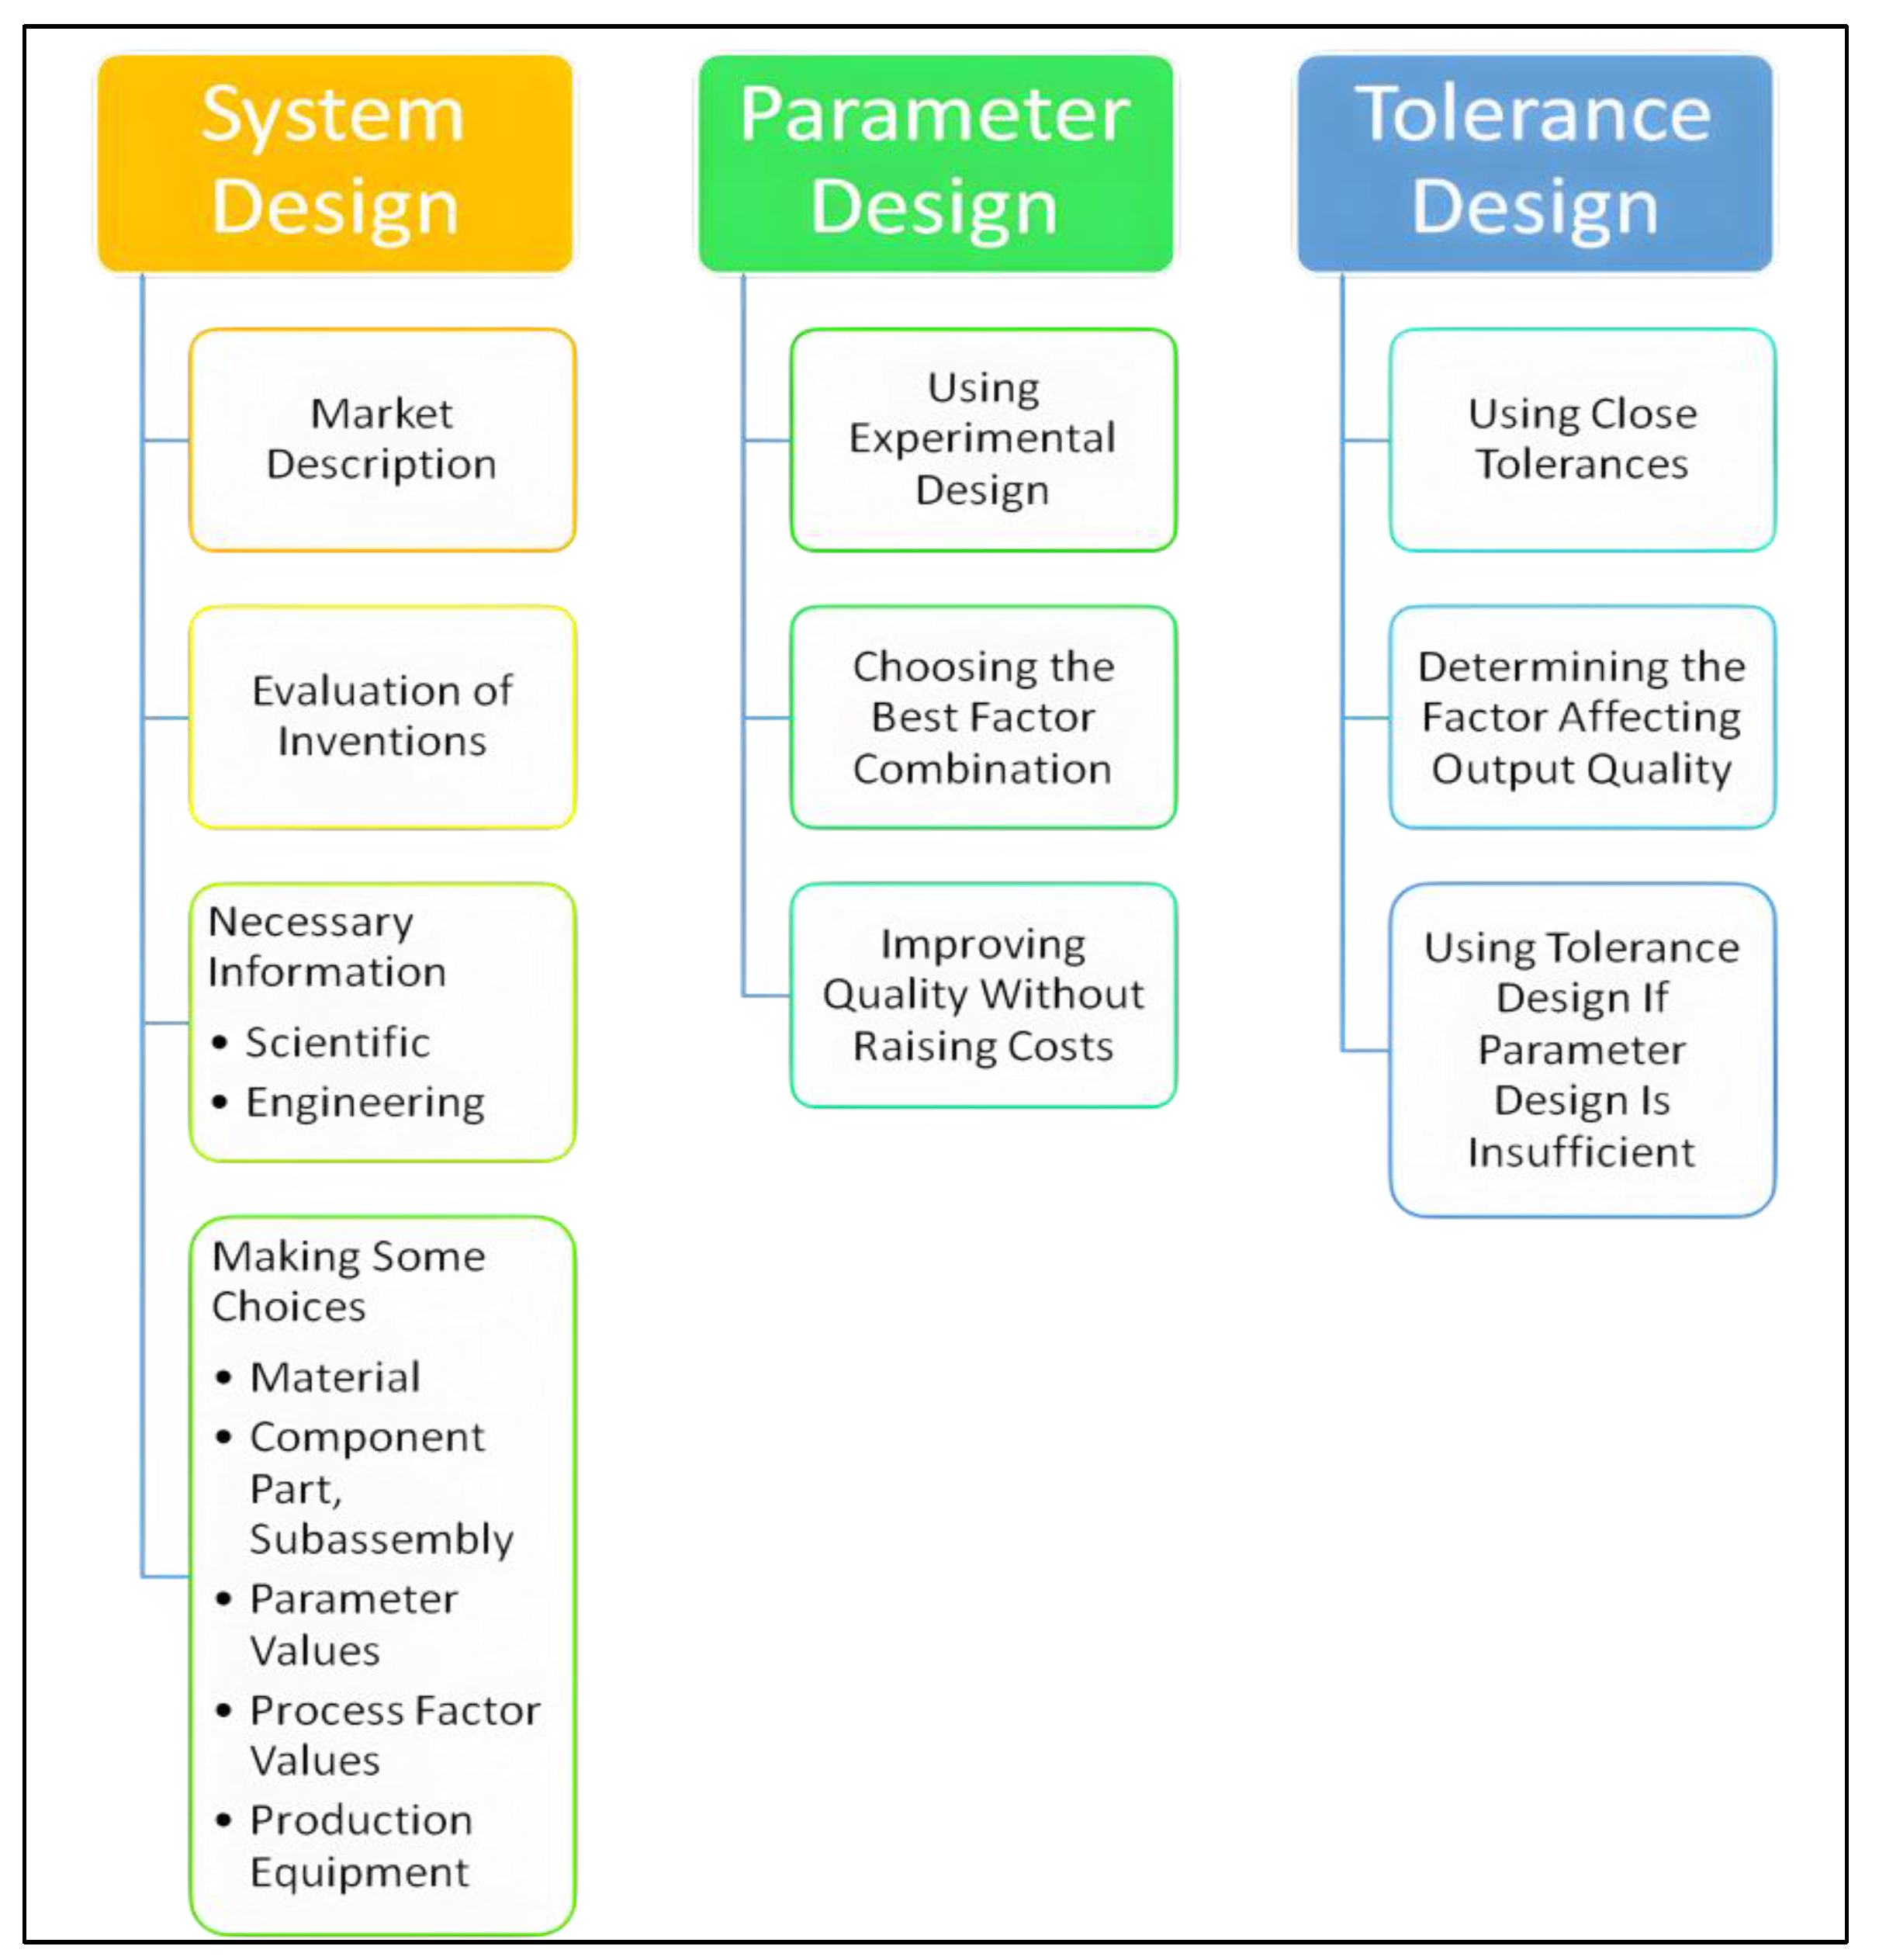
Numerous studies have concerned the effects of waste agricultural ash on bitumen properties and its use as a filler material to improve physical properties without forming chemical bonds. Xue et al. [16] modified bitumen using two biomass ashes (rice husk ash and sawdust ash). They examined whether the modified bitumen possessed specific physical properties, including viscosity, penetrability, and wear resistance. Based on their findings, they concluded that the ash and bitumen did not react chemically but physically mixed together. As a result, rice husk ash modified bitumen’s physical properties closer to expected performance values, and, as a consequence, the modified bitumen improved its resistance to deterioration at high temperatures. According to the researchers, using rice husk ash and sawdust ash in the modification increased rutting resistance.
Similarly, Abo-Shanab et al. [17] used agricultural ashes consisting of waste corn cobs, rice husks, and sugarcane fibers at 3, 5, 7, and 10% by weight to improve the performance of modified bitumen. A penetration test and a softening point test were conducted to investigate the physical properties of the modified bitumen, and a rotational viscometer test was conducted to investigate its viscosity. Therefore, they observed a decrease in penetration value, an increase in softening point value, a decrease in permanent deformation value at high temperatures, and a decrease in thermal cracking at low temperatures. Additionally, rutting resistance was observed to increase. They concluded that modified bitumen’s performance values were superior to pure bitumen’s.
As a modifier, Arabani and Esmaaeli [18] added peanut shell ash at 5%, 10%, 15%, and 20% of the total bitumen weight. A variety of tests were performed on bitumen, including a high-temperature storage stability test, rotational viscosity (RV) test, dynamic shear rheometer (DSR) test, and bending beam rheometer (BBR) test. Additionally, indirect tensile stiffness modulus (ITSM), repeated load axial (RLA), and indirect tensile fatigue (ITF) tests were performed. The mixture remained stable during storage at high temperatures when peanut shell ash was added up to 10% by weight. As a result of adding peanut shell ash to the asphalt binder, they also observed an increase in softening point, viscosity and rutting resistance, a decrease in penetration value, ductility, fatigue resistance, and low temperature cracking resistance, as well as an increase in mechanical performance.
Using rice husk ash and wood saw ash as biomass filler materials, Abbasalizadeh and Hesami [19] investigated their impact on asphalt binder performance. As a result, they observed that the mixture containing 75% rice husk ash and 25% limestone had higher Marshall stability and lower moisture sensitivity than the mixture containing 100% limestone. Furthermore, they observed that the mix with 25% wood saw ash and 75% limestone had the highest tensile strength. Therefore, they concluded that using biomass ashes instead of filler material improved the performance of hot asphalt mixes while ensuring sustainability.
Fareed et al. [20] used three nano agricultural waste ash types to modify the asphalt binder and mixture. A mixture of rice husk ash, sugarcane bagasse ash, and wheat straw ash was mixed with asphalt binder at 2, 4 and 6% by weight and tested for storage stability, Fourier transform infrared spectroscopy, penetration, softening point, ductility, performance rating and frequency sweep. According to their results, asphalt binder and mixture samples modified with 6% nano rice husk ash, 6% nano sugarcane bagasse ash, and 4% nano wheat straw ash demonstrated better resistance to rutting with negligible adverse effects on fatigue resistance [20].
The effect of waste oils on bitumen properties has been investigated for a long time. Many studies have been conducted on using waste oils to improve the processability of bitumen to save energy and improve its performance at low temperatures.
As part of their study, Li et al. [21] investigated the changes in bitumen properties due to adding soybean oil to bitumen modified with 4% SBS. The study concluded that adding soybean oil to SBS-modified bitumen gave better results at low and high temperatures, resulting in a higher softening point value than SBS-modified bitumen alone. As a result, there was an improvement in rutting resistance and fatigue crack resistance of soybean oil-modified bitumen, as well as a reduction in the cost of SBS-modified asphalt when soybean oil was added.
Additionally, Dong et al. [22] examined the performance of a compound prepared by adding SBH bio-asphalt obtained from castor oil, crumb rubber, and SBS bitumen. Their investigation found that bitumen with 15% SBH showed improved aging resistance and performance at high and low temperatures. The study by Yan et al. [23] investigated the effectiveness of using waste oil in rejuvenating aged asphalt and modified asphalt. As a result of the study, they observed that waste oil can restore the properties of aged asphalt except for the viscoelastic ratio. As part of their study, Zahoor et al. [24] collected the latest information regarding asphalt rejuvenation using WCO. The study provided information on the correlations between plant production methods and laboratory studies for producing high-content rejuvenated RAP mixtures (reclaimed asphalt pavements). The researchers also examined WCO, its chemical composition, and changes in its chemical properties under various degradation conditions (e.g., virgin and used cooking oil). The researchers observed that adding WCO to the asphalt binder enhanced fatigue and thermal cracking properties, but at the cost of rutting resistance unless further polymeric modification was applied. In their study, Li et al. [25] examined the effects of varying amounts of waste cooking oil (WCO) and waste engine oil (WEO) on the rejuvenation of old asphalt and the on-road performance of a 7% composite regenerator with different RAP contents. The study revealed that adding a suitable waste oil dosage could enhance the material’s conventional properties. Furthermore, they found that adding waste oil, which supported the lightweight components of aged asphalt, could restore the essential performance of asphalt to its original state at different aging levels. In their investigation, they observed that adding waste oil did not cause other chemical reactions; however, excessive addition would cause a decrease in the viscosity of asphalt, so they recommended that the amount of waste oil be 1~4%. Using waste cooking oil (WCO) as a warm mix asphalt (WMA) additive, Li et al. [26] modified a warm mix asphalt binder (WEAB) to reduce viscosity and extend construction time in their study. A comparison was made between WCO-modified WEABs and pure WEABs in terms of their viscosity, phase separation, viscoelasticity, thermostability, and mechanical properties. Thus, they observed that WCO significantly reduced the viscosity of WEAB and prolonged the production time of pure WEAB. A study by Ahmed and Hossain [27] examined the performance and adverse effects of WCO as a rejuvenator. In this study, they examined the performance of WCO-based asphalt and the possibility of its use as a rejuvenating agent in HMA mixtures, primarily when using RAP in the mixtures. Even though WCO was reported to be promising for improving many binder properties (such as ductility and fatigue resistance), many studies also indicated that WCO might adversely affect other properties (such as rutting resistance). Their report stated that a more comprehensive understanding of the optimal dosage rate for different percentages of RAP and WCO was needed at a basic level. In their study, Eriskin et al. [28] demonstrated that waste vegetable oil could be used as a binder modifier.
Additionally, some studies utilized waste cooking oil and ash as biomass products. Rahman et al. [29] investigated the effect of adding waste cooking oil, tire rubber powder, and palm oil fuel ash to reduce the amount of bitumen in a mix where palm oil fuel ash was applied as an additive. Laboratory experiments were conducted to verify the modified binders’ physical and rheological properties per AASHTO and ASTM standards. Based on the results of this research, they observed that up to 15% of bitumen could be replaced, producing equal or better performance in terms of stability, flow, and rutting resistance.
In literature studies, additives were added to bitumen at different rates, keeping parameters, such as mixing speed, temperature, and time, constant. Therefore, using the Taguchi Method, this study investigated the effects of varying mixing temperatures, mixing times, and waste oil and ash ratios on bitumen performance.

1.3. Taguchi Method

Studies in which more than one parameter is used together, and many experiments performed to determine the optimum parameters have adverse effects regarding the correct use of time and economy. The Taguchi Experimental Design Method can help properly use time and economy, optimize experimental processes, and increase product quality. This experimental design method tries to eliminate or minimize the variability of parameters that make changes in products or processes [30]. The use of Taguchi methods has given birth to the Taguchi club with the idea that achieving high-quality products, low cost, and profitability is the primary goal [31]. The Taguchi method is a powerful tool for the design of a high-quality system. The Taguchi method continues to be used successfully in engineering problems [32,33,34,35,36,37]. It provides an efficient and systematic approach to optimizing designs regarding performance and quality. Taguchi method is carried out in three stages as shown in Figure 2: System Design, Parameter Design, and Tolerance Design [38].

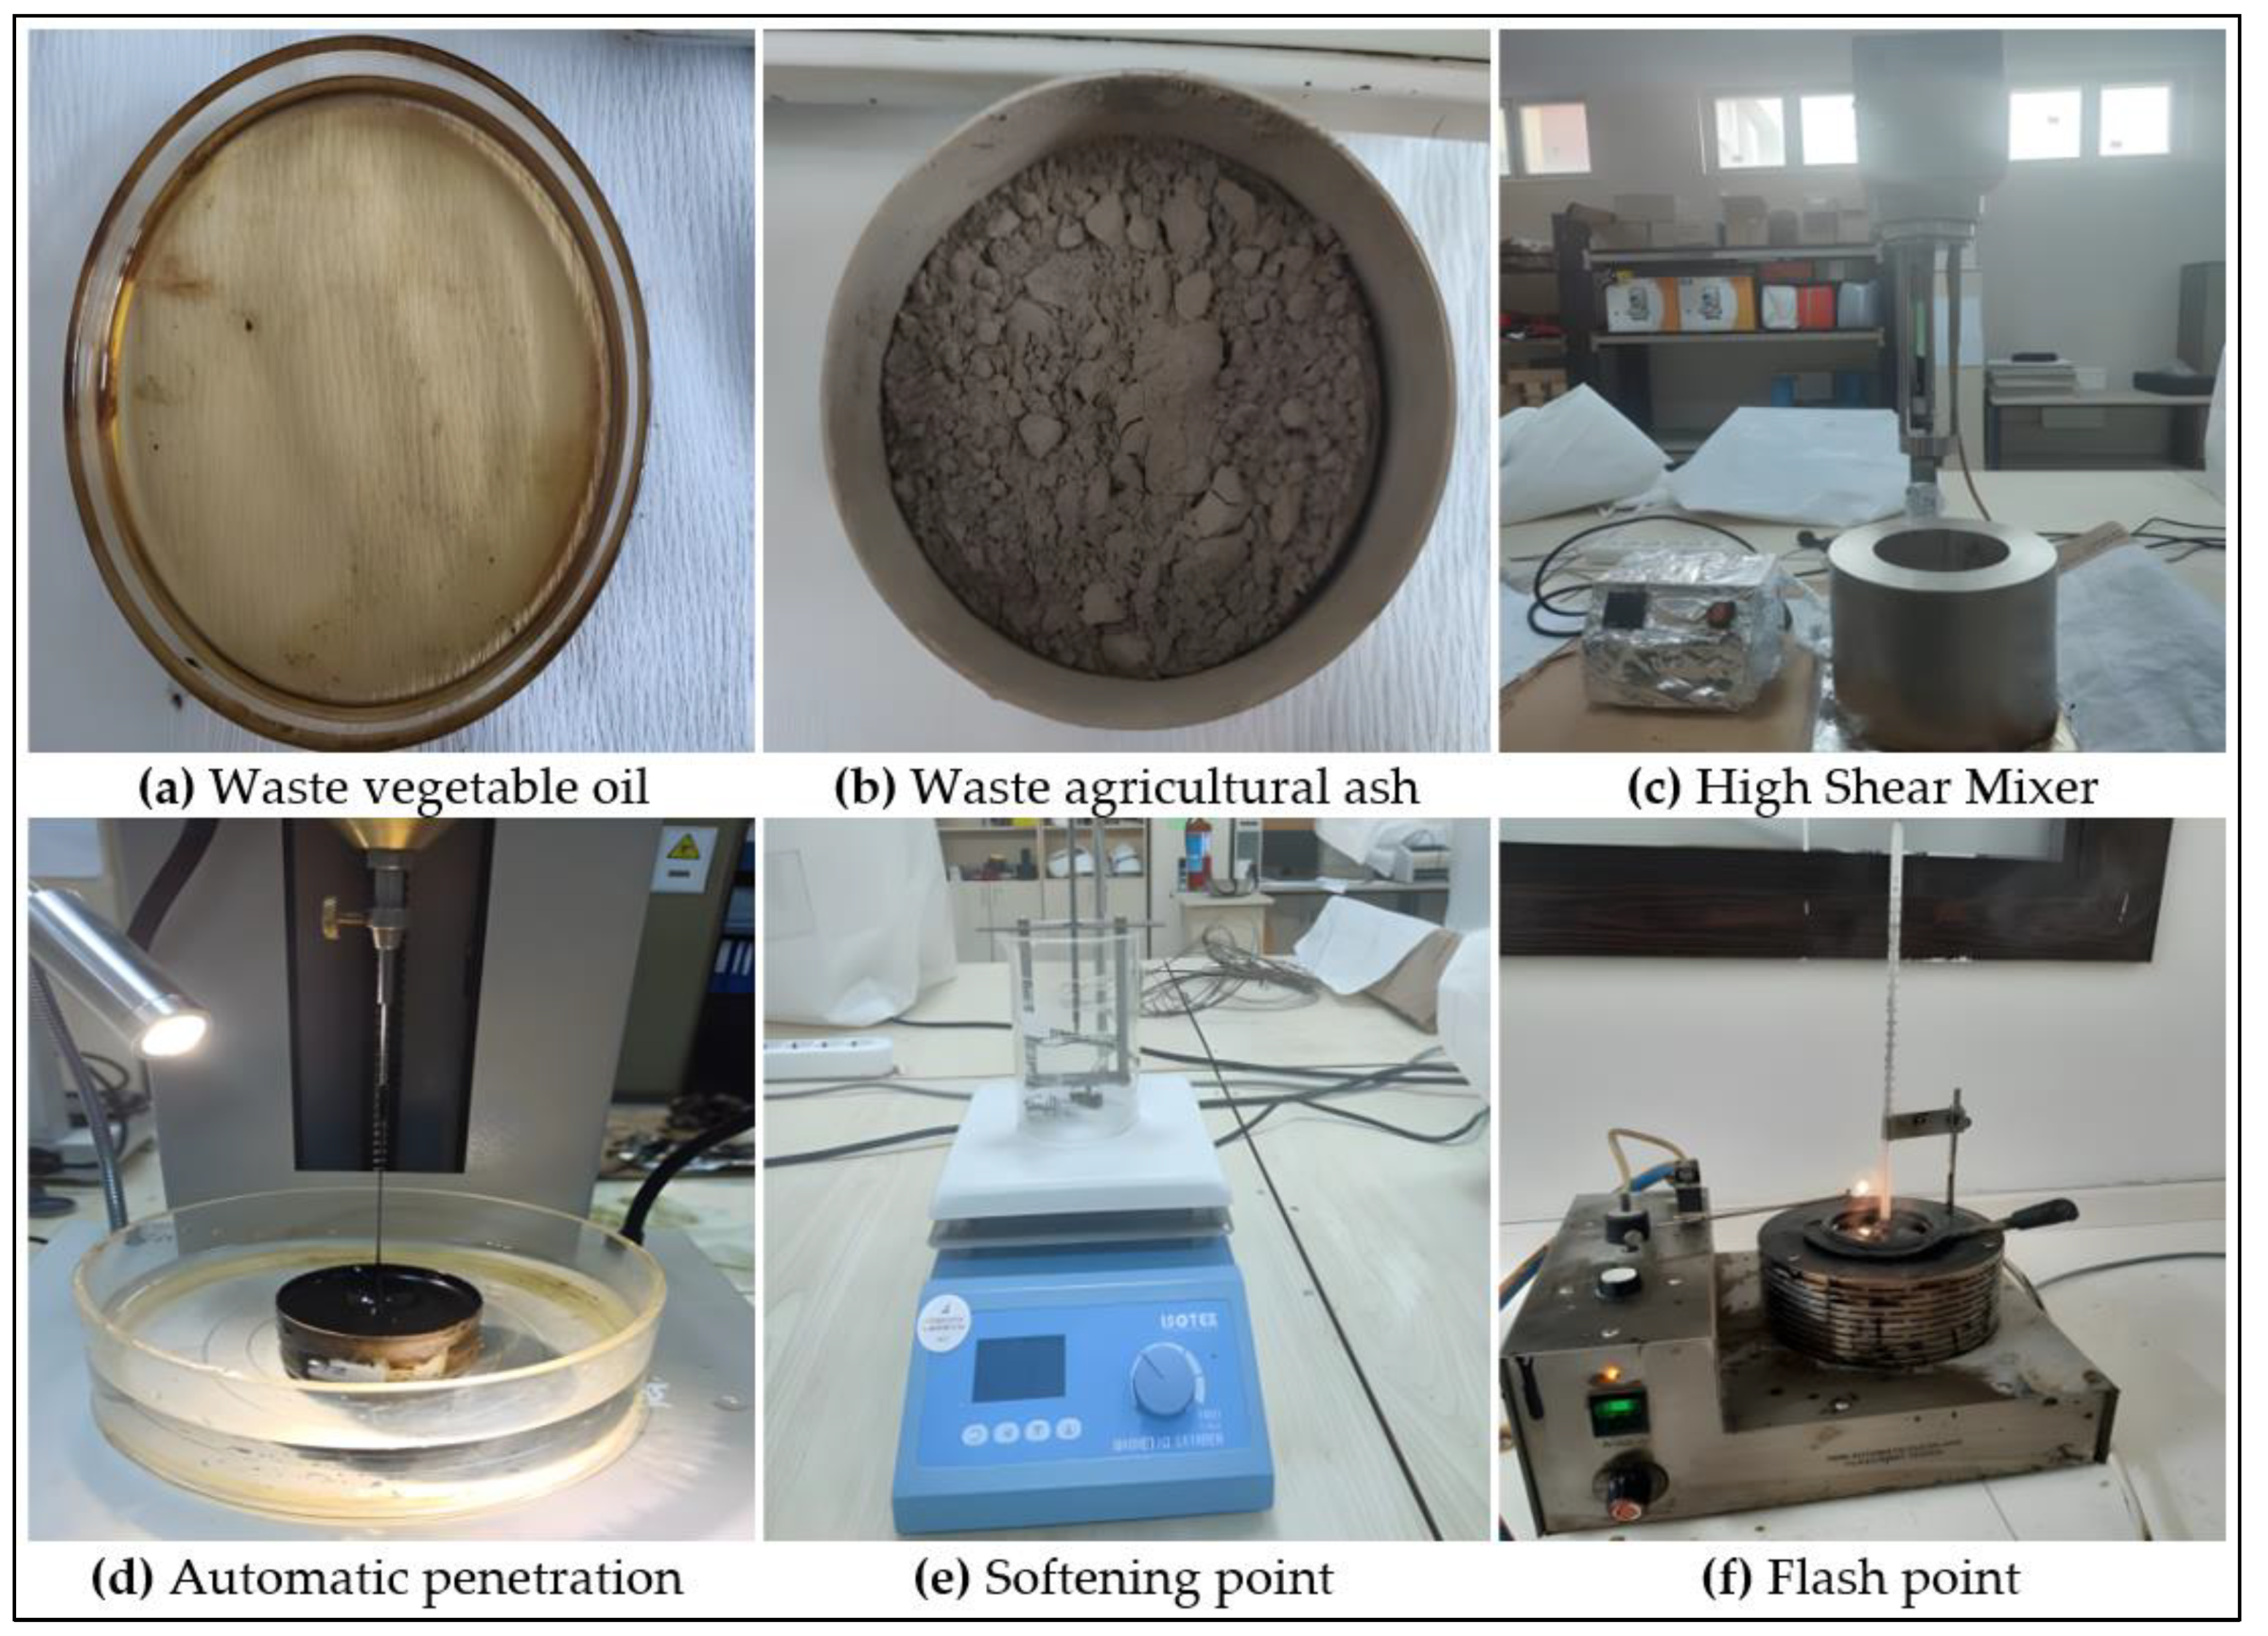
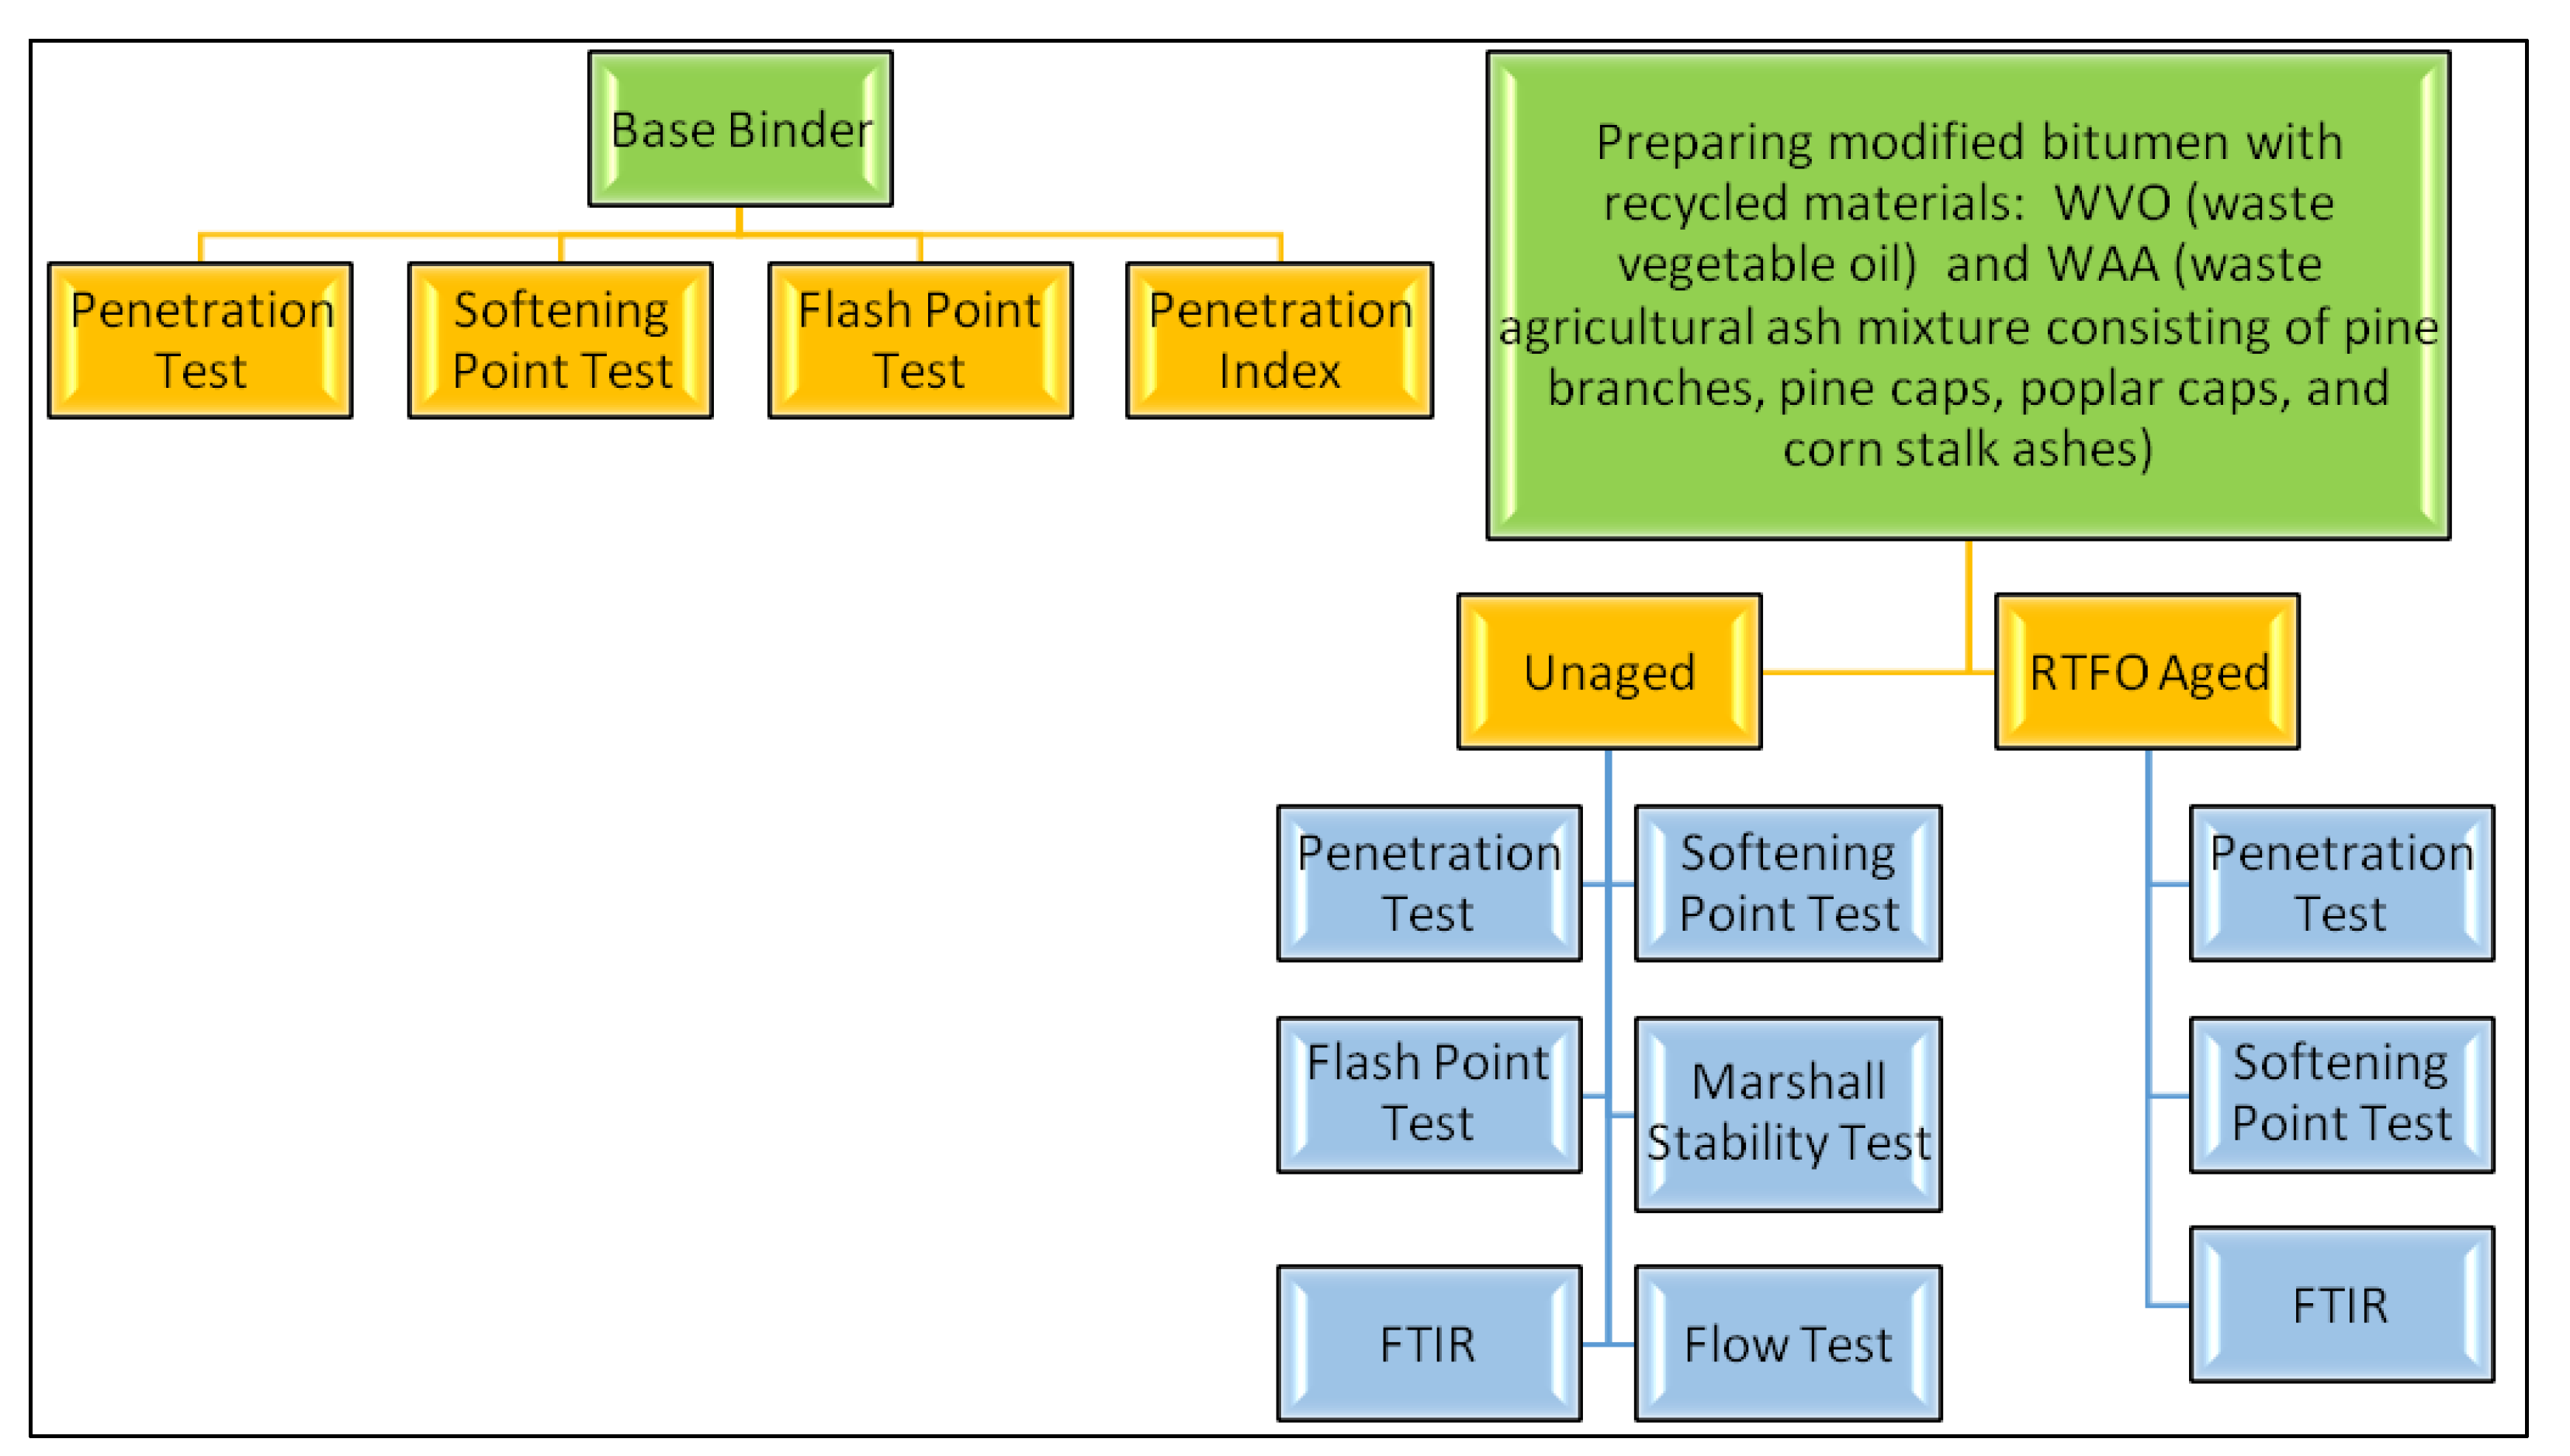
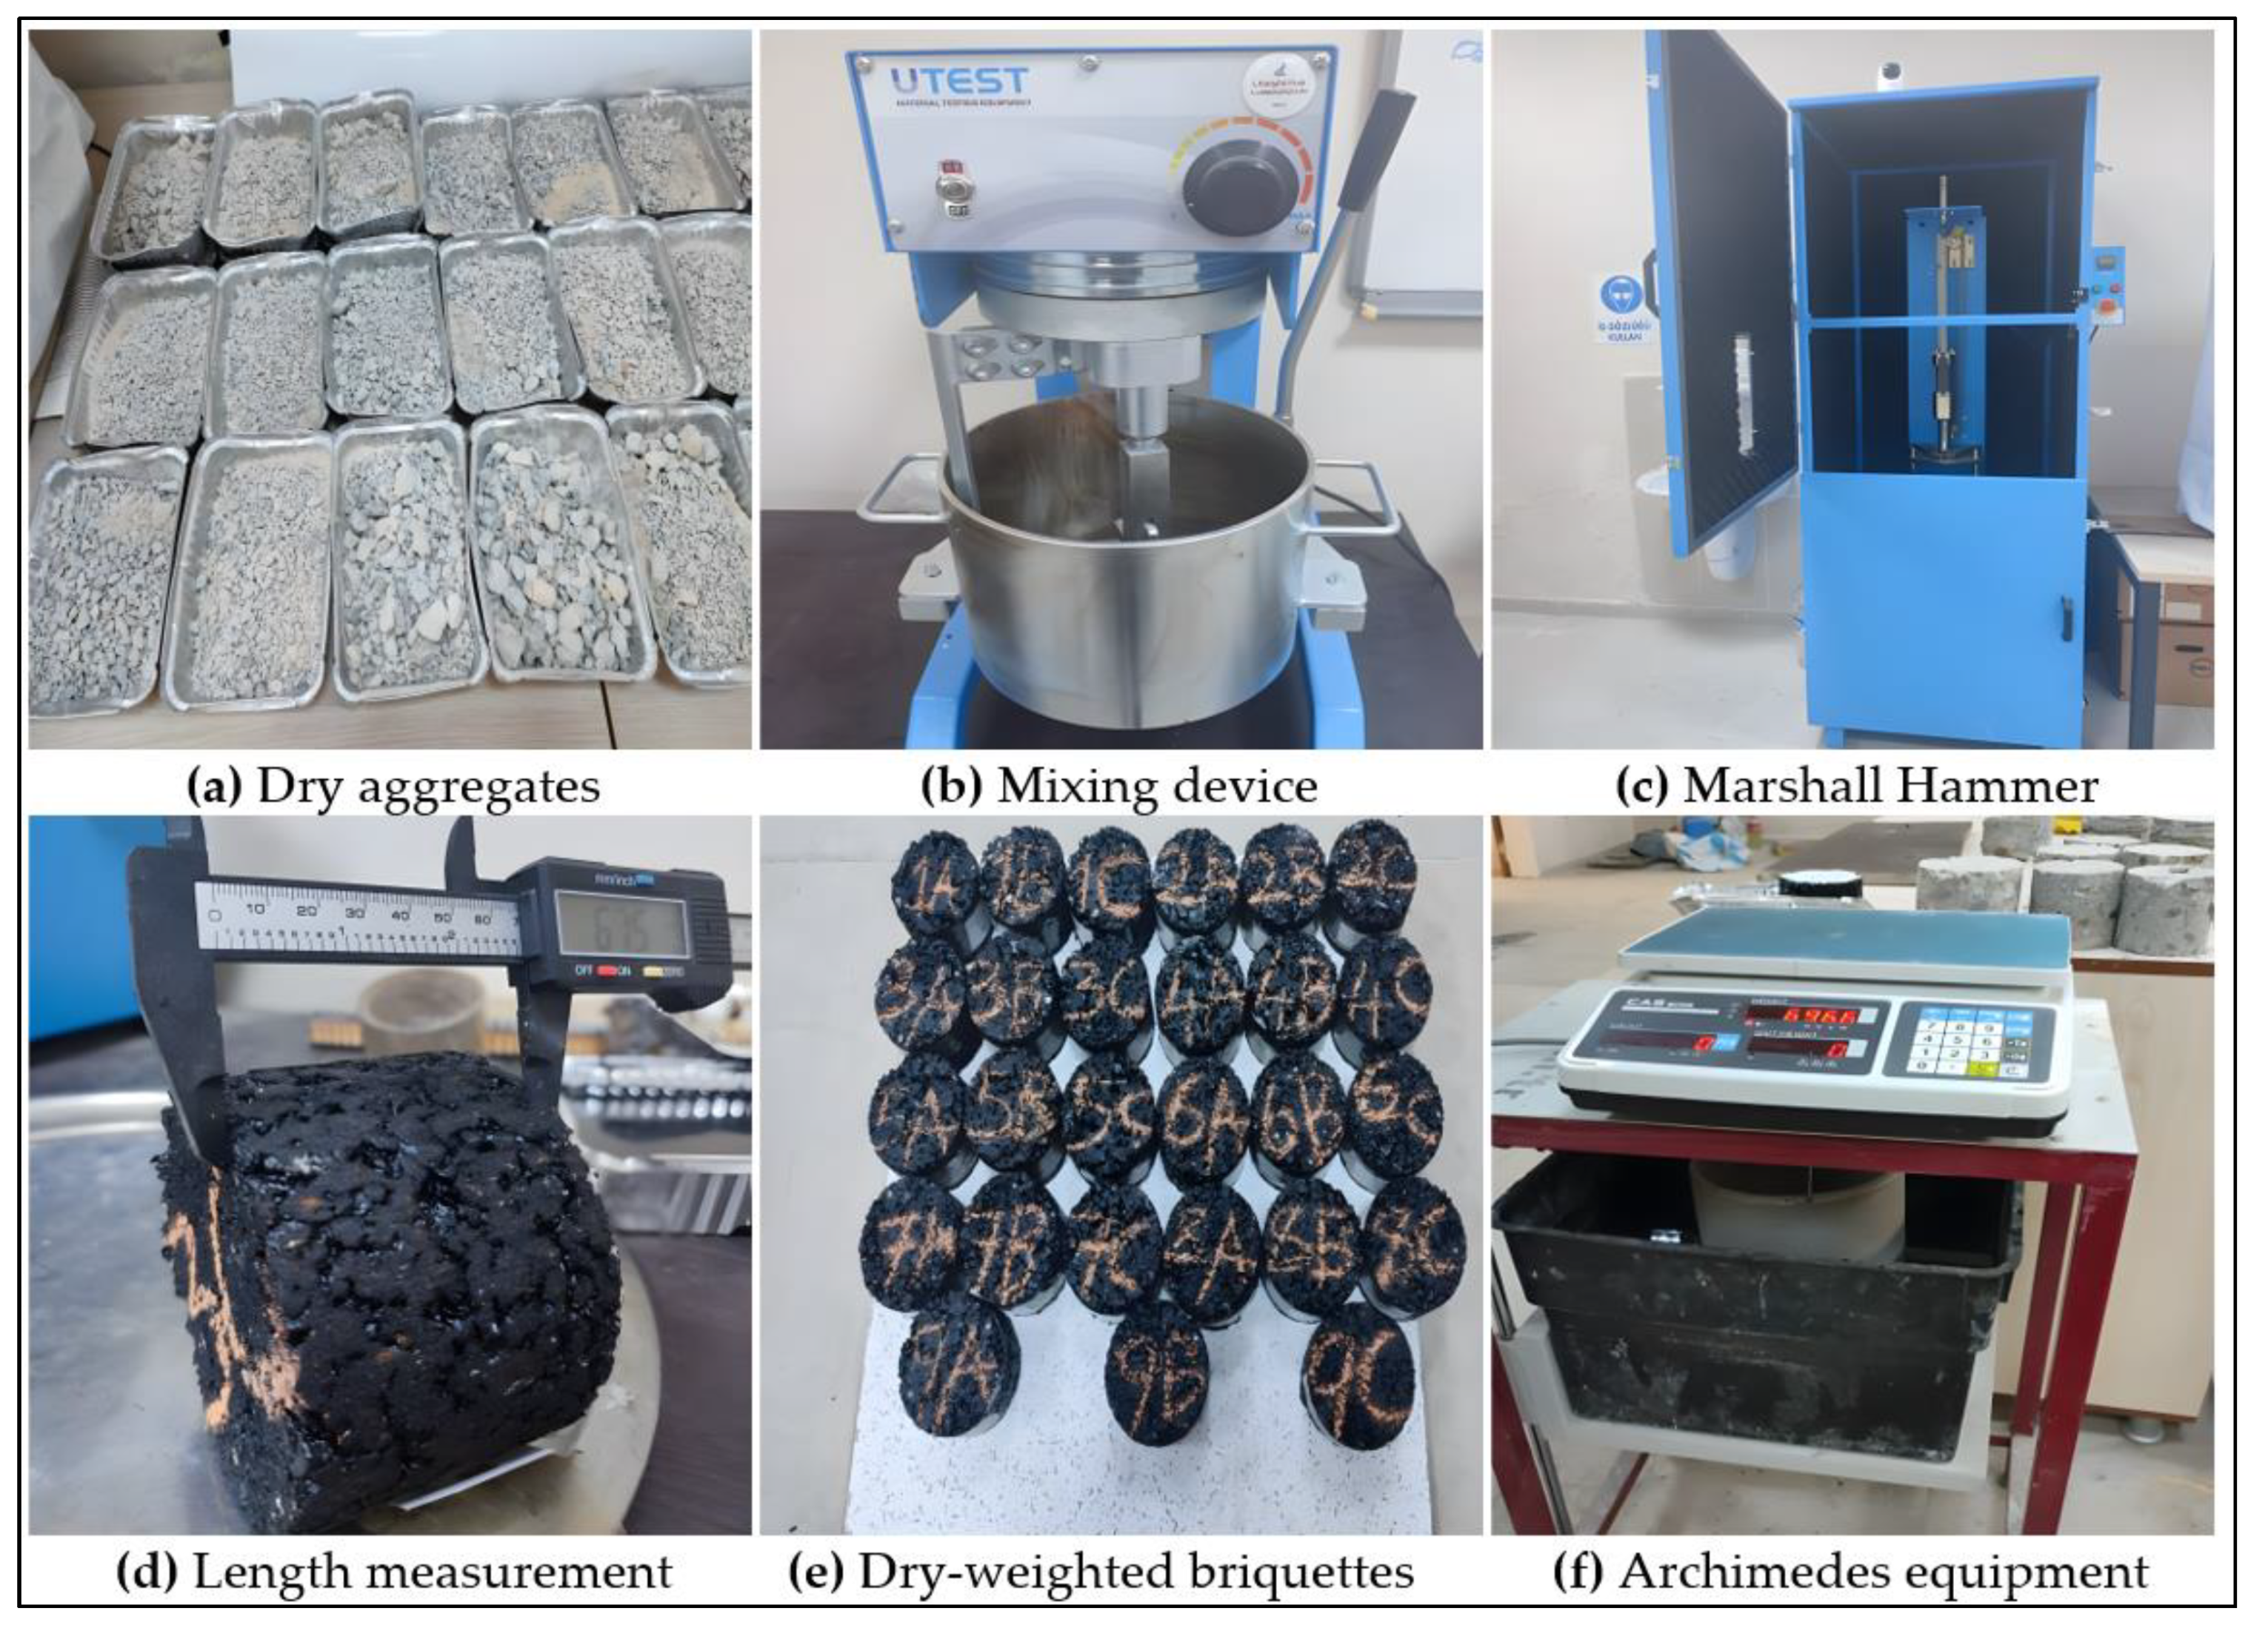
2. Materials and Methods

In the study, to investigate the effect of waste vegetable oil and waste agricultural ash on the physical and chemical properties of bitumen, the properties of pure bitumen were determined by conventional methods in order to be compared with modified bitumen and presented in Table 1. The properties of the aggregate used in the mixture were determined. Then, waste vegetable oil (as shown in Figure 3a) and waste agricultural ash mixture consisting of pine branches, pine caps, poplar caps, and corn stalk ashes (as shown in Figure 3b) were added to the bitumen to obtain modified binders and mixed in a High Shear Mixer (as shown in Figure 3c) at different temperatures and times. The physical and mechanical properties of the modified bitumen were determined by penetration (as shown in Figure 3d), softening point (as shown in Figure 3e), flash point (as shown in Figure 3f), and RTFOT tests. FTIR analysis was also performed to determine the chemical and morphological properties of the modified binders. Mixture samples were prepared using the Marshall design method with pure and modified binders to determine modifiers’ effects on bitumen’s performance properties. Marshall stability and flow tests were performed on these mix specimens. The additives used for bitumen modification, mixing temperatures, and times are presented in Table 2, and all modifications were mixed at 3000 revolutions per minute (RPM).

2.1. Experiments on Modified Bitumen

Experiments applied to pure bitumen and modified bitumen are shown in the flow chart in Figure 4.

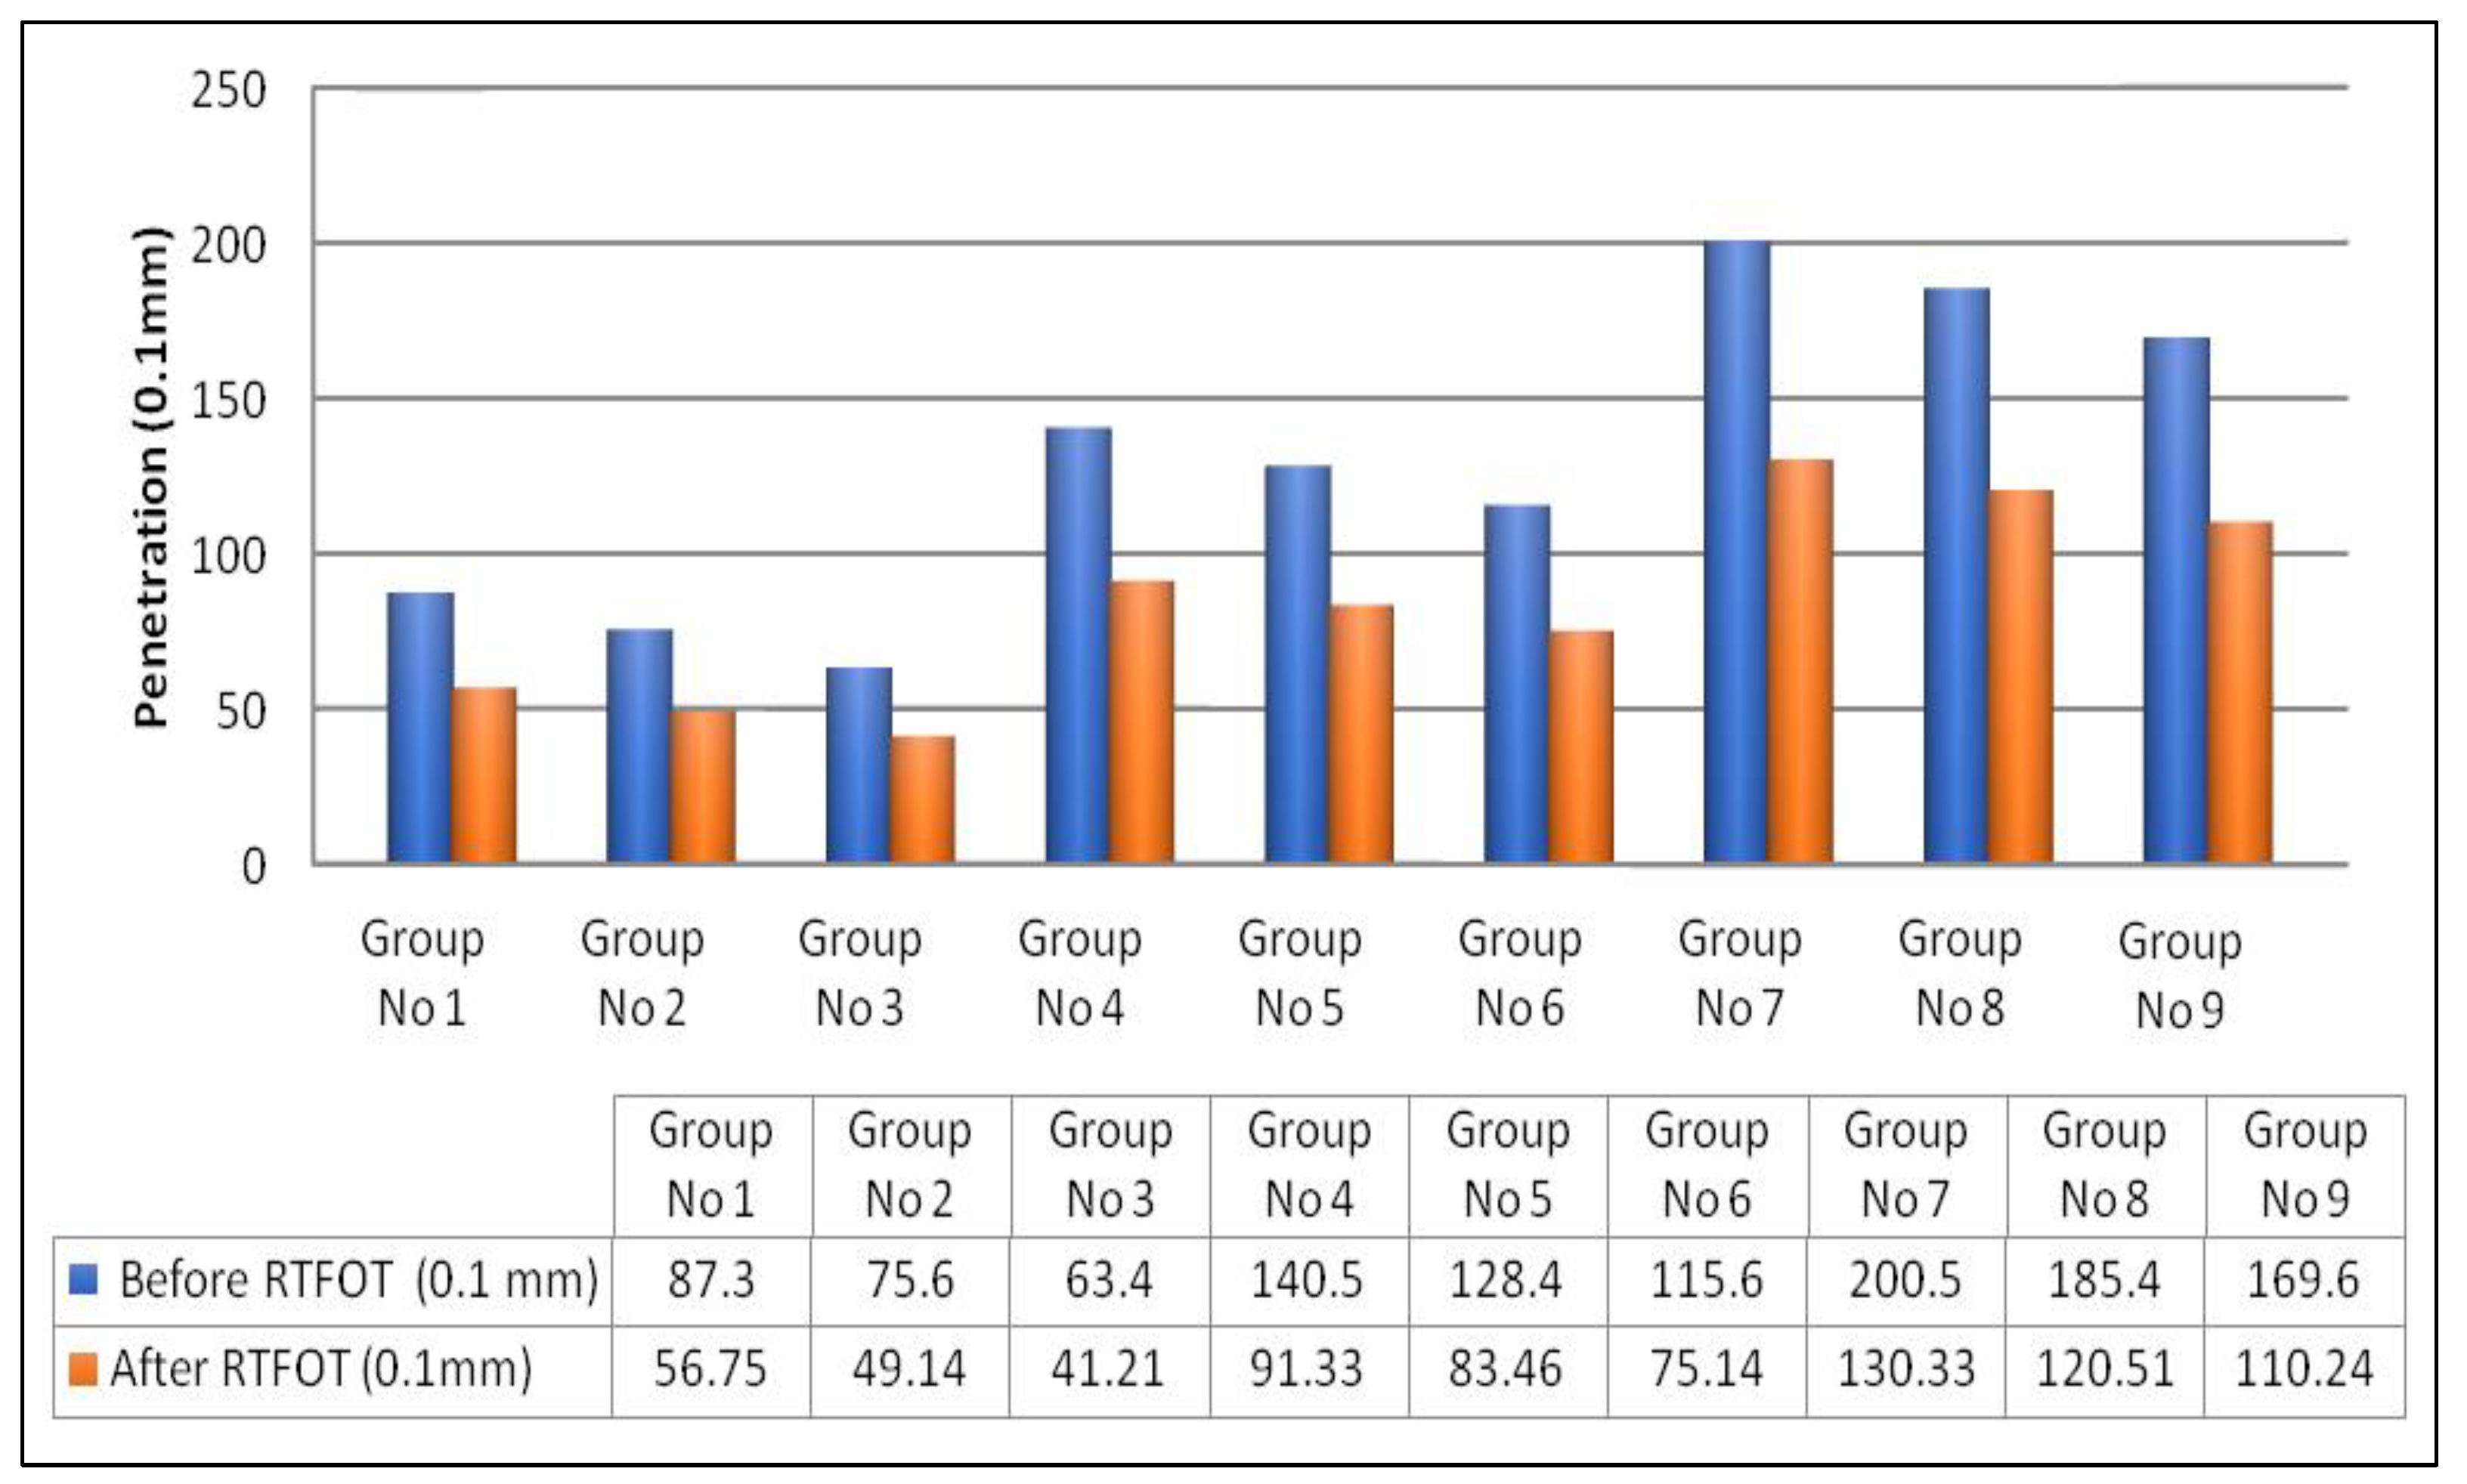
2.1.1. Penetration Test

The penetration test was performed according to TS EN 1426 standard. When the results of the modified bitumen in the first three experimental groups, where there was no waste vegetable oil additive and the amount of waste agricultural ash additive was increased by 0%-3%-6%, it was observed that the penetration value of the bitumen decreased as the percentage of ash added to the bitumen increased, as given in Figure 5. In the experimental groups 4-5-6, where the oil additive was 2%, and the ash additive was increased at the rates of 0%-3%-6%, it was observed that a 2% oil additive increased the penetration values by 160%-147%-132%, respectively, compared to the experimental group 1. In the experimental groups 7-8-9, where the oil additive was 4%, and the ash additive was increased by 0%-3%-6%, an oil additive of 4% increased the penetration values by 229%-2212%-1994%, respectively, compared to the experimental group 1.
Compared to the penetration values of pure bitumen, the penetration values of bitumen modified with oil and ash increased with increasing oil addition and decreased with increasing ash addition. Similarly, Eriskin et al. [28] concluded in their study that adding oil increased bitumen’s penetration value by up to 240%.
The post-RTFOT values were similar to the unaged bitumen; however, the penetration values decreased by approximately 35% in each experimental group compared to the pre-aging condition.

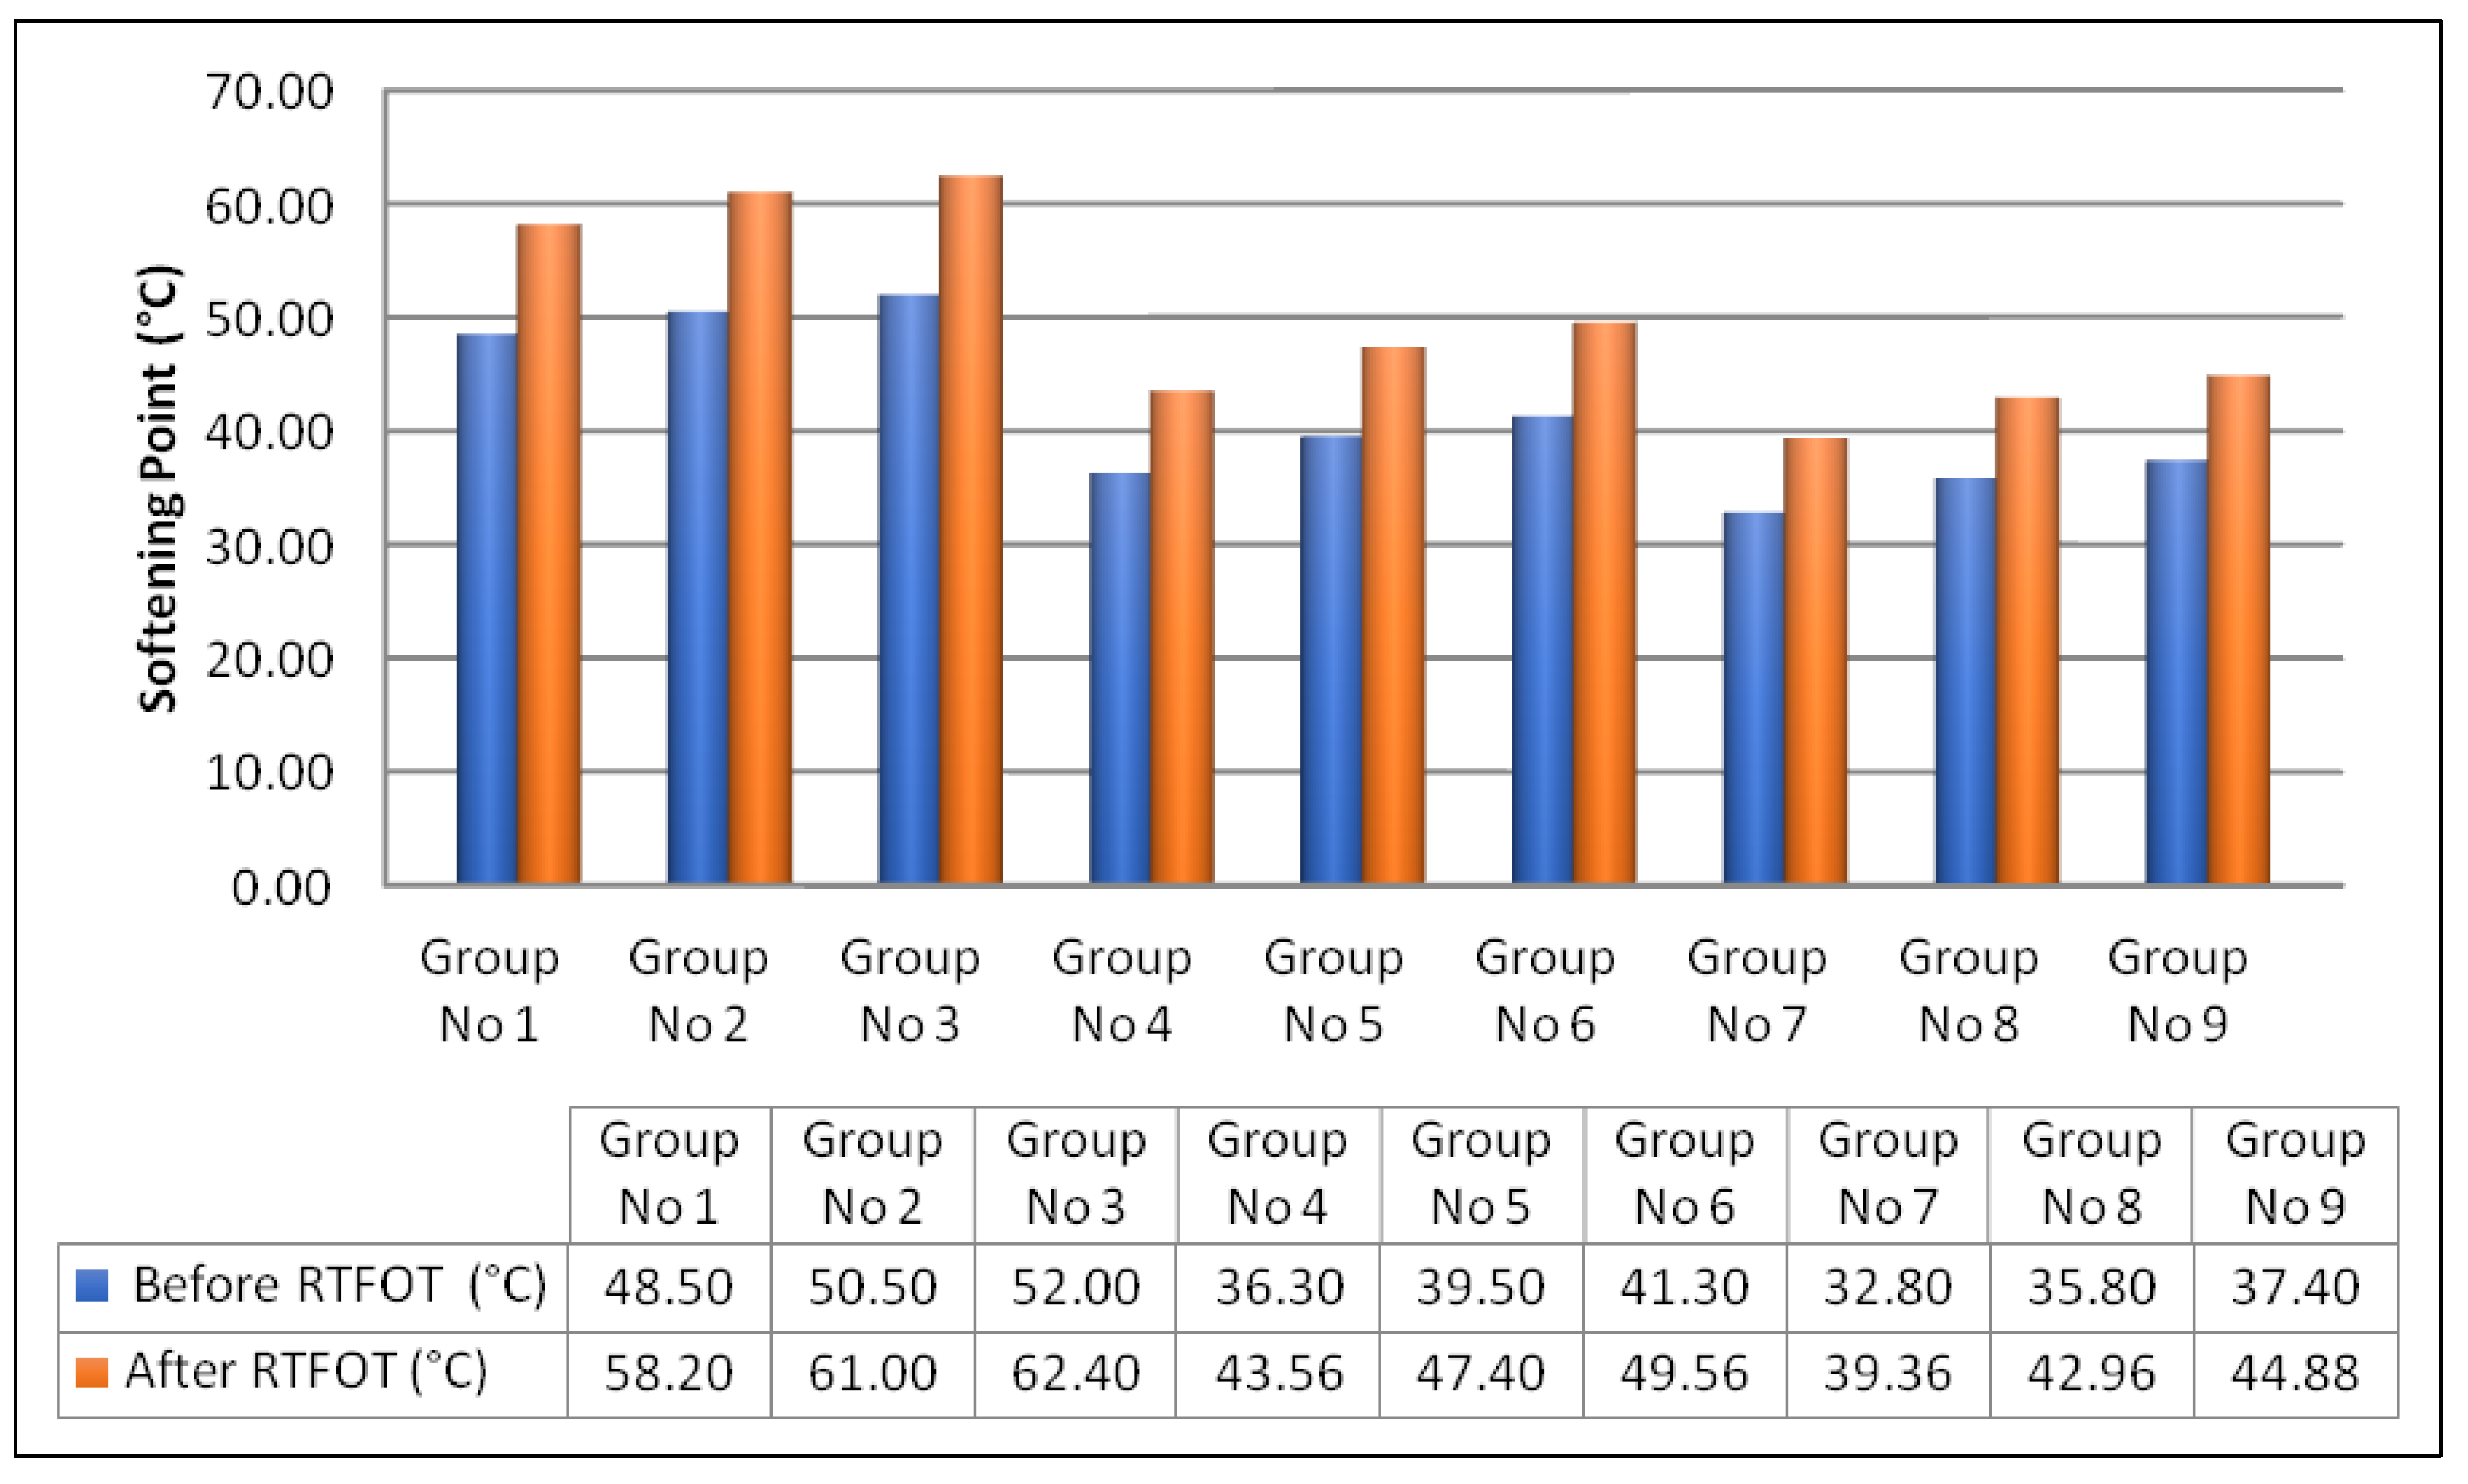
2.1.2. Softening Point Test

The softening point test was performed according to TS EN 1427 standard. With the results of the modified bitumen in the experimental groups 1-2-3, where there was no waste vegetable oil additive and the amount of waste agricultural ash additive was increased by 0%-3%-6%, it was observed that the softening point value of the bitumen increased as the percentage of ash added to the bitumen increased, as given in Figure 6. In the experimental groups 4-5-6, where the oil additive was 2%, and the ash additive was increased by 0%-3%-6%, it was observed that a 2% oil additive decreased the softening point values by 25%-18%-15%, respectively, compared to the experimental group 1. In the experimental groups 7-8-9, where the oil additive was 4%, and the ash additive was increased by 0%-3%-6%, it was observed that a 4% oil additive decreased the softening point values by 32%-26%-23%, respectively, compared to the experimental group 1.
Compared to the softening point values of pure bitumen, the softening point values of bitumen modified with oil and ash decreased with increasing oil addition and increased with increasing ash addition. Similarly, Gökalp et al. [12] concluded in their study that adding oil decreased the softening point value of bitumen. Similar results were obtained for the post-RTFOT values with the unaged bitumen; however, the softening point values increased by approximately 20% in each experimental group compared to the pre-aging condition.

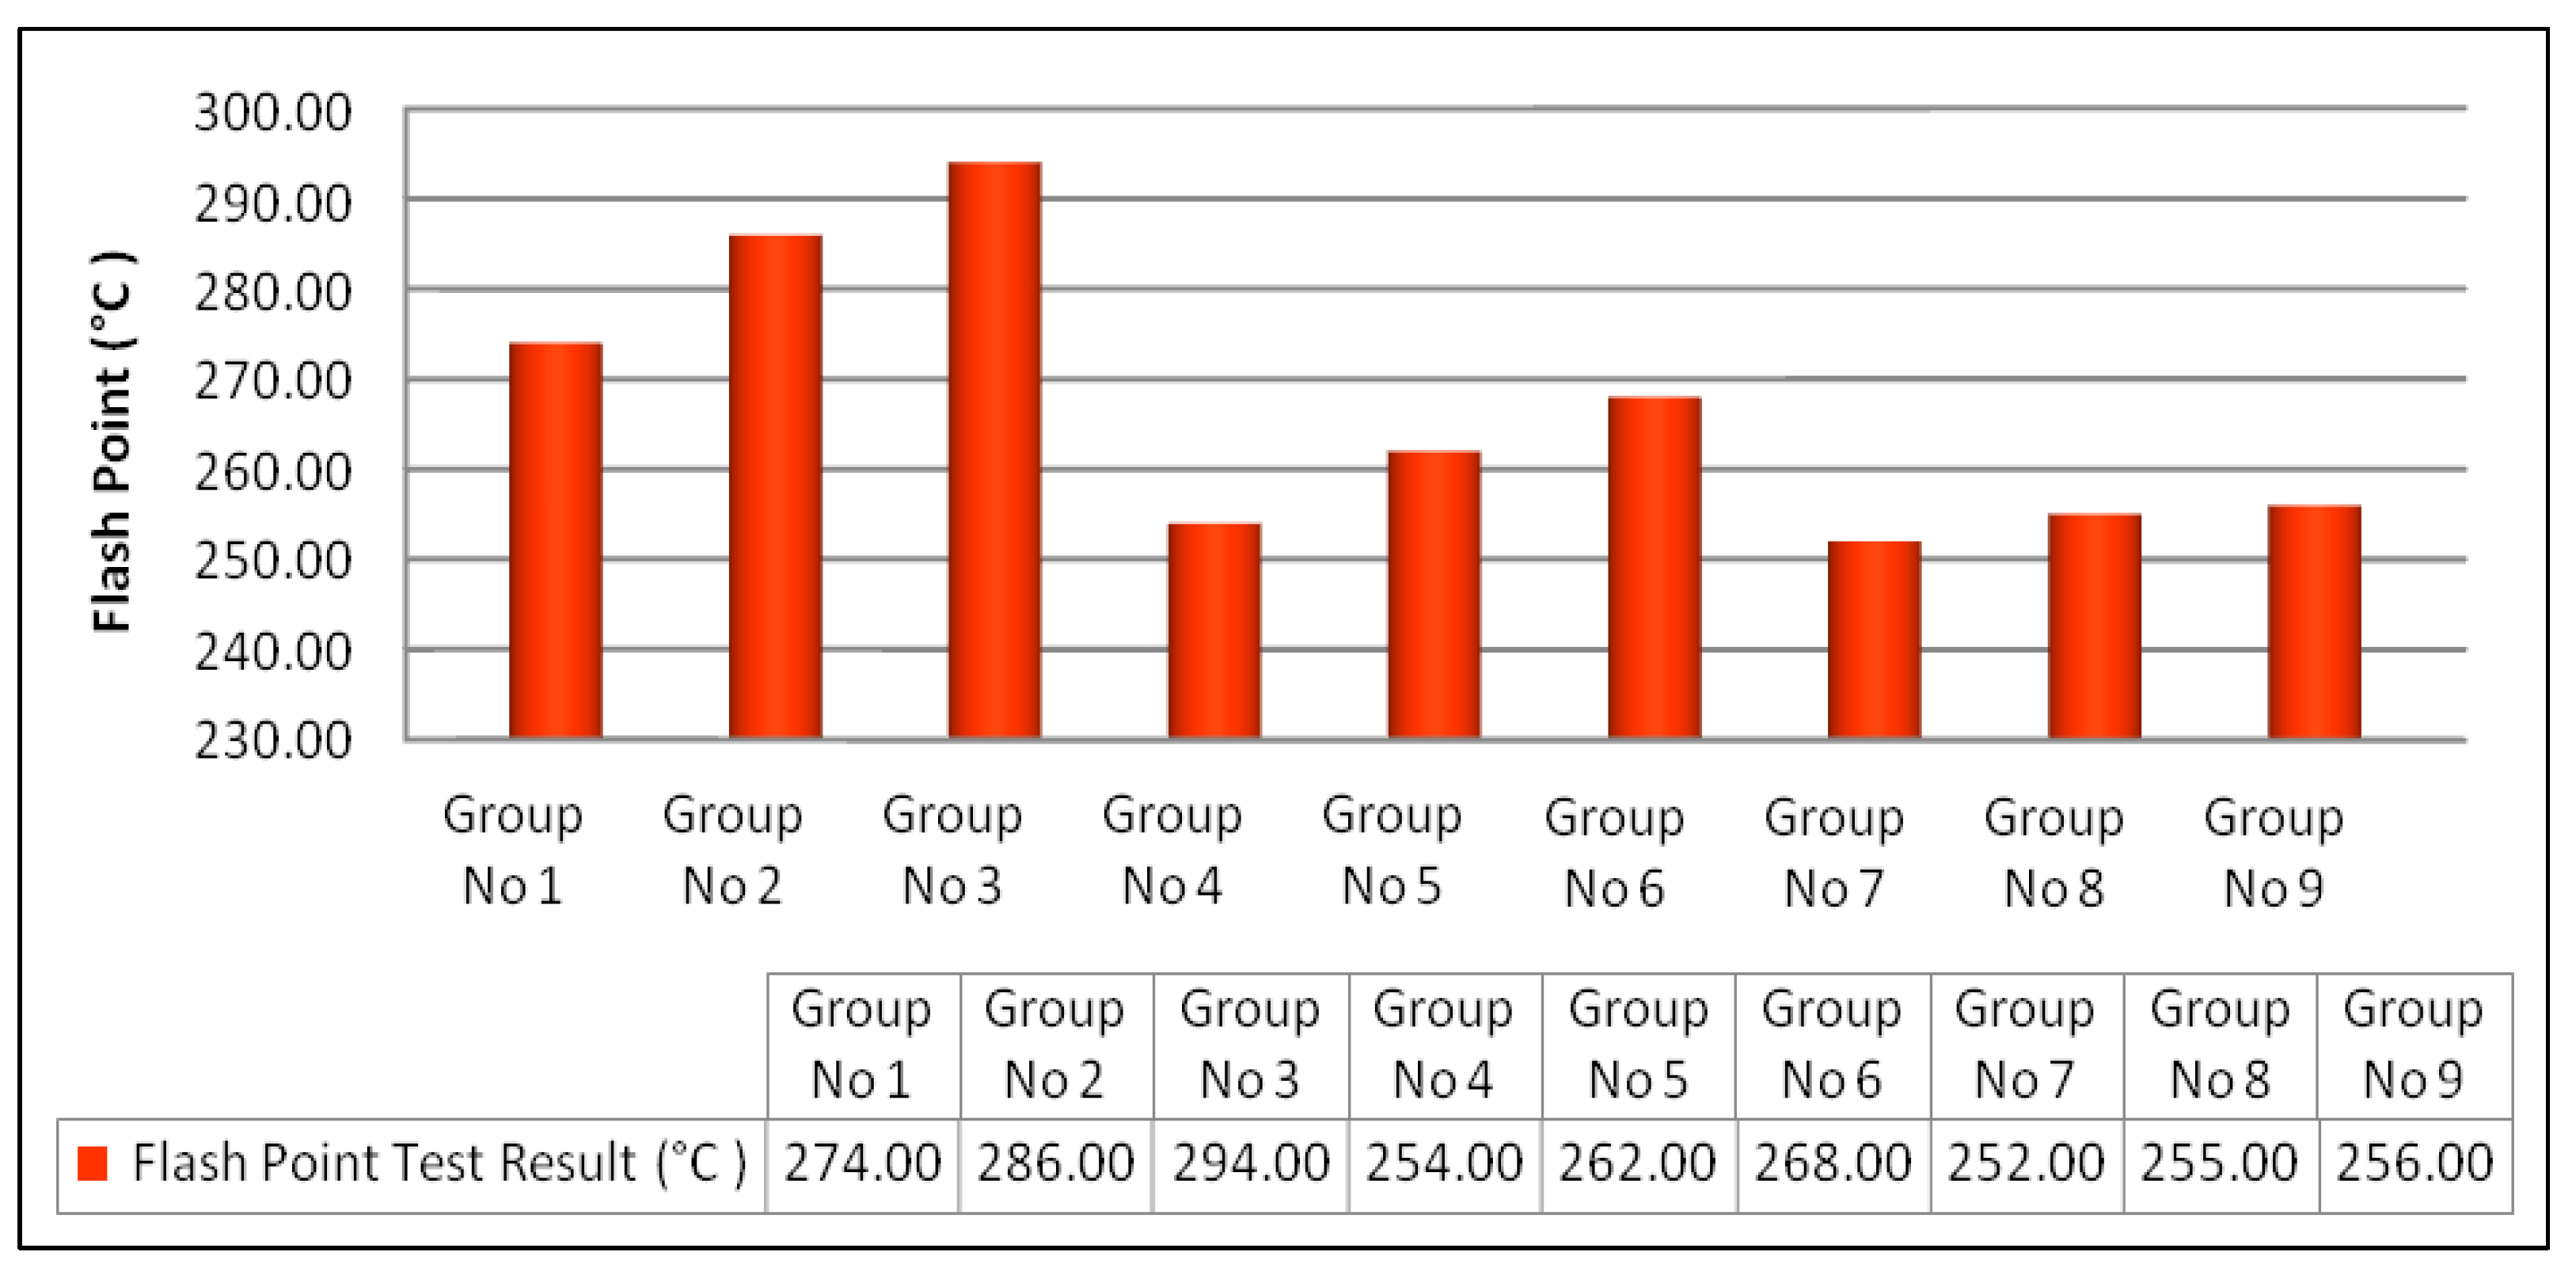
2.1.3. Flash Point Test

At certain high temperatures, bituminous binders release volatile compounds. These volatiles cause a hazardous situation by catching fire. Due to this, it is important to determine at what temperature bitumen begins to flash based on their grade [43]. A Flash Point Test is one of the most important tests for determining the possible ignition and flash risk associated with bitumen at any stage of processing, laying, or manufacturing. Flash point test results are given in Figure 7.
The safe temperature conditions during bitumen processing were determined to be at least 220 °C according to Table 412-2 Physical Properties of Modified Bitumen of the Bituminous Mixtures Laboratory Studies of the General Directorate of Highways [44]. All the results obtained were within the safety limits.

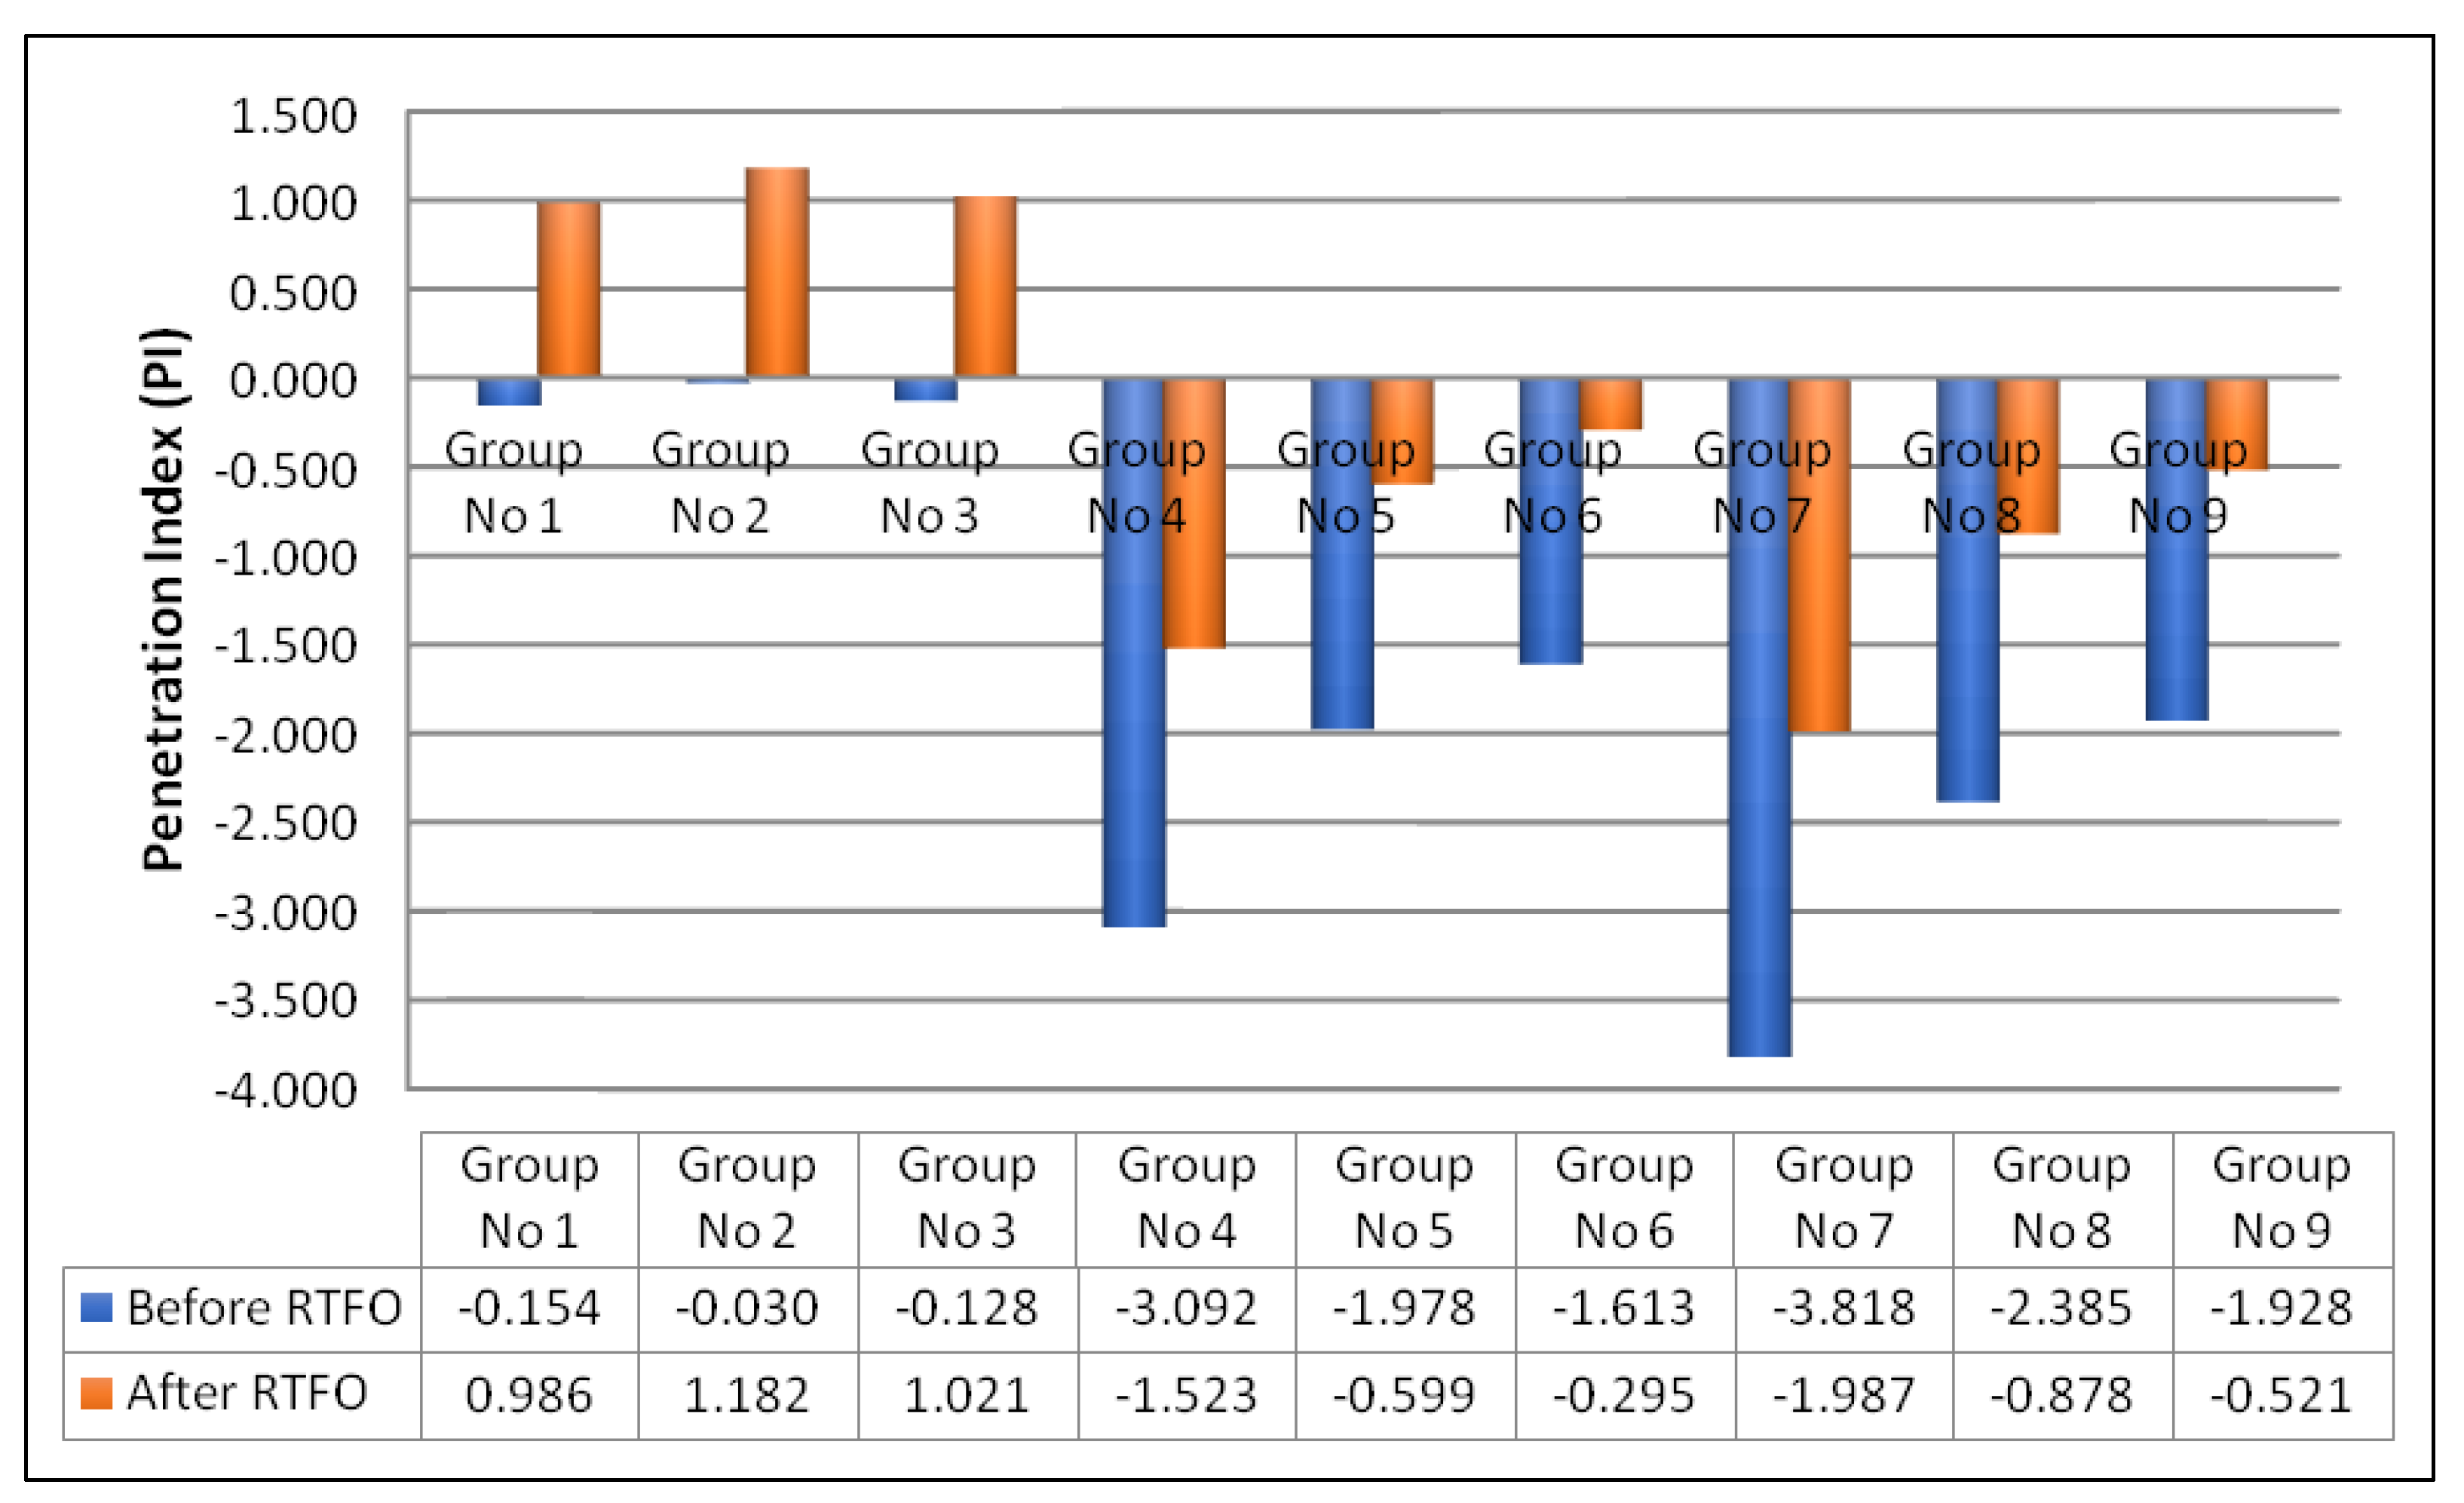
2.1.4. Penetration Index (PI) Results

The results obtained from penetration and softening point tests should be used to find the Penetration Index (PI) using the formulas presented below to evaluate the temperature sensitivity of bitumen.
A = l o g 10 800 l o g 10 P 25 T S P 25
P I = 20 500 A 1 + 50 A
A P25 value in the formulation indicated bitumen penetration at 25 °C, while a TSP value indicated the softening point. A PI value less than −2 indicates high heat sensitivity, while a PI value greater than 2 indicates low heat sensitivity [45]. Penetration Index results are given in Figure 8.
Significant changes occurred in PI values when adding waste vegetable oil and agricultural ash mixture to B 70/100 pure bitumen. PI values were −3.092 when 2% waste vegetable oil was added to pure bitumen (experimental group 4) and −3.818 when 4% waste vegetable oil was added to pure bitumen (experimental group 7). It was concluded that the oil additive caused bitumen to be extremely sensitive to heat. The PI value was −0.030 when 3% waste agricultural ash mixture was added to pure bitumen (experimental group 2) and −0.128 when 6% waste agricultural ash mixture was added (experimental group 3). Consequently, the addition of ash did not significantly affect the heat sensitivity of the bitumen. Regarding temperature sensitivity, Experimental Group No. 2 was the most suitable experimental group, which was prepared by mixing the bituminous binder with no oil additives and 3% ash additives for 20 min at 180 °C.

2.1.5. RTFOT (Rolling Thin Film Oven) Test Results

With the addition of oil, ash, temperature, and time parameters to B 70/100 pure bitumen, some changes were observed in mass loss. The most significant mass loss was observed in experimental groups 2, 5, and 8, where 3% ash was added and where the oil ratio was constant, as given in Table 3. The lowest mass loss was observed in experimental group 1, where neither oil nor ashes were added. In addition, all mass losses were determined to be under 0.8%, the upper limit of the Highways Technical Specifications.

2.1.6. Marshall Stability Test Results

Dry aggregates were weighed and placed in aluminum containers, as shown in Figure 9, so they could be heated easily and poured into the mixing device according to the gradation specified in Table 4 and the weight set in Table 5. Three bitumen samples each for 4%, 4.5%, 4.5%, 5.0%, 5.0%, 5.5%, and 6.0% were prepared and Marshall tests were performed.
As a result of the measurements, weighing, and calculations, the optimum bitumen percentage of the mixture was determined to be 5.20%. The test results and calculated values according to the optimum bitumen percentage are presented in Table 6.
The highest stability value was obtained in the experimental group 3, where there was no oil additive, the ash additive was 6%, the mixing temperature was 190 °C, and the mixing time was 30 min. The lowest stability value was obtained in the experimental group 7, in which there was no ash additive, the highest percentage of oil additive was 4%, the mixing temperature was 190 °C, and the mixing duration was 20 min.

2.1.7. Flow Values According to Marshall Stability Test

Even though the flow values in Table 6 were within the specification limits, the maximum flow value was observed in experimental group 2, where the oil additive was 0%, the ash additive was 3%, the temperature was 180 °C, and the mixing time was 20 min. While the flow values were generally close to one another, the experimental groups with 3% ash additive and the same oil ratios displayed the highest flow values. As no sudden change in flow values was observed with oil or ash additives, this indicated that the behavior of the flexible top coating at the moment of fracture was not significantly altered.

3. Results and Discussion
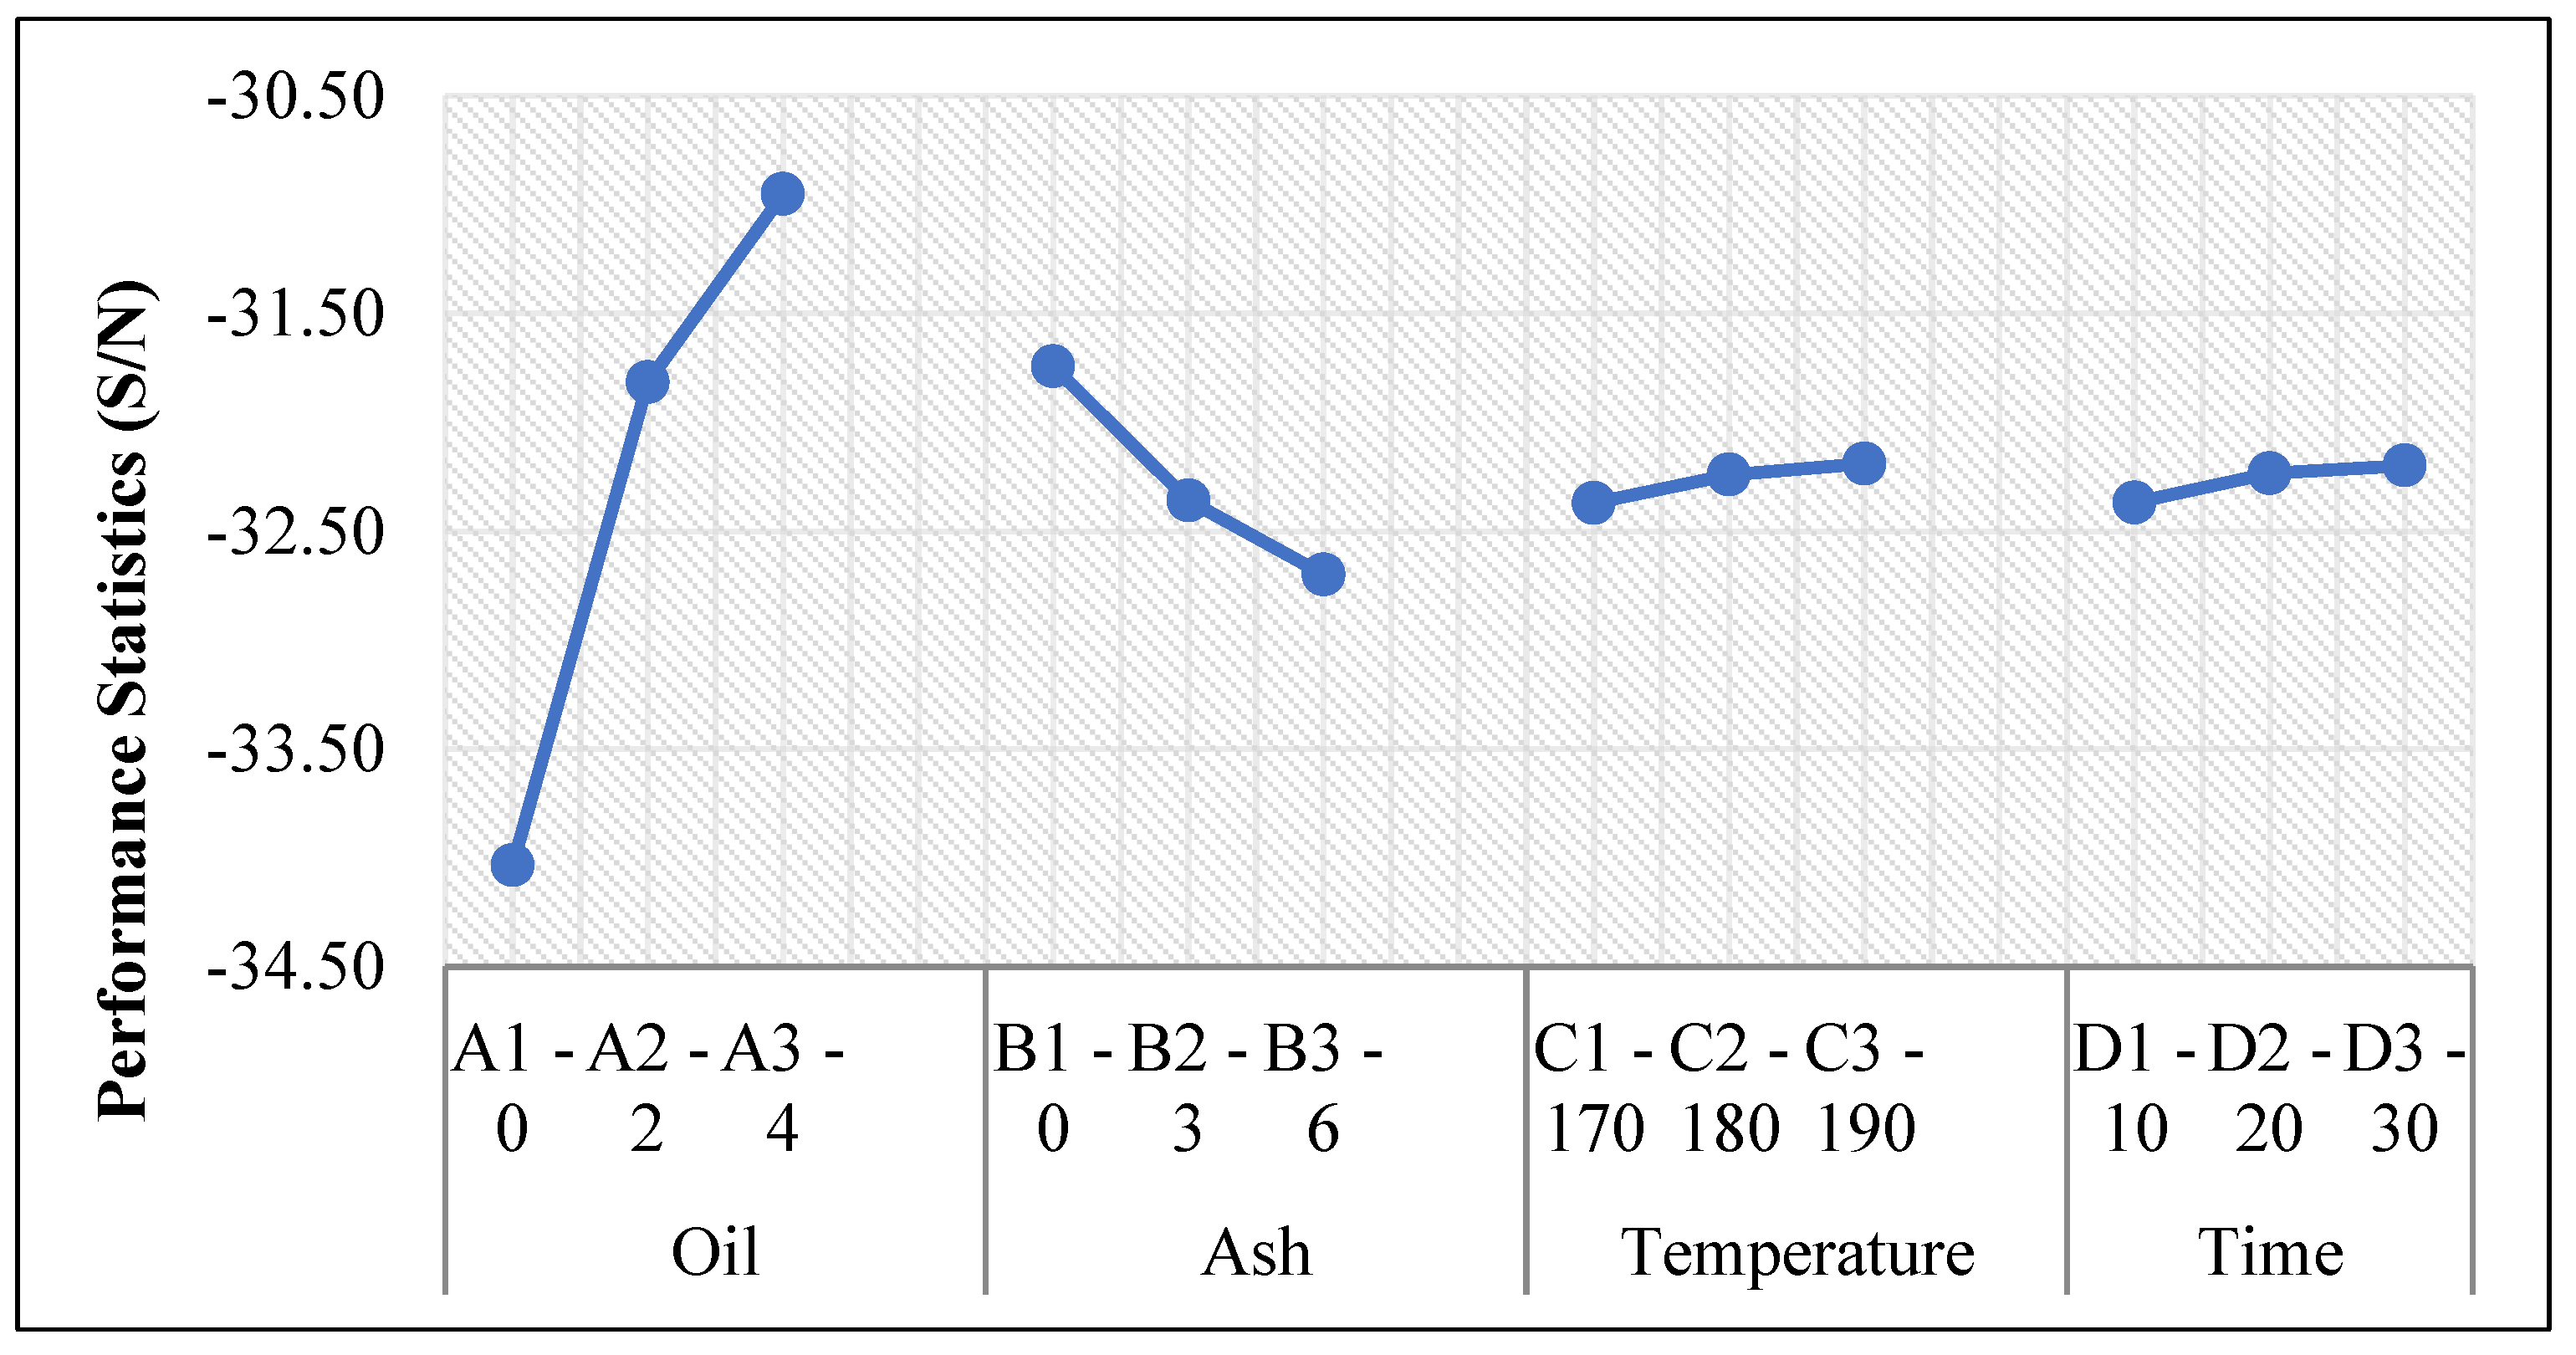
3.1. Taguchi Method

3.1.1. Experiments before RTFOT

The experiment plan was prepared using the Taguchi method with an L9 orthogonal array. The estimations were performed with a 95% confidence level using the performance statistics from the calculated stresses. The parameters and levels used in Taguchi optimization are presented in Table 7. The L9 orthogonal array is given in Table 8.
The penetration, softening, and flash point values obtained from the experiments and S/N values calculated with the Taguchi Method according to the L9 orthogonal array are given in Table 9. Average S/N effects calculated to determine the optimum conditions after calculating S/N values are presented in Table 10.
The average S/N effects for penetration tests calculated with the performance statistics are presented in Table 10. The conditions and performance estimations that maximized the penetrations using the average S/N effects are shown in Table 11.
The optimum levels for penetration were found to be A3, B1, C1, and D1. Parameters with the highest effect on penetration were oil ratio, ash ratio, time, and temperature, respectively. It was impossible to conduct the experiment with the optimum values based on the experimental plan described in Table 8. Therefore, a sample was prepared according to the relevant parameter values (A3, B1, C1, D1) to verify the result. A 211.800 (0.1 mm) penetration value was obtained at the end of the verification experiment. The S/N value corresponding to this result was 46.519. This value should be between 46.196 and 47.152 at 95% confidence level (Table 11). Hence, the result was accurate at a 95% confidence level.
The ANOVA table for penetration tests calculated according to the Taguchi Method is presented in Table 12. The most effective parameter on the penetration was oil, with a rate of 93.238%. This was followed by ash at 5.848%, time at 0.251%, and temperature at 0.250%.
The optimum levels for the softening point were found to be A3, B1, C3, and D3, as seen in Figure 10. Parameters with the highest effect on softening point were oil ratio, ash ratio, time, and temperature, respectively. The flash point’s optimum levels were A1, B3, C3, and D2. The parameters with the highest effect on flash point were oil ratio, ash ratio, temperature, and time, respectively.
In Taguchi optimization, only one dependent variable (response) was considered, and the optimal levels for the penetration, softening point, and flash point were found based on the S/N ratios. However, in practice, as in our study, there were more dependent variables. The Taguchi method literature focused primarily on a single response scenario. Taguchi method could not be used directly to optimize the multi-response problems. However, the obtained data for each response using Taguchi designs could be analyzed by different approaches developed by various researchers. Jeyapaul et al. [46] presented a literature review on solving multi-response problems in the Taguchi method.
This study used the assignment of weights method to convert the multi-responses into a single response. The weights and multi-response performance indexes (MRPI) are presented in Table 13. The weights were determined as follows. For penetration and flash point (larger—the better characteristic), the individual responses (data) were divided by the total response values. In the case of the softening point (smaller—the better characteristic), a reverse normalization procedure was used.
Since MRPI was a weighted score, optimal levels were determined based on maximum MRPI values. The optimum levels for penetrations, softening, and flash points were found to be A3, B1, C1, and D1, as seen in Table 14. Parameters with the highest effect on multi-responses were oil ratio, ash ratio, temperature, and time, respectively.

3.1.2. Experiments after RTFOT and Marshall

The penetration and softening point values after RTFOT and Marshal stability values obtained from the experiments and S/N values calculated according to the L9 orthogonal array are presented in Table 15.
The optimum penetration levels after RTFOT were found to be A3, B1, C1, and D1. The optimum softening point levels after RTFOT were A3, B1, C3, and D3. The optimum Marshall stability levels were A1, B3, C2, and D3. These multiple responses were combined into a single statistic, MRPI, to obtain the optimum levels as a single response to the original problem. The weights and multi-response performance indexes (MRPI) of penetration and softening points after RTFOT and Marshall stability values are presented in Table 16. The optimum levels for all responses were found to be A3, B1, C1, and D1, as seen in Table 17. Parameters with the highest effect on multi-responses were oil ratio, ash ratio, temperature, and time, respectively.
As the optimum levels for penetration, softening, and flash point before RTFOT and penetration, softening point after RTFOT, and Marshall stability were the same as A3, B1, C1, and D1, the verification tests were conducted according to these optimum levels. A 145.300 (0.1 mm) penetration value was obtained at the end of the verification experiment. The S/N value corresponding to this result was 43.245. This value should be between 41.592 and 43.507 at 95% confidence level (Table 18). The S/N verification values for the softening point and Marshall stability were found between their confidence intervals. The verification results were accurate at a 95% confidence level.

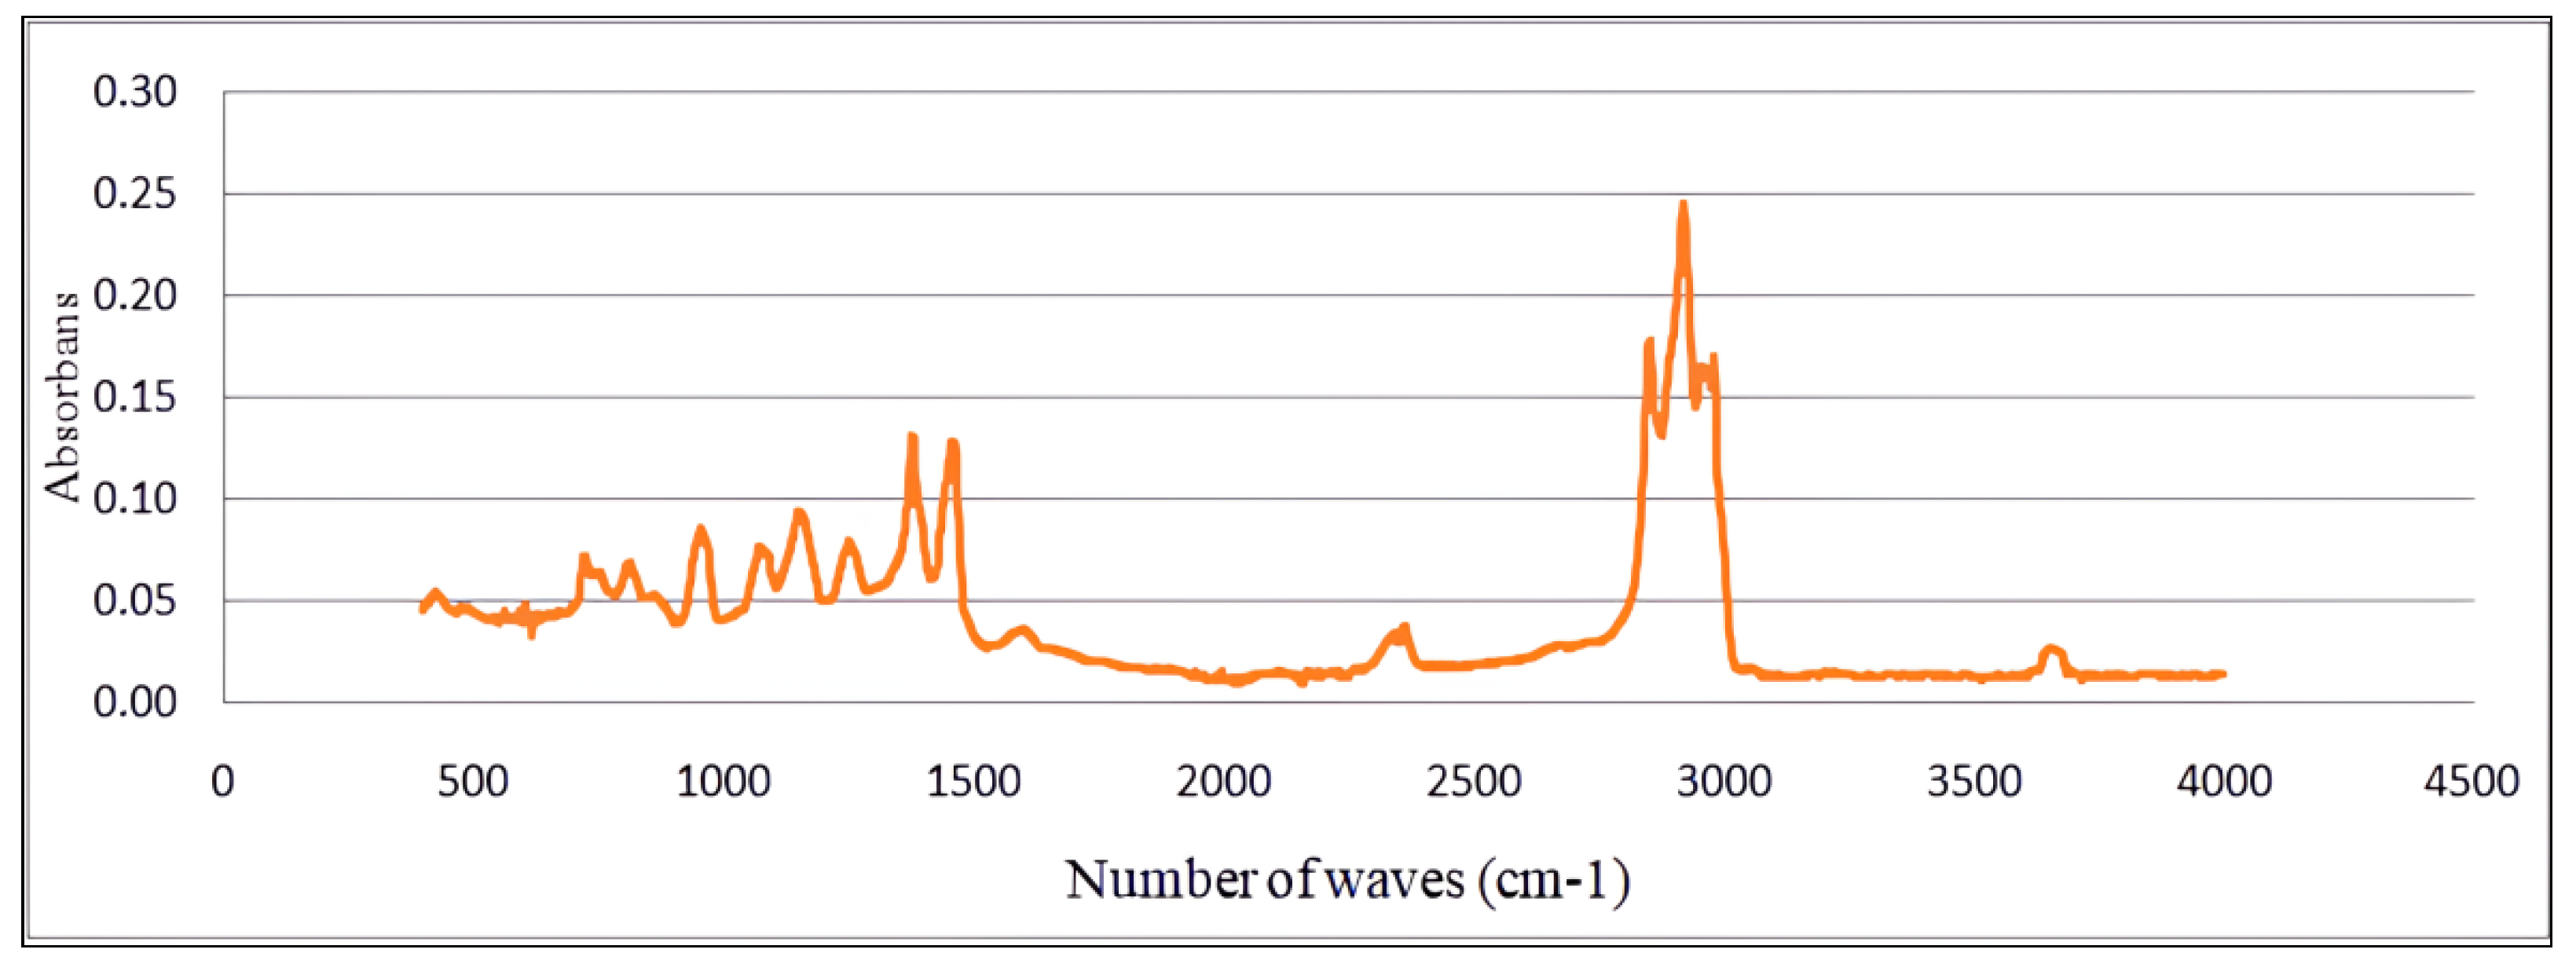
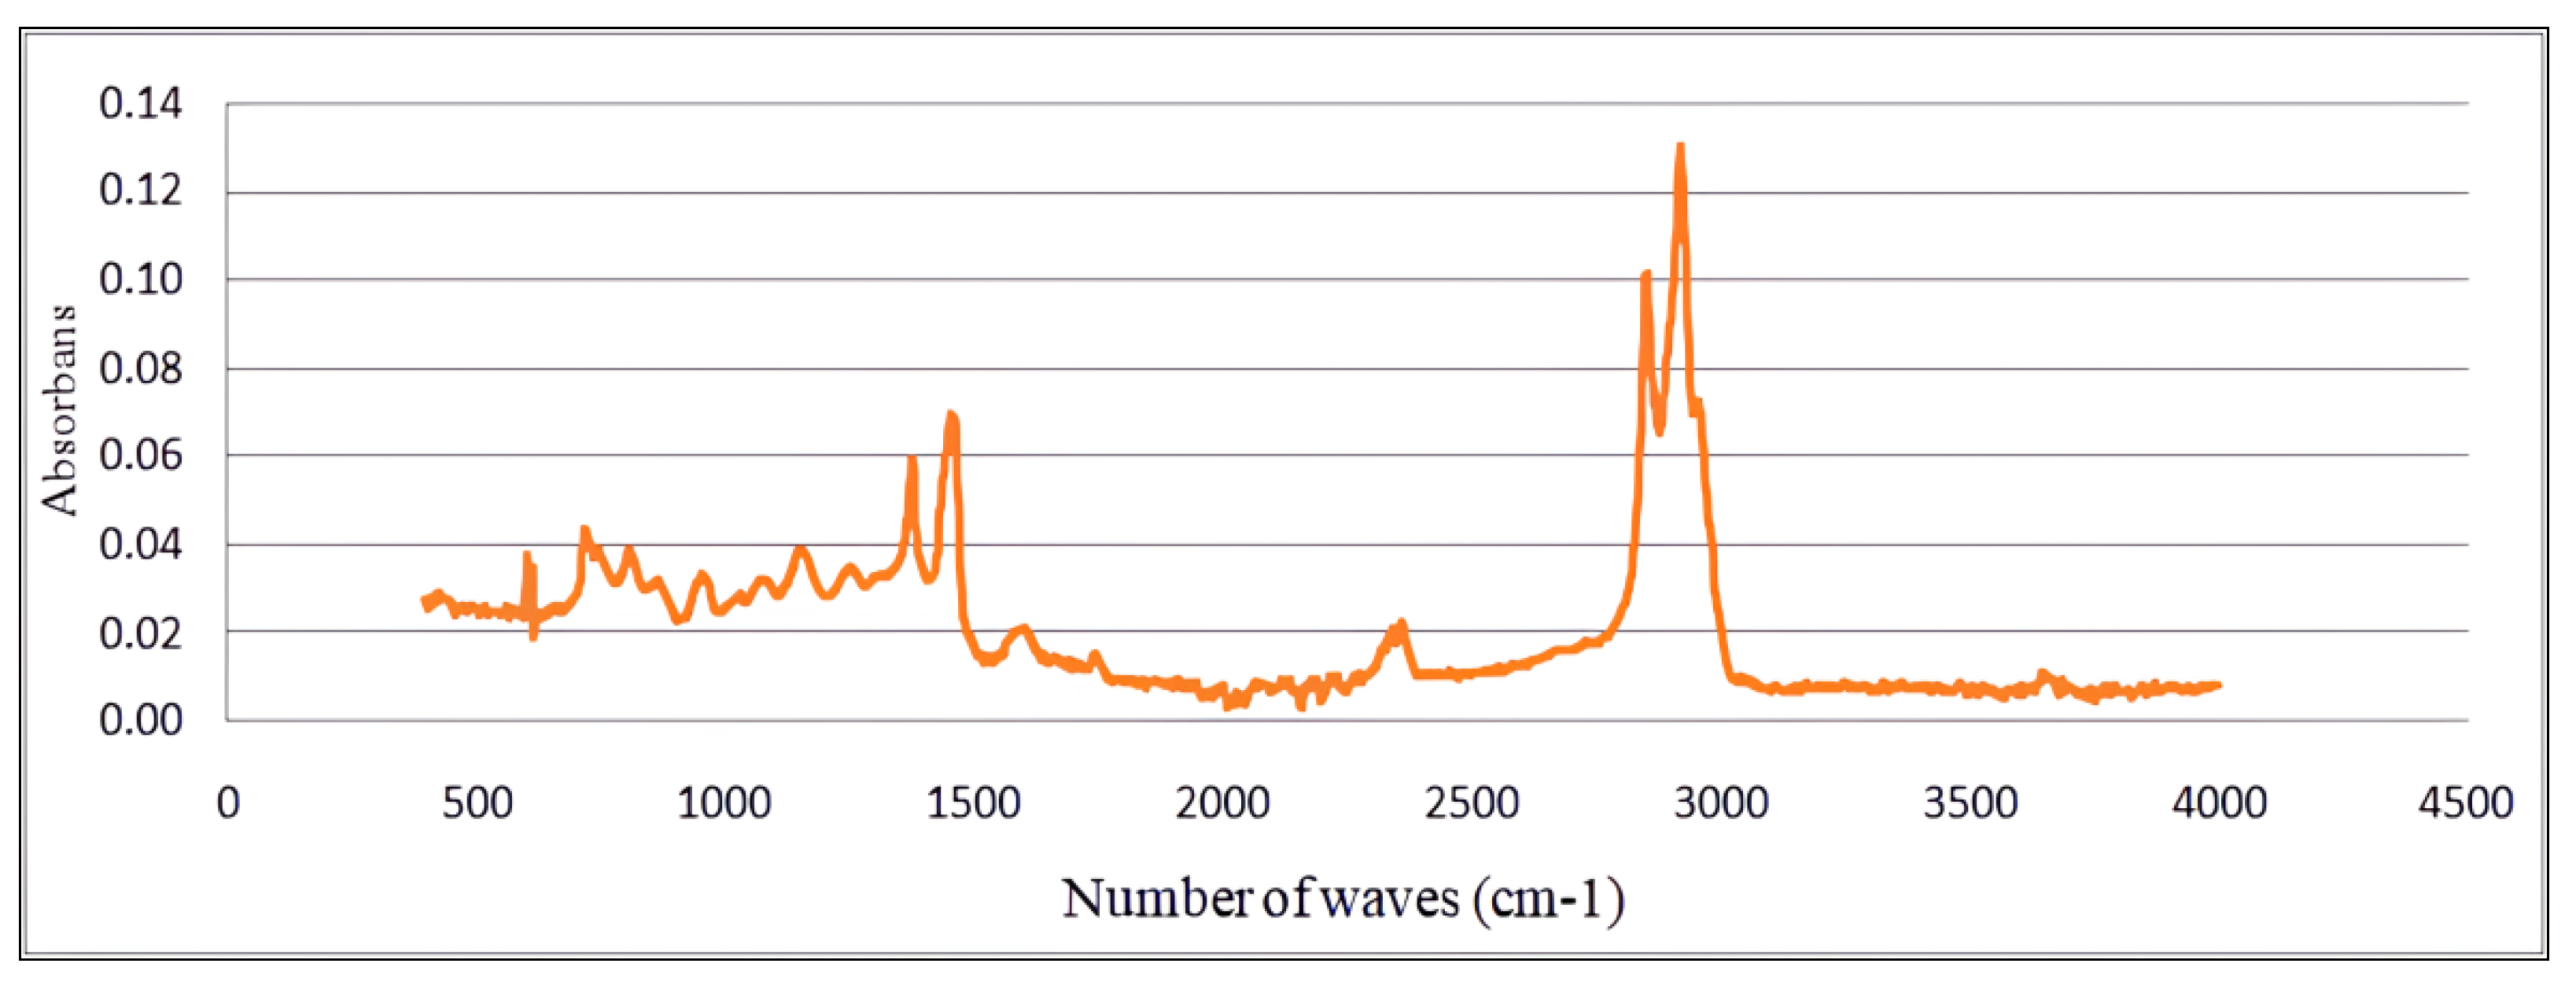
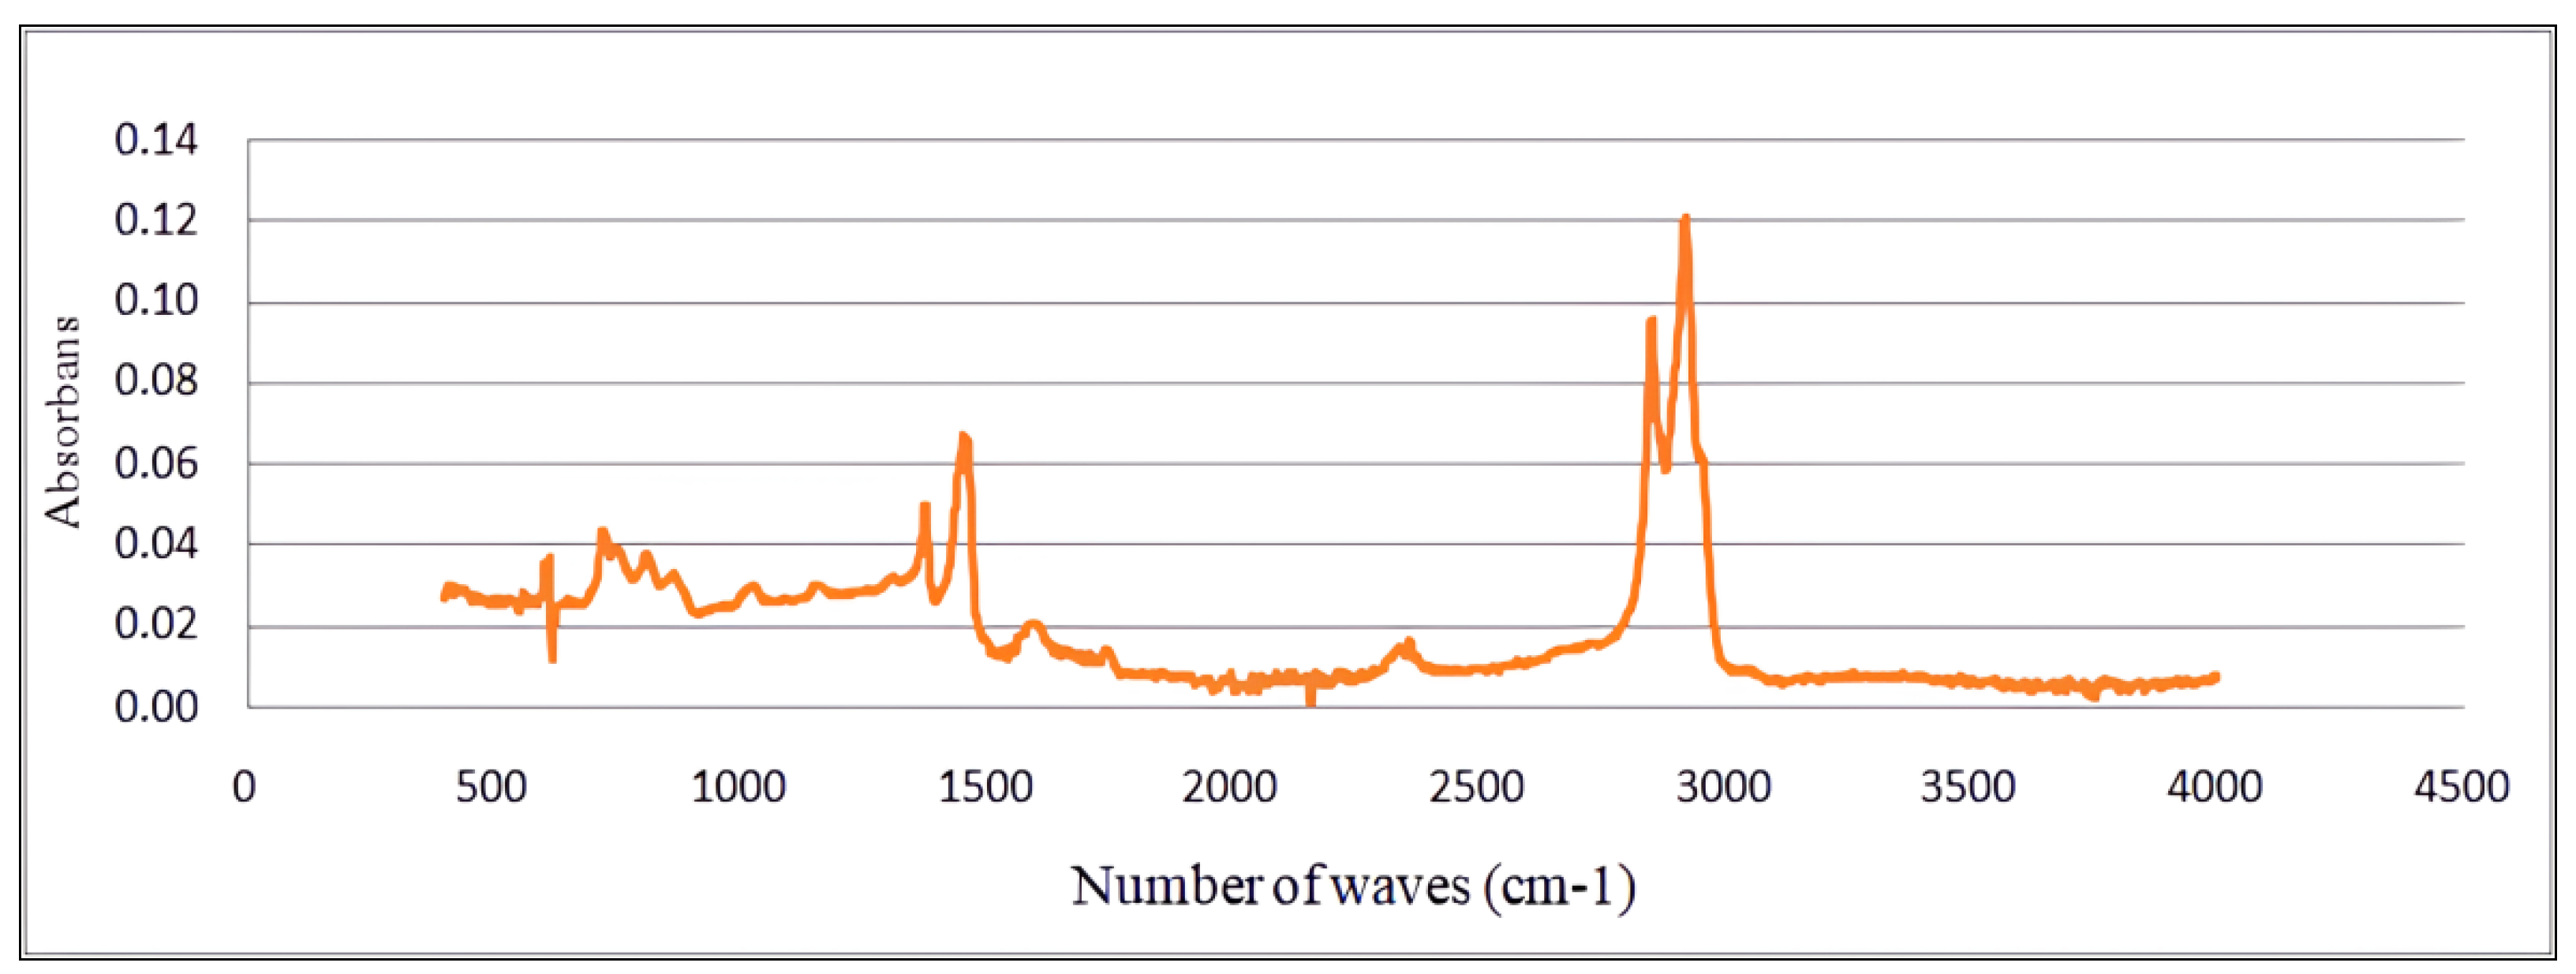
3.2. FTIR (Fourier Transform Infrared Spectroscopy)

For Experiment No. 5, the FTIR analyses were performed on pure bitumen mixed at 170 °C for ten minutes at 3000 RPM in a High Share Mixer and bitumen mixed at 190 °C for ten minutes at 3000 RPM in a High Share Mixer, with 2% oil and 3% ash for ten minutes at 3000 RPM in the pre-RTFOT and post-RTFOT states. FTIR results are given in Figure 11, Figure 12 and Figure 13.
FTIR spectra in Figure 11, Figure 12 and Figure 13 and Table 19 were analyzed, and the peaks were found to be within a similar range of wave numbers and close to each other. Despite the addition of 2% oil and 3% ash additives to bitumen without additives and the aging of the bitumen, no significant changes were observed in the basic structure of the bitumen samples. The chemical structure of the bitumen sample was not altered by either the additives or the mixing temperature of 190 °C. As a result, waste cooking oil and waste agricultural ash were found to be suitable for use as modifiers without affecting the structure of the bitumen.

4. Conclusions

In this study, 0%, 2%, and 4% by weight of waste vegetable oil and 0%, 3%, and 6% by weight of waste agricultural ash were added to 70/100 penetration pure bitumen. In total, nine groups of samples were prepared from the modified bitumen at temperatures of 170 °C, 180 °C, and 190 °C and mixing speeds of 3000 RPM for 10, 20, and 30 min. Accordingly, the results obtained from the experiments and the evaluations derived from the Taguchi method optimization were described as follows.
The optimum levels that maximized the stability were A1, B3, C2, D3. In other words, Level 1 of oil content (0%), Level 3 of ash content (6%), Level 2 of temperature (180 °C), and Level 3 of time (30 min) gave the maximum stability value. It was observed that oil had the most significant adverse effect on stability, while temperature and time had less effect on stability.
The optimum levels that maximized the flash point were A1, B3, C3, and D2. In other words, Level 1 of oil ratio (0%), Level 3 of ash ratio (6%), Level 3 of temperature (190 °C), and Level 2 of time (20 min) yielded the maximum stability value.
The optimum levels that maximized the penetration value before and after RTFOT were A3, B1, C1, and D1. The penetration class obtained from optimum levels shifted by two grades and one grade before and after RTFOT compared to pure bitumen.
The optimum levels that minimized the softening point before and after RTFOT were A3, B1, C3, and D3. The optimum value of the softening point was found to be 33.22 °C before RTFOT and 42.34 °C after RTFOT.
In general, when the multi-responses were converted into one response, the optimum parameters were A3, B1, D1, and C1. In the verification tests, the penetration value was 145.300 (0.1 mm), the softening point value was 44.8 °C, and the Marshall stability value was 1097.55 N. All of these values were found to be within 95% accuracy.
According to these results, the effects of mixing temperature and mixing time in the modification process were relatively small compared to oil and ash additives. Moreover, in terms of Marshall stability, stability decreased as the oil content increased, and stability increased as the ash content increased. Based on the flash point values, the flash point value decreased with increasing oil content, while it increased with increasing ash content. Since the Marshall flow values were within the specification limits, no optimization was performed. According to the penetration values before and after RTFOT, the penetration value increased as the oil content increased, while the penetration value decreased as the ash content increased. In terms of softening point values before and after RTFOT, the softening point value decreased as oil content increased, whereas the softening point value increased as ash content increased. In analyzing the FTIR spectrum, it was observed that the peaks were in the same wave number ranges and were close to one another. In the experiment, neither the additives nor the highest mixing temperature of 190 °C affected the chemical structure of the bitumen sample. It was concluded that waste vegetable oil and waste agricultural ash could be used as modifiers without altering the bitumen’s structure.
Approximately 17 million tons of vegetable oil are consumed worldwide, and this amount is increasing by an average of 2% every year. 40% of the reasons for the city sewage system clogging are waste frying oils [47]. Waste oils pollute water resources and result in high costs for purification processes [48]. An average of 140 billion tons of biomass is produced annually in the world from agricultural products [49]. Using waste vegetable oil and waste agricultural ash will improve the physical properties of bitumen while contributing to the world economy by reducing treatment costs and preventing environmental pollution. In future studies, biomass products such as food waste, municipal solid waste, marine biomass, and animal manure can be investigated to improve bitumen performance and thus can make a significant contribution to the waste disposal process.

Author Contributions

Conceptualization, M.A.Ç. and E.Z.; methodology, M.Y.Ç. and F.İ.B.; software, Ö.Y. and E.K.; validation, M.A.Ç., M.Y.Ç. and F.İ.B., formal analysis, M.A.Ç.; investigation, E.Z. and E.K.; resources, M.A.Ç. and E.Z.; data curation, Ö.Y. and E.K.; writing—original draft preparation, M.A.Ç. and M.Y.Ç.; writing—review and editing, E.Z., F.İ.B., Ö.Y. and E.K.; visualization, E.K.; supervision, M.A.Ç. All authors have read and agreed to the published version of the manuscript.

Funding

This research received no external funding.

Institutional Review Board Statement

Not applicable.

Informed Consent Statement

Not applicable.

Data Availability Statement

Not applicable.

Conflicts of Interest

The authors declare no conflict of interest.

References

  1. UN. Global Population Growth and Sustainable Development; UN: New York, NY, USA, 2021. [Google Scholar]
  2. EP. Promotion of the Use of Energy from Renewable Resources; EP: Strasbourg, France, 2009. [Google Scholar]
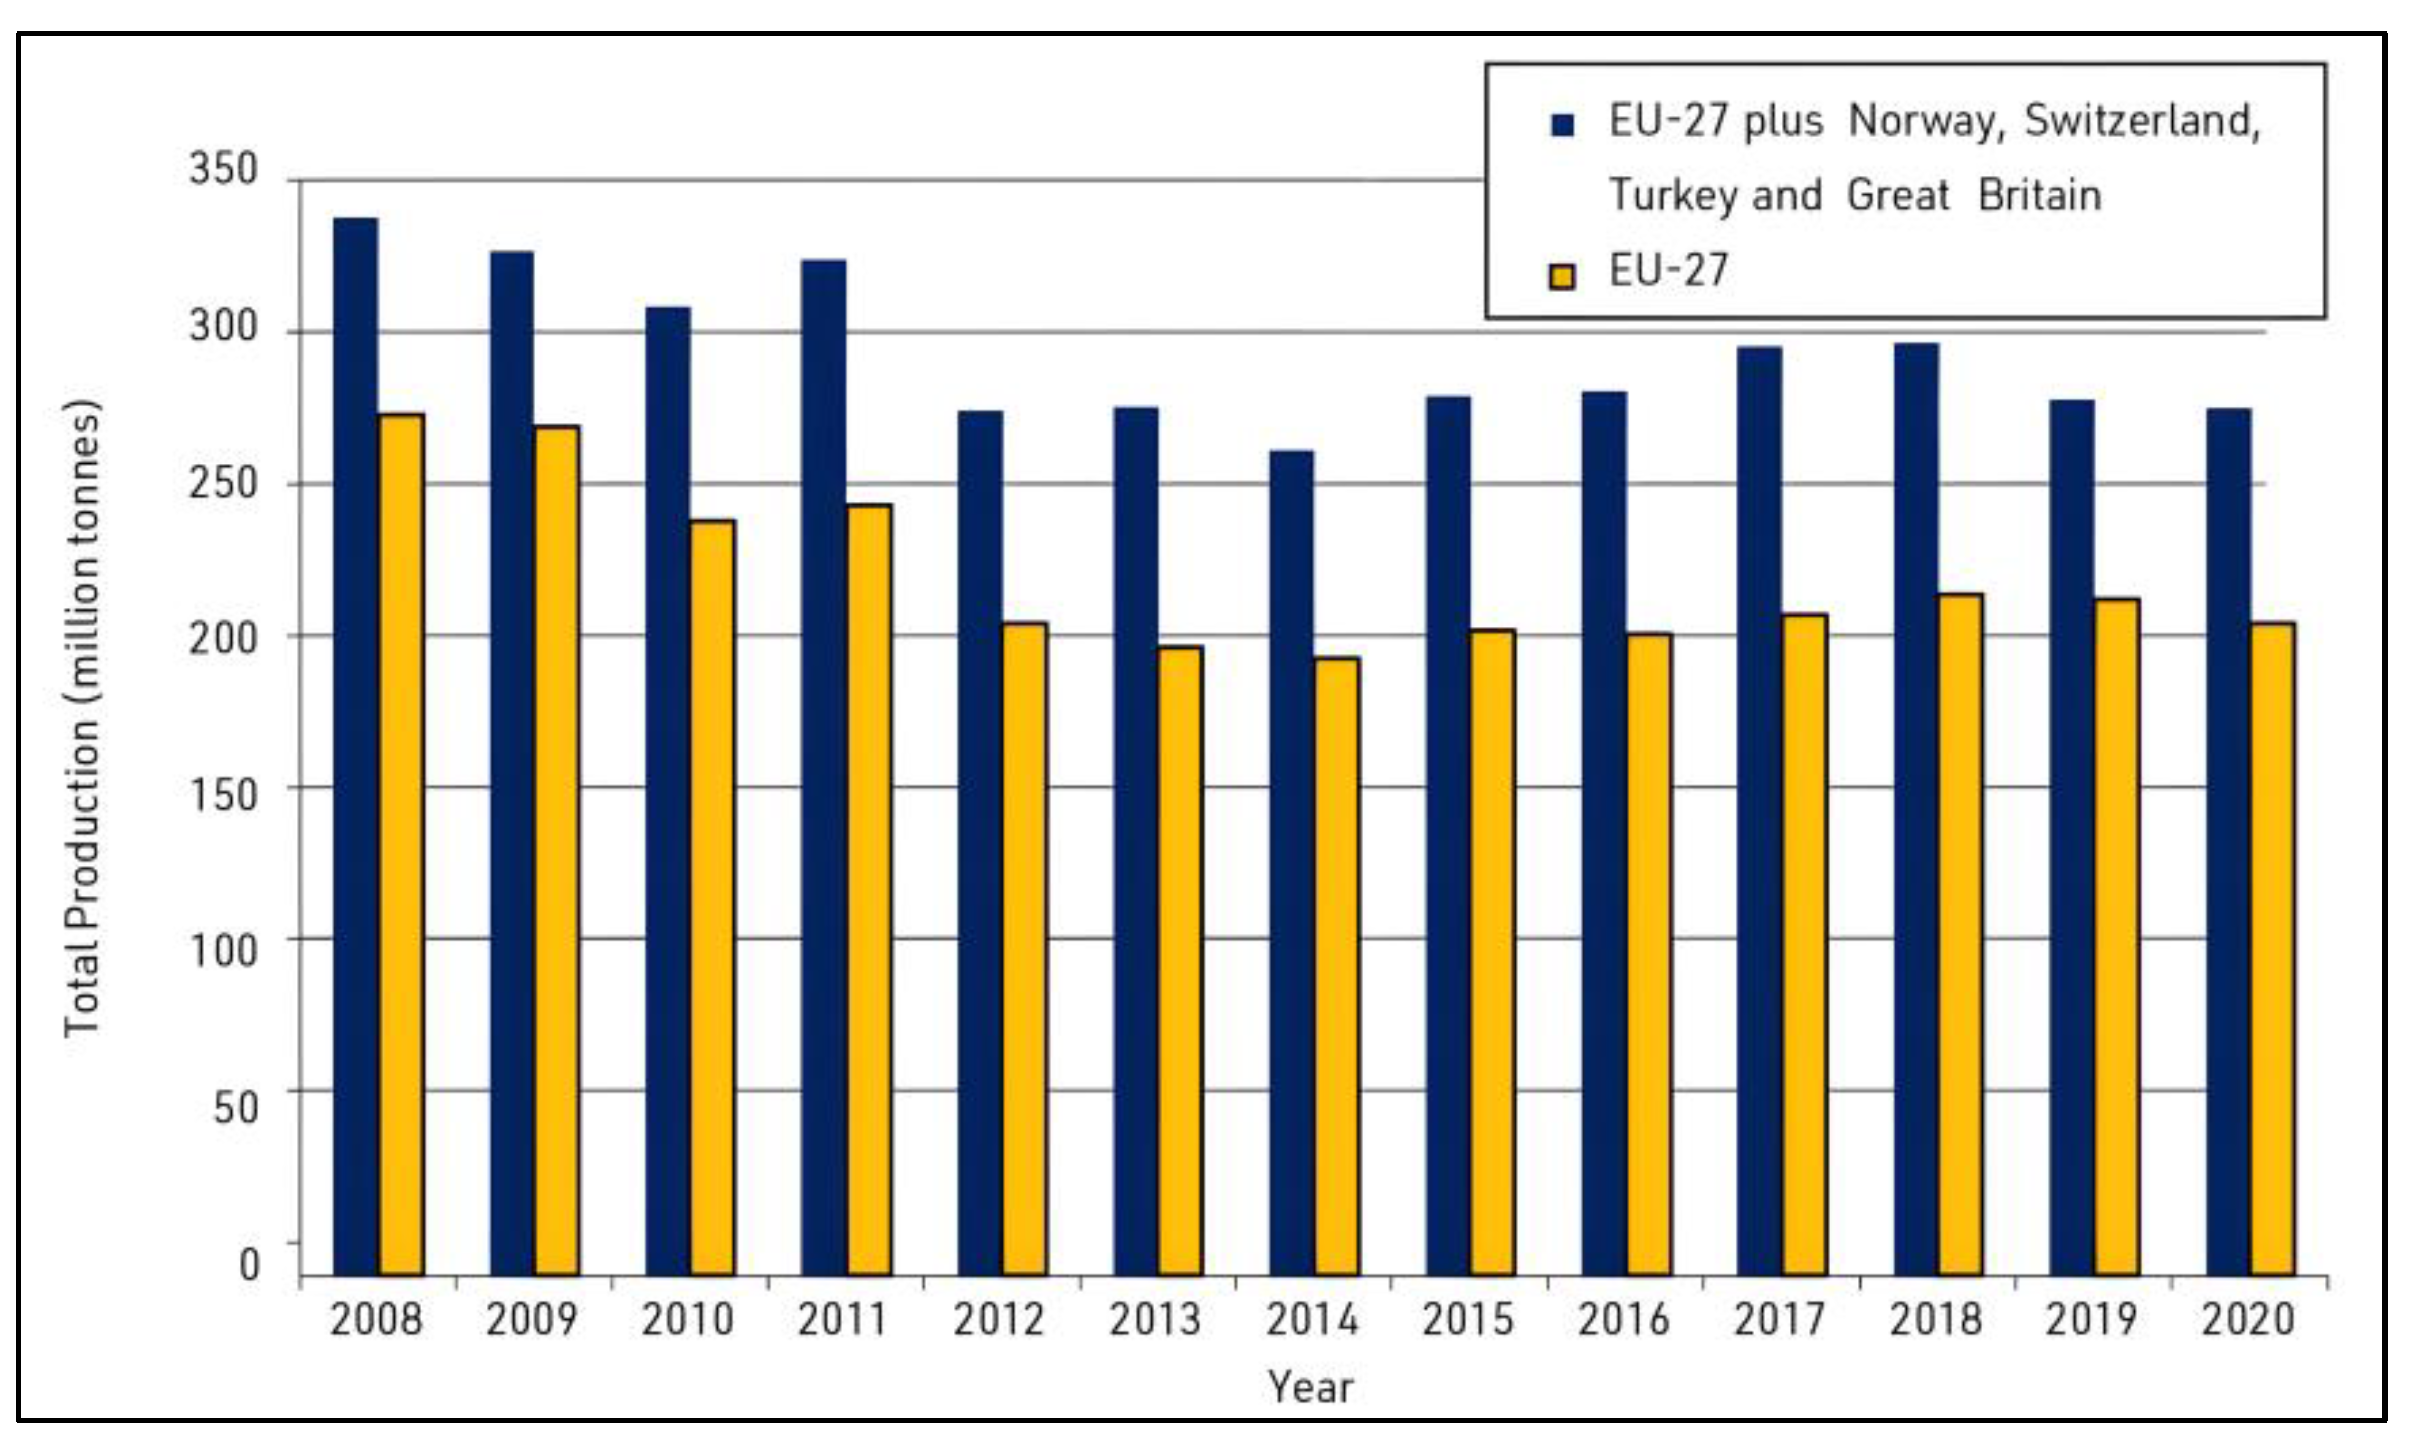
  3. EAPA. Asphalt in Figures 2020; European Asphalt Pavement Association: Brussels, Belgium, 2020. [Google Scholar]
  4. Moghaddam, T.B.; Karim, M.R.; Abdelaziz, M. A Review on Fatigue and Rutting Performance of Asphalt Mixes. Sci. Res. Essays 2011, 6, 670–682. [Google Scholar]
  5. Xu, T.; Huang, X. Investigation into causes of in-place rutting in asphalt pavement. Constr. Build. Mater. 2012, 28, 525–530. [Google Scholar] [CrossRef]
  6. Fernandes, S.; Silva, H.M.R.D.; Oliveira, J.R.M. Mechanical, surface and environmental evaluation of stone mastic asphalt mixtures with advanced asphalt binders using waste materials. Road Mater. Pavement Des. 2019, 20, 316–333. [Google Scholar] [CrossRef]
  7. Qu, X.; Liu, Q.; Chao, W.; Wang, D.; Oeser, M. Effect of Co-Production of Renewable Biomaterials on the Performance of Asphalt Binder in Macro and Micro Perspectives. Materials 2018, 11, 244. [Google Scholar] [CrossRef] [PubMed]
  8. Lv, S.; Peng, X.; Liu, C.; Qu, F.; Zhu, X.; Tian, W.; Zheng, J. Aging resistance evaluation of asphalt modified by Buton-rock asphalt and bio-oil based on the rheological and microscopic characteristics. J. Clean. Prod. 2020, 257, 120589. [Google Scholar] [CrossRef]
  9. EPA. European Waste Catalogue and Hazardous Waste List; Environmental Protection Agency: Wexford, Ireland, 2002. [Google Scholar]
  10. Chesner, W.H.; Collins, R.J.; MacKay, M.H.; Emery, J. User Guidelines for Waste and By-Product Materials in Pavement Construction; Turner-Fairbank Highway Research Center: McLean, VA, USA, 2002. [Google Scholar]
  11. Zagvozda, M.; Dimter, S.; Rukavina, T.; Grubeša, I.N. Possibilities of bioash application in road building. Građevinar 2018, 70, 393–402. [Google Scholar]
  12. Gökalp, İ.; Özinal, Y.; Uz, V.E. Atık Bitkisel Yemeklik Yağların Saf Bitüm Özelliklerine Etkisinin Araştırılması. Mühendislik Bilim. Ve Tasarım Derg. 2018, 6, 570–578. [Google Scholar] [CrossRef]
  13. Asli, H.; Ahmadinia, E.; Zargar, M.; Karim, M.R. Investigation on physical properties of waste cooking oil–Rejuvenated bitumen binder. Constr. Build. Mater. 2012, 37, 398–405. [Google Scholar] [CrossRef]
  14. Asare, M.A.; de Souza, F.M.; Gupta, R.K. Waste to Resource: Synthesis of Polyurethanes from Waste Cooking Oil. Ind. Eng. Chem. Res. 2022, 61, 18400–18411. [Google Scholar] [CrossRef]
  15. IEA. World Energy Outlook (WEO); IEA: Paris, France, 2013. [Google Scholar]
  16. Xue, Y.; Wu, S.; Cai, J.; Zhou, M.; Zha, J. Effects of two biomass ashes on asphalt binder: Dynamic shear rheological characteristic analysis. Constr. Build. Mater. 2014, 56, 7–15. [Google Scholar] [CrossRef]
  17. Abo-Shanab, Z.; Ragab, A.; Naguib, H.M. Improved dynamic mechanical properties of sustainable bio-modified asphalt using agriculture waste. Int. J. Pavement Eng. 2021, 22, 905–911. [Google Scholar] [CrossRef]
  18. Arabani, M.; Esmaaeli, N. Laboratory evaluation on effect of groundnut shell ash on performance parameters of asphalt binder and mixes. Road Mater. Pavement Des. 2020, 21, 1565–1587. [Google Scholar] [CrossRef]
  19. Abbasalizadeh Boura, S.; Hesami, S. Laboratory evaluation of the performance of asphalt mixtures containing biomass fillers. Road Mater. Pavement Des. 2020, 21, 2040–2053. [Google Scholar] [CrossRef]
  20. Fareed, A.; Zaidi, S.B.A.; Ahmad, N.; Hafeez, I.; Ali, A.; Ahmad, M.F. Use of agricultural waste ashes in asphalt binder and mixture: A sustainable solution to waste management. Constr. Build. Mater. 2020, 259, 120575. [Google Scholar] [CrossRef]
  21. Li, J.; Zhang, F.; Liu, Y.; Muhammad, Y.; Su, Z.; Meng, F.; Chen, X. Preparation and properties of soybean bio-asphalt/SBS modified petroleum asphalt. Constr. Build. Mater. 2019, 201, 268–277. [Google Scholar] [CrossRef]
  22. Dong, Z.; Yang, C.; Luan, H.; Zhou, T.; Wang, P. Chemical characteristics of bio-asphalt and its rheological properties after CR/SBS composite modification. Constr. Build. Mater. 2019, 200, 46–54. [Google Scholar] [CrossRef]
  23. Yan, S.; Dong, Q.; Chen, X.; Zhou, C.; Dong, S.; Gu, X. Application of waste oil in asphalt rejuvenation and modification: A comprehensive review. Constr. Build. Mater. 2022, 340, 127784. [Google Scholar] [CrossRef]
  24. Zahoor, M.; Nizamuddin, S.; Madapusi, S.; Giustozzi, F. Sustainable asphalt rejuvenation using waste cooking oil: A comprehensive review. J. Clean. Prod. 2021, 278, 123304. [Google Scholar] [CrossRef]
  25. Li, H.; Zhang, F.; Feng, Z.; Li, W.; Zou, X. Study on waste engine oil and waste cooking oil on performance improvement of aged asphalt and application in reclaimed asphalt mixture. Constr. Build. Mater. 2021, 276, 122138. [Google Scholar] [CrossRef]
  26. Li, C.; Han, X.; Gong, J.; Su, W.; Xi, Z.; Zhang, J.; Wang, Q.; Xie, H. Impact of waste cooking oil on the viscosity, microstructure and mechanical performance of warm-mix epoxy asphalt binder. Constr. Build. Mater. 2020, 251, 118994. [Google Scholar] [CrossRef]
  27. Ahmed, R.B.; Hossain, K. Waste cooking oil as an asphalt rejuvenator: A state-of-the-art review. Constr. Build. Mater. 2020, 230, 116985. [Google Scholar] [CrossRef]
  28. Eriskin, E.; Karahancer, S.; Terzi, S.; Saltan, M. Waste frying oil modified bitumen usage for sustainable hot mix asphalt pavement. Arch. Civ. Mech. Eng. 2017, 17, 863–870. [Google Scholar] [CrossRef]
  29. Rahman, M.T.; Hainin, M.R.; Bakar, W.A.W.A. Use of waste cooking oil, tire rubber powder and palm oil fuel ash in partial replacement of bitumen. Constr. Build. Mater. 2017, 150, 95–104. [Google Scholar] [CrossRef]
  30. Mercan, Ş. Deney Tasarımı ve Yapay Zeka Tekniklerinden Yararlanarak Ürün Kalitesinin Geliştirilmesi; Balıkesir Üniversitesi/Fen Bilimleri Enstitüsü: Balıkesir, Turkey, 2019; p. 100. [Google Scholar]
  31. Aman, A.; Bhardwaj, R.; Gahlot, P.; Phanden, R.K. Selection of cutting tool for desired surface finish in milling Machine using Taguchi optimization methodology. Mater. Today Proc. 2023, 78, 444–448. [Google Scholar] [CrossRef]
  32. Baş, F.İ.; Bayrak, O.Ü.; Bayata, H.F. A Practical Design Guide for Unbonded Jointed Plain Concrete Roads over Deteriorated HMA Roads: Realistic Traffic Loading. Coatings 2022, 12, 1817. [Google Scholar] [CrossRef]
  33. Mola, E.; Bayrak, O.Ü.; Baş, F.İ.; Bayata, H.F. Investigating the Usability of Kevlar and Steel Fibers as a Hybrid in Concrete Pavements; Sigma Journal of Engineering and Natural Sciences, Yildiz Technical University Press: Istanbul, Turkey, 2021; Volume 39, pp. 1–12. [Google Scholar]
  34. Karn, A.K.; Agrawal, R.; Kumar, A.; Mukhopadhyay, A. Deposition and process parameter optimization of electroless Ni-B coating from a stabilizer free bath to achieve enhanced microhardness, scratch-hardness and adhesion using taguchi’s methodology. Eng. Res. Express 2023, 5, 035036. [Google Scholar] [CrossRef]
  35. Rajkumar, G.; Saravanan, M.; Bejaxhin, A.B.H.; Sharma, S.; Dwivedi, S.P.; Kumar, R.; Singh, S. Parametric Optimization of Powder-Mixed EDM of AA2014/Si3N4/Mg/Cenosphere Hybrid Composites Using Fuzzy Logic: Analysis of Mechanical, Machining, Microstructural, and Morphological Characterizations. J. Compos. Sci. 2023, 7, 380. [Google Scholar] [CrossRef]
  36. Naik, N.; Bhat, R.; Shivamurthy, B.; Shetty, R.; Parashar, P.R.; Hegde, A.L. Statistical and Artificial Neural Network Coupled Technique for Prediction of Tribo-Performance in Amine-Cured Bio-Based Epoxy/MMT Nanocomposites. J. Compos. Sci. 2023, 7, 372. [Google Scholar] [CrossRef]
  37. Koh, S.; Noda, S.; Taguchi, S. Population Dynamics in the Biogenesis of Single-/Multi-Layered Membrane Vesicles Revealed by Encapsulated GFP-Monitoring Analysis. Appl. Microbiol. 2023, 3, 1027–1036. [Google Scholar] [CrossRef]
  38. Aydın, M.E. Taguchi Metodu ve Bir Uygulama İstanbul Üniversitesi Sosyal Bilimler Enstitüsü, Üretim Ana Bilim Dalı. 1994. Available online: http://nek.istanbul.edu.tr:4444/ekos/TEZ/23644.pdf (accessed on 25 September 2023).
  39. TS EN 1426; Bitumen and Bituminous Binders—Determination of Needle Penetration. Turkish Standards Institution: Ankara, Turkey, 2015.
  40. TS EN 1427; Bitumen and Bituminous Binders—Determination of the Softening Point—Ring and Ball Method. Turkish Standards Institution: Ankara, Turkey, 2015.
  41. TS EN ISO 2719; Determination of Flash Point—Pensky-Martens Closed Cup Method. Turkish Standards Institution: Ankara, Turkey, 2016.
  42. TS EN 15326+A1; Bitumen and Bituminous Binders—Measurement of Density and Specific Gravity—Capillary-Stoppered Pycnometer Method. Turkish Standards Institution: Ankara, Turkey, 2010.
  43. Yüknü, K.; Öztürk, T.; Komut, M. Bitümlü Bağlayıcılar Laboratuvar el Kitabı; Karayolları Genel Müdürlüğü, Ulaştırma ve Altyapı Bakanlığı: Ankara, Türkiye, 2021. [Google Scholar]
  44. Orhan, F. Bitümlü Karışımlar Laboratuvarı Çalışmaları; T.C Ulaştırma ve Altyapı Bakanlığı Karayolları Genel Müdürlüğü, Araştırma Ve Geliştirme Dairesi Başkanlığı Üstyapı Geliştirme Şubesi Müdürlüğü: Ankara, Turkey, 2012. [Google Scholar]
  45. Geçkil, T. Physical, chemical, microstructural and rheological properties of reactive terpolymer-modified bitumen. Materials 2019, 12, 921. [Google Scholar] [CrossRef]
  46. Jeyapaul, R.; Shahabudeen, P.; Krishnaiah, K. Quality management research by considering multi-response problems in the Taguchi method—A review. Int. J. Adv. Manuf. Technol. 2005, 26, 1331–1337. [Google Scholar] [CrossRef]
  47. Joshi, J.R.; Bhanderi, K.K.; Patel, J.V.; Karve, M. Chemical modification of waste cooking oil for the biolubricant production through transesterification process. J. Indian Chem. Soc. 2023, 100, 100909. [Google Scholar] [CrossRef]
  48. Wan Azahar, W.N.A.; Bujang, M.; Jaya, R.P.; Hainin, M.R.; Mohamed, A.; Ngad, N.; Jayanti, D.S. The potential of waste cooking oil as bio-asphalt for alternative binder—An overview. J. Teknol. 2016, 78. [Google Scholar] [CrossRef]
  49. Janaswamy, S.; Yadav, M.P.; Hoque, M.; Bhattarai, S.; Ahmed, S. Cellulosic fraction from agricultural biomass as a viable alternative for plastics and plastic products. Ind. Crops Prod. 2022, 179, 114692. [Google Scholar] [CrossRef]
Figure 1. Total production of asphalt in EU-27 and EU-27 plus Norway, Switzerland, Turkey, and Great Britain from 2008 to 2020 (in million tons) [3].
Coatings 13 01866 g001
Figure 2. Systematics of the Taguchi method. Adapted/Redrawn from Ref. [38].
Coatings 13 01866 g002
Figure 3. Experiment additives and equipment.
Coatings 13 01866 g003
Figure 4. Flow chart of experiments applied to bitumen.
Coatings 13 01866 g004
Figure 5. Penetration test results before and after RTFOT.
Coatings 13 01866 g005
Figure 6. Softening point test results before and after RTFOT.
Coatings 13 01866 g006
Figure 7. Flash point test results.
Coatings 13 01866 g007
Figure 8. Penetration index.
Coatings 13 01866 g008
Figure 9. Marshall samples and equipment.
Coatings 13 01866 g009
Figure 10. Performance statistics of softening point for all levels.
Coatings 13 01866 g010
Figure 11. Experiment No. 1 before RTFOT–FTIR.
Coatings 13 01866 g011
Figure 12. Experiment No. 5 before RTFOT–FTIR.
Coatings 13 01866 g012
Figure 13. Experiment No. 5 after RTFOT–FTIR.
Coatings 13 01866 g013
Table 1. Test results of B 70/100 penetration pure bitumen.
TestsUnitB 70/100
Test StandardsSpec. LimitsMeasured Value
Penetration Test Result0.1 mmTS EN 1426 [39]70–10074
Softening Point Test Result°CTS EN 1427 [40]43–5144
Flash Point Test Result°CTS EN ISO 2719 [41]min 230296
Specific Gravity Test Resultgr/cm3TS EN 15326+A1 [42]1.0–1.11.05
Table 2. Parameters and levels of modified bitumen.
ParameterWaste Vegetable Oil (%)Waste Agricultural Ash (%)Temperature (°C)Mixing Time (min)
Level
10017010
20318020
30619030
42018030
52319010
62617020
74019020
84317030
94618010
Table 3. Mass losses of the experimental groups after the RTFOT experiment.
Experiment Group NoSpecification LimitsM1 (gr)M2 (gr)Mass Loss (gr)Average Mass Loss (gr)
Experiment Group No:1Max. 0.8152.20152.100.100.150
146.90146.700.20
148.10147.900.20
157.10157.000.10
Experiment Group No:2Max. 0.8151.60151.500.100.225
155.60155.400.20
147.90147.800.10
157.10156.600.50
Experiment Group No:3Max. 0.8152.20152.100.100.125
147.00146.800.20
147.90147.800.10
157.00156.900.10
Experiment Group No:4Max. 0.8162.00161.800.200.200
155.40155.200.20
148.10147.900.20
147.20147.000.20
Experiment Group No:5Max. 0.8152.30152.000.300.300
147.00146.800.20
148.50148.100.40
157.30157.000.30
Experiment Group No:6Max. 0.8152.20152.100.100.125
146.70146.600.10
148.50148.400.10
157.10156.900.20
Experiment Group No:7Max. 0.8152.90152.900.000.100
146.90146.700.20
148.20148.100.10
157.00156.900.10
Experiment Group No:8Max. 0.8151.80151.600.200.375
155.50155.200.30
148.00147.800.20
157.10156.300.80
Experiment Group No:9Max. 0.8152.00151.700.300.200
155.40155.300.10
148.00147.800.20
157.10156.900.20
Table 4. Physical properties of the aggregate used in this study.
TestsCoarse AggregateFine AggregateFiller
Volume Specific Gravity (gr/cm3)2.682.652.49
Apparent Specific Gravity (gr/cm3)2.72.692.71
Absorption (%) (TS 3526)0.340.593.51
Table 5. Aggregate gradation used in this study.
Sieve No1. Group (%) 2. Group (%) 3. Group (%)Mix Gradation (%)Spec. Limits (%)
Inchmm0.220.410.37
125100100100100100100
3/419100100100100100100
1/212.544.610010087.883100
3/89.52.691.3100757090
No 44.751.329.510049.44055
No1021.24.872.3292538
No 400.421.12.427.511.41020
No 800.1812.217.97.7615
No 2000.0750.81.811.95.3410
Table 6. Test results for optimum bitumen percentage.
Sample NoBitumen Rate (%)h₁ (mm)h₂ (mm) h₃ (mm)havg (mm)Wair
(gr)
Wwater (gr)Wsat.
(gr)
V
(cm3)
Dp
(gr/cm3)
Dt (gr/cm3)Vh
(%)
Vb
(%)
Va
(%)
Vma
(%)
Vfa
(%)
Flow (mm)Stability (KN)Cor. FactorCor. Stability (N)MQ
(N/mm)
1A5.2065.365.764.665.201150.1671.41151.8480.42.394 2.3914.1890.9571357.9569.0
1B5.2067.867.667.467.601193.6693.21195.2502.02.378 2.5312.3090.9041112.8439.7
1C5.2066.866.967.066.901203.5700.21204.9504.72.385 2.6614.1560.9201302.4489.1
Average2.3852.4864.04511.22384.7315.26873.5062.5313.5670.9271257.7497.8
2A5.2067.567.667.667.571178.2685.41180.3494.92.381 3.9214.8260.9061343.0342.6
2B5.2064.764.664.564.601183.2689.21184.9495.72.387 3.8914.6620.9721425.2366.4
2C5.2067.968.168.068.001191.5693.71193.4499.72.384 3.9812.9060.8941153.8289.9
Average2.3842.4864.10211.21684.6815.31973.2193.9314.1300.9601307.3332.7
3A5.2066.167.567.867.131199.2697.51201.5504.02.379 2.8413.9310.9141273.4448.6
3B5.2068.067.768.167.931200.4698.11202.8504.72.378 3.3514.9230.8961337.2399.5
3C5.2067.567.767.967.701201.9701.31203.7502.42.392 4.0115.1980.9011369.3341.8
Average2.3832.4864.12811.21384.6615.34173.0923.4014.6850.9511326.7390.5
4A5.2067.367.067.367.201193694.71195.4500.72.383 2.3912.6000.9131154.0483.6
4B5.2067.868.367.767.931188.2691.71190.2498.52.384 2.5312.3600.8961107.5437.6
4C5.2067.767.367.467.471194.4697.01196.7499.72.390 2.6612.8500.9071165.0437.5
Average2.3852.4864.04311.22384.7315.26673.5152.5311.9550.9551142.2452.1
5A5.2066.365.966.166.101198.2697.51200.6503.12.382 3.8313.0000.9381214.0316.9
5B5.2067.367.867.567.531194.3694.61195.9501.32.382 2.7511.8000.9051068.4388.4
5C5.2066.166.466.566.331179.6685.91181.3495.42.381 1.9512.9700.9331210.6621.9
Average2.3822.4864.19511.20584.6015.40072.7612.8412.0250.9681164.3409.6
6A5.2067.467.567.167.331205.6702.51207.3504.82.388 3.4213.1080.9101193.0349.2
6B5.2066.666.566.666.571190.2693.71192.1498.42.388 2.9612.4740.9061130.0381.2
6C5.2067.367.467.667.431199.3698.51201.4502.92.385 1.4613.4010.9071216.0831.0
Average2.3872.4863.98111.23084.7915.21273.8282.6112.9950.9081179.7451.2
7A5.2066.667.067.166.901197.5697.51199.4501.92.386 2.1011.8800.9201093.0521.1
7B5.2066.566.366.766.501199.3699.11201.4502.32.388 2.3611.0470.9301027.4436.3
7C5.2066.766.866.466.631188.5694.21190.4496.22.395 2.0211.1900.9261036.6514.2
Average2.3902.4863.87811.24284.8815.12174.3512.1611.3700.9251052.3488.1
8A5.2066.666.566.466.501187.9692.61189.8497.22.389 2.7511.7970.9301097.1398.9
8B5.2066.466.066.366.231197.6697.61199.4501.82.387 1.9512.9700.9351213.2623.2
8C5.2066.566.966.766.701195.8696.41197.3500.92.387 3.4212.0070.9251110.7325.1
Average2.3882.4863.95411.23484.8115.18873.9642.7012.2570.9301140.3421.6
9A5.2063.163.563.463.331189.4692.81190.7497.92.389 2.9611.3751.0051143.3385.7
9B5.2065.966.266.166.071192.4694.61194.3499.72.386 1.4612.1530.9391140.7779.6
9C5.2066.266.566.966.531184.8692.01186.9494.92.394 2.1012.4210.9291156.0551.1
2.3902.4863.87411.24384.8815.11774.3742.1711.9730.9581146.7527.2
Specification Limits 3–5 >1465–752–4 >900
Table 7. Parameters and their levels.
ParametersLevels
123
(A) Waste Frying Oil (%)0.00 (A1)2.00 (A2)4.00 (A3)
(B) Waste Agricultural Ash (%)0.00 (B1)3.00 (B2)6.00 (B3)
(C) Temperature (°C)170 (C1)180 (C2)190 (C3)
(D) Time (min)10 (D1)20 (D2)30 (D3)
Table 8. L9 orthogonal array.
Experiment NoWaste Frying Oil (%)Waste Agricultural Ash (%)Temperature (°C)Time (min)
11111
21222
31333
42123
52231
62312
73132
83213
93321
Table 9. Penetration, softening point, and flash point results.
Experiment NoPenetrationSoftening PointFlash Point
0.1 mmS/N°CS/N°CS/N
187.30038.81948.500−33.715274.00048.755
275.60037.56950.500−34.066286.00049.127
363.40036.03952.000−34.320294.00049.367
4140.50042.95336.300−31.198254.00048.097
5128.40042.17139.500−31.932262.00048.366
6115.60041.25941.300−32.319268.00048.563
7200.50046.04232.800−30.318252.00048.028
8185.40045.36235.800−31.078255.00048.131
9169.60044.58837.400−31.457256.00048.165
Table 10. Average S/N effects for penetration tests.
Average S/N Effects
OilAshTemperatureTime
1st Level37.47642.60541.81341.859
2nd Level42.12741.70141.70341.623
3rd Level45.33140.62941.41741.451
Table 11. Performance estimates for penetration tests.
FactorsLevelContribution upon S/N
OilA33.686
AshB10.960
TemperatureC10.169
TimeD10.215
Contribution of All Factors (S/N) 5.029
Average Performance Statistics (S/N) 41.645
Expected Value at Optimum Conditions (S/N)/(0.1 mm) 46.674/215.625
Verification Experiment Result (S/N)/(0.1 mm) 46.519/211.800
Confidence Interval (α = 95%) (S/N) 46.196/47.152
Table 12. Taguchi ANOVA table for penetration tests.
FactorsDOFSums of SquaresVarianceF-ValuePure SumContribution %p-ValueF-Distribution Value for 2; 18
Oil2280.787140.3942030.153280.64993.2386 × 10−223.555
Ash217.6138.806127.34417.4745.8482 × 10−113.555
Temperature20.7520.3765.4340.6130.2501 × 10−23.555
Time20.7550.3785.4590.6170.2511 × 10−23.555
Error181.2450.069 0.413%
Total26301.151 100.000
Table 13. Weights and MRPI values of penetration, softening, and flash points before RTFOT.
Exp. NoPenetrationSoftening PointFlash PointMulti Response Performance Index
S/NWeightS/NWeightS/NWeight
138.8190.104−33.7150.10648.7550.1125.886
237.5690.100−34.0660.10549.1270.1135.715
336.0390.096−34.3200.10449.3670.1135.468
442.9530.115−31.1980.11548.0970.1106.642
542.1710.113−31.9320.11248.3660.1116.524
641.2590.110−32.3190.11148.5630.1116.364
746.0420.123−30.3180.11848.0280.1107.360
845.3620.121−31.0780.11548.1310.1107.217
944.5880.119−31.4570.11448.1650.1107.039
Table 14. Average S/N effects of MRPI values.
Average S/N Effects
OilAshTemperatureTime
1st Level5.6906.6306.4896.483
2nd Level6.5106.4856.4656.480
3rd Level7.2066.2916.4516.443
Table 15. Experiment results and S/N values.
Experiment NoPenetrationSoftening PointMarshall Stability
0.1 mmS/N°CS/NNS/N
156.75035.07758.200−35.2991257.66761.991
249.14033.82661.000−35.7071307.33362.327
341.21032.29562.500−35.9181326.66762.455
491.33039.21143.560−32.7831142.18061.154
583.46038.42847.400−33.5171164.33361.321
675.14037.51649.560−33.9031179.66761.435
7130.33042.30039.360−31.9011052.33060.443
8120.51041.62042.960−32.6621140.33461.140
9110.24040.84644.880−33.0421146.67361.188
Table 16. Weights and MRPI values of penetration, softening point after RTFOT, and Marshall stability.
Exp. NoPenetrationSoftening PointMarshall StabilityMRPI
S/NWeightS/NWeightS/NWeight
135.0770.103−35.2990.10661.9910.1126.794
233.8260.099−35.7070.10562.3270.1136.617
332.2950.095−35.9180.10562.4550.1136.349
439.2110.115−32.7830.11561.1540.1107.508
538.4280.113−33.5170.11261.3210.1117.367
637.5160.110−33.9030.11161.4350.1117.189
742.3000.124−31.9010.11860.4430.1098.090
841.6200.122−32.6620.11561.1400.1108.076
940.8460.120−33.0420.11461.1880.1117.900
Table 17. Average S/N effects of MRPI values of penetration, softening point after RTFOT, and Marshall stability.
Average S/N Effects
OilAshTemperatureTime
1st Level6.5877.4647.3537.354
2nd Level7.3557.3547.3427.299
3rd Level8.0227.1467.2697.311
Table 18. Performance estimates and verification results.
PenetrationSoftening PointMarshall Stability
Expected Values at MRPI Optimum Conditions42.549S/N−32.535S/N60.625S/N
134.1120.1 mm42.340°C1074.584N
Verification Experiment Results43.245S/N−33.023S/N60.809S/N
145.3000.1 mm44.800°C1097.550N
S/N Confidence Interval (α = 95%)41.59243.507−33.409−31.66160.14461.105
Table 19. Frequency ranges of samples according to FTIR spectrum.
Compound TypeBondWave NumberExperiment No. 1 before RTFOTExperiment No. 5 before RTFOTExperiment No. 5 after RTFOT
AlkanesMethylene GroupCyclohexane Ring1055–1000 cm−1 1005–925 cm−1952.73
Alkynes C–C Stress1350–1000 cm−11151.37
AlkanesMethyl GroupC–H BendingSymmetrical 1380–1370 cm−11378.951375.091377.02
Methyl GroupC–H BendingAsymmetric 1470–1430 cm−11463.811454.161461.88
Methylene GroupC–H StressSymmetrical 2865–2845 cm−12852.412854.332850.47
Methylene GroupC–H StressAsymmetric 2935–2915 cm−12919.912921.832917.97
C–H Stress2850–2970 cm−1 2954.622960.41
Disclaimer/Publisher’s Note: The statements, opinions and data contained in all publications are solely those of the individual author(s) and contributor(s) and not of MDPI and/or the editor(s). MDPI and/or the editor(s) disclaim responsibility for any injury to people or property resulting from any ideas, methods, instructions or products referred to in the content.

