Article

Effect of Cyclic Loading on the Surface Microstructure Evolution in the Pearlitic Rail

1
Metals and Chemistry Research Institute, China Academy of Railway Sciences Corporation Limited, Beijing 100081, China
2
School of Mechanical, Electronic and Control Engineering, Beijing Jiaotong University, Beijing 100044, China
*
Author to whom correspondence should be addressed.
Coatings 2023, 13(11), 1850; https://doi.org/10.3390/coatings13111850
Submission received: 31 August 2023 / Revised: 7 October 2023 / Accepted: 12 October 2023 / Published: 27 October 2023
(This article belongs to the Special Issue Microstructure, Mechanical and Tribological Properties of Alloys)

Abstract

:
The effects of cyclic loading on the surface microstructure evolution of different contact locations in a used pearlitic rail were studied. Microstructures were analyzed using Scanning Electron Microscopy (SEM). Meanwhile, grain boundaries and crystallographic orientations were explored via Electron Backscatter Diffraction (EBSD). At last, wheel–rail contact probabilities and forces were calculated using rail profiles. The results indicate that the side wear region located in the gauge face was 71.5% in the high-angle grain boundaries (HAGBs) fraction, 0.88 in the Kernel Average Misorientation (KAM) value, 36% in the recrystallization (REX) fraction, and had a predominant orientation in grains. The rolling contact fatigue (RCF) region situated at the gauge corner was 66.3% in the HAGBs fraction, 0.92 in the KAM value, 33% in the REX fraction, and was mis-orientated in grains. The region located at the edge of the running band was 60.7% in the low-angle grain boundaries (LAGBs) fraction, 0.97 in the KAM value, 12% in the REX fraction, and was mis-orientated in grains. Continuous dynamic recrystallization (cDRX) took place in wear and RCF regions during the cyclic rolling contact loading, creating ultra-fine grains with a transformation from LAGBs to HAGBs, lower KAM values, and more REX. Grains oriented along [111] parallel to the vertical direction in the wear region were influenced by the dominant normal force, while grains in the RCF region were non-oriented, which was attributed to large lateral and vertical forces of similar magnitudes.

1. Introduction

Railway transportation is a popular choice for urban travel due to its speed, energy-efficiency, safety, and environmental benefits. However, it faces challenges such as wear and rolling contact fatigue (RCF). During operation, rails are susceptible to fractures, particularly in small-radius curves where the gauge angle force is high [1,2]. These conditions often lead to the initiation of fatigue cracks, which can escalate into catastrophic failures. Over time, the rails undergo wear and may also sustain fatigue damage. Numerous studies have explored the mechanisms of rail damages. Hu Y. et al. [3] found that as creepages and pressures increased, wear and RCF damage escalated for both premium pearlitic and carbon-free bainitic rails. Moreover, the crack propagation mechanism transitioned from solely intergranular to a combined mode of intergranular and transgranular propagation [3]. Similarly, Liu J. P. et al. [4] discovered that the RCF wear mechanism was pivotal at a low slip ratio, but the dominant wear mechanism transferred to abrasive wear at a high slip ratio. Additionally, an increase in contact stress not only intensified plastic flows but also facilitated the propagation of cracks [4]. Wang H.H. et al. [5] observed that the degree of wear rate increase and crack propagation rate was not consistent with the increase in slip ratio, which led to the competition between wear and RCF. In addition, such a competitive relationship was also reflected in the changes in rail wear form [5]. Taraf et al. [6] conducted numerical analyses, concluding that factors like the friction coefficient between the wheel and rail, material quality, and axle load significantly influenced RCF initiation. RCF results from the accumulation of plastic flow and strain hardening in rail materials, eventually leading to failure [7]. When RCF damage accumulates and flakes off, it becomes wear [8]. Wear and RCF are interrelated issues that both restrict and compete with each other.
Electron Backscatter Diffraction (EBSD) is a valuable tool for examining material microstructures in modern advanced analysis. It is beneficial to investigate grain boundary angles, crystal orientations, dislocations, crack propagation, etc. [9,10,11]. Grains in polycrystalline materials gather and arrange in a certain direction under the influences of forces, heat, electricity, magnetism, etc. Such a microstructure is called texture, which reflects the orientation in grains. Various studies have explored the impact of texture. It is reported that a dominant {110} crystallographic texture near the rail surface could inhibit crack formation and enhance wear resistance [12]. In another study, {110} grains aligned with the direction of train travel and could accelerate crack propagation, while {111} grains were more resistant to fatigue-induced cracking [13]. In another study, grains oriented {001} parallel to the train running direction were responsible for fatigue crack formation and propagation [14]. It is worth noting that a particular dominant crystallographic orientation can significantly slow down the formation and spread of fatigue cracks, but such a specific orientation was various in different materials and related to defects. Microstructure evolution will cause significant changes in mechanical properties, which will further influence the wear and fatigue resistance performance of rail materials.
In summary, most of the previous works are focused on the relationship between microstructure, properties, and defects. However, the effects of cyclic train loading on the rail microstructure have not yet been explored comprehensively. In addition, microstructure evolutions of different defect characteristics in the same rail are lacking in research. In this work, a fractured pearlitic rail with side wear and oblique cracks was studied. Microstructure variation, grain sizes, crystallographic orientations, and angles of grain boundaries in different defects were analyzed. In addition, wheel–rail contact points and corresponding contact probabilities were simulated and calculated based on rail profile measurement, and contact forces were thoroughly analyzed. The aim of this work was to investigate the effect of cyclic loading on the surface microstructure evolutions of the wear region, RCF region, and the edge of the running band in a used pearlitic rail.

2. Materials and Methods
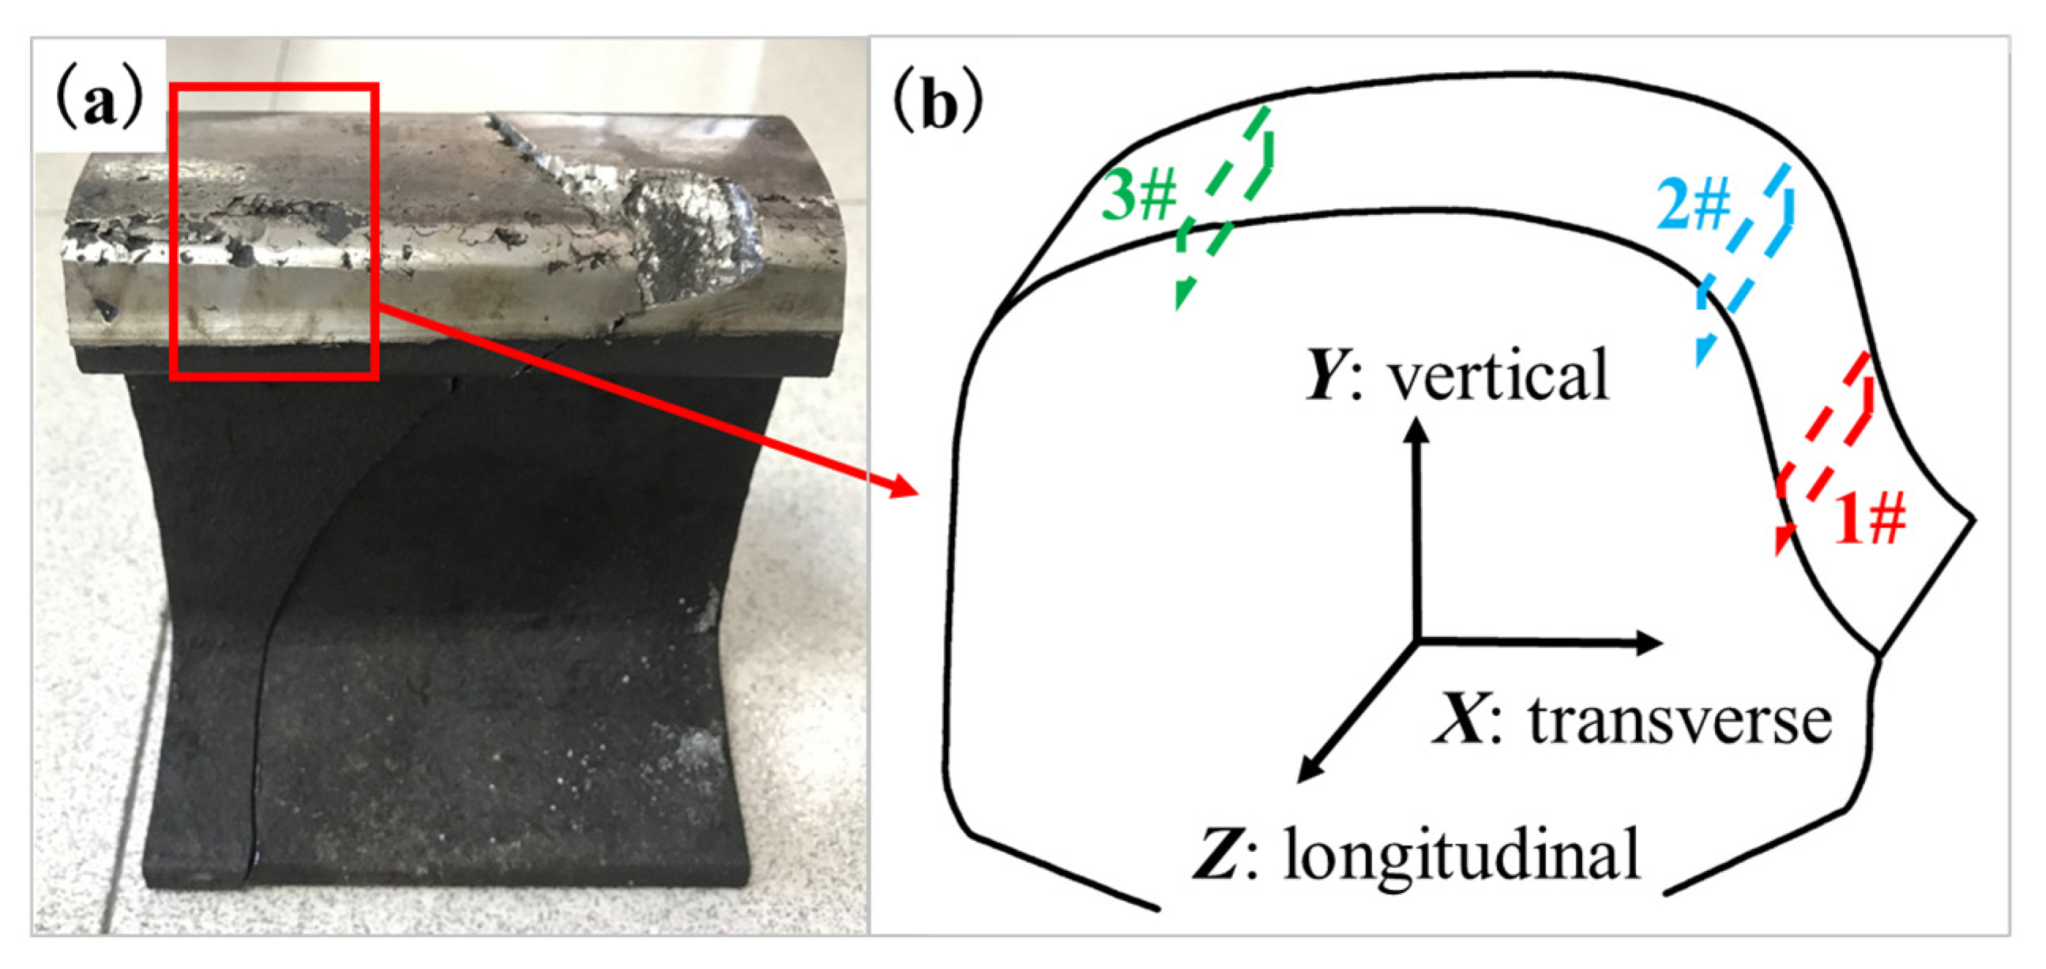
2.1. Materials

The pearlitic samples were cut from a used rail exhibiting head fractures, as shown in Figure 1a. This particular rail was part of a high rail on a curved subway line with a 350 m radius. Notably, there is significant deformation and cracking at the gauge corner of the rail and severe side wear in the gauge face. To investigate further, three distinct samples—labeled 1#, 2#, and 3#—were selected from the area highlighted in the frames in Figure 1b, each showcasing noticeable wear features. Sample 1# exhibited side wear in the gauge face, while sample 2# was located at the gauge corner and showed a propensity for oblique cracks and rolling contact fatigue (RCF) defects. Sample 3# was taken from the edge of the running band and experienced minimal stress, making it a good representation of the rail’s original condition. In terms of macroscopic coordinates, X corresponds to the transverse direction across the rail, Y represents the vertical direction normal to the rail, and Z aligns with the train’s running direction along the rail.
The rail is of the U75V steel grade, and its chemical composition and mechanical properties are detailed in Table 1. Its chemical composition was tested using the vacuum direct reading spectrometer (ARL-4460). Characteristically, this rail type has a near-eutectoid structure, containing 0.75% carbon and consisting of lamellar pearlite with a minor presence of pro-eutectoid ferrite. Tensile strength and elongation were tested using the universal testing machine (CMT5305). Hardness was tested using the Brinell hardness tester (3000BLD).

2.2. Experimental Procedures

Transverse profile measurements of the rail were conducted using a MiniProf profilometer. Subsequently, samples were prepared for metallographic analysis. Each sample was first embedded in resin, then sequentially ground with SiC papers, polished using diamond suspensions, and etched with a 2% Nital solution. Microstructural investigations were carried out using scanning electron microscopy (SEM, FEI Quanta 650 FEG) equipped with an HKL Channel 5 System. The HKL Channel 5 System was also employed for electron backscatter diffraction (EBSD) analysis, conducted at an accelerating voltage of 20 kV, a dip angle of 70°, and a working distance (WD) of 9.8 mm. This allowed for the study of local crystal orientation and boundary distributions with a step size of 0.15 μm. Prior to EBSD, samples were coated with electrodeposited nickel to protect the surface layer. They were then mechanically polished and electrolytically polished for one minute using a solution of 7% perchloric acid and 93% alcohol, at a current density of 450 mA/cm2, to achieve high-quality surface gradient samples.

2.3. Simulation and Calculation

Microstructure is closely related to the force conditions of the material. However, it is quite difficult to test the forces of the rail from the train, and the simulation and calculation for the forces are particularly important. A dynamic model of a train-track system based on the actual parameters of the trains on the test track was established by Ansys [15,16,17]. The vehicle model mainly consisted of one car body, two bogie frames, four wheelsets, eight axle boxes, and primary and secondary suspension systems. According to the operating conditions of the rail, the train-track dynamic model was set up by a curve line for passengers not for freight, with the primary parameters detailed in Table 2. Furthermore, Hertz theory and the FASTSIM algorithm were used to calculate the contact patch and creep forces for the wheel–rail contact mode [17,18].
Using dynamic simulation, wheel–rail contact distributions and probabilities based on both the rail’s actual tested profile and its standard profile were calculated. The wheel–rail profile data were measured using the MiniProf profile measurement instrument (Greenwood, Germany).
Fatigue index and wear index are used to represent the contact fatigue and wear characteristics of the rail under the actual wheel–rail matching relationship. The fatigue index mainly represents the relationship between the shear stress of the rail at the wheel–rail contact interface and the shear strength of the rail, which is calculated from the wheel–rail creep force, normal contact force, and contact patch area. When the fatigue index is less than 0, the shear stress of the rail is less than the shear fatigue strength, and the probability of contact fatigue damage is low. When the fatigue index is greater than 0, the shear stress of the rail is greater than the shear fatigue strength, and it is easy for contact fatigue damage to appear. The higher the fatigue index, the more likely contact fatigue injury is to occur. Similarly, rail wear was quantified by a wear index, which correlated with the wheel–rail creep rate and force. A higher index indicates a greater likelihood of wear. The fatigue index F and wear index W for the wheel–rail contact points were computed using Equation (1) [19] and Equation (2) [20].
F = T x 2 + T y 2 F z 2 π a b k 3 F z
where Tx, Ty: the wheel–rail contact longitudinal and lateral creep forces (kN);
  • Fz: the wheel–rail normal force (kN);
  • a, b: the semi-major and semi-minor axis length of the contact patch (m);
  • k: the shear yield strength of the material.
W = T x v x + T y v y + M z φ z
where vx, vy: longitudinal and lateral creep rate; Mz, φ z : spin creep force and rate.
Additionally, the lateral and vertical forces for samples 1#, 2#, and 3# were calculated using dynamic simulation, based on the rail’s actual tested profile data.
It should be noted that the above-mentioned parameters, such as wheel–rail creep force, wheel–rail creep rate, wheel–rail contact patch area, and wheel–rail normal force, can be directly output by dynamic simulation.

3. Results and Discussion

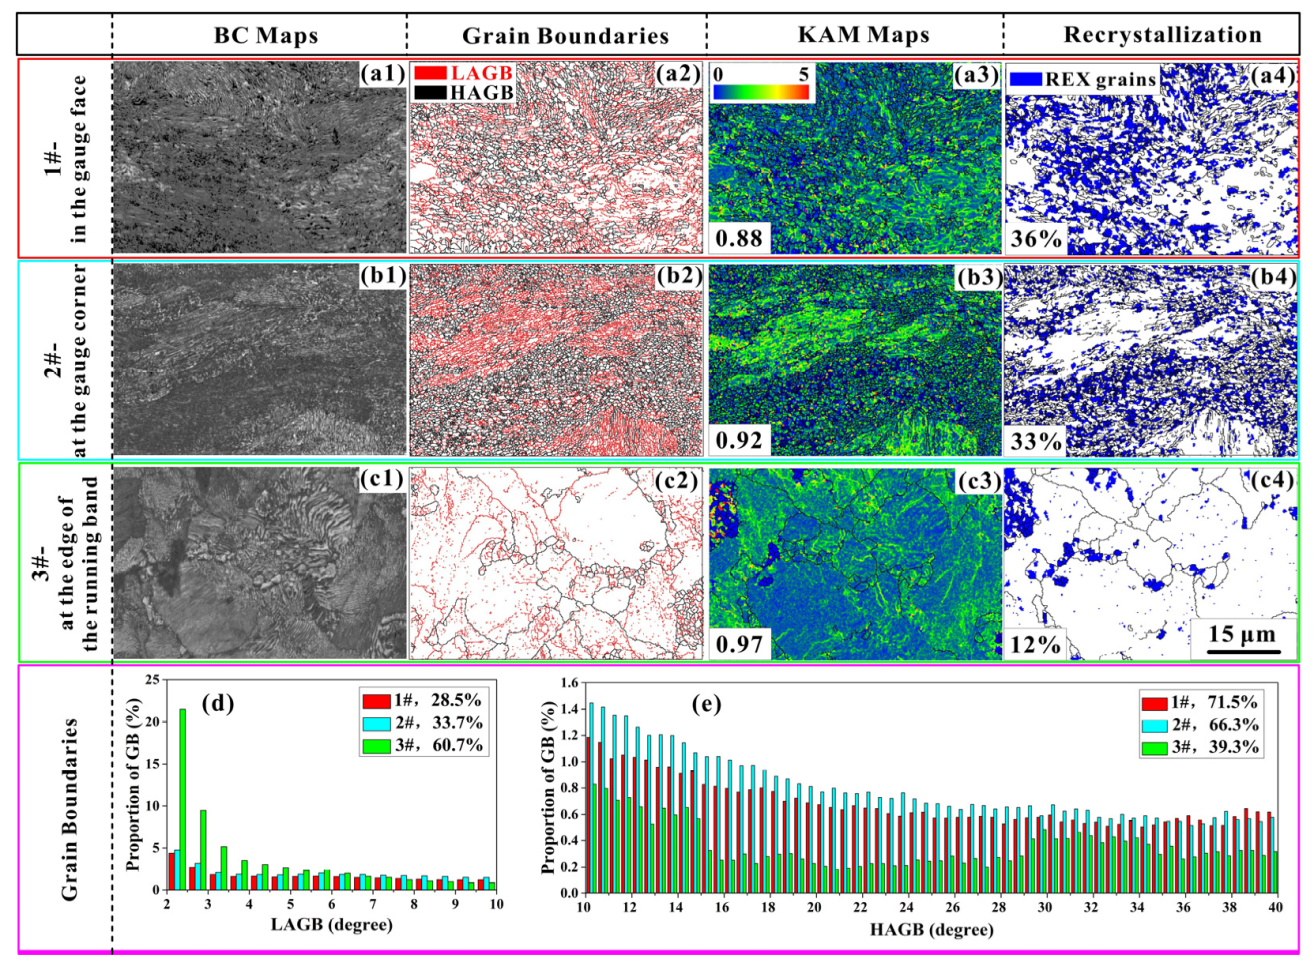
3.1. Microstructure Characterizations

Figure 2a1–c1 display the magnified EBSD-BC (Band Contrast) maps of the samples, revealing different pearlite morphologies influenced by wheel–rail contact. The surface layers of samples 1# and 2# exhibited deformed zones featuring fine, fragmented, streamlined pearlite structures (as seen in Figure 2a1,b1). This suggests that average grain size is correlated with the extent of deformation. Intense plastic deformation, resulting from the interaction between the rail and wheels, led to significant grain refinement. In contrast, sample 3# had large grains and showed minimal deformation, likely due to less frequent wheel contact (as illustrated in Figure 2c1).
Figure 2a2–c2 present magnified GB (Grain Boundary) maps for the three samples. Initially, during wheel–rail contact, the rail maintained a large-grain morphology filled with sub-grains or LAGBs (Low-Angle Grain Boundaries), as shown in red in Figure 2c2. When wear occurred, the occurrence of HAGBs (High-Angle Grain Boundaries) increased, evidenced by the darker areas in Figure 2a2,b2. The increase in HAGBs suggests that the rail underwent dynamic recrystallization. In conventional dynamic recrystallization, the process eliminates deformation defects like dislocations and sub-boundaries by means of nucleation and growth of dynamic recrystallization grains, which relies on the migration of HAGBs. The required energy is provided by two possible sources: (1) stored deformation energy and (2) high temperature (0.4Tm). Known as discontinuous dynamic recrystallization (dDRX), this is a “discontinuous” phenomenon [21]. However, during the cycle rolling–sliding contact process, dynamic recrystallization can occur at lower temperatures due to severe deformation. Studies indicate that wheel–rail materials undergo dynamic recrystallization as a result of plastic accumulation [22,23]. This low temperature dynamic recrystallization is termed continuous dynamic recrystallization (cDRX) [24,25,26]. Unlike dDRX, cDRX involves the continuous absorption of dislocations by sub-boundaries, and their angles increase from small to large with no HAGB migration. Consequently, the rail material underwent cDRX from sample 3# to sample 1# or sample 2#, as evidenced by the increase in HAGBs observed in Figure 2a2,b2,d,e, which display part of the distributions of grain boundaries for the three samples, with all statistical data provided in the upper right corner. LAGBs were calculated with GBs between grains with orientation differences greater than 2° and less than 10°, and those with orientation differences greater than 10° were HAGBs. Sample 3# is predominantly characterized by LAGBs, mainly ranging between 2 to 3 degrees. In contrast, samples 1# and 2# are primarily composed of HAGBs. Notably, sample 1# exhibits a higher proportion of HAGBs compared to sample 2#.
Figure 2a3–c3 display the Kernel Average Misorientation (KAM) maps for the three samples. KAM represents the dislocation densities or deformation storage energy in individual grains. The low KAM values indicate an annihilation of the dislocations and the formation of new low-strain ultrafine grains [13]. Sample 3# exhibited a relatively high KAM value, indicated by more red or yellow regions in Figure 2c3. This sample mostly consisted of original grains that had not undergone recrystallization, containing numerous sub-grain boundaries, dislocations, and stored deformation energy within the large grains. After wheel–rail interaction, cDRX took place. The sub-grains absorbed dislocations to minimize internal energy, resulting in the formation of new ultrafine grains that filled in the existing large grains [13]. This process led to a reduction in the KAM value, as evidenced by the shift to green or blue regions in Figure 2a3,b3. Compared to sample 2#, the KAM value for sample 1# is notably lower.
Figure 2a4–c4 show the recrystallization (REX) grains for the three samples. A clear progression of recrystallization is evident from sample 3# to samples 2# or 1#. This is indicated by the fine, recrystallized grains in blue that precipitated and grew along the grain boundaries, eventually filling the larger grains [27]. The REX fraction remained relatively constant at around 12% for sample 3#, but increased to 33% for sample 2# and 36% for sample 1#. This increase in the REX fraction confirms the occurrence of cDRX. In comparison to sample 2#, sample 1# exhibited more recrystallization.
The differences between samples 3# and 1# or 2# highlight the microstructural evolution of rail materials under wheel–rail rolling contact. In the present work [28,29,30], the microstructural evolution of metal materials can be segmented into several steps: initial plastic deformation, formation of dislocation walls and tangles, transition of dislocation walls to sub-boundaries, transformation from LAGBs to HAGBs, and, ultimately, the development of a nanocrystalline grain structure. This study observed a similar progression in the context of cDRX. Despite both samples 1# and 2# undergoing cDRX, they displayed distinct microstructural characteristics. Sample 1#, which primarily experienced wear, had a higher prevalence of HAGBs, lower KAM values, and more REX. Previous studies indicate that a moderate increase in temperature can facilitate recrystallization [31]. Given that sample 1# experienced more wear than sample 2#, the friction-generated heat elevated the temperature, thereby creating conditions that were more favorable for recrystallization.

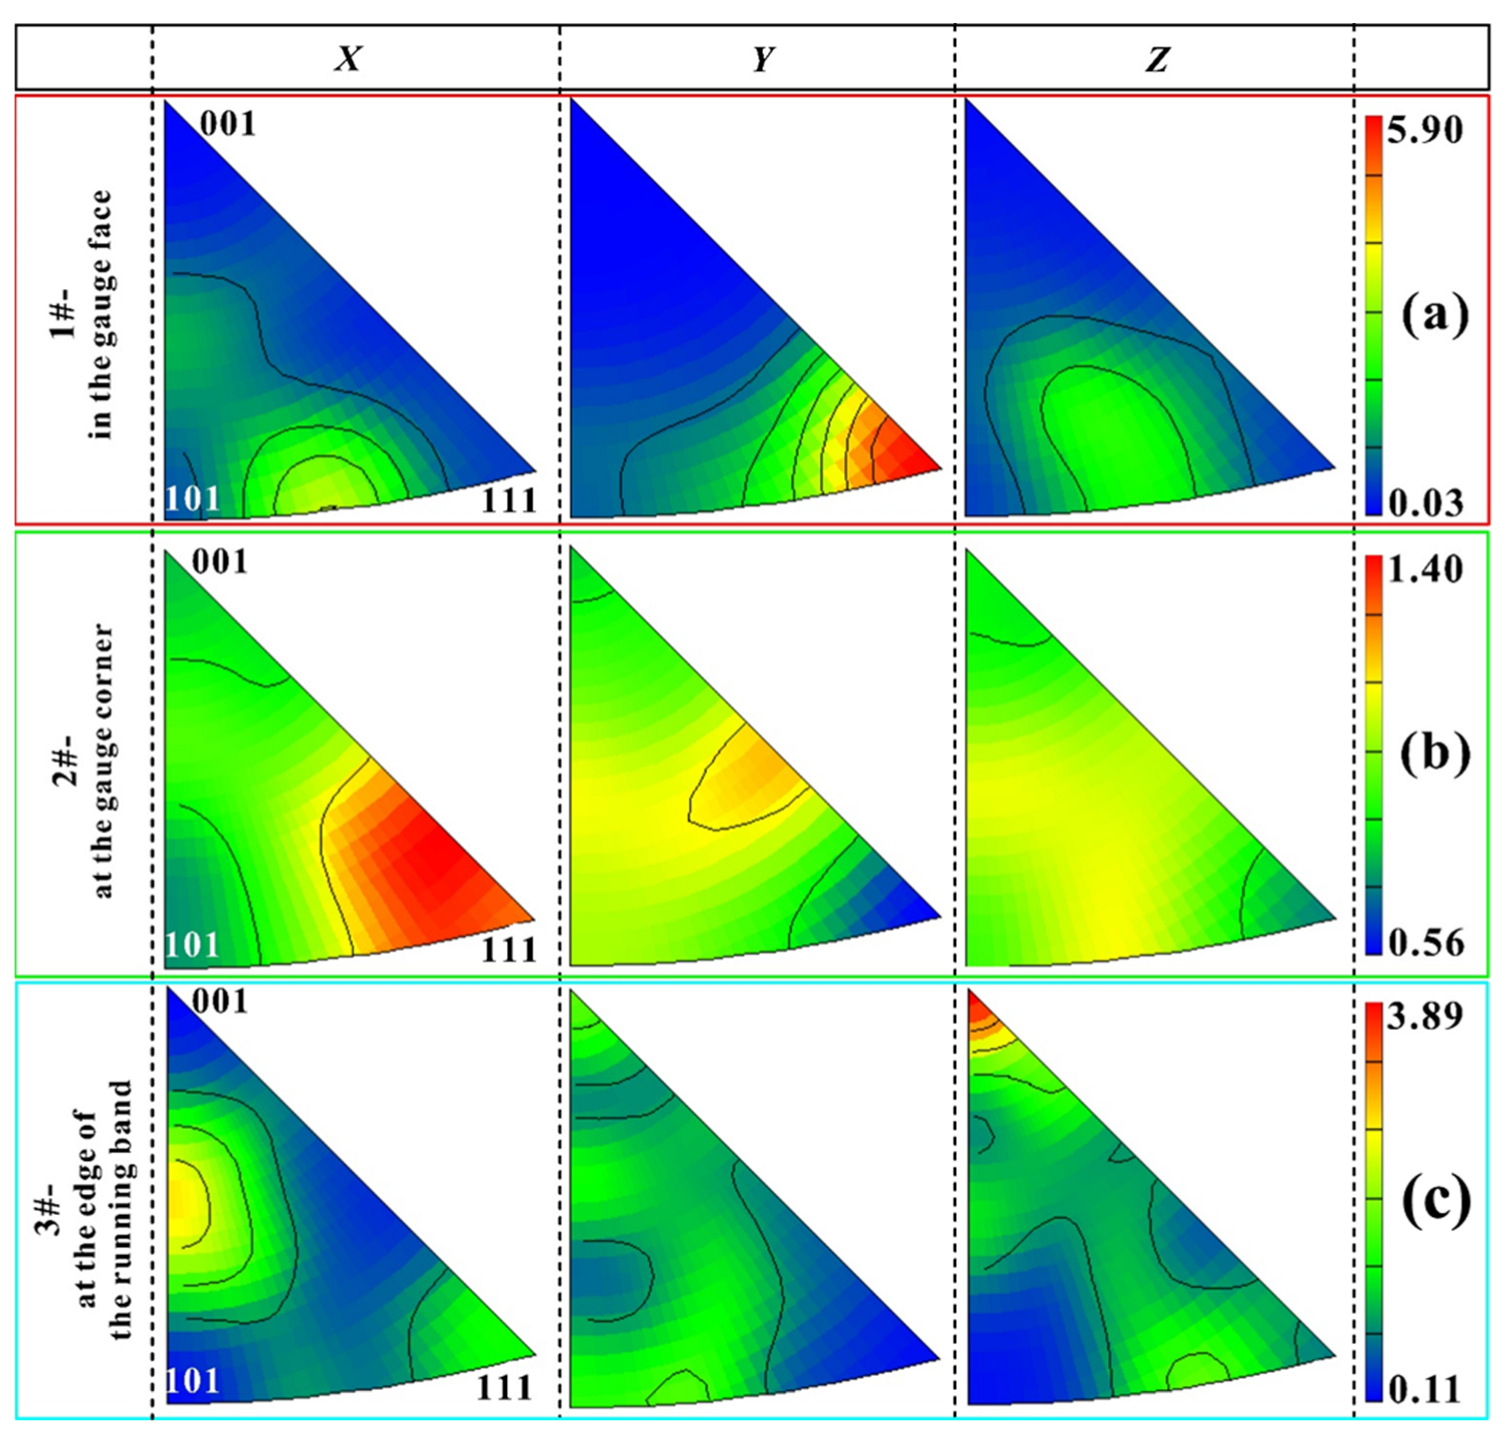
3.2. Orientation Features

Orientation image maps (OIM) of the surface layers with areas of 120 μm (longitudinal) × 80 μm (vertical) at a 150 μm depth from the running surfaces are shown in Figure 3. These maps show variations in crystallographic orientation along the transverse, vertical, and longitudinal directions. Samples 2# and 3# exhibit relatively homogeneous color distributions, while the [111] orientation predominates in the vertical direction for sample 1#. Additionally, sample 3# features larger grain sizes, whereas samples 1# and 2# consist of ultrafine grains. This observation aligns with the BC maps shown in Figure 2a1–c1. Furthermore, the presence of recrystallized small grains is evident in Figure 3a,b.
Inverse pole figures of the three samples can be seen in Figure 4. These reveal that the grains in sample 1# predominantly orient along the [111] direction parallel to the vertical axis, while samples 2# and 3# show no strong preference for any particular crystallographic orientation. In body-centered cubic (BCC) materials, crystal slip occurs through dislocation movement, characterized by a a/2⟨111⟩ Burgers vector slipping on the {110}, {112}, and {123} planes. Rails with a BCC ferrite structure tend to exhibit a preferred crystal orientation, particularly in the <111> slip direction along the vertical axis. Regarding the influence of the dislocation movement, the crystal slip prefers to move to align with the major load direction [32]. However, the specifics of this major load direction warrant further investigation.

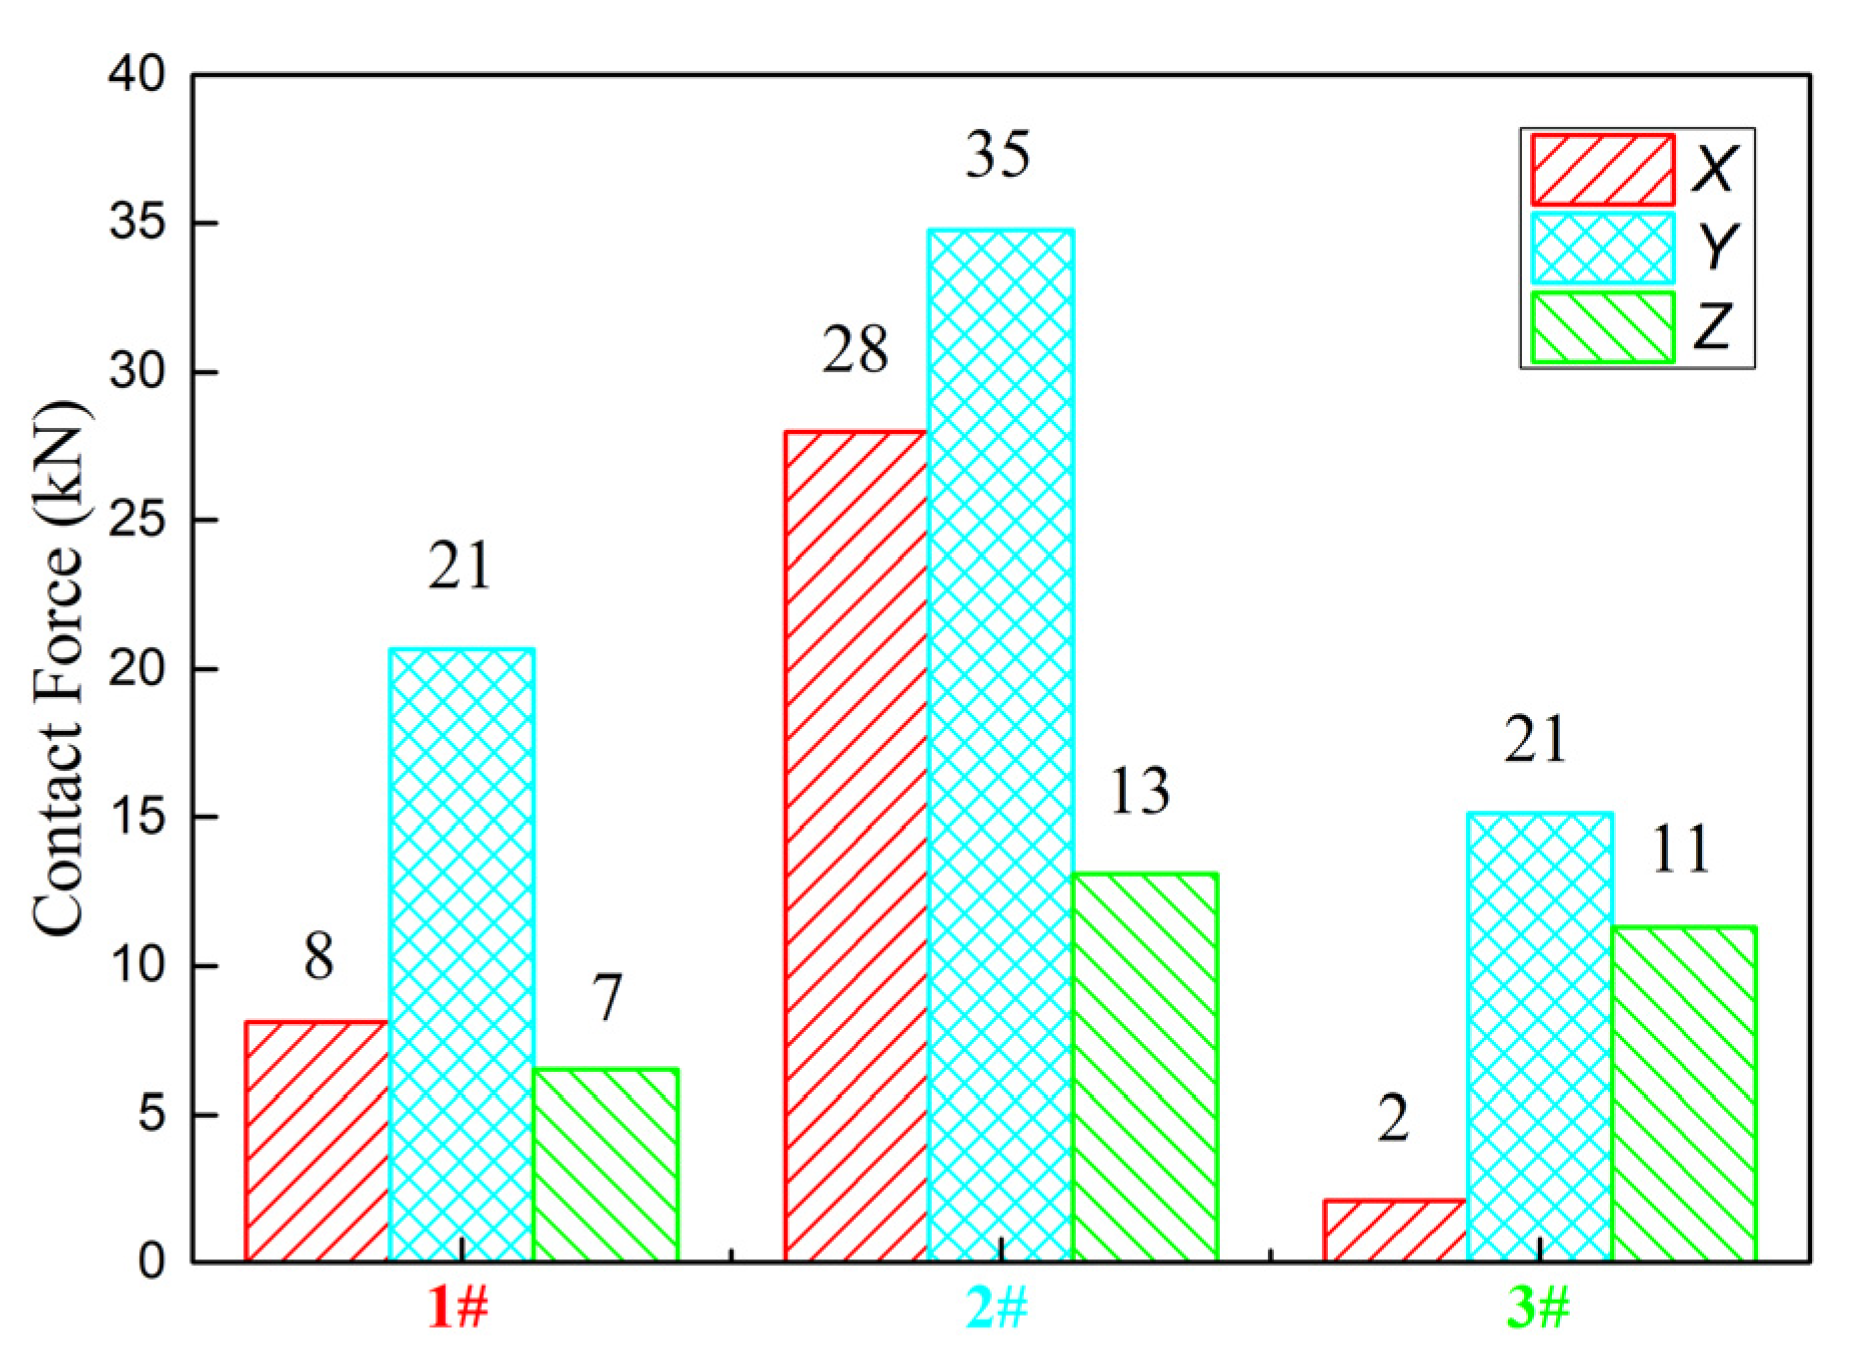
3.3. Relationship between Contact Forces and Microstructure

Figure 5 illustrates wheel–rail contact points, as determined by dynamic simulation calculations. When comparing the actual rail profile to the standard profile, the vertical and transverse wear losses for sample 1# were 10.90 mm and 6.81 mm, respectively. For sample 2#, these losses were 1.59 mm and 8.24 mm, and for sample 3#, they were 0.07 mm and 0.87 mm. Notably, wear at sample 1# was the most significant. The figure also presents calculated wheel–rail contact probabilities for each sample, based on rail profile data. Sample 3# had a low likelihood of interacting with the wheel, in contrast to samples 1# and 2#. Given its low probability of contact, sample 3# was similar to the matrix. Rail wear is a prevalent issue, particularly in sharp curves, and these computational findings align well with the actual conditions [33].
Table 3 shows the mean values of wear and fatigue indexes for the wheel–rail contact points. The mean value of the fatigue index represents the average of all fatigue indexes greater than zero as the train passes through the curve. The figure reveals that the mean wear index for sample 1# exceeds that of sample 2#, while the opposite is true for the mean fatigue index. This suggests that the wheel–rail contact points for sample 1# are more prone to wear, whereas those for sample 2# are more susceptible to fatigue. This observation aligns with what is depicted in Figure 1. Previous research has indicated that significant volume loss at the gauge face is primarily due to wear. The typical rail profiles in reference [34] are similar to Figure 5, further corroborating the wear locations. As for RCF, early visual signs of RCF defects typically appear around the gauge corner, a location where many severe cases have also been observed [35,36,37]. These computational results are in agreement with field observations.
Figure 6 presents the calculated wheel–rail forces for samples 1#, 2#, and 3#, based on rail profile data. The vertical force of sample 1# was 155% larger than the lateral force, indicating a great gap between the largest force and the second. The vertical force for sample 1# was notably larger compared to the longitudinal and lateral forces. This observation is consistent with Figure 4, where grains oriented along the [111] crystallographic axes parallel to the vertical direction were predominant in the wear region. In essence, the normal load generated by the train’s weight led to the rotation of grains within the pearlite structure, ultimately resulting in wear. As previously discussed, crystal slip tends to align with the major load direction, which, in this case, is the normal load. Consequently, the disordered grains showed a preference for the [111] orientation.
The vertical force of sample 2# was 24% larger than the lateral force, which indicated that the largest force was close to the second. With similar forces from different directions, oblique cracking occurred in sample 2#. Such oblique cracks are a common type of RCF defect. Once these cracks appear on the rail surface, they can propagate into the rail and may even extend into the rail waist, ultimately leading to severe fractures and failures. The pearlite structure in the RCF-affected region is subjected to large lateral and vertical forces of similar magnitudes, resulting in non-oriented grains.
As for sample 3#, the rails at this location had minimal contact with the wheels, rendering force analysis largely irrelevant for this particular case.
Based on the above analysis, both samples 1# and 2# underwent cDRX, resulting in similar grain sizes and HAGBs. However, the differences in crystallographic orientations can be attributed to varying load conditions. Force in a particular direction brought about fabrication with a prevalent orientation. Compared with sample 2#, sample 1# had a prominent main force; therefore, the grains were oriented along a particular direction.

4. Conclusions

The microstructure, crystallographic orientations, and load conditions of three representative locations—samples 1#, 2#, and 3#—on a used pearlitic rail with a head fracture in a sharp curve line were thoroughly analyzed. The effects of cyclic loading on the surface microstructure evolution of different contact locations in a used pearlitic rail were studied. The key findings can be summarized as follows:
Sample 1# was located in the gauge face of the rail and was indicative of side wear. Sample 2# was situated at the gauge corner and was prone to developing cracks and RCF defects. Sample 3# was located at the edge of the running band and experienced minimal load, closely resembling the rail’s original condition. Both samples 1# and 2# featured fine, fragmented, streamlined pearlite structures, while sample 3# was characterized by large, less-deformed grains.
During cyclic rolling contact loading, rail samples experiencing both wear (sample 1#) and RCF (sample 2#) underwent cDRX. Intense plastic deformation and the absorption of dislocations led to the formation of ultra-fine grains, accompanied by a transformation from LAGBs to HAGBs, lower KAM values, and more REX. In contrast, sample 3# was primarily composed of LAGBs.
The rail with wear (sample 1#) had a dominant [111] orientation parallel to the vertical direction. In contrast, the rail subjected to both wear and fatigue (sample 2#) exhibited fine pearlite with no preferred orientation, which was related to its complex forces and the competition between wear and RCF.

Author Contributions

Conceptualization, T.S. and J.L.; methodology, T.S. and J.L.; software, G.Y.; validation, G.Y. and F.L.; formal analysis, T.S. and J.L.; investigation, T.S.; resources, F.L. and A.L.; data curation, J.L.; writing—original draft preparation, T.S.; writing—review and editing, A.L.; visualization, T.S.; supervision, F.L.; project administration, F.L.; funding acquisition, A.L. All authors have read and agreed to the published version of the manuscript.

Funding

This research was funded by the National Natural Science Foundation of China (grant number 52001329), the Research and Development Fund Project of China State Railway Group Corporation Limited (grant number N2023G063), and the Research and Development Fund Project of China Academy of Railway Sciences Corporation Limited (grant number 2020YJ068).

Institutional Review Board Statement

Not applicable.

Informed Consent Statement

Not applicable.

Data Availability Statement

Data is contained within the article.

Acknowledgments

The authors gratefully acknowledge reviewers for their technical advice and kind help in improving the English text of the paper.

Conflicts of Interest

The authors declare no conflict of interest. The funders had no role in the design of the study; in the collection, analyses, or interpretation of data; in the writing of the manuscript; or in the decision to publish the results.

References

  1. Gao, Y.; Wang, P.; Wang, K.; Xu, J.; Dong, Z. Damage tolerance of fractured rails on continuous welded rail track for high-speed railways. Railw. Eng. Sci. 2021, 29, 59–73. [Google Scholar] [CrossRef]
  2. Seo, J.W.; Kwon, S.J.; Lee, D.H.; Kwon, S.T.; Choi, H.Y. Fatigue crack growth and fracture behavior of rail steels. Int. J. Railw. 2012, 3, 129–134. [Google Scholar] [CrossRef]
  3. Hu, Y.; Guo, L.; Maiorino, M.; Liu, J.; Ding, H.; Lewis, R.; Meli, E.; Rindi, A.; Liu, Q.; Wang, W. Comparison of wear and rolling contact fatigue behaviours of bainitic and pearlitic rails under various rolling-sliding conditions. Wear 2020, 460–461, 203455. [Google Scholar] [CrossRef]
  4. Liu, J.; Li, Y.; Zhang, Y.; Hu, Y.; Shi, L.; Ding, H.; Wang, W.; Liu, F.; Zhou, S.; Shi, T. Dry rolling/sliding wear of bainitic rail steels under different contact stresses and slip ratios. Materials 2020, 13, 4678. [Google Scholar] [CrossRef] [PubMed]
  5. Wang, H.; Wang, W.; Han, Z.; Wang, Y.; Ding, H.; Lewis, R.; Lin, Q.; Liu, Q.; Zhou, Z. Wear and rolling contact fatigue competition mechanism of different types of rail steels under various slip ratios. Wear 2023, 522, 204721. [Google Scholar] [CrossRef]
  6. Taraf, M.; Zahaf, E.; Oussouaddi, O.; Zeghloul, A. Numerical analysis for predicting the rolling contact fatigue crack initiation in a railway wheel steel. Tribol. Int. 2010, 43, 585–593. [Google Scholar] [CrossRef]
  7. Kapoor, A. Wear by plastic ratchetting. Wear 1997, 212, 119–130. [Google Scholar] [CrossRef]
  8. Suh, N.P. An overview of the delamination theory of wear. Wear 1977, 44, 1–16. [Google Scholar] [CrossRef]
  9. Seifi, M.; Salem, A.; Beuth, J.; Harrysson, O.; Lewandowski, J.J. Overview of materials qualification needs for metal additive manufacturing. JOM-Us 2016, 68, 747–764. [Google Scholar] [CrossRef]
  10. Dutkiewicz, J.; Rogal, Ł.; Kalita, D.; Berent, K.; Antoszewski, B.; Danielewski, H.; Węglowski, M.S.; Łazińska, M.; Durejko, T.; Czujko, T. Microstructure and properties of inconel 625 fabricated using two types of laser metal deposition methods. Materials 2020, 13, 5050. [Google Scholar] [CrossRef]
  11. Chen, X.; Yan, L.; Karnati, S.; Zhang, Y.; Liou, F. Fabrication and characterization of AlxCoFeNiCu1−x high entropy alloys by laser metal deposition. Coatings 2017, 7, 47. [Google Scholar] [CrossRef]
  12. Masoumi, M.; de Lima, N.B.; Tressia, G.; Sinatora, A.; Goldenstein, H. Microstructure and crystallographic orientation evolutions below the superficial white layer of a used pearlitic rail. J. Mater. Res. Technol. 2019, 8, 6275–6288. [Google Scholar] [CrossRef]
  13. Masoumi, M.; Ariza, E.A.; Sinatora, A.; Goldenstein, H. Role of crystallographic orientation and grain boundaries in fatigue crack propagation in used pearlitic rail steel. Mater. Sci. Eng. A 2018, 722, 147–155. [Google Scholar] [CrossRef]
  14. Masoumi, M.; Sinatora, A.; Goldenstein, H. Role of microstructure and crystallographic orientation in fatigue crack failure analysis of a heavy haul railway rail. Eng. Fail. Anal. 2019, 96, 320–329. [Google Scholar] [CrossRef]
  15. Chudzikiewicz, A. Matlab/Simulink package as a environment for rail vehical simulation study. In Proceedings of the International Design Conference-Design, Dubrovnik, Croatia, 14–17 May 2002. [Google Scholar]
  16. Wang, P.; Gao, L.; Hou, B.W. Influence of rail cant on wheel-rail contact relationship and dynamic performance in curves for heavy haul railway. Appl. Mech. Mater. 2012, 365–366, 381–387. [Google Scholar]
  17. Li, H.X.; Li, L.; Li, Z. Research on the effect of rail cant on the dynamic performance and wear characteristics of subway vehicles. Eng. Fail. Anal. 2023, 152, 10747. [Google Scholar] [CrossRef]
  18. Johnson, K.L. Contact Mechanics; Cambridge University Press: Cambridge, UK, 1985. [Google Scholar]
  19. Ekberg, A.; Kabo, E.; Andersson, H. An engineering model for prediction of rolling contact fatigue of railway wheels. Fatigue Fract. Eng. Mater. Struct. 2002, 25, 899–909. [Google Scholar] [CrossRef]
  20. Kalker, J.J. Simulation of the development of a railway wheel profile through wear. Wear 1991, 150, 355–365. [Google Scholar] [CrossRef]
  21. Sakai, T.; Belyakov, A.; Kaibyshev, R.; Miura, H.; Jonas, J.J. Dynamic and post-dynamic recrystallization under hot, cold and severe plastic deformation conditions. Prog. Mater. Sci. 2014, 60, 130–207. [Google Scholar] [CrossRef]
  22. Zhu, W.T.; Guo, L.C.; Shi, L.B.; Cai, Z.B.; Li, Q.L.; Liu, Q.Y.; Wang, W.J. Wear and damage transitions of two kinds of wheel materials in the rolling-sliding contact. Wear 2018, 398–399, 79–89. [Google Scholar] [CrossRef]
  23. Gallardo-Hernandez, E.A.; Lewis, R.; Dwyer-Joyce, R.S. Temperature in a twin-disc wheel/rail contact simulation. Tribol. Int. 2006, 39, 1653–1663. [Google Scholar] [CrossRef]
  24. Wang, B.; Liu, Z.; Wang, B.; Zhao, S.; Sun, J. Microstructural evolution in adiabatic shear band in the ultrafine-grained austenitic stainless steel processed by multi-axial compression. Mater. Sci. Eng. A 2014, 611, 100–107. [Google Scholar] [CrossRef]
  25. Belyakov, A.; Sakai, T.; Miura, H.; Kaibyshev, R.; Tsuzaki, K. Continuous recrystallization in austenitic stainless steel after large strain deformation. Acta Mater. 2002, 50, 1547–1557. [Google Scholar] [CrossRef]
  26. Kapoor, R.; Reddy, G.B.; Sarkar, A. Discontinuous dynamic recrystallization in α-Zr. Mater. Sci. Eng. A 2018, 718, 104–110. [Google Scholar] [CrossRef]
  27. Cui, L.; Jiang, S.; Xu, J.; Peng, R.L.; Mousavian, R.T.; Moverare, J. Revealing relationships between microstructure and hardening nature of additively manufactured 316L stainless steel. Mater. Des. 2021, 198, 109385. [Google Scholar] [CrossRef]
  28. Hu, Y.; Zhou, L.; Ding, H.; Lewis, R.; Liu, Q.; Guo, J.; Wang, W. Microstructure evolution of railway pearlitic wheel steels under rolling-sliding contact loading. Tribol. Int. 2021, 154, 106685. [Google Scholar] [CrossRef]
  29. He, C.G.; Ding, H.H.; Shi, L.B.; Guo, J.; Meli, E.; Liu, Q.Y.; Rindi, A.; Zhou, Z.R.; Wang, W.J. On the microstructure evolution and nanocrystalline formation of pearlitic wheel material in a rolling-sliding contact. Mater. Charact. 2020, 164, 110333. [Google Scholar] [CrossRef]
  30. Tao, N.R.; Wang, Z.B.; Tong, W.P.; Sui, M.L.; Lu, J.; Lu, K. An investigation of surface nanocrystallization mechanism in Fe induced by surface mechanical attrition treatment. Acta Mater. 2002, 50, 4603–4616. [Google Scholar] [CrossRef]
  31. Derazkola, H.A.; Gil, E.G.; Murillo-Marrodán, A.; Méresse, D. Review on dynamic recrystallization of martensitic stainless steels during hot deformation: Part I—Experimental Study. Metals 2021, 11, 572. [Google Scholar] [CrossRef]
  32. Tressia, G.; Sinatora, A.; Goldenstein, H.; Masoumi, M. Improvement in the wear resistance of a hypereutectoid rail via heat treatment. Wear 2020, 442–443, 203122. [Google Scholar] [CrossRef]
  33. Bai, W.; Liu, R.; Sun, Q.; Wang, F.; Xu, P. A stochastic model for the estimation of renewal periods of sharply curved metro rails. Proc. Inst. Mech. Eng. Part F J. Rail Rapid Transit. 2018, 232, 572–588. [Google Scholar] [CrossRef]
  34. Zhou, Y.; Wang, S.; Wang, T.; Xu, Y.; Li, Z. Field and laboratory investigation of the relationship between rail head check and wear in a heavy-haul railway. Wear 2014, 315, 68–77. [Google Scholar] [CrossRef]
  35. Gruber, C.; Hammer, R.; Gänser, H.P.; Künstner, D.; Eck, S. Use of surface acoustic waves for crack detection on railway track components—Laboratory tests. Appl. Sci. 2022, 12, 6334. [Google Scholar] [CrossRef]
  36. Máté, T.; Zwierczyk, P.T. Comparison of Rail head checks using destructive and non-destructive examination methods. J. Fail. Anal. Prev. 2022, 22, 1898–1904. [Google Scholar] [CrossRef]
  37. Garnham, J.E.; Davis, C.L. Very early stage rolling contact fatigue crack growth in pearlitic rail steels. Wear 2011, 271, 100–112. [Google Scholar] [CrossRef]
Figure 1. (a) Photograph of the rail with head fracture; (b) a sketch graph of the rail head (cross section).
Coatings 13 01850 g001
Figure 2. Magnified EBSD-BC, GB distribution, KAM, and REX grains of samples (a) 1#; (b) 2#; (c) 3#. Distributions of (d) LAGBs and (e) HAGBs.
Coatings 13 01850 g002
Figure 3. Orientation image maps (the bottom is near the running surface) of samples (a) 1#; (b) 2#; (c) 3#.
Coatings 13 01850 g003
Figure 4. Inverse pole figures of samples (a) 1#; (b) 2#; (c) 3#.
Coatings 13 01850 g004
Figure 5. Wheel–rail contact points and contact probabilities of samples 1#, 2#, and 3#.
Coatings 13 01850 g005
Figure 6. Wheel–rail forces of samples 1#, 2# and 3#.
Coatings 13 01850 g006
Table 1. Chemical composition and mechanical properties of U75V rail.
Chemical Composition (wt. %) 1
CSiMnPSVAlCu + 10SnCr + M0 + Ni + Cu
0.7980.6920.8970.0120.0090.00550.0040.1610.227
Mechanical properties
Tensile strength (MPa)1036
Elongation (%)14
Hardness (HB)296
1 Minor quantities of other elements exist.
Table 2. Main parameters of the train-track dynamic model.
Curve Parameters
Radius (m)Superelevation (mm)Circular curve (m)
35090200
Vehicle Parameters
Axle load (t)Wheel base (m)Wheel diameter (mm)Vehicle speed (km/h)
162.584060
Table 3. Wear indexes and fatigue indexes of samples 1# and 2#.
SamplesWear IndexFatigue Index
1#1770.02
2#1370.04
Disclaimer/Publisher’s Note: The statements, opinions and data contained in all publications are solely those of the individual author(s) and contributor(s) and not of MDPI and/or the editor(s). MDPI and/or the editor(s) disclaim responsibility for any injury to people or property resulting from any ideas, methods, instructions or products referred to in the content.

