Surface Modifications of Superparamagnetic Iron Oxide Nanoparticles with Polyvinyl Alcohol, Chitosan, and Activated Carbon or Graphite as Methylene Blue Adsorbents—Comparative Study

 ,
,
Abstract
:1. Introduction
2. Materials and Methods
2.1. Materials
2.2. Characterization
2.3. Determining the Adsorption and Desorption Capacity of Methylene Blue on SPION/PVA/CS/AC and SPION/PVA/CS/GR
2.4. Determining the Adsorption Kinetics, Adsorption Isotherm, and Desorption Kinetics
3. Results and Discussion
3.1. Characterization of SPION/PVA/CS/AC and SPION/PVA/CS/GR
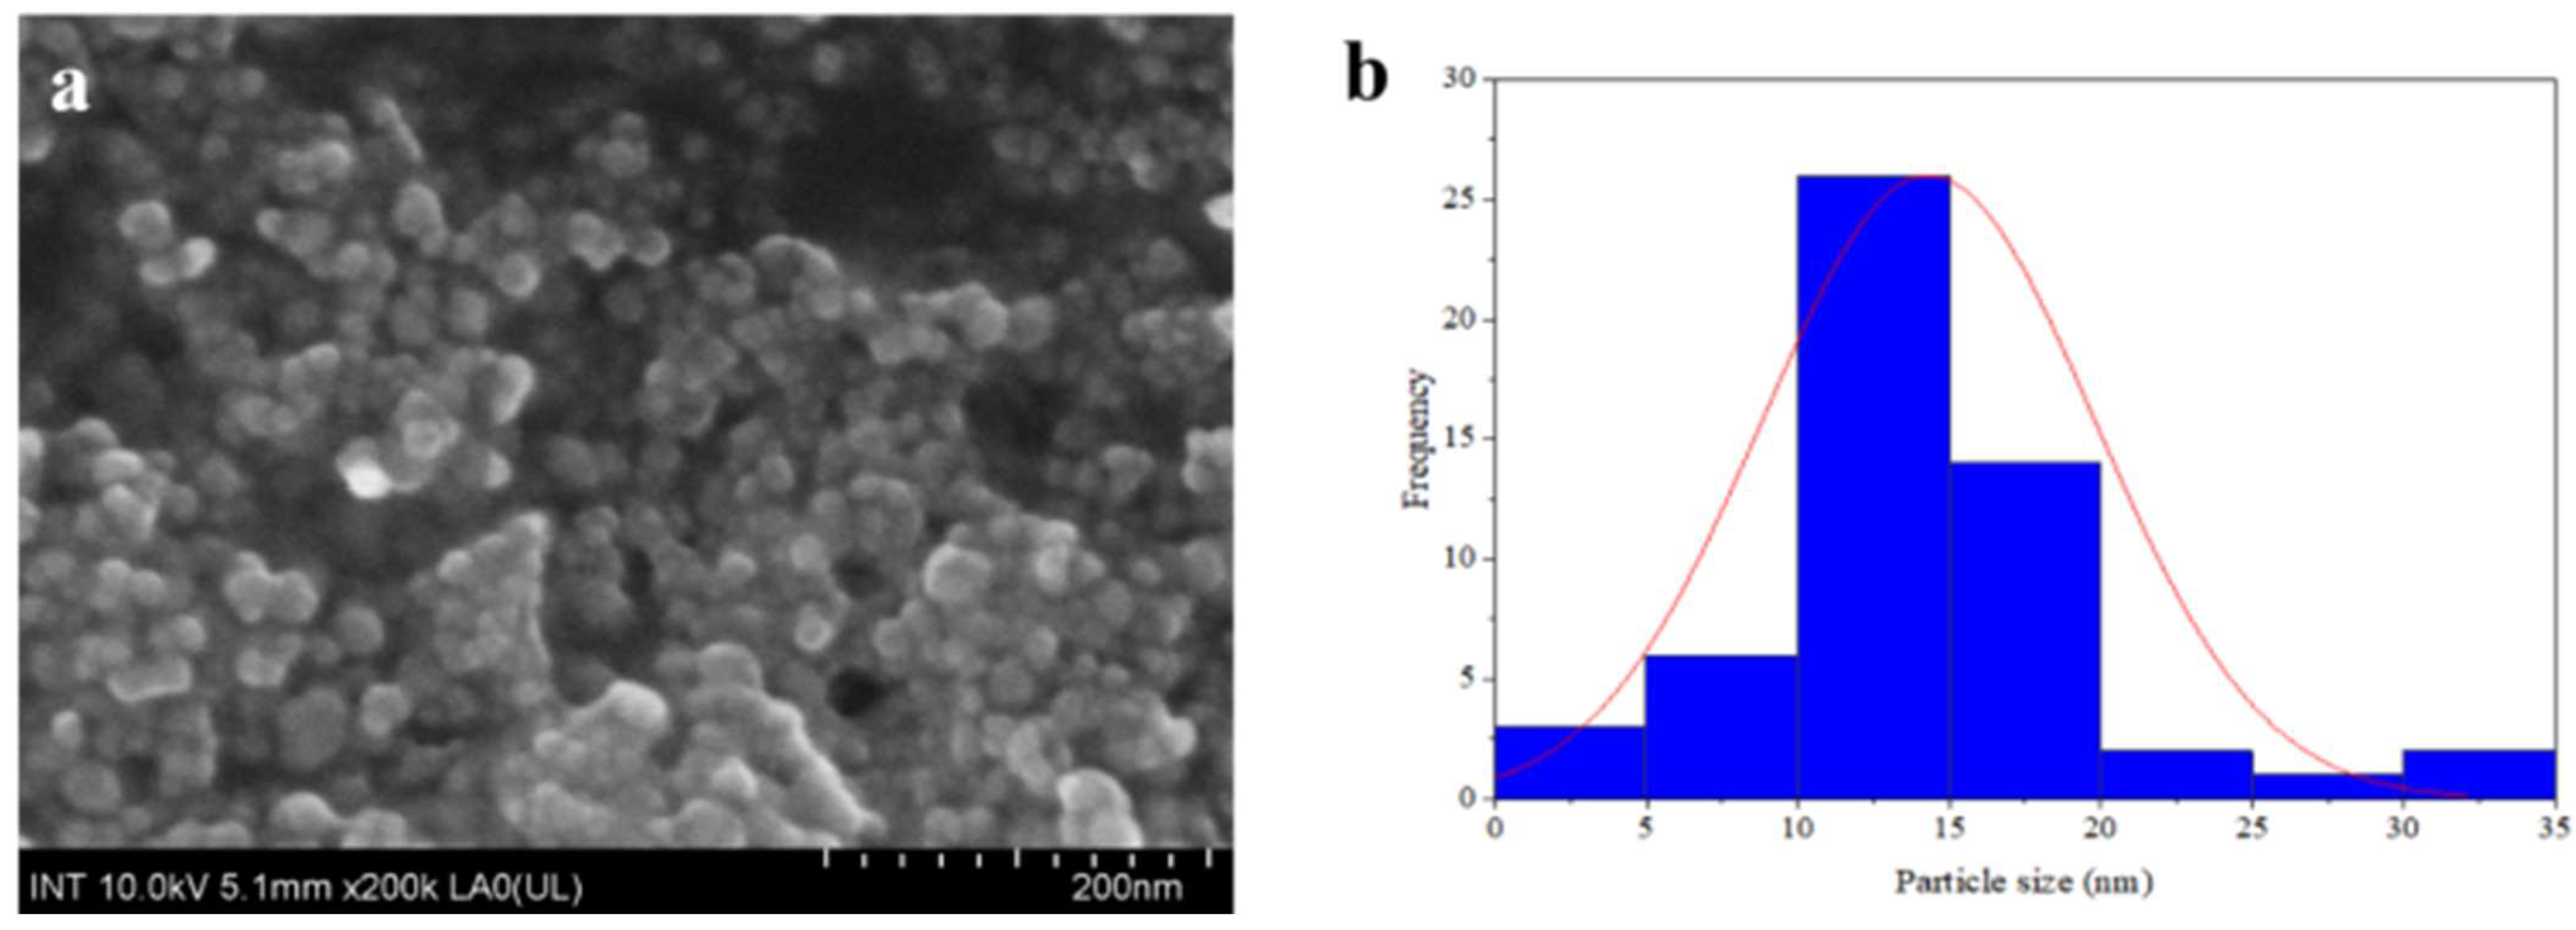
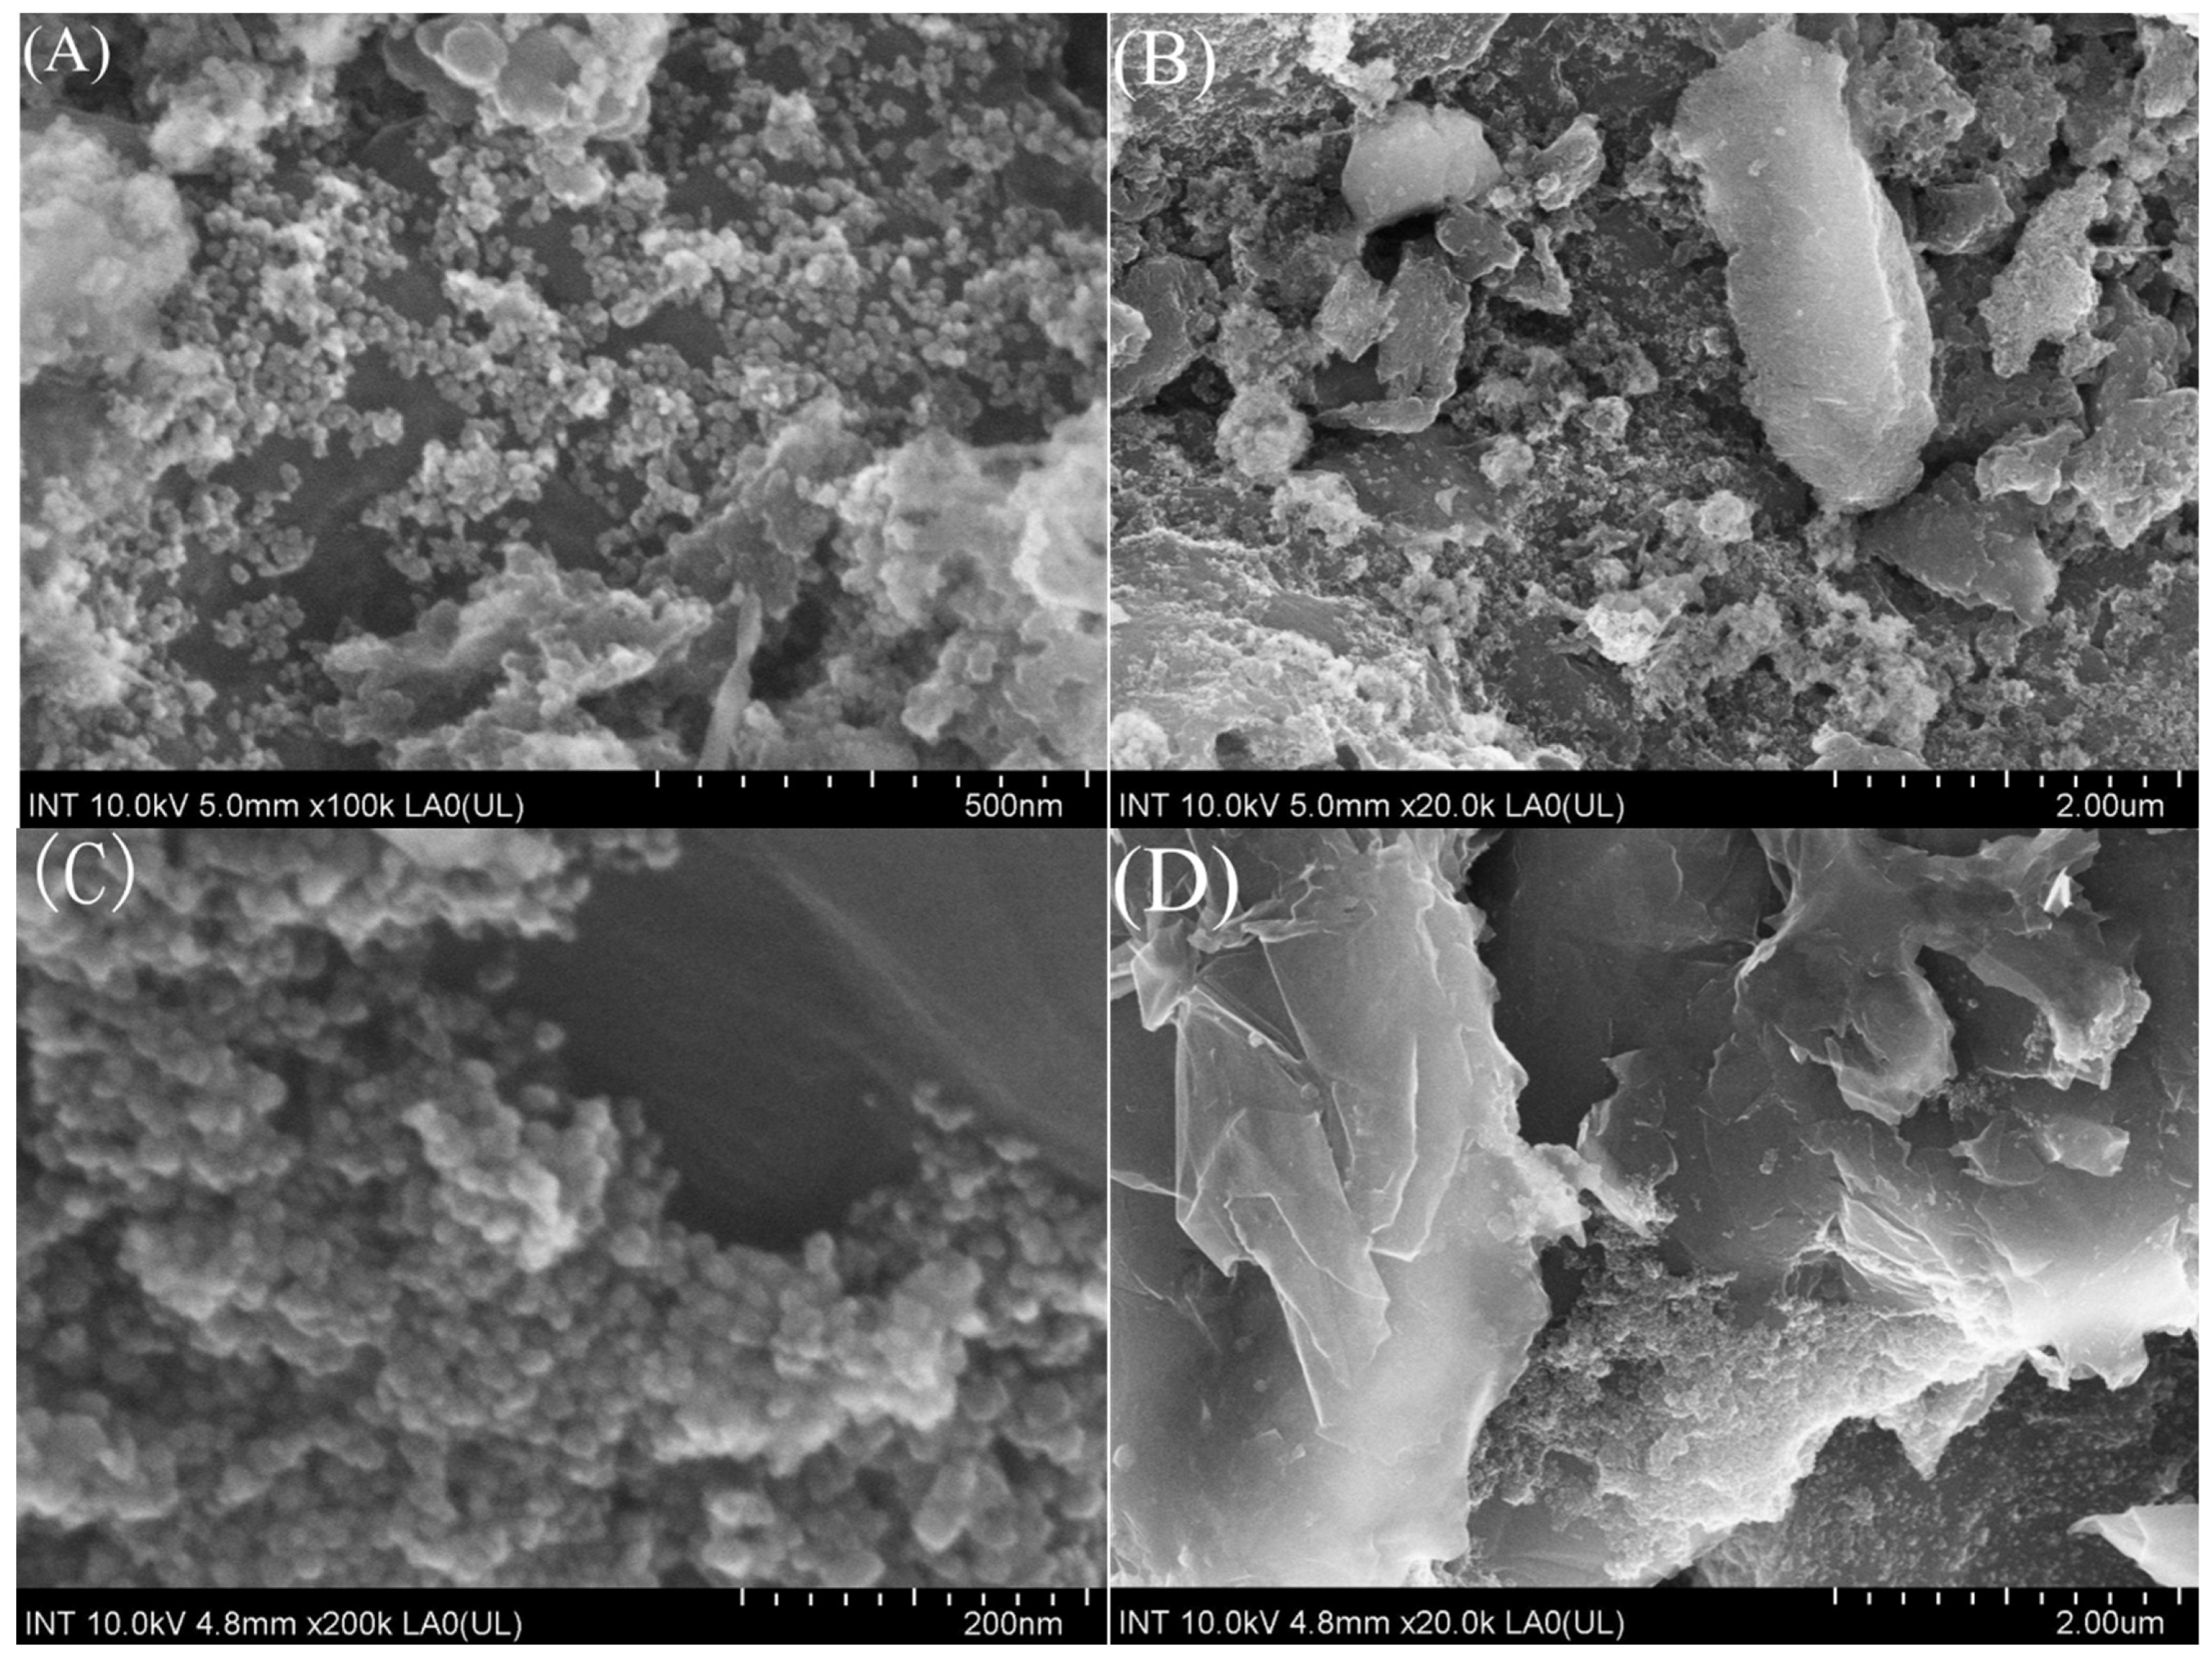
3.1.1. FE-SEM Analysis
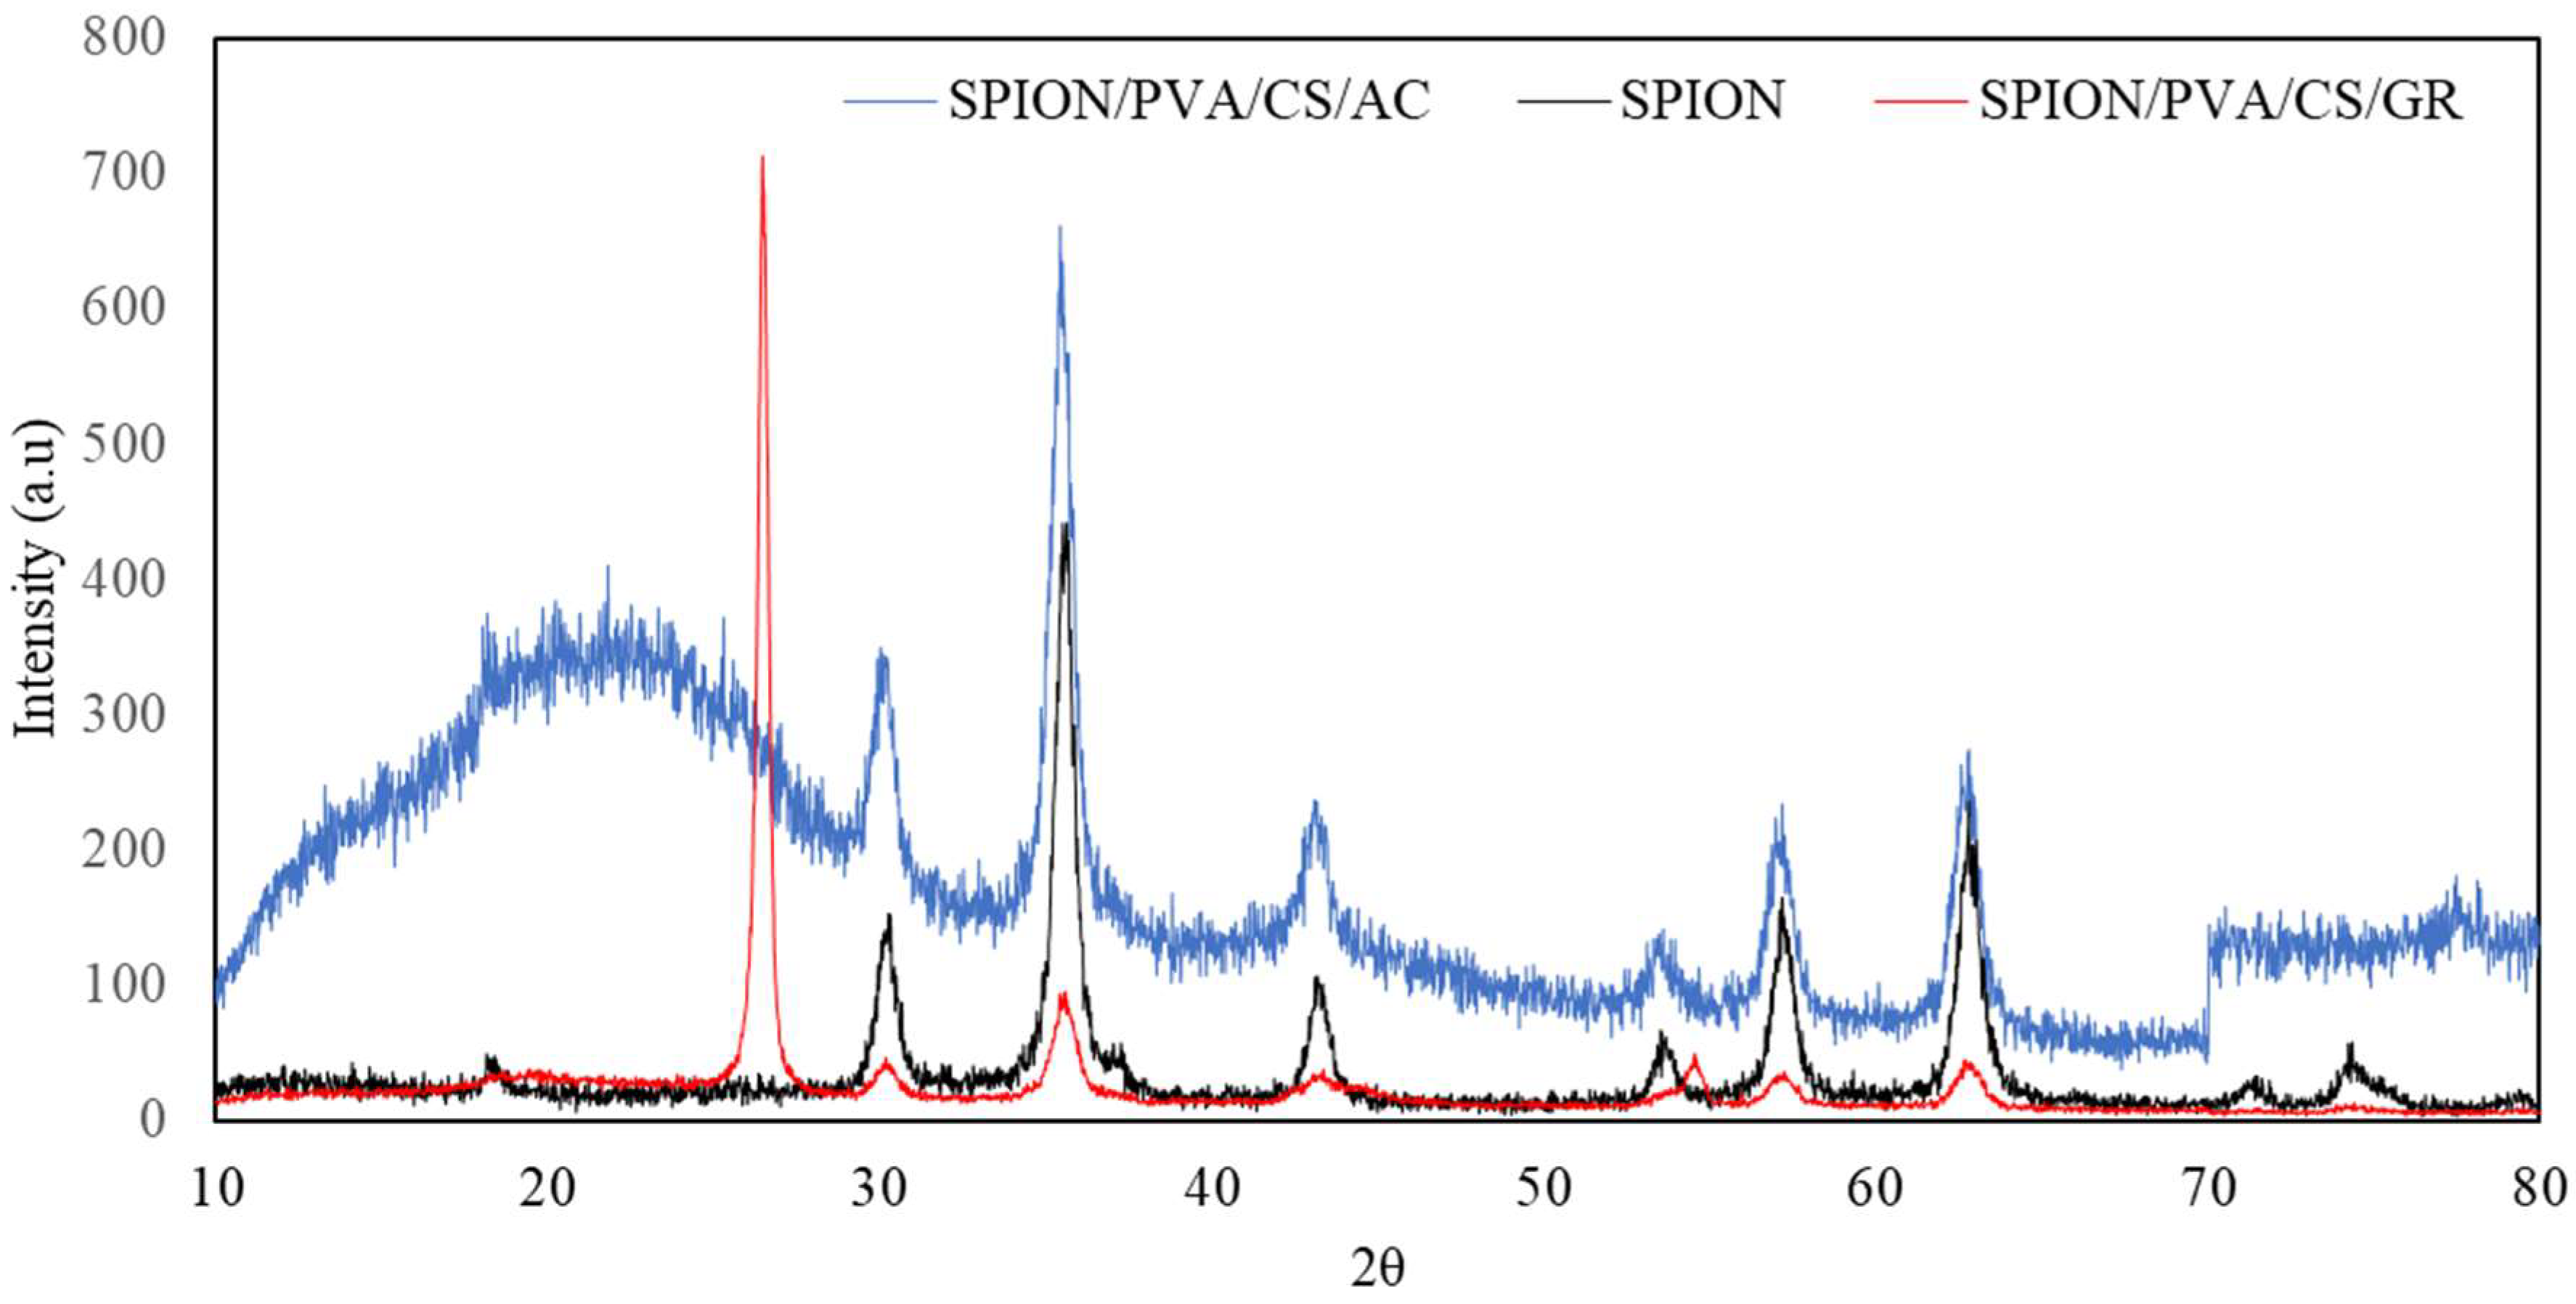
3.1.2. XRD Analysis
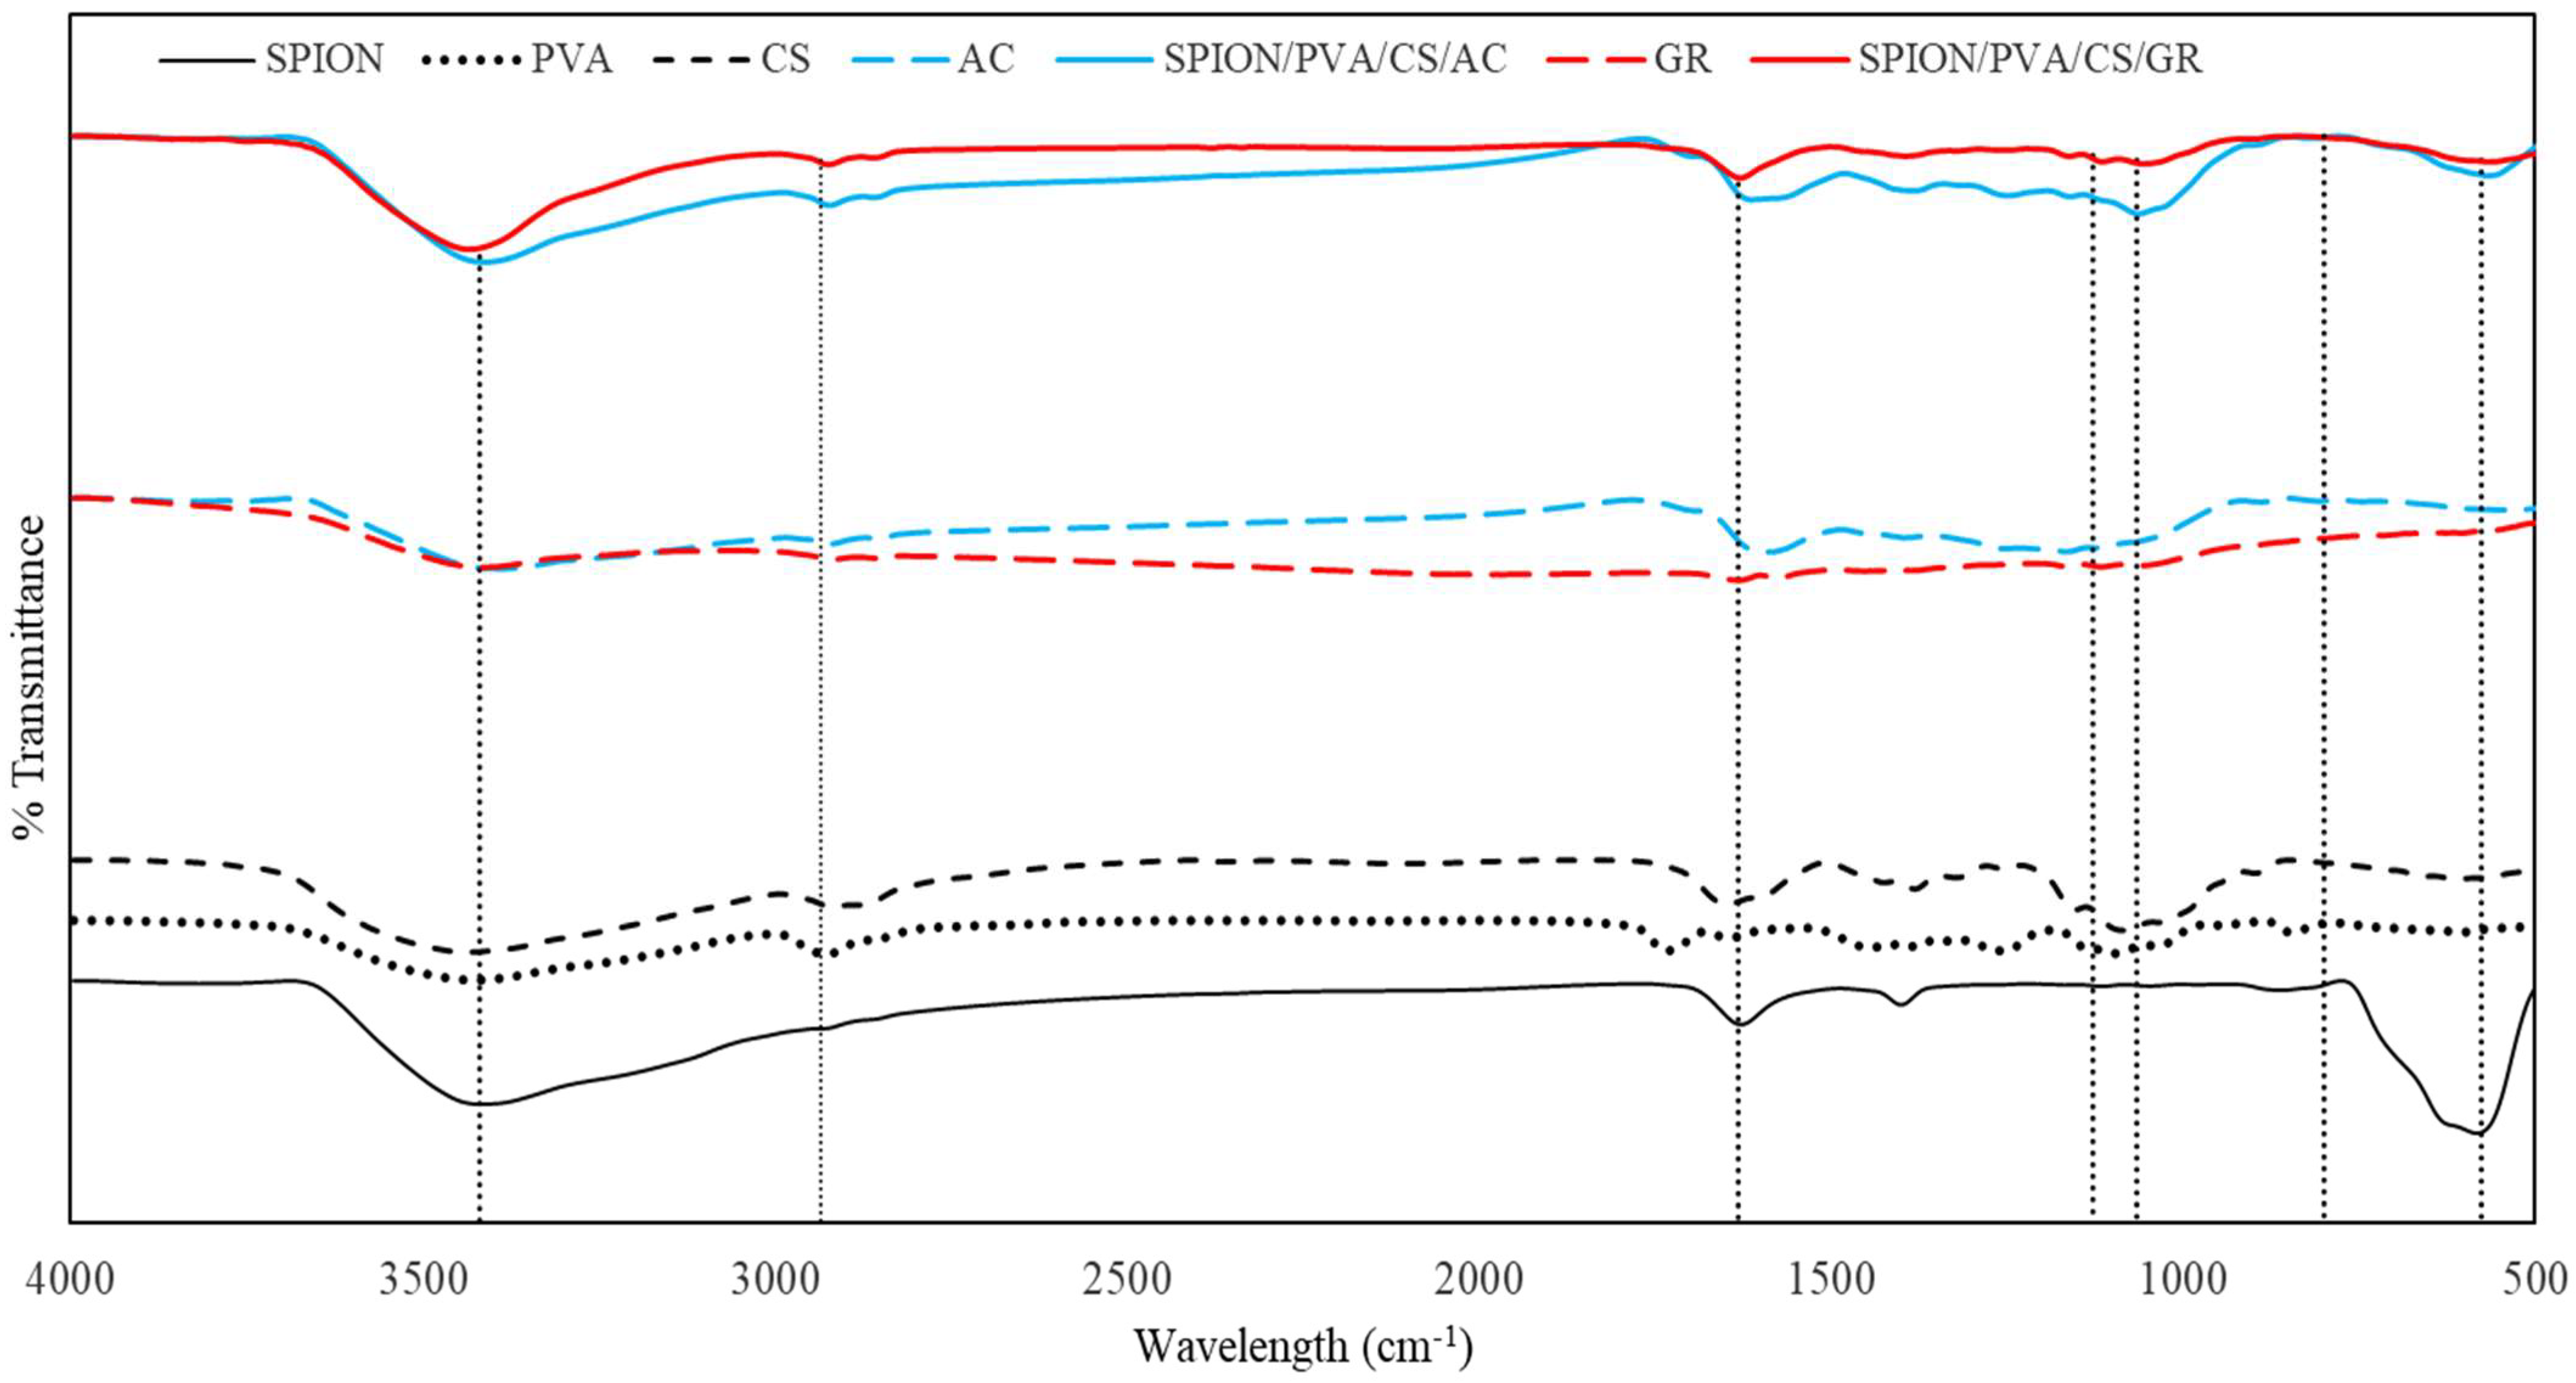
3.1.3. FTIR Analysis
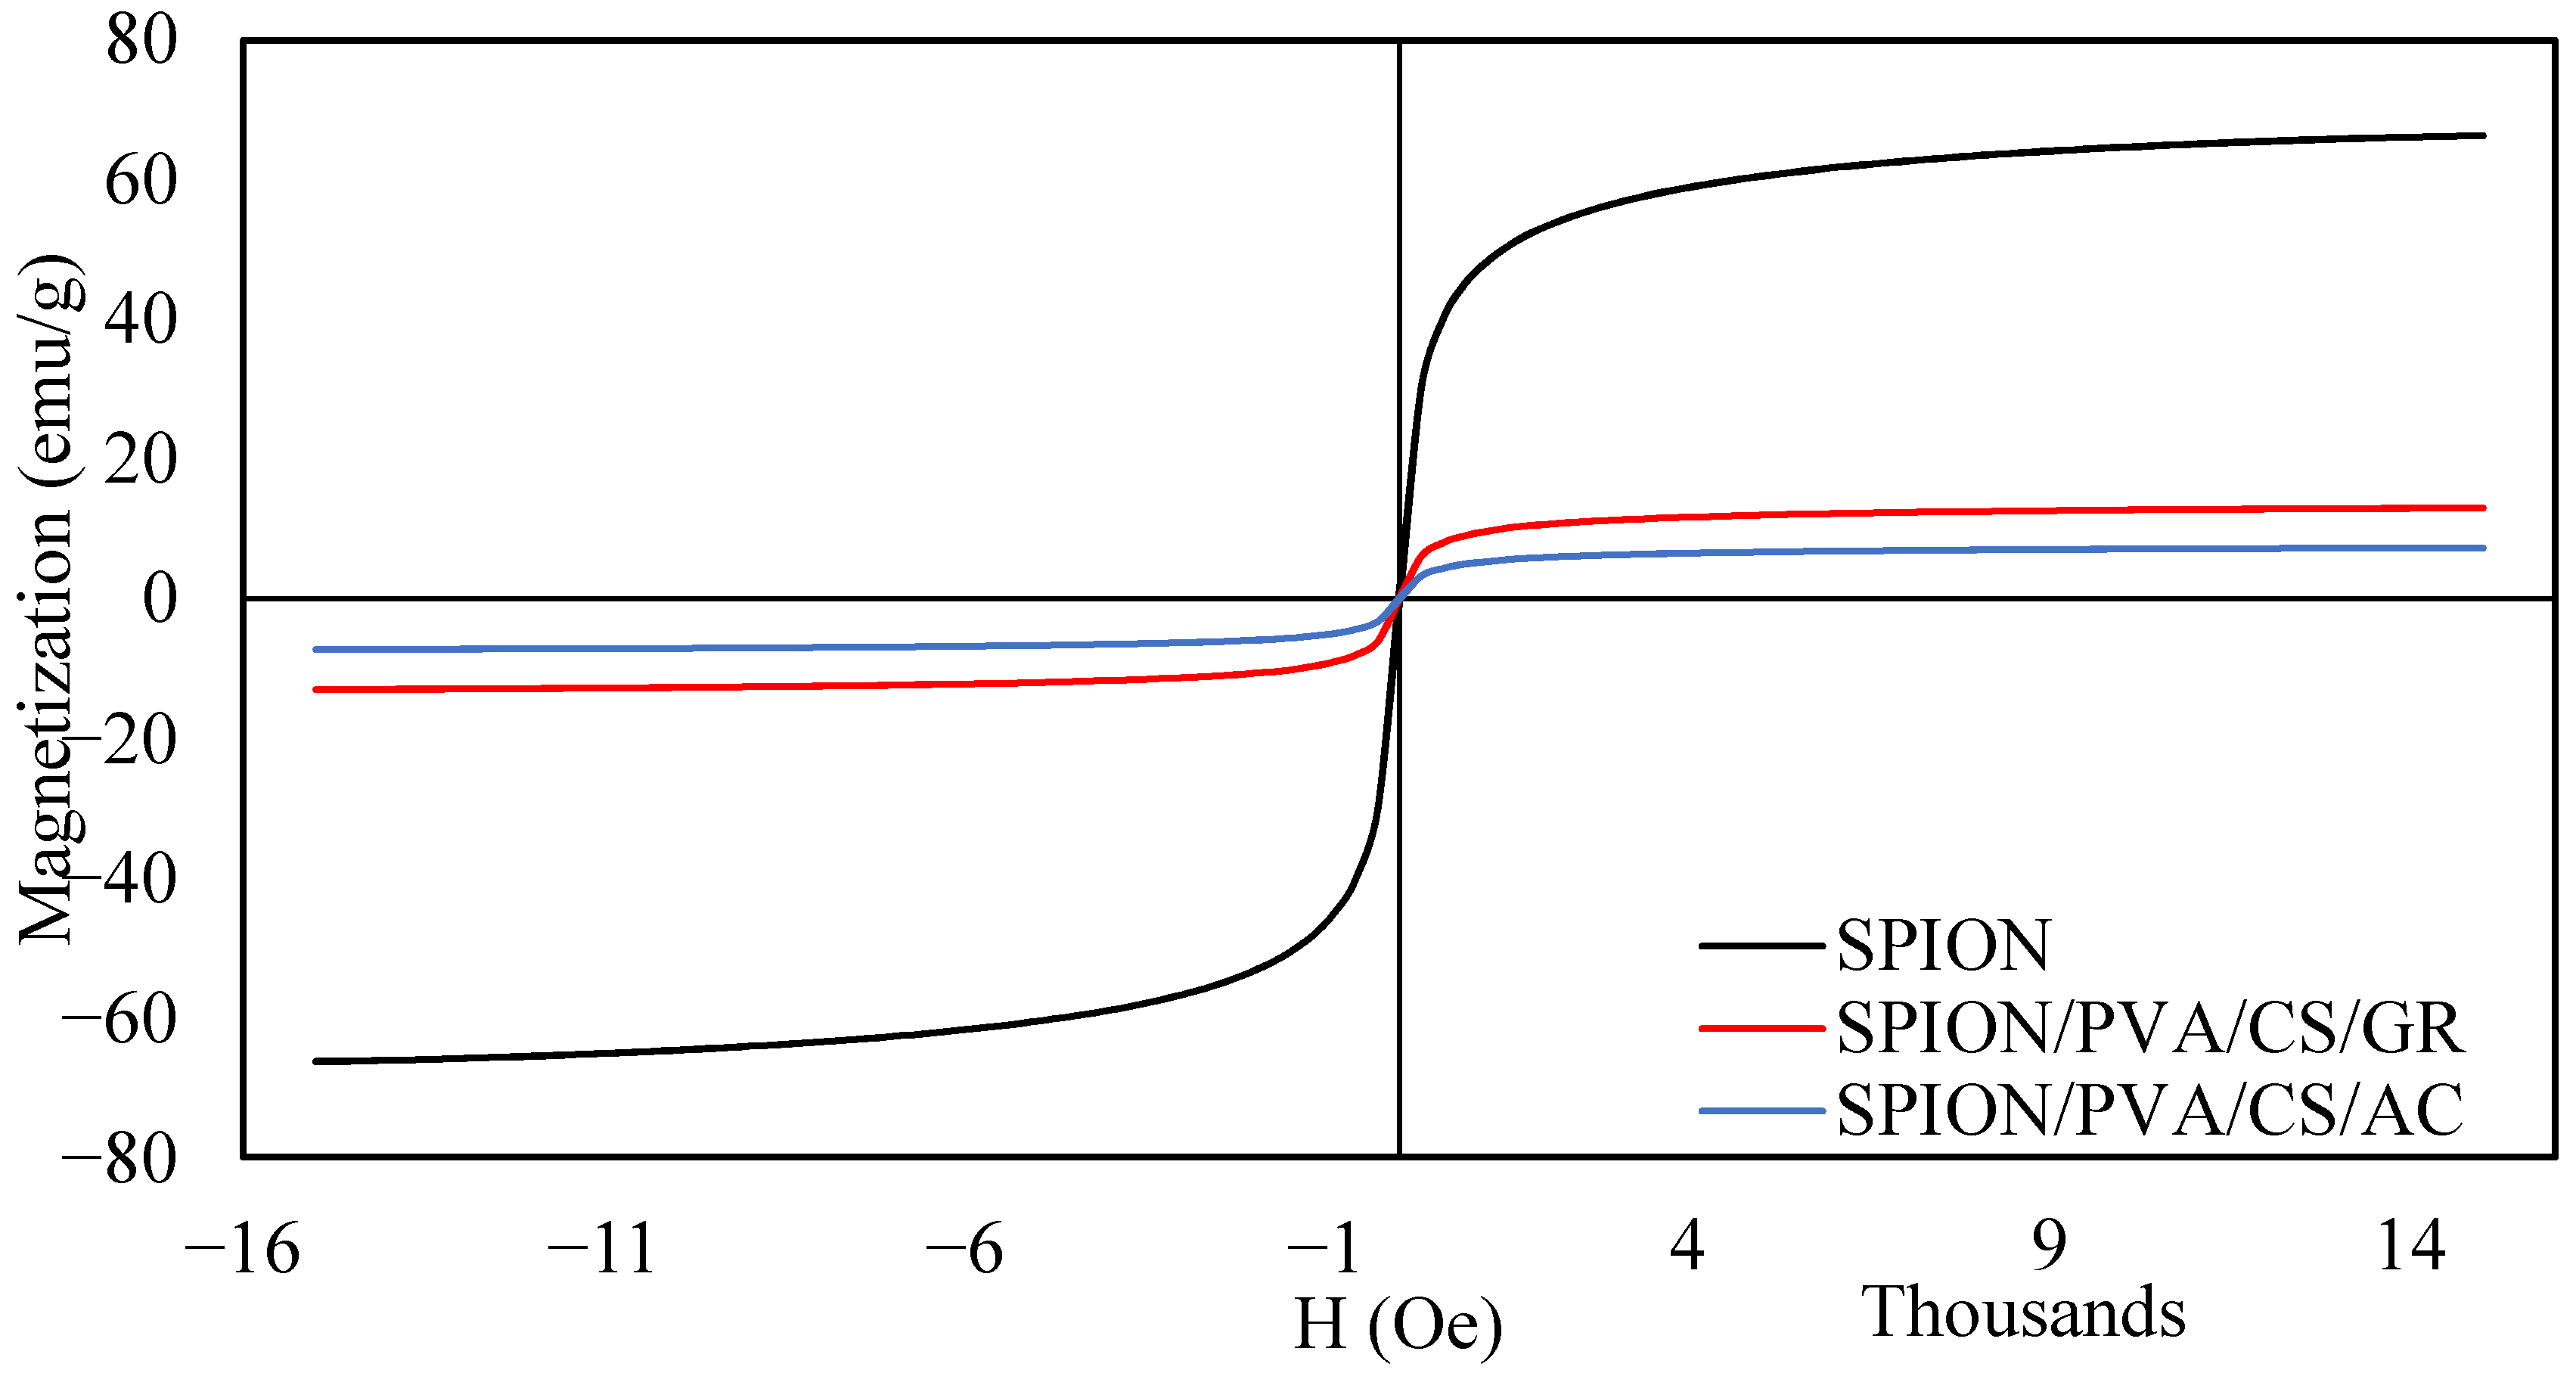
3.1.4. VSM Analysis
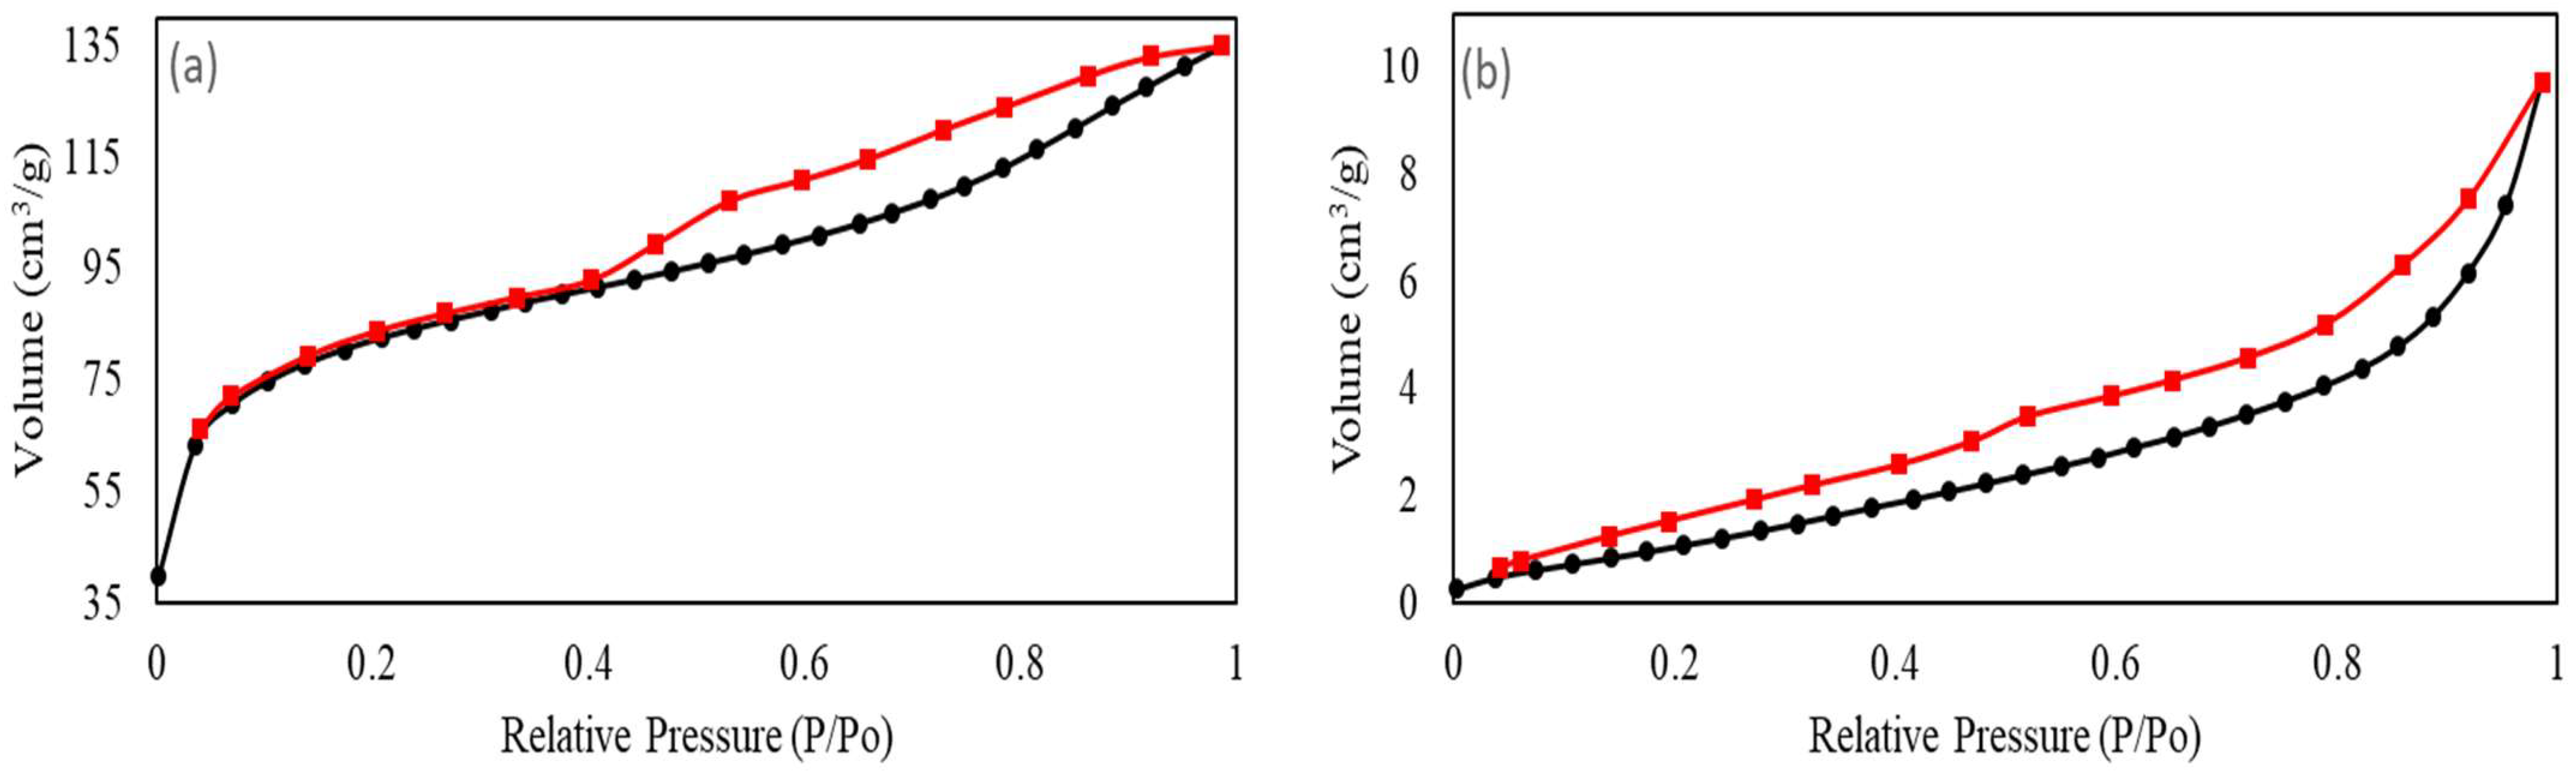
3.1.5. BJH Analysis
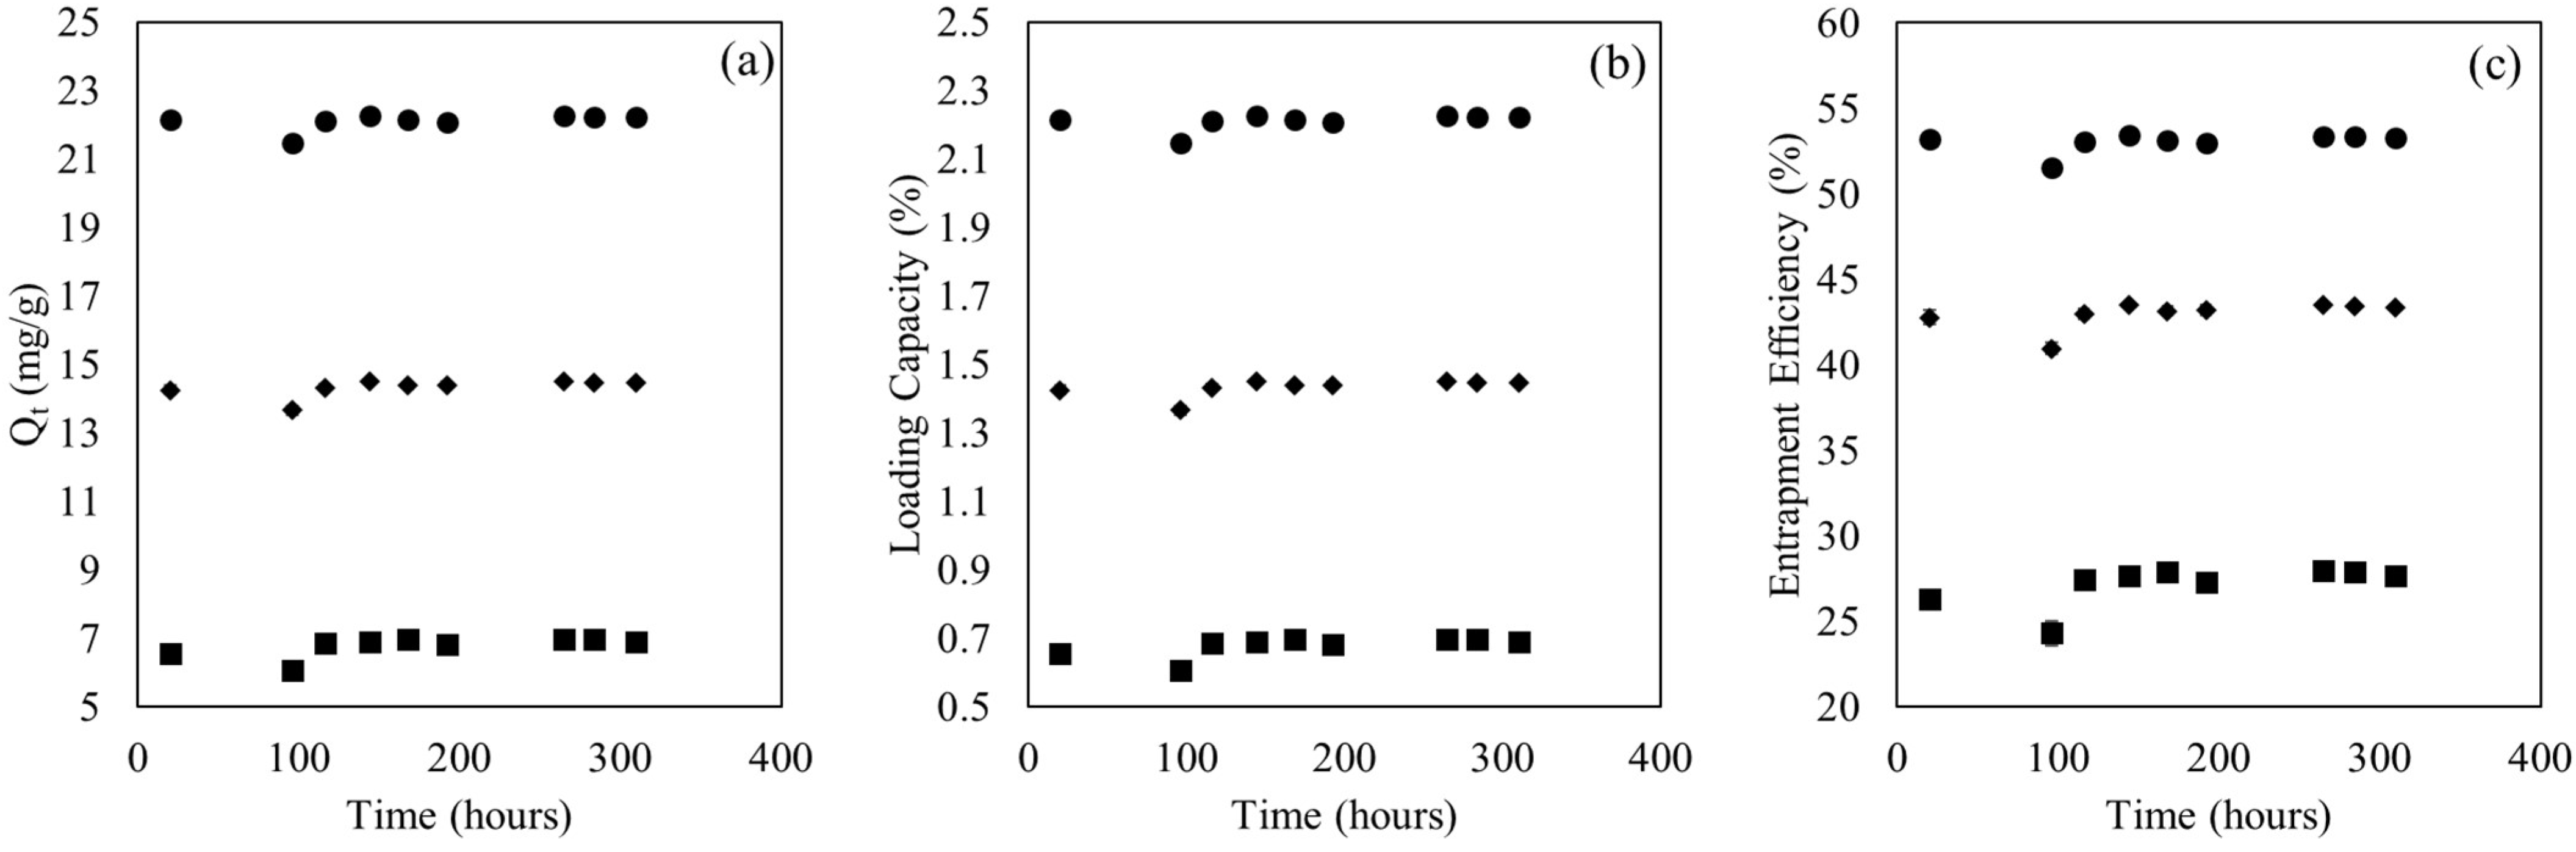
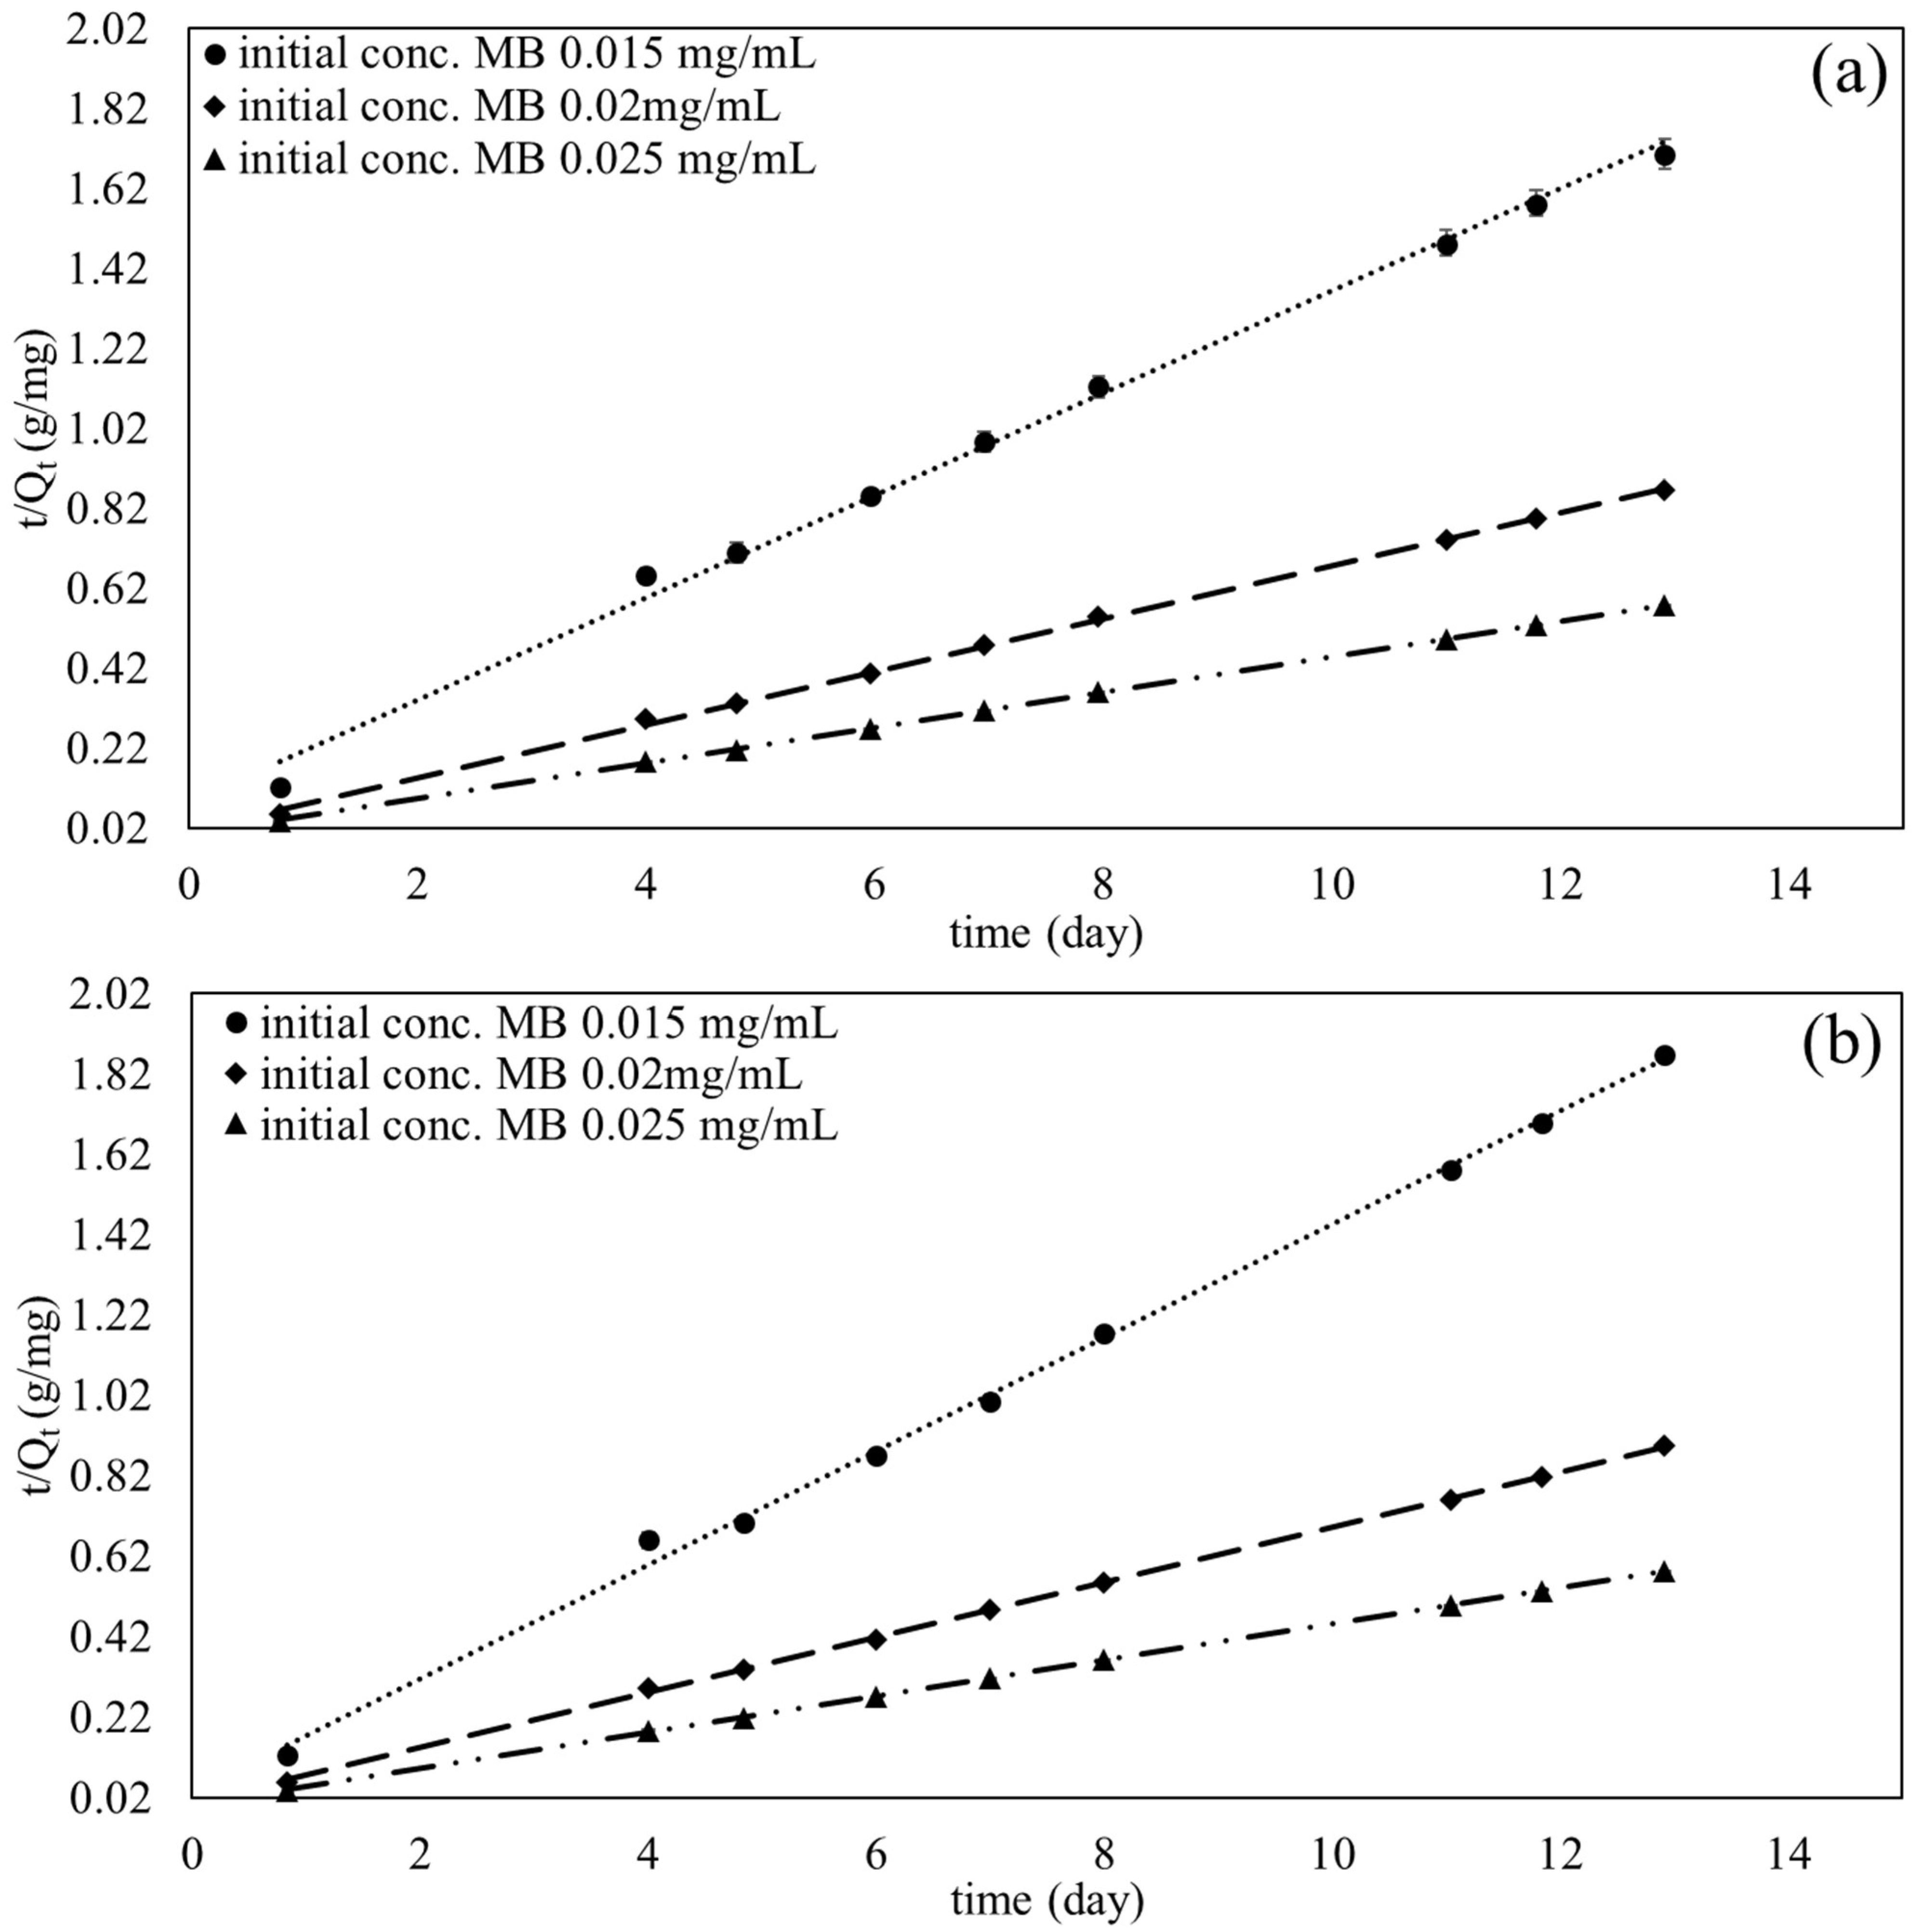
3.2. Adsorption
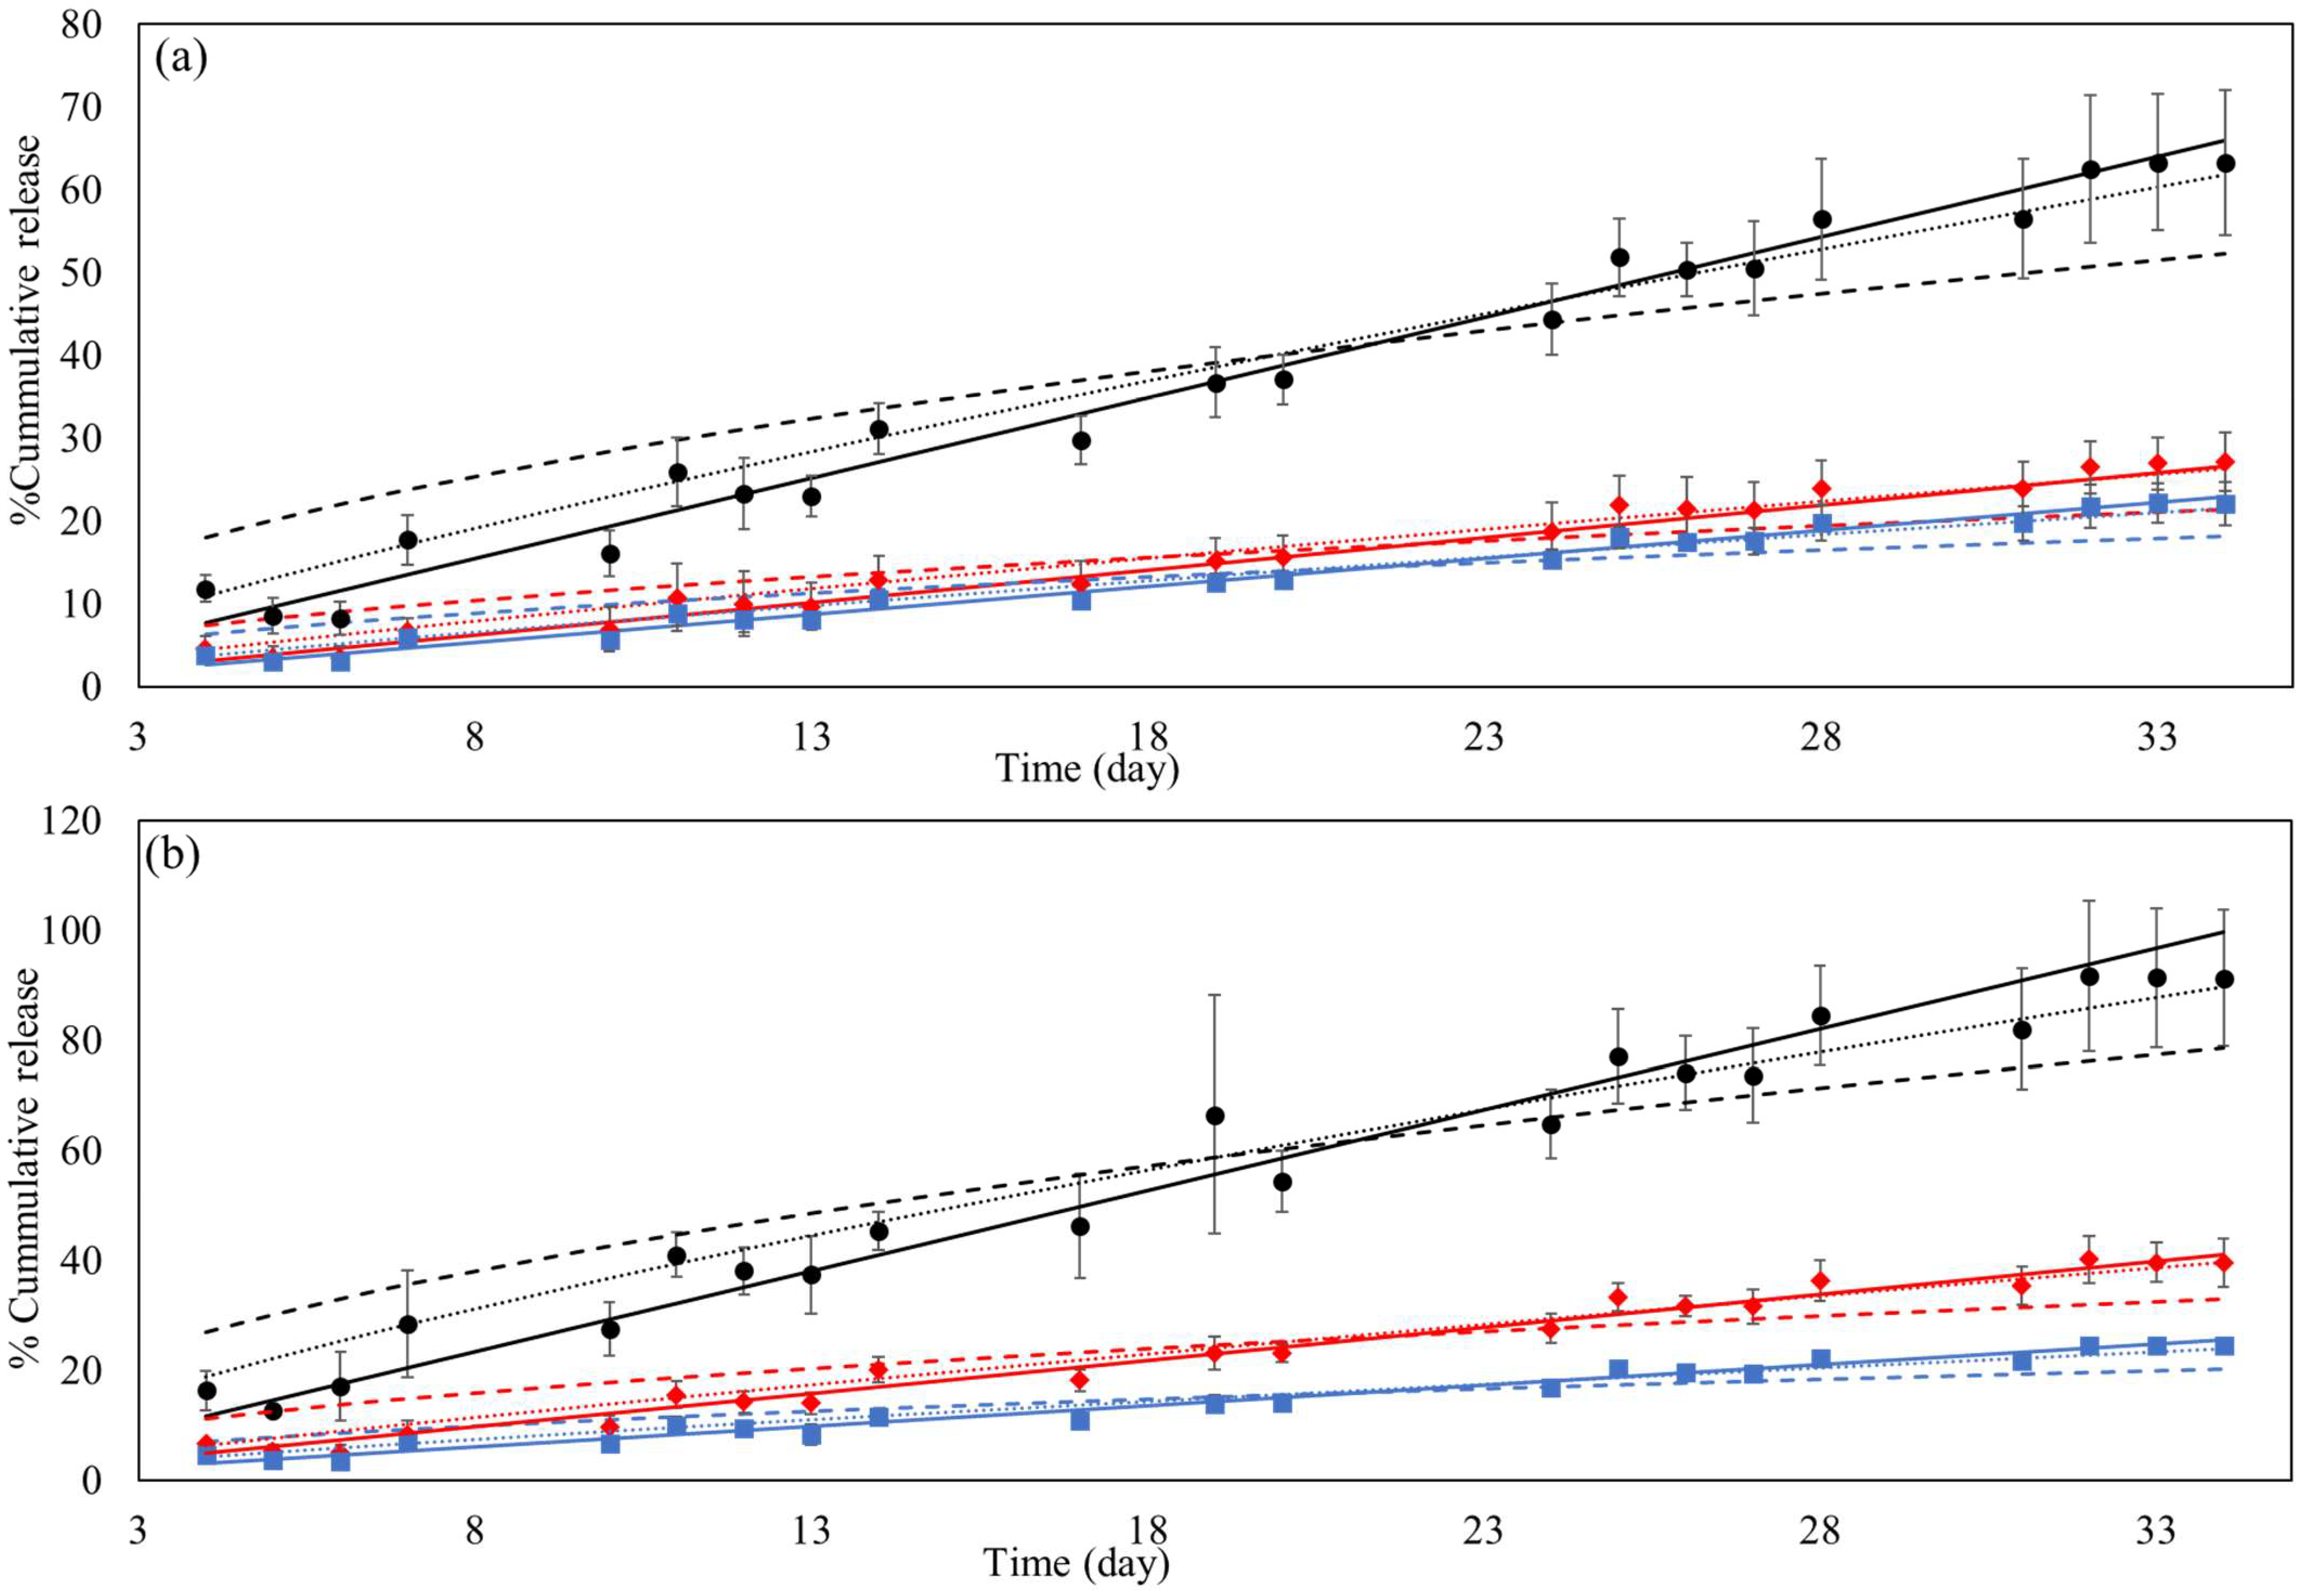
3.3. Desorption
3.4. Comparison
4. Conclusions
Author Contributions
Funding
Institutional Review Board Statement
Informed Consent Statement
Data Availability Statement
Conflicts of Interest
Abbreviations
| m | Mass of the Nanoparticles (g) |
| V | sample volume (mL) |
| C0 | initial concentration (mg/mL) |
| Ct | concentration at time t (mg/mL) |
| Ce | equilibrium aqueous-phase concentration adsorbate (mg/L) |
| Q0 | theoretical adsorption capacity (mg/g) |
| Qe | amount of MB absorbed per unit mass of nanoparticle at the equilibrium (mg/g) |
| Qt | amount of MB absorbed per unit mass of nanoparticle at time t (mg/g) |
| Qm | quantity of adsorbate adsorbed in a single monolayer (mg/g) |
| α | Theoretical initial adsorption rate |
| 𝜷 | Theoretical desorption rate |
| Mt | Released mass fraction at a time (t) |
| M∞ | The Amount of MB at Equilibrium State |
| ϴ | fractional surface coverage |
| X2 | Chi-square value |
| nKP | Korsmeyer-Peppas release exponent factor |
| kKP | Korsmeyer-Peppas release rate constant |
| kH | Higuchi release rate constant |
| KL | constant related to the free adsorption energy and the reciprocal of the concentration at which half saturation of the adsorbent is reached |
| k0 | Constant mass fraction at a time (t) release |
| k1 | Pseudo-first-order rate constant (s−1) |
| k2 | Pseudo-second-order rate constant (s−1) |
| ka | Respective rate constant for adsorption |
| kd | Respective rate constant for desorption |
References
- Altohamy, R.; Ali, S.; Li, F.; Okasha, K.; Mahmoud, Y.; Elsamahy, T.; Jiao, H.; Fu, Y.; Sun, J. A Critical Review on the Treatment of Dye-Containing Wastewater: Ecotoxicological and Health Concerns of Textile Dyes and Possible Remediation Approaches for Environmental Safety. Ecotoxicol. Environ. Saf. 2022, 231, 113160. [Google Scholar] [CrossRef]
- Patel, H. Charcoal as an Adsorbent for Textile Wastewater Treatment. Sep. Sci. Technol. 2018, 53, 2797–2812. [Google Scholar] [CrossRef]
- Ali, H. Biodegradation of Synthetic Dyes—A Review. Water. Air. Soil Pollut. 2010, 213, 251–273. [Google Scholar] [CrossRef]
- Lellis, B.; Fávaro-Polonio, C.Z.; Pamphile, J.A.; Polonio, J.C. Effects of Textile Dyes on Health and the Environment and Bioremediation Potential of Living Organisms. Biotechnol. Res. Innov. 2019, 3, 275–290. [Google Scholar] [CrossRef]
- Laing, I.G. The Impact of Effluent Regulations on the Dyeing Industry. Rev. Prog. Color. Relat. Top. 1991, 21, 56–71. [Google Scholar] [CrossRef]
- Quach, T.P.T.; Doan, L. Surface Modifications of Superparamagnetic Iron Oxide Nanoparticles with Polyvinyl Alcohol, Chitosan, and Graphene Oxide as Methylene Blue Adsorbents. Coatings 2023, 13, 1333. [Google Scholar] [CrossRef]
- Damasceno, B.S.; da Silva, A.F.V.; de Araújo, A.C.V. Dye Adsorption onto Magnetic and Superparamagnetic Fe3O4 Nanoparticles: A Detailed Comparative Study. J. Environ. Chem. Eng. 2020, 8, 103994. [Google Scholar] [CrossRef]
- Atkins, P.; de Paula, J.; Friedman, R. Physical Chemistry: Quanta, Matter, and Change; OUP Oxford: Oxford, UK, 2014; ISBN 978-0-19-960981-9. [Google Scholar]
- Kumar, K.V.; Subanandam, K.; Bhagavanulu, D. Making GAC Sorption Economic. Pollut. Res. 2004, 23, 439–444. [Google Scholar]
- Bai, L.; Li, Z.; Zhang, Y.; Wang, T.; Lu, R.; Zhou, W.; Gao, H.; Zhang, S. Synthesis of Water-Dispersible Graphene-Modified Magnetic Polypyrrole Nanocomposite and Its Ability to Efficiently Adsorb Methylene Blue from Aqueous Solution. Chem. Eng. J. 2015, 279, 757–766. [Google Scholar] [CrossRef]
- Enriquez-Navas, P.M.; Garcia-Martin, M.L. Application of Inorganic Nanoparticles for Diagnosis Based on MRI. In Frontiers of Nanoscience; Elsevier: Amsterdam, The Netherlands, 2012; Volume 4, pp. 233–245. ISBN 978-0-12-415769-9. [Google Scholar]
- Chee, C.; Leo, B.F.; Lai, C.W. Superparamagnetic Iron Oxide Nanoparticles for Drug Delivery; Woodhead Publishing: Cambridge, UK, 2018; pp. 861–903. ISBN 978-0-12-813741-3. [Google Scholar]
- Mahmoudi, M.; Sant, S.; Wang, B.; Laurent, S.; Sen, T. Superparamagnetic Iron Oxide Nanoparticles (SPIONs): Development, Surface Modification and Applications in Chemotherapy. Adv. Drug Deliv. Rev. 2011, 63, 24–46. [Google Scholar] [CrossRef]
- Seabra, A.; Pelegrino, M.; Haddad, P. Antimicrobial Applications of Superparamagnetic Iron Oxide Nanoparticles. In Nanostructures for Antimicrobial Therapy: Nanostructures in Therapeutic Medicine Series; Elsevier: Amsterdam, The Netherlands, 2017; pp. 531–550. ISBN 978-0-323-46152-8. [Google Scholar]
- Liu, M.; Ye, Y.; Ye, J.; Gao, T.; Wang, D.; Chen, G.; Song, Z. Recent Advances of Magnetite (Fe3O4)-Based Magnetic Materials in Catalytic Applications. Magnetochemistry 2023, 9, 110. [Google Scholar] [CrossRef]
- Laurent, S.; Forge, D.; Port, M.; Roch, A.; Robic, C.; Vander Elst, L.; Muller, R.N. Magnetic Iron Oxide Nanoparticles: Synthesis, Stabilization, Vectorization, Physicochemical Characterizations, and Biological Applications. Chem. Rev. 2010, 110, 2574. [Google Scholar] [CrossRef]
- Doan, L. Surface Modifications of Superparamagnetic Iron Oxide Nanoparticles with Polyvinyl Alcohol and Activated Charcoal as Methylene Blue Adsorbents. Magnetochemistry 2023, 9, 211. [Google Scholar] [CrossRef]
- Llenas, M.; Sandoval, S.; Costa, P.M.; Oró-Solé, J.; Lope-Piedrafita, S.; Ballesteros, B.; Al-Jamal, K.T.; Tobias, G. Microwave-Assisted Synthesis of SPION-Reduced Graphene Oxide Hybrids for Magnetic Resonance Imaging (MRI). Nanomaterials 2019, 9, 1364. [Google Scholar] [CrossRef]
- Bertran, A.; Sandoval, S.; Oró-Solé, J.; Sánchez, À.; Tobias, G. Particle Size Determination from Magnetization Curves in Reduced Graphene Oxide Decorated with Monodispersed Superparamagnetic Iron Oxide Nanoparticles. J. Colloid Interface Sci. 2020, 566, 107–119. [Google Scholar] [CrossRef]
- Li, Z.; Sun, Y.; Xing, J.; Meng, A. Fast Removal of Methylene Blue by Fe3O4 Magnetic Nanoparticles and Their Cycling Property. J. Nanosci. Nanotechnol. 2019, 19, 2116–2123. [Google Scholar] [CrossRef]
- Habila, M.A.; Moshab, M.S.; El-Toni, A.M.; ALOthman, Z.A.; Badjah Hadj Ahmed, A.Y. Thermal Fabrication of Magnetic Fe3O4 (Nanoparticle)@Carbon Sheets from Waste Resources for the Adsorption of Dyes: Kinetic, Equilibrium, and UV–Visible Spectroscopy Investigations. Nanomaterials 2023, 13, 1266. [Google Scholar] [CrossRef]
- Yao, Y.; Miao, S.; Liu, S.; Ma, L.P.; Sun, H.; Wang, S. Synthesis, Characterization, and Adsorption Properties of Magnetic Fe3O4@graphene Nanocomposite. Chem. Eng. J. 2012, 184, 326–332. [Google Scholar] [CrossRef]
- Ahamad, T.; Naushad, M.; Eldesoky, G.E.; Al-Saeedi, S.I.; Nafady, A.; Al-Kadhi, N.S.; Al-Muhtaseb, A.H.; Khan, A.A.; Khan, A. Effective and Fast Adsorptive Removal of Toxic Cationic Dye (MB) from Aqueous Medium Using Amino-Functionalized Magnetic Multiwall Carbon Nanotubes. J. Mol. Liq. 2019, 282, 154–161. [Google Scholar] [CrossRef]
- Wu, K.-H.; Huang, W.-C.; Hung, W.-C.; Tsai, C.-W. Modified Expanded Graphite/Fe3O4 Composite as an Adsorbent of Methylene Blue: Adsorption Kinetics and Isotherms. Mater. Sci. Eng. B 2021, 266, 115068. [Google Scholar] [CrossRef]
- Tishbi, P.; Mosayebi, M.; Salehi, Z.; Fatemi, S.; Faegh, E. Synthesizing Magnetic Graphene Oxide Nanomaterial (GO-Fe3O4) and Kinetic Modelling of Methylene Blue Adsorption from Water. Can. J. Chem. Eng. 2022, 100, 3321–3334. [Google Scholar] [CrossRef]
- Hingrajiya, R.D.; Patel, M.P. Fe3O4 Modified Chitosan Based Co-Polymeric Magnetic Composite Hydrogel: Synthesis, Characterization and Evaluation for the Removal of Methylene Blue from Aqueous Solutions. Int. J. Biol. Macromol. 2023, 244, 125251. [Google Scholar] [CrossRef] [PubMed]
- Graphene Oxide/Fe3O4/Chitosan Nanocomposite: A Recoverable and Recyclable Adsorbent for Organic Dyes Removal. Application to Methylene Blue-IOPscience. Available online: https://iopscience.iop.org/article/10.1088/2053-1591/aa6096/meta (accessed on 13 September 2023).
- Subhan, F.; Aslam, S.; Yan, Z.; Khan, M.; Etim, U.J.; Naeem, M. Effective Adsorptive Performance of Fe3O4@SiO2 Core Shell Spheres for Methylene Blue: Kinetics, Isotherm and Mechanism. J. Porous Mater. 2019, 26, 1465–1474. [Google Scholar] [CrossRef]
- Zhang, C.; Dai, Y.; Wu, Y.; Lu, G.; Cao, Z.; Cheng, J.; Wang, K.; Yang, H.; Xia, Y.; Wen, X.; et al. Facile Preparation of Polyacrylamide/Chitosan/Fe3O4 Composite Hydrogels for Effective Removal of Methylene Blue from Aqueous Solution. Carbohydr. Polym. 2020, 234, 115882. [Google Scholar] [CrossRef] [PubMed]
- Ai, L.; Zhang, C.; Liao, F.; Wang, Y.; Li, M.; Meng, L.; Jiang, J. Removal of Methylene Blue from Aqueous Solution with Magnetite Loaded Multi-Wall Carbon Nanotube: Kinetic, Isotherm and Mechanism Analysis. J. Hazard. Mater. 2011, 198, 282–290. [Google Scholar] [CrossRef] [PubMed]
- Doan, L. Surface Modifications of Superparamagnetic Iron Oxide Nanoparticles with Polyvinyl Alcohol and Graphite as Methylene Blue Adsorbents. Coatings 2023, 13, 1558. [Google Scholar] [CrossRef]
- Zhang, W.; Zhang, L.; Zhao, X.; Zhou, Z. Citrus Pectin Derived Ultrasmall Fe3O4@C Nanoparticles as a High-Performance Adsorbent toward Removal of Methylene Blue. J. Mol. Liq. 2016, 222, 995–1002. [Google Scholar] [CrossRef]
- Hameed, B.H.; Ahmad, A.L.; Latiff, K.N.A. Adsorption of Basic Dye (Methylene Blue) onto Activated Carbon Prepared from Rattan Sawdust. Dye. Pigment. 2007, 75, 143–149. [Google Scholar] [CrossRef]
- Xue, H.; Wang, X.; Xu, Q.; Dhaouadi, F.; Sellaoui, L.; Seliem, M.K.; Ben Lamine, A.; Belmabrouk, H.; Bajahzar, A.; Bonilla-Petriciolet, A.; et al. Adsorption of Methylene Blue from Aqueous Solution on Activated Carbons and Composite Prepared from an Agricultural Waste Biomass: A Comparative Study by Experimental and Advanced Modeling Analysis. Chem. Eng. J. 2022, 430, 132801. [Google Scholar] [CrossRef]
- Avom, J.; Mbadcam, J.K.; Noubactep, C.; Germain, P. Adsorption of Methylene Blue from an Aqueous Solution on to Activated Carbons from Palm-Tree Cobs. Carbon 1997, 35, 365–369. [Google Scholar] [CrossRef]
- Thang, N.H.; Khang, D.S.; Hai, T.D.; Nga, D.T.; Tuan, P.D. Methylene Blue Adsorption Mechanism of Activated Carbon Synthesised from Cashew Nut Shells. RSC Adv. 2021, 11, 26563–26570. [Google Scholar] [CrossRef]
- Kim, T.; Jung, G.; Yoo, S.; Suh, K.S.; Ruoff, R.S. Activated Graphene-Based Carbons as Supercapacitor Electrodes with Macro- and Mesopores. ACS Nano 2013, 7, 6899–6905. [Google Scholar] [CrossRef] [PubMed]
- Nguyen, T.-T.-N.; He, J.-L. Preparation of Titanium Monoxide Nanopowder by Low-Energy Wet Ball-Milling. Adv. Powder Technol. 2016, 27, 1868–1873. [Google Scholar] [CrossRef]
- Tran, D.N.H.; Kabiri, S.; Wang, L.; Losic, D. Engineered Graphene–Nanoparticle Aerogel Composites for Efficient Removal of Phosphate from Water. J. Mater. Chem. A 2015, 3, 6844–6852. [Google Scholar] [CrossRef]
- Moo, J.G.S.; Khezri, B.; Webster, R.D.; Pumera, M. Graphene Oxides Prepared by Hummers’, Hofmann’s, and Staudenmaier’s Methods: Dramatic Influences on Heavy-Metal-Ion Adsorption. ChemPhysChem 2014, 15, 2922–2929. [Google Scholar] [CrossRef]
- Li, Y.; Van Zijll, M.; Chiang, S.; Pan, N. KOH Modified Graphene Nanosheets for Supercapacitor Electrodes. J. Power Sources 2011, 196, 6003–6006. [Google Scholar] [CrossRef]
- Chung, D.D.L. Review Graphite. J. Mater. Sci. 2002, 37, 1475–1489. [Google Scholar] [CrossRef]
- Zhao, M.; Liu, P. Adsorption of Methylene Blue from Aqueous Solutions by Modified Expanded Graphite Powder. Desalination 2009, 249, 331–336. [Google Scholar] [CrossRef]
- Senthilkumaar, S.; Varadarajan, P.R.; Porkodi, K.; Subbhuraam, C.V. Adsorption of Methylene Blue onto Jute Fiber Carbon: Kinetics and Equilibrium Studies. J. Colloid Interface Sci. 2005, 284, 78–82. [Google Scholar] [CrossRef]
- Kumar, P.S.; Ramalingam, S.; Sathishkumar, K. Removal of Methylene Blue Dye from Aqueous Solution by Activated Carbon Prepared from Cashew Nut Shell as a New Low-Cost Adsorbent. Korean J. Chem. Eng. 2011, 28, 149–155. [Google Scholar] [CrossRef]
- Altundag, H.; Bina, E.; Altıntıg, E. The Levels of Trace Elements in Honey and Molasses Samples That Were Determined by ICP-OES After Microwave Digestion Method. Biol. Trace Elem. Res. 2016, 170, 508–514. [Google Scholar] [CrossRef]
- Le, T.D.; Tran, L.T.; Dang, H.T.M.; Tran, T.T.H.; Tran, H.V. Graphene Oxide/Polyvinyl Alcohol/Fe3O4 Nanocomposite: An Efficient Adsorbent for Co(II) Ion Removal. J. Anal. Methods Chem. 2021, 2021, e6670913. [Google Scholar] [CrossRef]
- Doan, L.; Lu, Y.; Karatela, M.; Phan, V.; Jeffryes, C.; Benson, T.; Wujcik, E.K. Surface Modifications of Superparamagnetic Iron Oxide Nanoparticles with Polylactic Acid-Polyethylene Glycol Diblock Copolymer and Graphene Oxide for a Protein Delivery Vehicle. Eng. Sci. 2019, 7, 10–16. [Google Scholar] [CrossRef]
- Pandey, N.; Surana, S.; Shukla, S.K.; Singh, N.B. Methylene Blue Removal on Nano-Fe3O4/Poly(Vinyl Alcohol)/Polyacrylamide Hydrogel. Emerg. Mater. Res. 2017, 6, 305–313. [Google Scholar] [CrossRef]
- Adamczuk, A.; Kołodyńska, D. Equilibrium, Thermodynamic and Kinetic Studies on Removal of Chromium, Copper, Zinc and Arsenic from Aqueous Solutions onto Fly Ash Coated by Chitosan. Chem. Eng. J. 2015, 274, 200–212. [Google Scholar] [CrossRef]
- Javanbakht, V.; Ghoreishi, S.M.; Habibi, N.; Javanbakht, M. A Novel Magnetic Chitosan/Clinoptilolite/Magnetite Nanocomposite for Highly Efficient Removal of Pb(II) Ions from Aqueous Solution. Powder Technol. 2016, 302, 372–383. [Google Scholar] [CrossRef]
- Liu, N.; Chen, X.-G.; Park, H.-J.; Liu, C.-G.; Liu, C.-S.; Meng, X.-H.; Yu, L.-J. Effect of MW and Concentration of Chitosan on Antibacterial Activity of Escherichia coli. Carbohydr. Polym. 2006, 64, 60–65. [Google Scholar] [CrossRef]
- Doan, L.; Tran, K. Relationship between the Polymer Blend Using Chitosan, Polyethylene Glycol, Polyvinyl Alcohol, Polyvinylpyrrolidone, and Antimicrobial Activities against Staphylococcus aureus. Pharmaceutics 2023, 15, 2453. [Google Scholar] [CrossRef]
- Liu, Q.; Yang, B.; Zhang, L.; Huang, R. Adsorptive Removal of Cr(VI) from Aqueous Solutions by Cross-Linked Chitosan/Bentonite Composite. Korean J. Chem. Eng. 2015, 32, 1314–1322. [Google Scholar] [CrossRef]
- Nechita, P. Applications of Chitosan in Wastewater Treatment. In Biological Activities and Application of Marine Polysaccharides; IntechOpen: Rijeka, Croatia, 2017; ISBN 978-953-51-2860-1. [Google Scholar]
- Liu, H.; Du, Y.; Wang, X.; Sun, L. Chitosan Kills Bacteria through Cell Membrane Damage. Int. J. Food Microbiol. 2004, 95, 147–155. [Google Scholar] [CrossRef]
- Lou, M.-M.; Zhu, B.; Muhammad, I.; Li, B.; Xie, G.-L.; Wang, Y.-L.; Li, H.-Y.; Sun, G.-C. Antibacterial Activity and Mechanism of Action of Chitosan Solutions against Apricot Fruit Rot Pathogen Burkholderia Seminalis. Carbohydr. Res. 2011, 346, 1294–1301. [Google Scholar] [CrossRef] [PubMed]
- Ma, Z.; Kim, D.; Adesogan, A.T.; Ko, S.; Galvao, K.; Jeong, K.C. Chitosan Microparticles Exert Broad-Spectrum Antimicrobial Activity against Antibiotic-Resistant Micro-Organisms without Increasing Resistance. ACS Appl. Mater. Interfaces 2016, 8, 10700–10709. [Google Scholar] [CrossRef]
- Kamjumphol, W.; Chareonsudjai, P.; Chareonsudjai, S. Antibacterial Activity of Chitosan against Burkholderia pseudomallei. MicrobiologyOpen 2018, 7, e00534. [Google Scholar] [CrossRef] [PubMed]
- Doble, M.; Kumar, A. Degradation of Polymers. In Biotreatment of Industrial Effluents; Elsevier: Amsterdam, The Netherlands, 2005; pp. 101–110. ISBN 978-0-7506-7838-4. [Google Scholar]
- Jia, Z.; Li, Z.; Li, S.; Li, Y.; Zhu, R. Adsorption Performance and Mechanism of Methylene Blue on Chemically Activated Carbon Spheres Derived from Hydrothermally-Prepared Poly(Vinyl Alcohol) Microspheres. J. Mol. Liq. 2016, 220, 56–62. [Google Scholar] [CrossRef]
- Kim, J.O.; Park, J.K.; Kim, J.H.; Jin, S.G.; Yong, C.S.; Li, D.X.; Choi, J.Y.; Woo, J.S.; Yoo, B.K.; Lyoo, W.S.; et al. Development of Polyvinyl Alcohol–Sodium Alginate Gel-Matrix-Based Wound Dressing System Containing Nitrofurazone. Int. J. Pharm. 2008, 359, 79–86. [Google Scholar] [CrossRef] [PubMed]
- Jin, J.; Song, M.; Hourston, D.J. Novel Chitosan-Based Films Cross-Linked by Genipin with Improved Physical Properties. Biomacromolecules 2004, 5, 162–168. [Google Scholar] [CrossRef]
- Millon, L.E.; Wan, W.K. The Polyvinyl Alcohol–Bacterial Cellulose System as a New Nanocomposite for Biomedical Applications. J. Biomed. Mater. Res. B Appl. Biomater. 2006, 79B, 245–253. [Google Scholar] [CrossRef]
- Schmedlen, R.H.; Masters, K.S.; West, J.L. Photocrosslinkable Polyvinyl Alcohol Hydrogels That Can Be Modified with Cell Adhesion Peptides for Use in Tissue Engineering. Biomaterials 2002, 23, 4325–4332. [Google Scholar] [CrossRef]
- Jain, N.; Singh, V.K.; Chauhan, S. A Review on Mechanical and Water Absorption Properties of Polyvinyl Alcohol Based Composites/Films. J. Mech. Behav. Mater. 2017, 26, 213–222. [Google Scholar] [CrossRef]
- Venkataprasanna, K.S.; Prakash, J.; Vignesh, S.; Bharath, G.; Venkatesan, M.; Banat, F.; Sahabudeen, S.; Ramachandran, S.; Devanand Venkatasubbu, G. Fabrication of Chitosan/PVA/GO/CuO Patch for Potential Wound Healing Application. Int. J. Biol. Macromol. 2020, 143, 744–762. [Google Scholar] [CrossRef]
- El-Hefian, E.A.; Nasef, M.M.; Yahaya, A.H. The Preparation and Characterization of Chitosan/Poly (Vinyl Alcohol) Blended Films. E-J. Chem. 2010, 7, 1212–1219. [Google Scholar] [CrossRef]
- Liu, Y.; Wang, S.; Lan, W. Fabrication of Antibacterial Chitosan-PVA Blended Film Using Electrospray Technique for Food Packaging Applications. Int. J. Biol. Macromol. 2018, 107, 848–854. [Google Scholar] [CrossRef]
- Saragi, T.; Depi, B.L.; Butarbutar, S.; Permana, B.; Risdiana. The Impact of Synthesis Temperature on Magnetite Nanoparticles Size Synthesized by Co-Precipitation Method. J. Phys. Conf. Ser. 2018, 1013, 012190. [Google Scholar] [CrossRef]
- Zhao, Y.; Qiu, Z.; Huang, J. Preparation and Analysis of Fe3O4 Magnetic Nanoparticles Used as Targeted-Drug Carriers. Chin. J. Chem. Eng. 2008, 16, 451–455. [Google Scholar] [CrossRef]
- Doan, L. Modifying Superparamagnetic Iron Oxide Nanoparticles as Methylene Blue Adsorbents: A Review. ChemEngineering 2023, 7, 77. [Google Scholar] [CrossRef]
- Jalilian, A.R.; Panahifar, A.; Mahmoudi, M.; Akhlaghi, M.; Simchi, A. Preparation and Biological Evaluation of [67Ga]-Labeled-Superparamagnetic Nanoparticles in Normal Rats. Radiochim. Acta 2009, 97, 51–56. [Google Scholar] [CrossRef]
- Wahajuddin, N.; Arora, S. Arora Superparamagnetic Iron Oxide Nanoparticles: Magnetic Nanoplatforms as Drug Carriers. Int. J. Nanomed. 2012, 7, 3445–3471. [Google Scholar] [CrossRef]
- Mohapatra, S.; Mallick, S.K.; Maiti, T.K.; Ghosh, S.K.; Pramanik, P. Synthesis of Highly Stable Folic Acid Conjugated Magnetite Nanoparticles for Targeting Cancer Cells. Nanotechnology 2007, 18, 385102. [Google Scholar] [CrossRef]
- Bellamy, L.J. The Infrared Spectra of Complex Molecules; Springer: Dordrecht, The Netherlands, 1980; ISBN 978-94-011-6522-8. [Google Scholar]
- Franca, T.; Goncalves, D.; Cena, C. ATR-FTIR Spectroscopy Combined with Machine Learning for Classification of PVA/PVP Blends in Low Concentration. Vib. Spectrosc. 2022, 120, 103378. [Google Scholar] [CrossRef]
- Abureesh, M.A.; Oladipo, A.A.; Gazi, M. Facile Synthesis of Glucose-Sensitive Chitosan–Poly(Vinyl Alcohol) Hydrogel: Drug Release Optimization and Swelling Properties. Int. J. Biol. Macromol. 2016, 90, 75–80. [Google Scholar] [CrossRef]
- Mansur, H.S.; Sadahira, C.M.; Souza, A.N.; Mansur, A.A.P. FTIR Spectroscopy Characterization of Poly (Vinyl Alcohol) Hydrogel with Different Hydrolysis Degree and Chemically Crosslinked with Glutaraldehyde. Mater. Sci. Eng. C 2008, 28, 539–548. [Google Scholar] [CrossRef]
- Jipa, I.; Stoica, A.; Stroescu, M.; Dobre, L.-M.; Dobre, T.; Jinga, S.; Tardei, C. Potassium Sorbate Release from Poly(Vinyl Alcohol)-Bacterial Cellulose Films. Chem. Pap. 2012, 66, 138–143. [Google Scholar] [CrossRef]
- Reis, E.F.D.; Campos, F.S.; Lage, A.P.; Leite, R.C.; Heneine, L.G.; Vasconcelos, W.L.; Lobato, Z.I.P.; Mansur, H.S. Synthesis and Characterization of Poly (Vinyl Alcohol) Hydrogels and Hybrids for rMPB70 Protein Adsorption. Mater. Res. 2006, 9, 185–191. [Google Scholar] [CrossRef]
- Kharazmi, A.; Faraji, N.; Mat Hussin, R.; Saion, E.; Yunus, W.M.M.; Behzad, K. Structural, Optical, Opto-Thermal and Thermal Properties of ZnS–PVA Nanofluids Synthesized through a Radiolytic Approach. Beilstein J. Nanotechnol. 2015, 6, 529–536. [Google Scholar] [CrossRef] [PubMed]
- Jabbar, W.A.; Habubi, N.F.; Chiad, S.S. Optical Characterization of Silver Doped Poly (Vinyl Alcohol) Films. J. Ark. Acad. Sci. 2010, 64, 21. [Google Scholar]
- Dibbern-Brunelli, D.; Atvars, T.D.Z.; Joekes, I.; Barbosa, V.C. Mapping Phases of Poly(Vinyl Alcohol) and Poly(Vinyl Acetate) Blends by FTIR Microspectroscopy and Optical Fluorescence Microscopy. J. Appl. Polym. Sci. 1998, 69, 645–655. [Google Scholar] [CrossRef]
- Tretinnikov, O.N.; Zagorskaya, S.A. Determination of the Degree of Crystallinity of Poly(Vinyl Alcohol) by FTIR Spectroscopy. J. Appl. Spectrosc. 2012, 79, 521–526. [Google Scholar] [CrossRef]
- Fernandes Queiroz, M.; Melo, K.; Sabry, D.; Sassaki, G.; Rocha, H. Does the Use of Chitosan Contribute to Oxalate Kidney Stone Formation? Mar. Drugs 2014, 13, 141–158. [Google Scholar] [CrossRef]
- Varma, R.; Vasudevan, S. Extraction, Characterization, and Antimicrobial Activity of Chitosan from Horse Mussel Modiolus Modiolus. ACS Omega 2020, 5, 20224–20230. [Google Scholar] [CrossRef]
- Yasmeen, S.; Kabiraz, M.; Saha, B.; Qadir, M.; Gafur, M.; Masum, S. Chromium (VI) Ions Removal from Tannery Effluent Using Chitosan-Microcrystalline Cellulose Composite as Adsorbent. Int. Res. J. Pure Appl. Chem. 2016, 10, 1–14. [Google Scholar] [CrossRef]
- Dhumale, V.A.; Gangwar, R.K.; Datar, S.S.; Sharma, R.B. Reversible Aggregation Control of Polyvinylpyrrolidone Capped Gold Nanoparticles as a Function of pH. Mater. Express 2012, 2, 311–318. [Google Scholar] [CrossRef]
- Hashim, N.; Adnan, N.; Hassan, L.; Abdullah, S.; Aniyyah, N.; Sobri, M. Extraction of Degradable Biopolymer Material from Shrimp Shell. IOP Conf. Ser. Mater. Sci. Eng. 2022, 3, 58–64. [Google Scholar]
- Stoica, A.; Dobre, L.; Stroescu, M.; Deleanu, I. Fourier Transform Infrared (FTIR) Spectroscopy for Characterization of Antimicrobial Films Containing Chitosan. Ann. Univ. Oradea Fasc. 2010, 2010, 1234–1240. [Google Scholar]
- Wang, M.; Zhang, J.; Zhao, H.; Deng, W.; Lu, J.; Ye, Q. Enhancement of Oxidation Capacity of ZVI/Cu2+/PMS Systems by Weak Magnetic Fields. Desalination Water Treat. 2019, 161, 260–268. [Google Scholar] [CrossRef]
- Tang, C.; Shu, Y.; Zhang, R.; Li, X.; Song, J.; Li, B.; Zhang, Y.; Ou, D. Comparison of the Removal and Adsorption Mechanisms of Cadmium and Lead from Aqueous Solution by Activated Carbons Prepared from Typha Angustifolia and Salix Matsudana. RSC Adv. 2017, 7, 16092–16103. [Google Scholar] [CrossRef]
- Maulina, S.; Mentari, V.A. Comparison of Functional Group and Morphological Surface of Activated Carbon from Oil Palm Fronds Using Phosphoric Acid (H3PO4) and Nitric Acid (HNO3) as an Activator. IOP Conf. Ser. Mater. Sci. Eng. 2019, 505, 012023. [Google Scholar] [CrossRef]
- Allwar, A. Preparation and Characteristics of Activated Carbon from Oil Palm Shell for Removal of Iron and Copper from Patchouli Oil. Int. J. Appl. Chem. 2016, 12, 183–192. [Google Scholar]
- Bera, M.; Chandravati; Gupta, P.; Maji, P.K. Facile One-Pot Synthesis of Graphene Oxide by Sonication Assisted Mechanochemical Approach and Its Surface Chemistry. J. Nanosci. Nanotechnol. 2018, 18, 902–912. [Google Scholar] [CrossRef]
- Kartick, B.; Srivastava, S.K.; Srivastava, A.I. Green Synthesis of Graphene. J. Nanosci. Nanotechnol. 2013, 13, 4320–4324. [Google Scholar] [CrossRef] [PubMed]
- Rochman, R.A.; Wahyuningsih, S.; Ramelan, A.H.; Hanif, Q.A. Preparation of Nitrogen and Sulphur Co-Doped Reduced Graphene Oxide (rGO-NS) Using N and S Heteroatom of Thiourea. IOP Conf. Ser. Mater. Sci. Eng. 2019, 509, 012119. [Google Scholar] [CrossRef]
- Visca, R.; Dewi, M.N.; Liviani, A.; Satriawan, B.D. Characterization of FTIR in Graphite from Palm Oil Waste with Ferric Chloride Catalyst. Interdiscip. Soc. Stud. 2022, 1, 11. [Google Scholar] [CrossRef]
- Shalaby, T.I.; Fikrt, N.M.; Mohamed, M.M.; El Kady, M.F. Preparation and Characterization of Iron Oxide Nanoparticles Coated with Chitosan for Removal of Cd(II) and Cr(VI) from Aqueous Solution. Water Sci. Technol. 2014, 70, 1004–1010. [Google Scholar] [CrossRef]
- Zhao, D.-L.; Teng, P.; Xu, Y.; Xia, Q.-S.; Tang, J.-T. Magnetic and Inductive Heating Properties of Fe3O4/Polyethylene Glycol Composite Nanoparticles with Core–Shell Structure. J. Alloys Compd. 2010, 502, 392–395. [Google Scholar] [CrossRef]
- Sayahi, M.H.; Sepahdar, A.; Bazrafkan, F.; Dehghani, F.; Mahdavi, M.; Bahadorikhalili, S. Ionic Liquid Modified SPION@Chitosan as a Novel and Reusable Superparamagnetic Catalyst for Green One-Pot Synthesis of Pyrido[2,3-d]pyrimidine-dione Derivatives in Water. Catalysts 2023, 13, 290. [Google Scholar] [CrossRef]
- Maldonado-Camargo, L.; Unni, M.; Rinaldi, C. Magnetic Characterization of Iron Oxide Nanoparticles for Biomedical Applications. In Biomedical Nanotechnology; Petrosko, S.H., Day, E.S., Eds.; Methods in Molecular Biology; Springer New York: New York, NY, USA, 2017; Volume 1570, pp. 47–71. ISBN 978-1-4939-6838-1. [Google Scholar]
- Yurdakal, S.; Garlisi, C.; Özcan, L.; Bellardita, M.; Palmisano, G. Chapter 4-(Photo)Catalyst Characterization Techniques: Adsorption Isotherms and BET, SEM, FTIR, UV–Vis, Photoluminescence, and Electrochemical Characterizations. In Heterogeneous Photocatalysis; Marcì, G., Palmisano, L., Eds.; Elsevier: Amsterdam, The Netherlands, 2019; pp. 87–152. ISBN 978-0-444-64015-4. [Google Scholar]
- Characterization of the Adsorption Site Energies and Heterogeneous Surfaces of Porous Materials-Journal of Materials Chemistry A (RSC Publishing). Available online: https://pubs.rsc.org/en/content/articlelanding/2019/TA/C9TA00287A (accessed on 18 September 2023).
- Dai, H.; Huang, Y.; Huang, H. Eco-Friendly Polyvinyl Alcohol/Carboxymethyl Cellulose Hydrogels Reinforced with Graphene Oxide and Bentonite for Enhanced Adsorption of Methylene Blue. Carbohydr. Polym. 2018, 185, 1–11. [Google Scholar] [CrossRef]
- Sharma, G.; Kumar, A.; Devi, K.; Sharma, S.; Naushad, M.; Ghfar, A.A.; Ahamad, T.; Stadler, F.J. Guar Gum-Crosslinked-Soya Lecithin Nanohydrogel Sheets as Effective Adsorbent for the Removal of Thiophanate Methyl Fungicide. Int. J. Biol. Macromol. 2018, 114, 295–305. [Google Scholar] [CrossRef] [PubMed]
- Sharma, G.; Kumar, A.; Naushad, M.; García-Peñas, A.; Al-Muhtaseb, A.H.; Ghfar, A.A.; Sharma, V.; Ahamad, T.; Stadler, F.J. Fabrication and Characterization of Gum Arabic-Cl-Poly(Acrylamide) Nanohydrogel for Effective Adsorption of Crystal Violet Dye. Carbohydr. Polym. 2018, 202, 444–453. [Google Scholar] [CrossRef] [PubMed]
- Kannan, N.; Sundaram, M.M. Kinetics and Mechanism of Removal of Methylene Blue by Adsorption on Various Carbons—A Comparative Study. Dye. Pigment. 2001, 51, 25–40. [Google Scholar] [CrossRef]
- Jawad, A.H.; Mohd Firdaus Hum, N.N.; Abdulhameed, A.S.; Mohd Ishak, M.A. Mesoporous Activated Carbon from Grass Waste via H3PO4-Activation for Methylene Blue Dye Removal: Modelling, Optimisation, and Mechanism Study. Int. J. Environ. Anal. Chem. 2022, 102, 6061–6077. [Google Scholar] [CrossRef]
- Shikuku, V.O.; Zanella, R.; Kowenje, C.O.; Donato, F.F.; Bandeira, N.M.G.; Prestes, O.D. Single and Binary Adsorption of Sulfonamide Antibiotics onto Iron-Modified Clay: Linear and Nonlinear Isotherms, Kinetics, Thermodynamics, and Mechanistic Studies. Appl. Water Sci. 2018, 8, 175. [Google Scholar] [CrossRef]
- Liu, L.; Luo, X.-B.; Ding, L.; Luo, S.-L. 4-Application of Nanotechnology in the Removal of Heavy Metal From Water. In Nanomaterials for the Removal of Pollutants and Resource Reutilization; Luo, X., Deng, F., Eds.; Micro and Nano Technologies; Elsevier: Amsterdam, The Netherlands, 2019; pp. 83–147. ISBN 978-0-12-814837-2. [Google Scholar]
- Reed, B.E.; Matsumoto, M.R. Modeling Cadmium Adsorption by Activated Carbon Using the Langmuir and Freundlich Isotherm Expressions. Sep. Sci. Technol. 1993, 28, 2179–2195. [Google Scholar] [CrossRef]
- Yao, Y.; Xu, F.; Chen, M.; Xu, Z.; Zhu, Z. Adsorption Behavior of Methylene Blue on Carbon Nanotubes. Bioresour. Technol. 2010, 101, 3040–3046. [Google Scholar] [CrossRef] [PubMed]


| Materials | Peaks (cm−1) | Functional Group | Ref. |
|---|---|---|---|
| SPION | 3419 | O−H symmetric stretching | [73,74] |
| 1629 | Carbonyl C=O stretching band | [73,74] | |
| 587 | Vibration Fe−O | [73,74,75] | |
| 447 | Vibration Fe−O | [75,76] | |
| PVA | 3397 | O−H symmetric stretching | [77,78] |
| 2944 | CH2 asymmetric stretching | [78,79,80] | |
| 1736 | C=O stretching band | [79,80,81] | |
| 1657 | O−H bending mode of OH groups | [80,82,83] | |
| 1440 | CH2 bending | [78,79,80,82] | |
| 1330 | CH wagging | [80] | |
| 1266 | C−O−C stretching | [84] | |
| 1145 | C−O stretching | [78,80,82,85] | |
| 1098 | C−O stretching | [78,80,82,85] | |
| 947 | CH2 rocking | [80] | |
| 853 | C−C stretching | [80,82] | |
| CS | 3425 | O−H symmetric stretching and −NH symmetrical vibration | [78,86] |
| 2923 | C−H symmetric stretching | [86,87,88] | |
| 1650 | C=O stretching of amide I | [86,87,88,89] | |
| 1423 | C−H bending | [88] | |
| 1382 | CH2 in CH2OH group | [90] | |
| 1323 | C−N stretching of amide III | [86] | |
| 1262 | C−H bond in the pyranose ring | [90] | |
| 1157 | C−O−C asymmetric stretching Saccharide structure of chitosan | [86,88,91] | |
| 1077 | C−O stretching | [78,88,92] | |
| 1030 | C−O stretching | [86,88] | |
| 897 | Saccharide structure of chitosan | [78,91] | |
| AC | 3390 | O−H stretching vibration | [93,94] |
| 2920 | C−H stretching vibration | [94] | |
| 2855 | C−H stretching vibration | [94] | |
| 1593 | C=C stretching vibration in aromatic rings | [95] | |
| 1396 | C−H stretching vibration C−O−H bending vibration | [93] | |
| 1166 | C−O−H stretching vibration | [95] | |
| 807 | C−C stretching vibration | [95] | |
| GR | 3422 | O−H stretching vibration | [96,97,98] |
| 2919 | CH2 asymmetric stretching | [96] | |
| 2856 | CH2 symmetric stretching | [96] | |
| 1632 | C=C stretching vibration | [96,98] | |
| 1165 | C−O stretching vibration | [99] | |
| 1116 | C−O stretching vibration | [99] | |
| 1065 | C−O stretching of alkoxy group | [96,98] | |
| SPION/PVA/CS/AC | 3414 | O−H stretching vibration | This research |
| 2923 | CH2 asymmetric vibration C−H symmetric stretching | This research | |
| 1614 | C=O stretching band O−H bending mode of OH groups | This research | |
| 1384 | C−H stretching vibration C−O−H bending vibration CH2 in CH2OH group | This research | |
| 1248 | C−O−C stretching C−H bond in the pyranose ring | This research | |
| 1160 | C−O stretching C−O−C asymmetric stretching Saccharide structure of chitosan C−O−H stretching vibration | This research | |
| 1064 | C−O stretching | This research | |
| 569 | Vibration Fe−O | This research | |
| SPION/PVA/CS/GR | 3434 | O−H stretching vibration | This research |
| 2924 | CH2 asymmetric vibration C−H symmetric stretching | This research | |
| 2860 | CH2 symmetric stretching | This research | |
| 1629 | C=O stretching band C=C stretching vibration | This research | |
| 1395 | CH2 in CH2OH group CH wagging | This research | |
| 1162 | C−O−C asymmetric stretching Saccharide structure of chitosan C−O stretching vibration | This research | |
| 1115 | C−O stretching vibration | This research | |
| 1058 | C−O stretching of alkoxy group C−O stretching | This research | |
| 565 | Vibration Fe−O | This research |
| SPION/PVA/CS/AC | SPION/PVA/CS/GR | |
|---|---|---|
| Surface area (m2/g) | 563.891 | 8.059 |
| Pore diameter (Å) | 9.719 | 27.516 |
| Pore volume (cm3/g) | 0.251 | 0.017 |
| Material | Initial MB Concentration (mg/mL) | Qt (mg/g) | %LC (%) | %EE (%) |
|---|---|---|---|---|
| SPION/PVA/CS/AC | 0.015 | 7.6 ± 0.2 | 0.76 ± 0.02 | 30.3 ± 0.7 |
| 0.02 | 14.9 ± 0.1 | 1.5 ± 0.01 | 44.8 ± 0.4 | |
| 0.025 | 22.4 ± 0.05 | 2.2 ± 0.005 | 53.7 ± 0.1 | |
| SPION/PVA/CS/GR | 0.015 | 6.9 ± 0.02 | 0.69 ± 0.002 | 27.7 ± 0.09 |
| 0.02 | 14.5 ± 0.01 | 1.45 ± 0.001 | 43.4 ± 0.03 | |
| 0.025 | 22.2 ± 0.004 | 2.22 ± 0.0004 | 53.3 ± 0.009 |
| Initial MB Concentration (mg/mL) | ||||
|---|---|---|---|---|
| 0.015 | 0.020 | 0.025 | ||
| Pseudo-first order non-linear | Qe mg MB (g particles)−1 | 13.3 | 22.3 | 29.01 |
| k1 (g mg−1 day−1) | 1 | 1 | 1 | |
| 27.2 | 24.1 | 14.5 | ||
| Pseudo-second order non-linear | Qe mg MB (g particles)−1 | 13.3 | 22.3 | 29.01 |
| k2 (g mg−1 day−1) | 171.8 | 56.2 | 915.9 | |
| 27.2 | 24.1 | 14.5 | ||
| Pseudo-second order linear | Qe mg MB (g particles)−1 | 22.5 | 15.1 | 7.8 |
| k2 (g mg−1 day−1) | 0.6 | 0.3 | 0.2 | |
| R2 | 0.999 | 0.999 | 0.996 | |
| Simplified Elovich | α (mg/(g day)) | 2425.46 | 116,289.7 | 419,458.8 |
| β (mg/g) | 2.277 | 1.354 | 0.950 | |
| R2 | 0.452 | 0.325 | 0.292 | |
| Initial MB Concentration (mg/mL) | ||||
|---|---|---|---|---|
| 0.015 | 0.020 | 0.025 | ||
| Pseudo-first order non-linear | Qe mg MB (g particles)−1 | 13.3 | 22.3 | 29.01 |
| k1 (g mg−1 day−1) | 1 | 1 | 1 | |
| 28.9 | 25.5 | 14.8 | ||
| Pseudo-second order non-linear | Qe mg MB (g particles)−1 | 13.3 | 22.3 | 29.01 |
| k2 (g mg−1 day−1) | 171.8 | 56.2 | 915.9 | |
| 28.9 | 25.5 | 14.8 | ||
| Pseudo-second order linear | Qe mg MB (g particles)−1 | 22.3 | 14.6 | 7.1 |
| k2 (g mg−1 day−1) | 0.8 | 0.7 | 0.6 | |
| R2 | 0.999 | 0.999 | 0.998 | |
| Simplified Elovich | α (mg/(g day)) | 140,135.3 | 512,001.3 | 1,076,154.2 |
| β (mg/g) | 3.100 | 1.506 | 0.9914 | |
| R2 | 0.235 | 0.303 | 0.287 | |
| Materials | Initial MB Concentration (mg/mL) | kI | I | R2 |
|---|---|---|---|---|
| SPION/PVA/CS/AC | 0.015 | 0.5 | 5.7 | 0.782 |
| 0.020 | 0.3 | 13.8 | 0.382 | |
| 0.025 | 0.2 | 21.8 | 0.253 | |
| SPION/PVA/CS/GR | 0.015 | 0.2 | 6.2 | 0.358 |
| 0.020 | 0.2 | 13.9 | 0.256 | |
| 0.025 | 0.1 | 21.8 | 0.117 |
| Model | Constant | SPION/PVA/CS/AC | SPION/PVA/CS/GR |
|---|---|---|---|
| Langmuir | kL (L/mg) | −12.06 | −11.98 |
| Q0 (mg/g) | 1.06 | 0.68 | |
| Average RL | 1.32 ± 0.09 | 1.32 ± 0.09 | |
| R2 | 0.94 | 0.96 | |
| Freundlich | kF (mg/g) | 9.55 × 10⁻¹¹ | 1.69 × 10⁻⁶ |
| (mg/L) | 10.71 | 16.05 | |
| R2 | 0.99 | 0.99 |
| Materials | Concentration (mg/mL) | % Release Average |
|---|---|---|
| SPION/PVA/CS/AC | 0.015 | 63.24 ± 8.77 |
| 0.02 | 27.17 ± 3.53 | |
| 0.025 | 22.10 ± 2.59 | |
| SPION/PVA/CS/GR | 0.015 | 91.29 ± 12.35 |
| 0.02 | 39.51 ± 4.37 | |
| 0.025 | 24.42 ± 1.40 |
| Korsmeyer–Peppas (KP) | 0th Order | Higuchi | |||||
|---|---|---|---|---|---|---|---|
| k | n | k | K | KP | 0th order | Higuchi | |
| SPION/PVA/CS/AC | |||||||
| 0.015 | 3.6 | 0.8 | 0.004 | 0.02 | 68.80 | 0.020 | 0.102 |
| 0.02 | 1.4 | 0.8 | 0.004 | 0.02 | 28.88 | 0.013 | 0.114 |
| 0.025 | 1.2 | 0.8 | 0.004 | 0.02 | 23.69 | 0.024 | 0.104 |
| SPION/PVA/CS/GR | |||||||
| 0.015 | 6.9 | 0.7 | 0.006 | 0.03 | 101.03 | 0.027 | 0.095 |
| 0.02 | 1.9 | 0.8 | 0.005 | 0.02 | 43.62 | 0.018 | 0.140 |
| 0.025 | 1.4 | 0.8 | 0.005 | 0.02 | 26.51 | 0.020 | 0.111 |
| Adsorbents | Costs (VND/g) | Adsorption Capacity (mg/g) | %EE (%) | %LC (%) | Adsorption Capacity/Costs (g/VND) |
|---|---|---|---|---|---|
| SPION/PVA/AC | 681.89 | 21.75 | 57.22 | 2.53 | 31.90 |
| SPION/PVA/GR | 1376.63 | 19.87 | 42.30 | 1.99 | 14.43 |
| SPION/PVA/CS/AC | 1211.5 | 14.9 | 44.80 | 1.50 | 12.30 |
| SPION/PVA/CS/GR | 1761.5 | 14.5 | 43.40 | 1.45 | 8.23 |
| SPION/PVA/CS/GO | 22,551.5 | 28.768 | 86.30 | 2.88 | 1.28 |
Disclaimer/Publisher’s Note: The statements, opinions and data contained in all publications are solely those of the individual author(s) and contributor(s) and not of MDPI and/or the editor(s). MDPI and/or the editor(s) disclaim responsibility for any injury to people or property resulting from any ideas, methods, instructions or products referred to in the content. |
© 2023 by the authors. Licensee MDPI, Basel, Switzerland. This article is an open access article distributed under the terms and conditions of the Creative Commons Attribution (CC BY) license (https://creativecommons.org/licenses/by/4.0/).
Share and Cite
Doan, L.; Nguyen, T.M.D.; Le, T.M.; Huynh, K.G.; Quach, T.P.T. Surface Modifications of Superparamagnetic Iron Oxide Nanoparticles with Polyvinyl Alcohol, Chitosan, and Activated Carbon or Graphite as Methylene Blue Adsorbents—Comparative Study. Coatings 2023, 13, 1797. https://doi.org/10.3390/coatings13101797
Doan L, Nguyen TMD, Le TM, Huynh KG, Quach TPT. Surface Modifications of Superparamagnetic Iron Oxide Nanoparticles with Polyvinyl Alcohol, Chitosan, and Activated Carbon or Graphite as Methylene Blue Adsorbents—Comparative Study. Coatings. 2023; 13(10):1797. https://doi.org/10.3390/coatings13101797
Chicago/Turabian StyleDoan, Linh, Tu M. D. Nguyen, Tan M. Le, Khanh G. Huynh, and Tran P. T. Quach. 2023. "Surface Modifications of Superparamagnetic Iron Oxide Nanoparticles with Polyvinyl Alcohol, Chitosan, and Activated Carbon or Graphite as Methylene Blue Adsorbents—Comparative Study" Coatings 13, no. 10: 1797. https://doi.org/10.3390/coatings13101797
APA StyleDoan, L., Nguyen, T. M. D., Le, T. M., Huynh, K. G., & Quach, T. P. T. (2023). Surface Modifications of Superparamagnetic Iron Oxide Nanoparticles with Polyvinyl Alcohol, Chitosan, and Activated Carbon or Graphite as Methylene Blue Adsorbents—Comparative Study. Coatings, 13(10), 1797. https://doi.org/10.3390/coatings13101797