
An Effectiveness Analysis for the Multi-Factor Accelerated Test of a Copper-Free Self-Polishing Antifouling Coating

Abstract
:1. Introduction
2. Antifouling Coating
3. Test Method
3.1. Environmental Test Classification
3.2. Test Method
3.2.1. General Test Method
3.2.2. RST Method
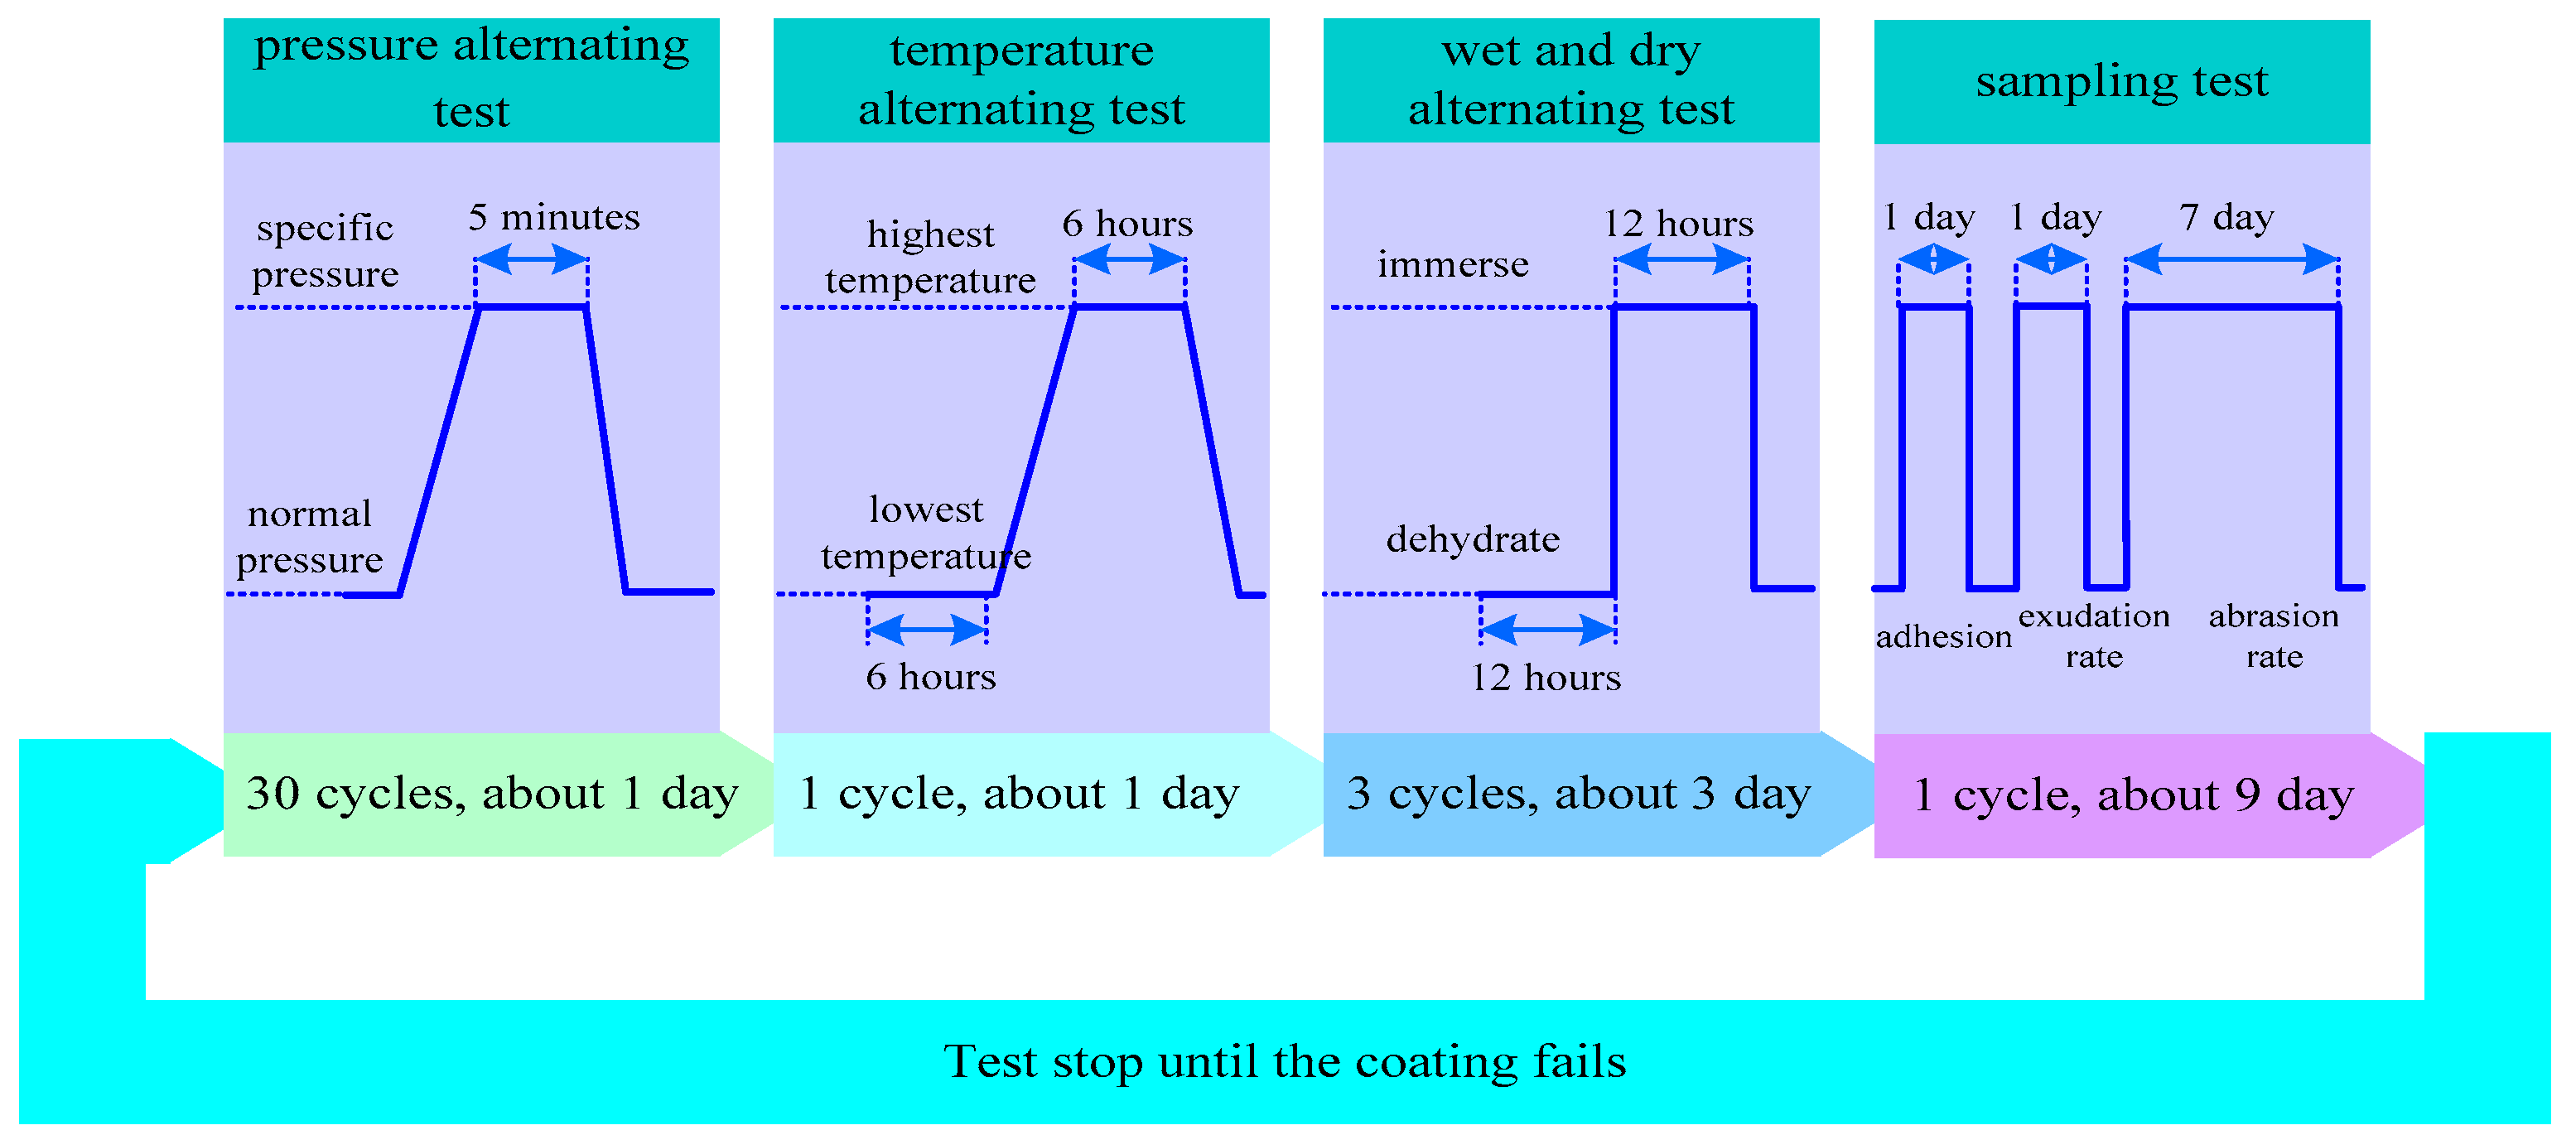
3.2.3. MFAT Method
4. Analysis of Experimental Data
4.1. Data-Fitting Method
4.1.1. Primary Linear Function
4.1.2. Non-Linear Exponential Decay Function
4.2. Data Analysis
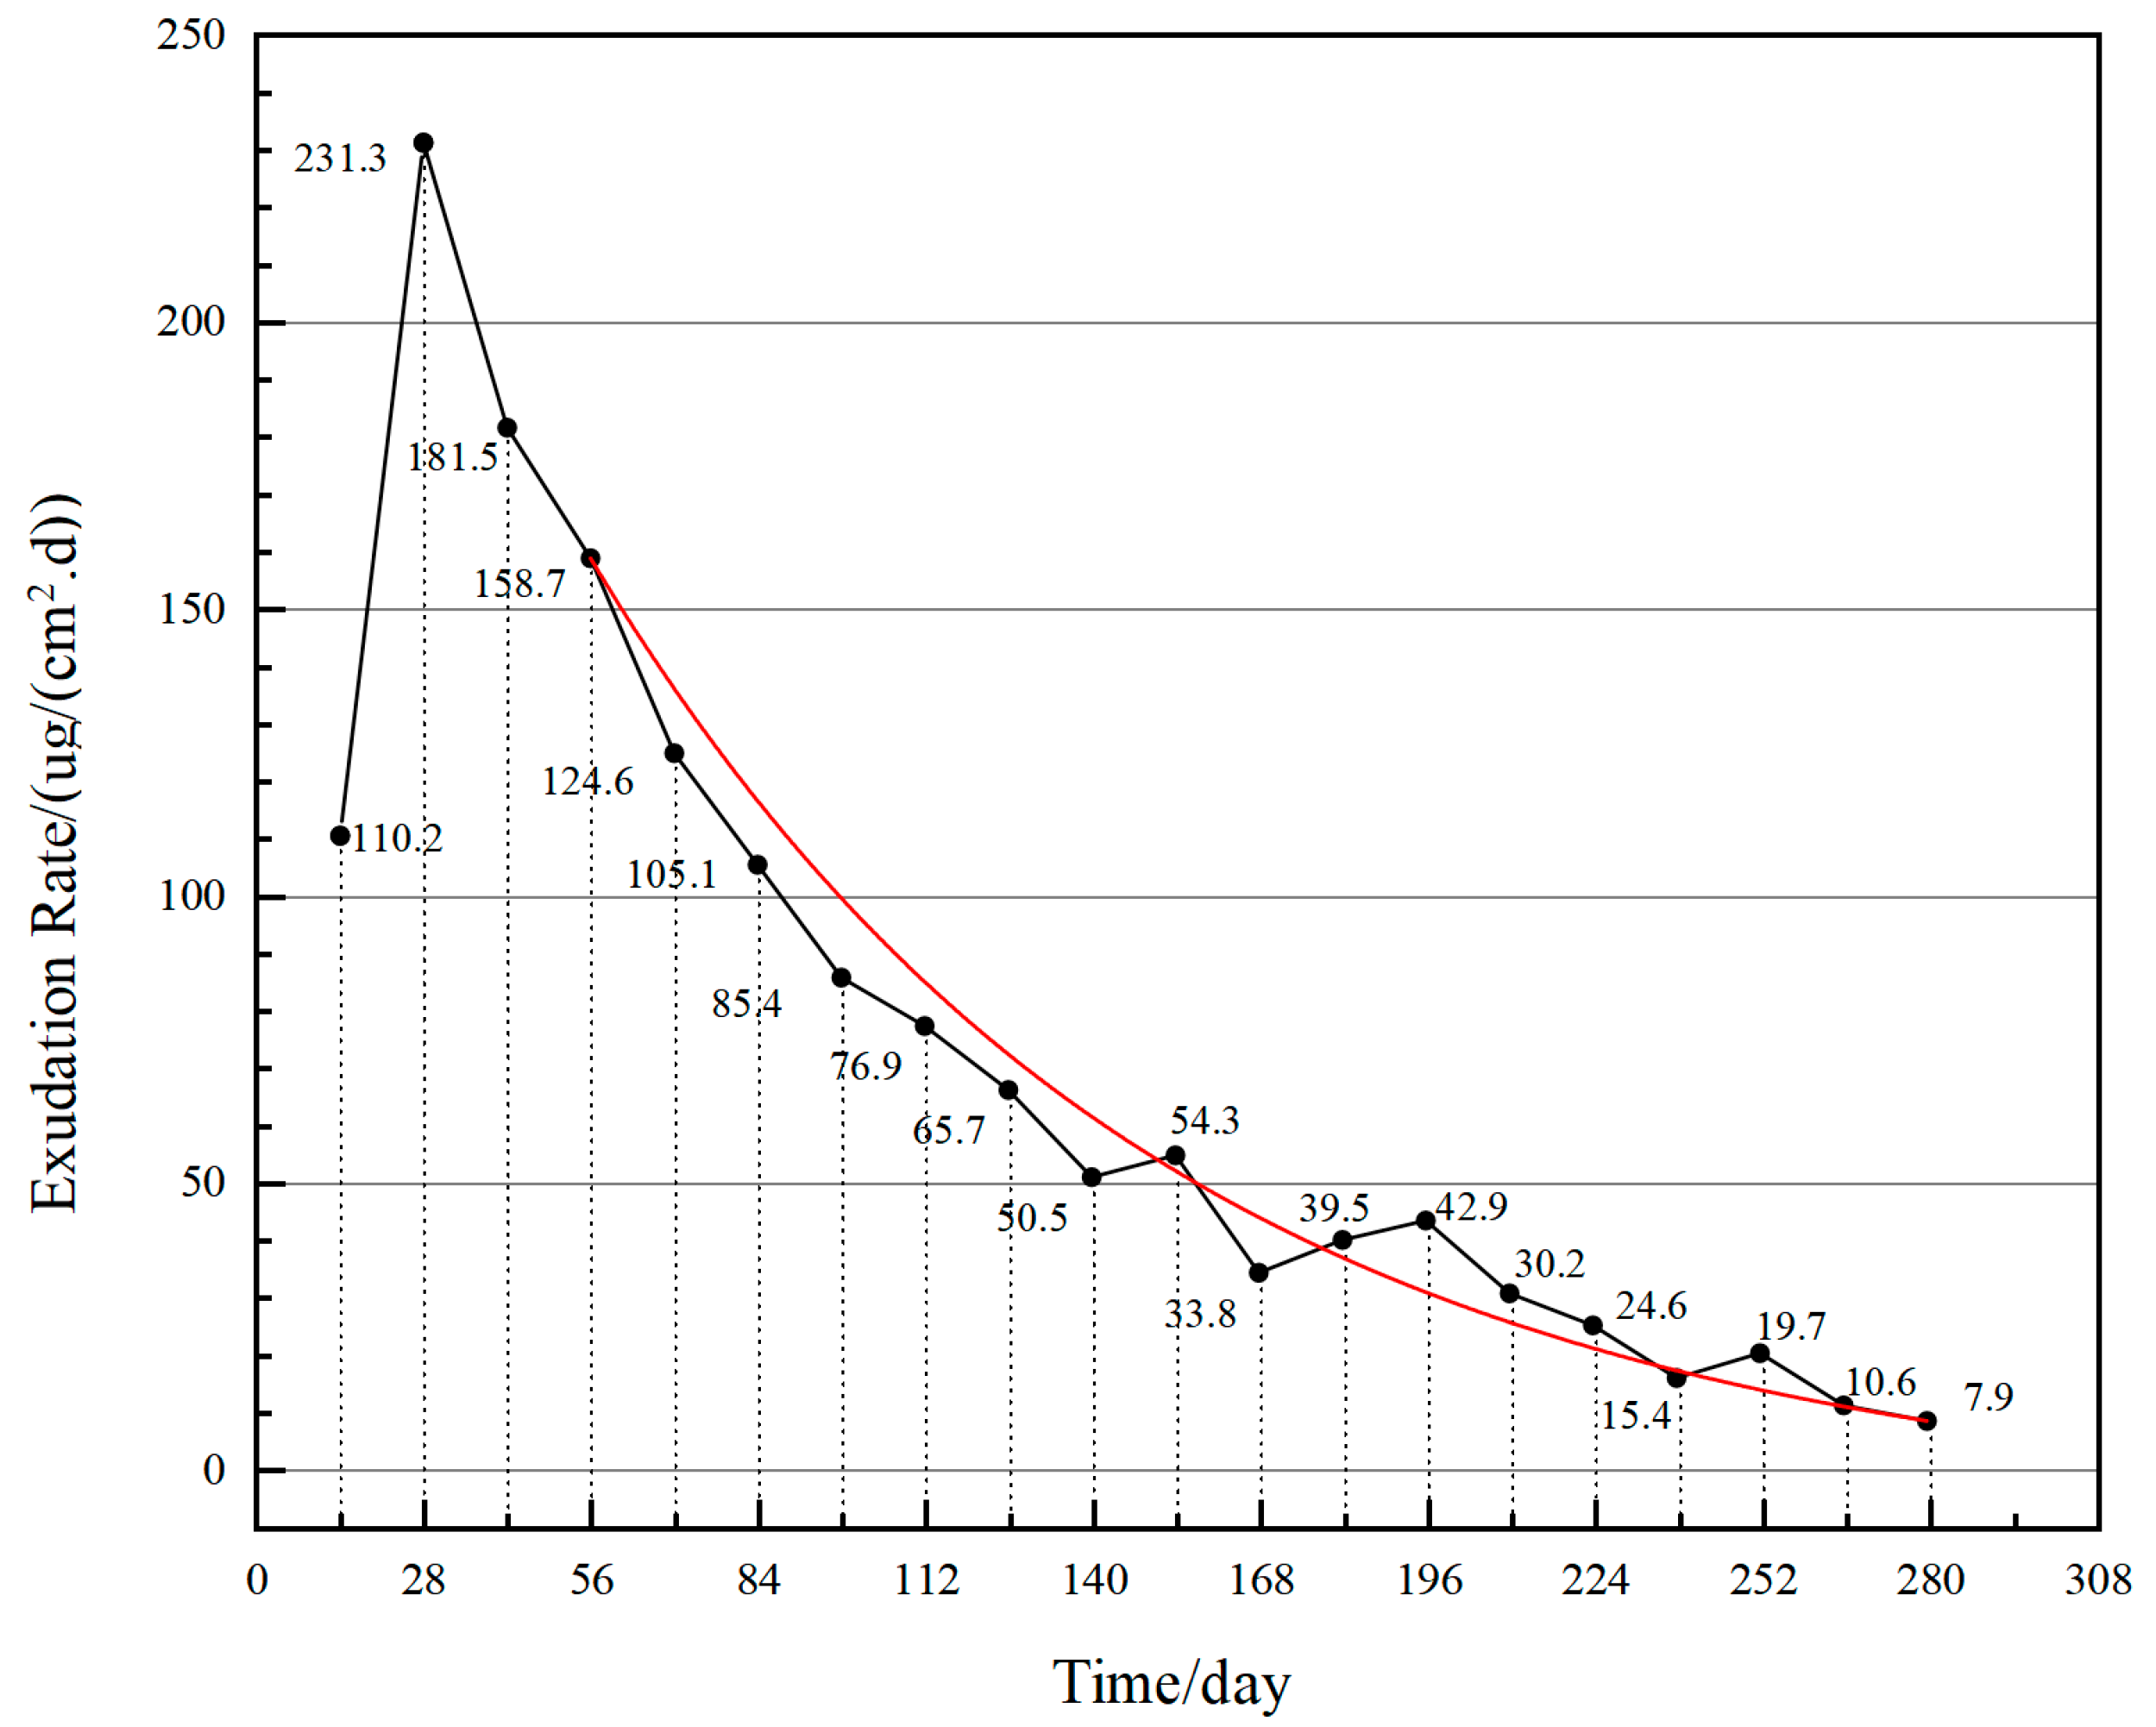
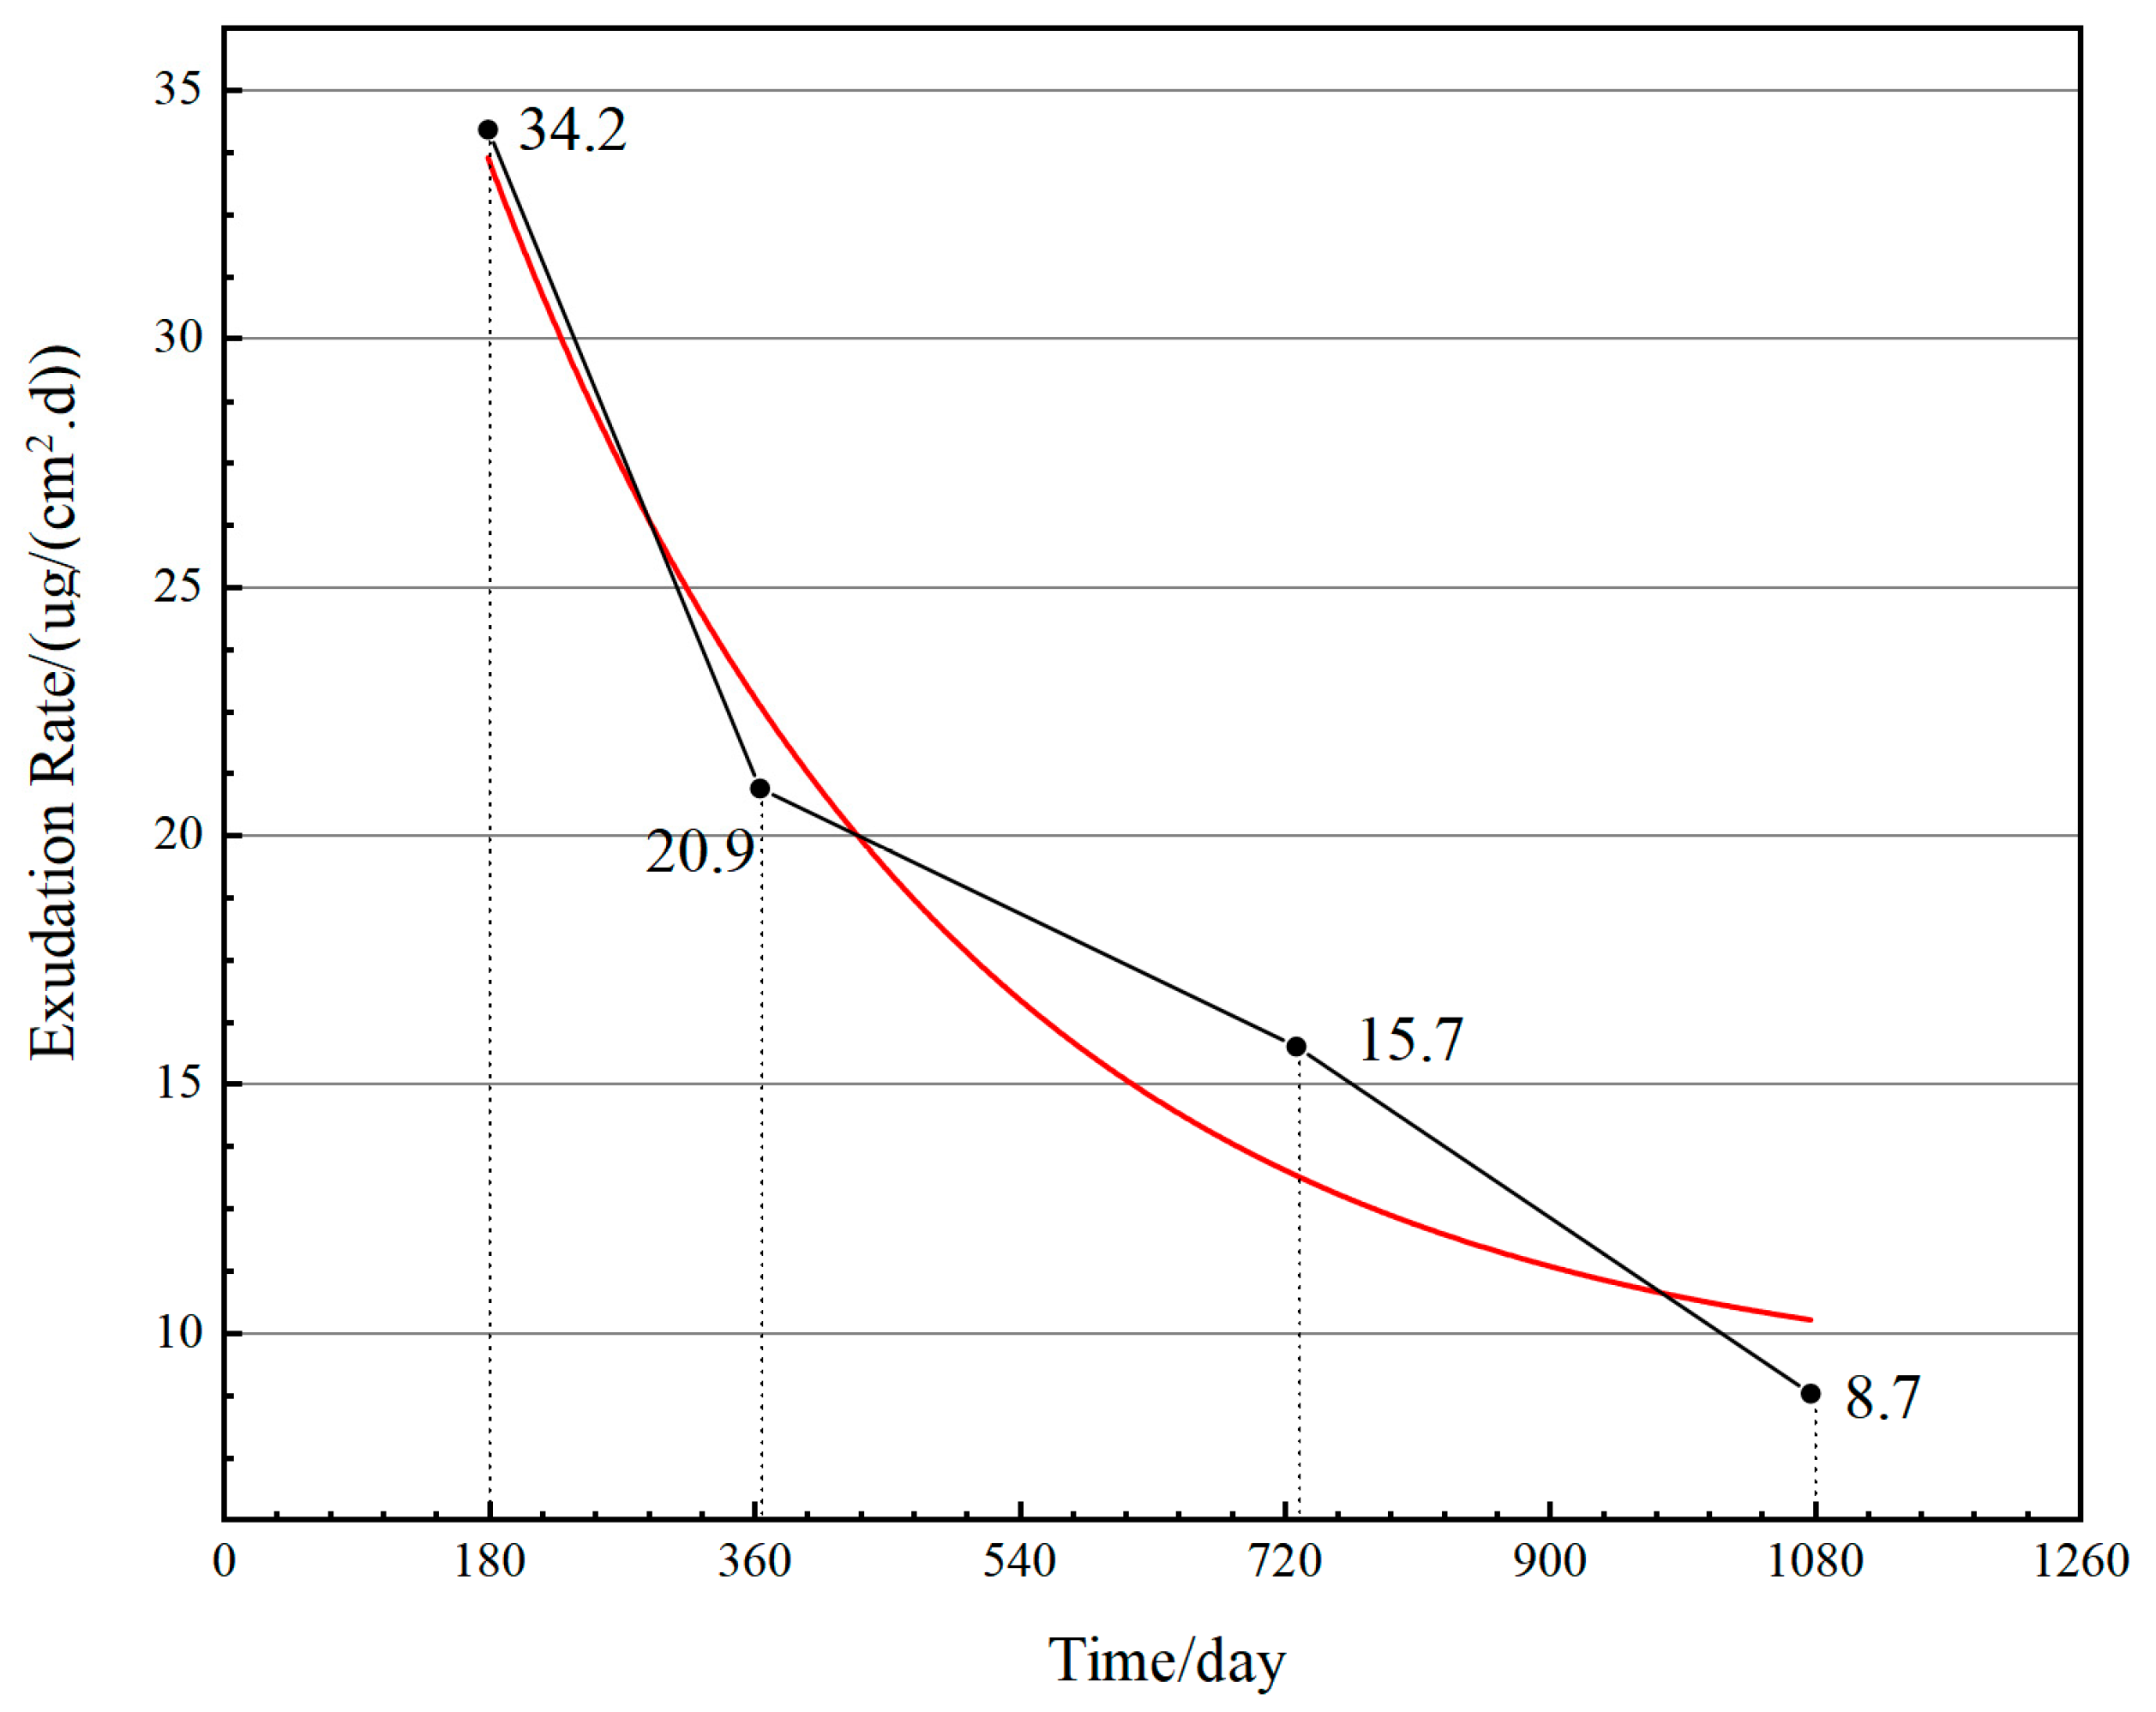
4.2.1. Exudation Rate
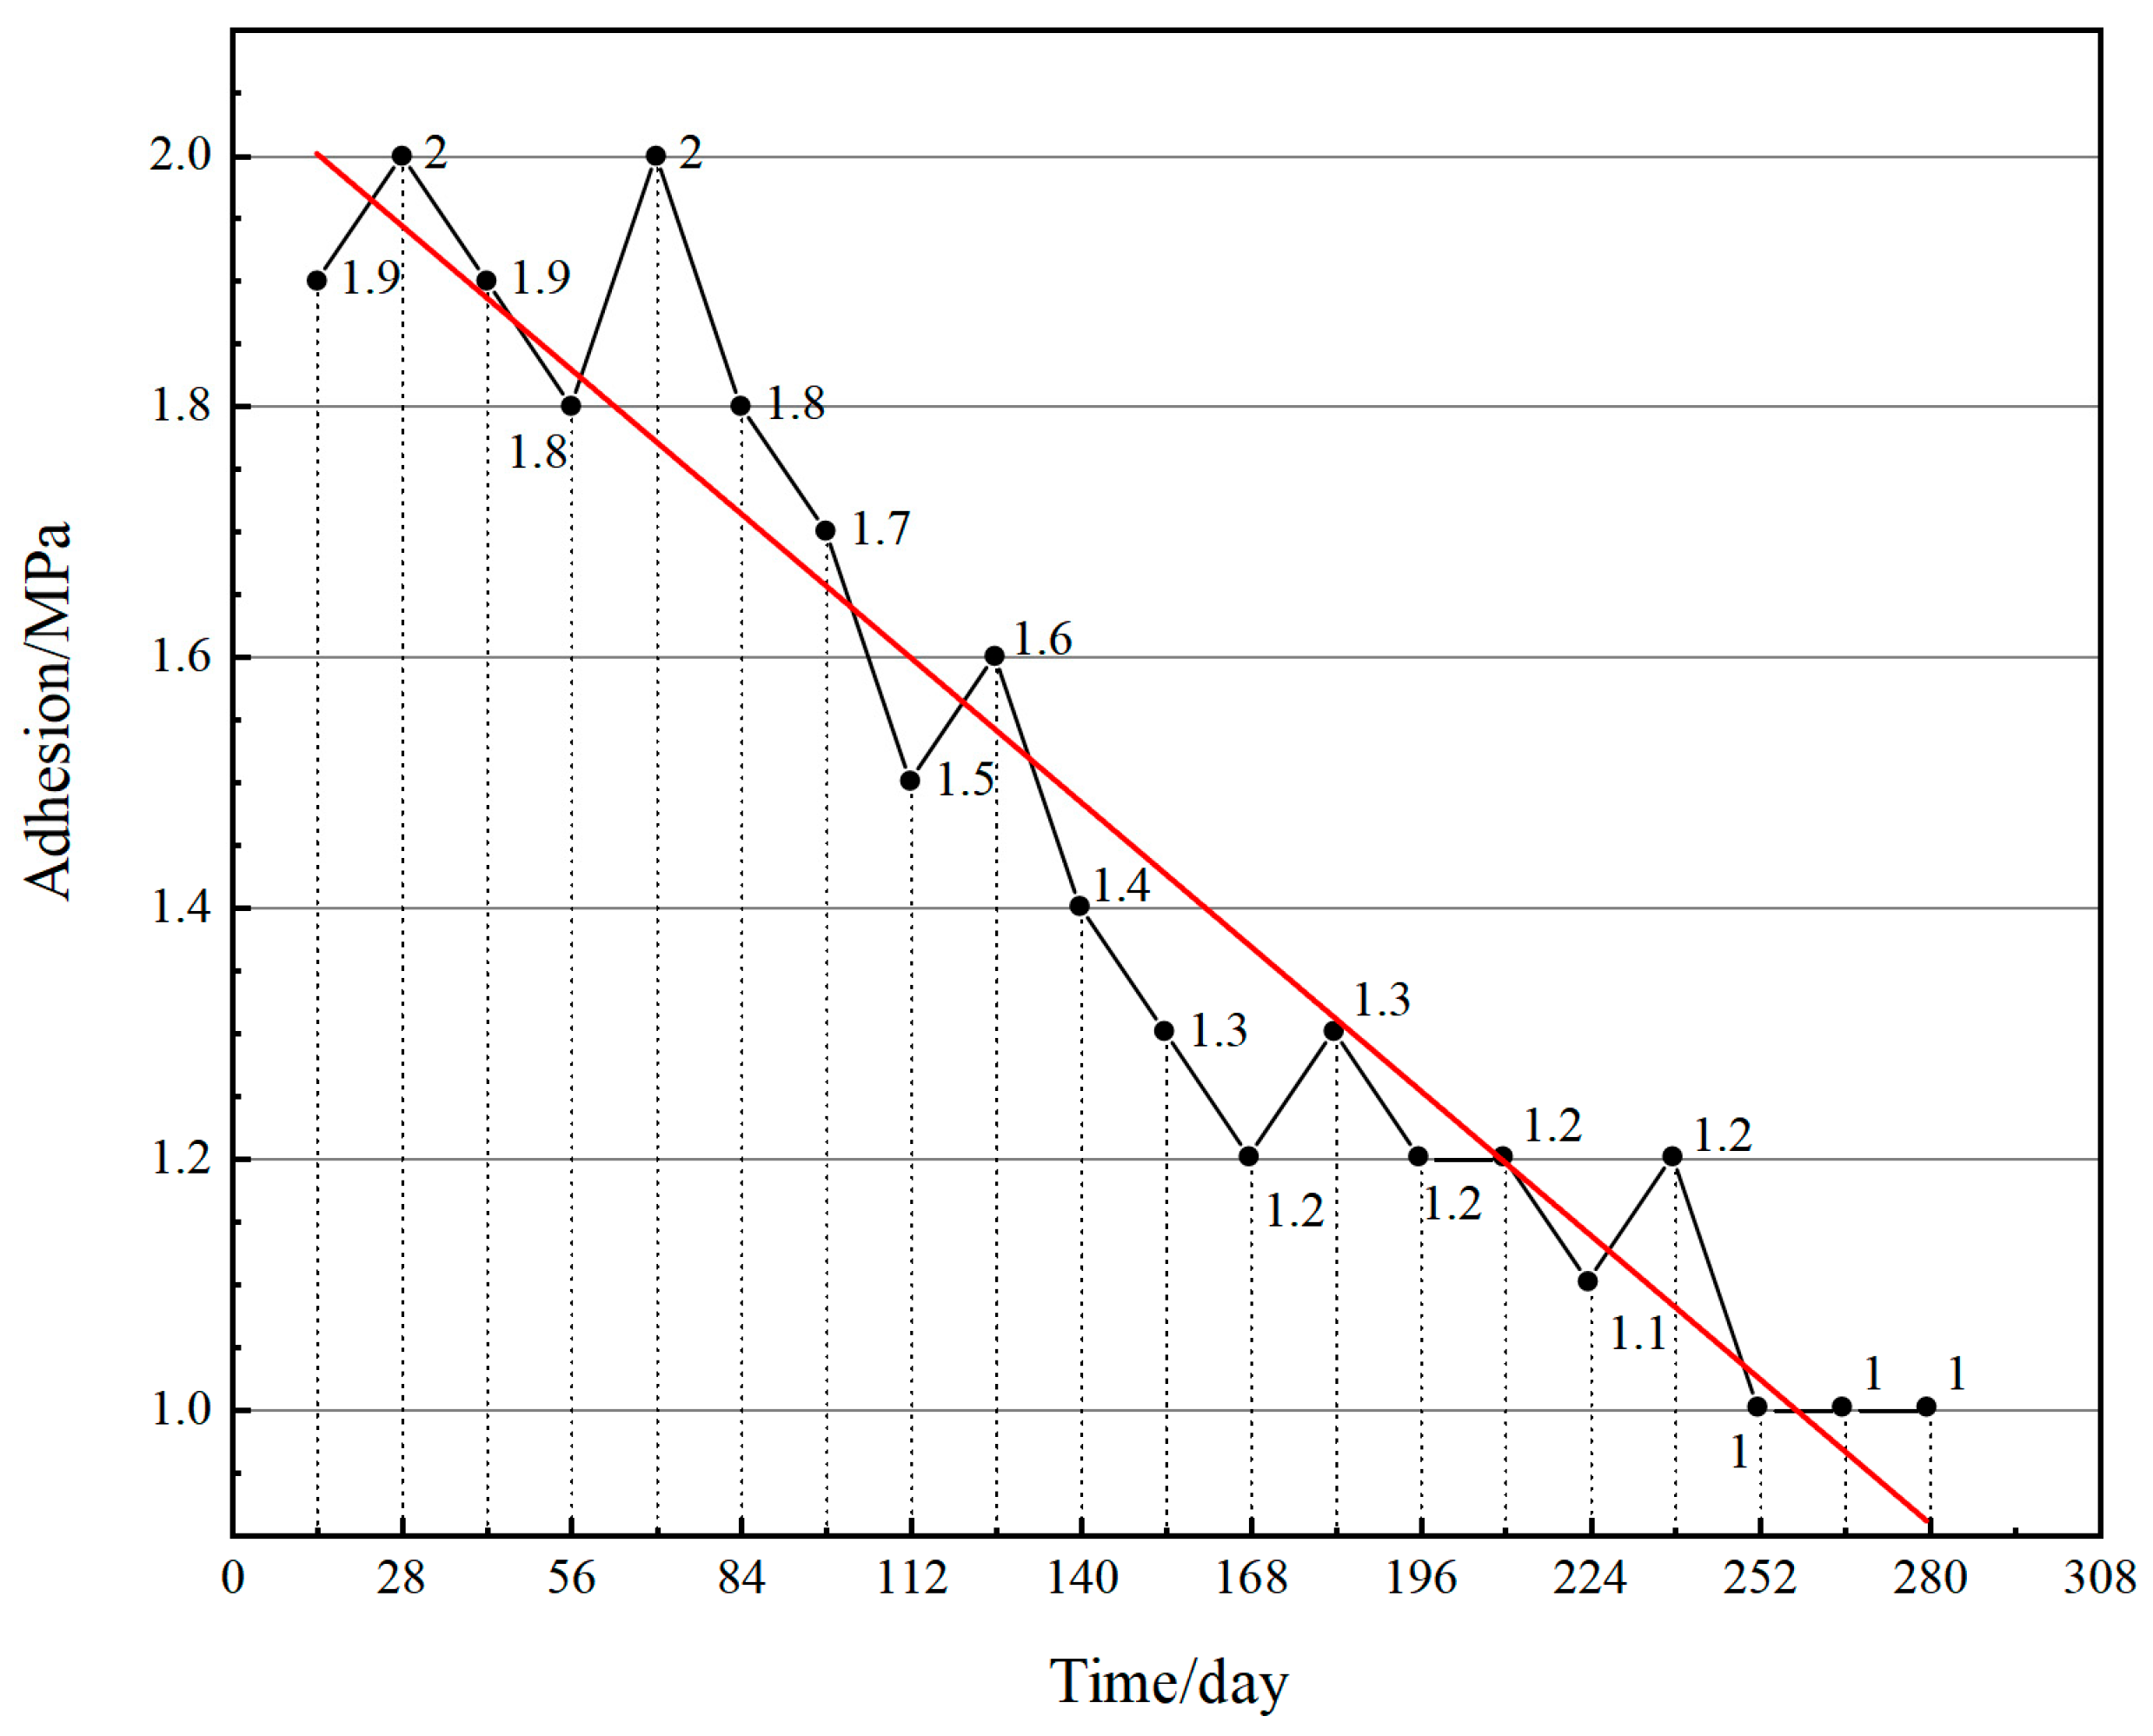
4.2.2. Adhesion
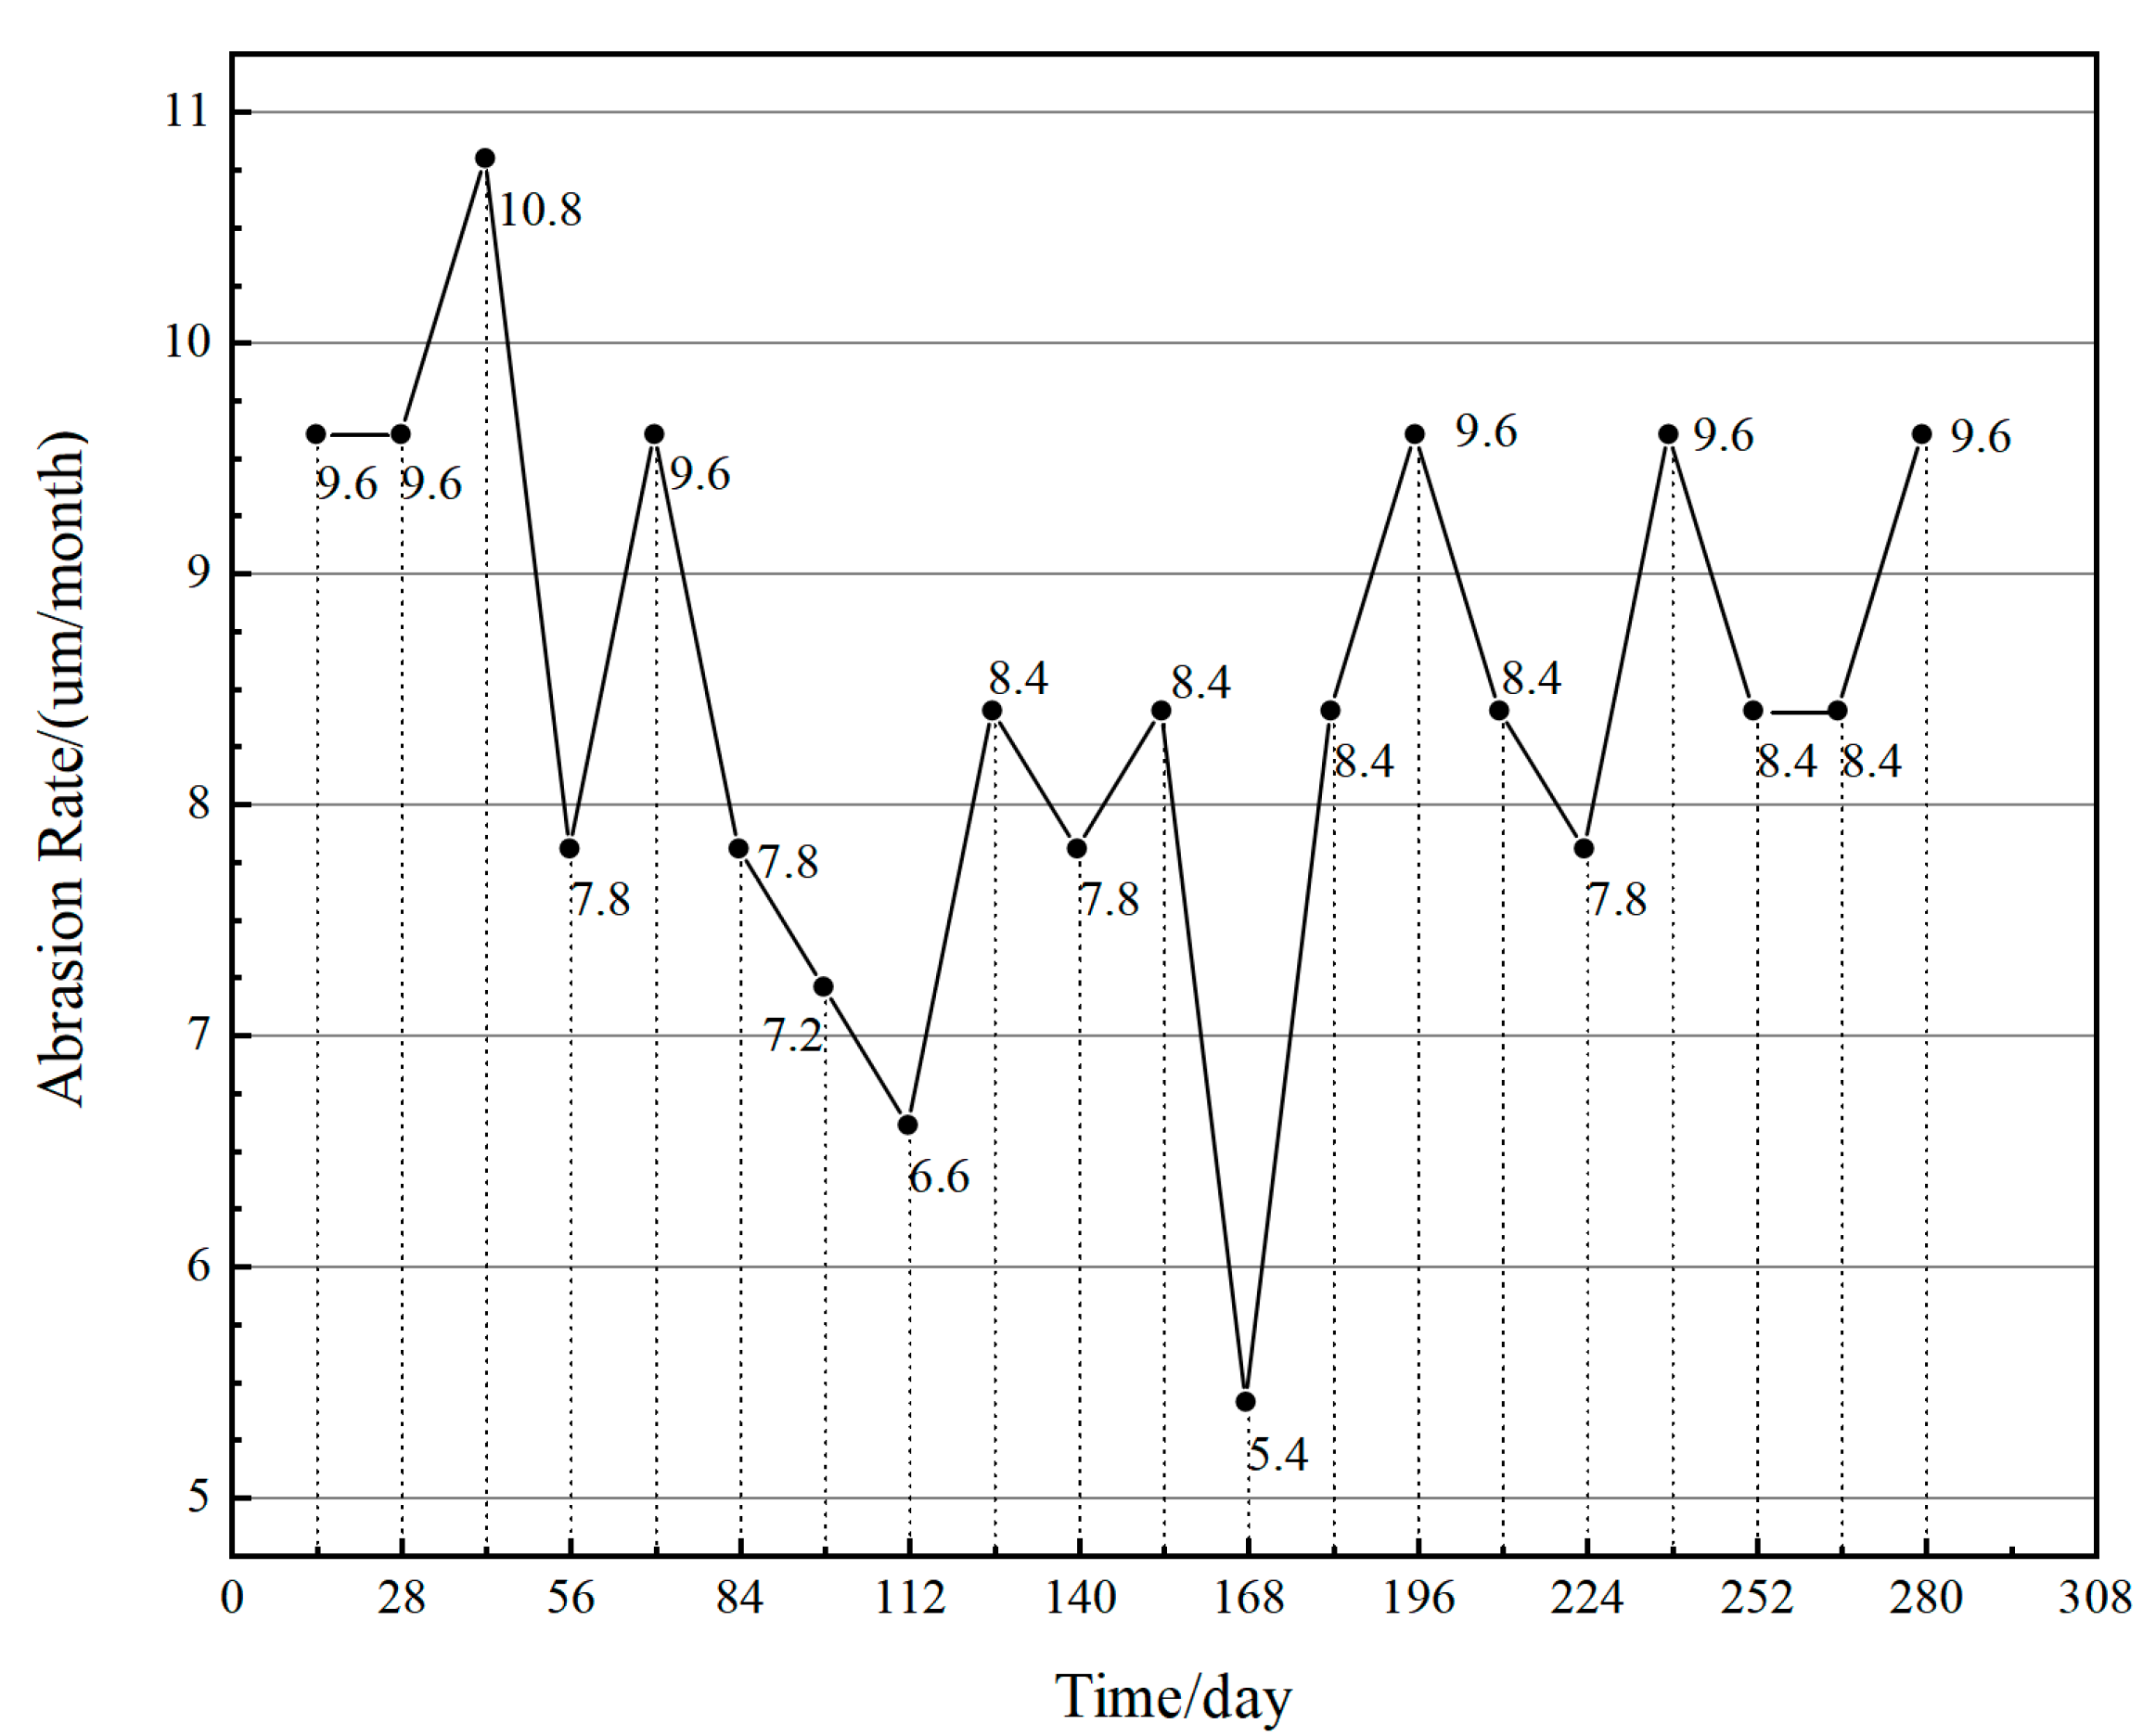
4.2.3. Abrasion Rate
5. Evaluation Validation
5.1. Correlation Verification
5.1.1. Verification Method
5.1.2. Analysis of Results
5.2. Accelerated Multiplier
5.2.1. Verification Method
5.2.2. Analysis of Results
6. Conclusions
- The LSM was successfully applied to the linear and exponential modeling of the test data, and degradation models were obtained for parameters such as the exudation rate and adhesion, through which the main failure factors and failure times of the antifouling coatings under different test environments were deduced.
- The exudation rate is the main failure factor in both MFAT and RST, which shows a rapid decline and then tends to stabilize, and the failure mechanism is consistent.
- The SRCCM and AFM were successfully applied to obtain the correlation coefficient and acceleration multiplier, confirming that the MFAT of copper-free, self-polished antifouling coatings has a good correlation and acceleration effect relative to the RST, which indicates that this MFAT is accurate and fast.
Author Contributions
Funding
Institutional Review Board Statement
Informed Consent Statement
Data Availability Statement
Conflicts of Interest
References
- Pan, J.L.; Liang, H.Y.; Zhang, E.W.; Xi, X.Y. Research Progress on Mechanical Properties of Steel Under the Marine Corrosion Environment. Corros. Res. 2022, 08, 125–128. [Google Scholar]
- Mao, H.B.; Wu, Y.T.; Yin, J.P.; Lian, S.M. Development Status and prospect of marine environmental security technology. Bull. Chin. Acad. Sci. 2022, 7, 870–880. [Google Scholar] [CrossRef]
- Faÿ, F.; Champion, M.; Guennec, A.; Moppert, X.; Simon-Colin, C.; Elie, M. Biobased Anti-Adhesive Marine Coatings from Polyhydroxyalkanoates and Polysaccharides. Coatings 2023, 13, 766. [Google Scholar] [CrossRef]
- Wu, B.; Lu, X.; Wang, Y.X.; Li, J.L.; Ye, Y.W.; Zhao, W.J. Tribological Behavior of TiN and TiSiN Coatings in Seawater. Surf. Technol. 2017, 11, 143–148. [Google Scholar] [CrossRef]
- Fang, Y.H.; Zhou, K.H.; Cai, H.; Sun, L.S.; Liu, Z.W.; Wang, C.T.; Zheng, W.R.; Pu, J.B.; Liu, Q.; Li, Z. Effect of polarization potential on properties of copper-based antifouling coating. Electropating Finish. 2018, 2, 76–81. [Google Scholar]
- Gevaux, L.; Lejars, M.; Margaillan, A.; Briand, J.-F.; Bunet, R.; Bressy, C. Hydrolyzable Additive-Based Silicone Elastomers: A New Approach for Antifouling Coatings. Polymers 2019, 11, 305. [Google Scholar] [CrossRef] [PubMed]
- Deng, L.; Lin, C.G.; Zhang, J.W.; Ma, L.; Su, Y.; Cheng, X.D.; Shao, G.Q.; Wang, L. Service Life Model and Indoor Accelerated Evaluation Method of Fouling-release Coatings. Surf. Technol. 2022, 5, 293–303. [Google Scholar] [CrossRef]
- Xu, B.; Liu, Q.; Qian, J.C.; Bai, Y.H.; Li, J.Y.; Fang, M. Protective Performance of Fluoropolyurethane Coating System in Simulated Marine Environment. Surf. Technol. 2022, 9, 243–250. [Google Scholar] [CrossRef]
- Li, Q.; Li, J.Y.; Sun, M.J.; Hu, T.; Wang, L. Performance Degradation of Three Coatings in Simulated Tropical Marine Atmospheric Environment. Environ. Test 2023, 3, 11–16. [Google Scholar]
- Song, C.X. Preparation and Properties of Silicone Marine Antifouling Coatings. Master’s Thesis, Qingdao University of Science & Technology, Qingdao, China, 18 May 2022. [Google Scholar]
- Liu, H.B.; Zhang, L.W.; Chen, W.J.; Chen, Y.M.; Shen, G.X.; Tang, C.Y.; Shao, D.X.; Zheng, D.M. Research Progress of Antifouling Coatings for Ships. Shandong Chem. Ind. 2023, 52, 240–242. [Google Scholar]
- Niu, Y.F. Study on Freshwater Immersion Resistance of Ship Antifouling Coatings. China Coat. 2022, 12, 34–38. [Google Scholar]
- Mo, Y.Q. Preparation and Properties Study of Bionic Low Surface Energy Antifouling Coatings. Master’s Thesis, Dalian Maritime University, Dalian, China, 7 June 2022. [Google Scholar]
- Guazzelli, E.; Oliva, M.; Pretti, C.; Monni, G.; Fahs, A.; Bressy, C.; Martinelli, E. Polyethylene Glycol-b-poly(trialkylsilyl methacrylate-co-methyl methacrylate) Hydrolyzable Block Copolymers for Eco-Friendly Self-Polishing Marine Coatings. Polymers 2022, 14, 4589. [Google Scholar] [CrossRef] [PubMed]
- Wang, C.J.; Liu, S.P.; Wang, Z.H.; Luo, H.X. New Development of the Research and Applications of Antifouling Coatings. Mater. Rep. 2022, 23, 21020004. [Google Scholar] [CrossRef]
- Deng, B.F.; Xie, Z.P.; Wang, J.J.; Tang, L.R. Research on Matching and Antifouling Performance of Zinc Acrylate Self-polishing Antifouling Paint. Dev. Appl. Mater. 2017, 2, 12–17. [Google Scholar]
- Tao, L.; Yin, Z.P. Progress of Self-Polishing Antifouling Technology in Field of Marine Antifouling Coating. Coat. Prot. 2022, 04, 55–62. [Google Scholar]
- Ding, R.; Jiang, J.M.; Gui, T.J.; Li, X.B. The Cu Leaching Rate of Cold Spray Copper Composite Coatings in Multivariate Marine Environment and Prediction System Based on BP Artificial Neural Network. Exp. Res. Appl. 2016, 6, 5–9. [Google Scholar]
- An, J.L.; Wan, M.; Tang, S.; Huo, X.J. Study of Anti-Corrosion Performance and Adhesion of Tung Oil/Lanolin Microcapsule Coating. Mater. Prot. 2023, 5, 139–147. [Google Scholar]
- Zhao, Y.Y.; Lu, W.Z.; Wu, B.J.; Sun, Y.L.; Zuo, D.W. Effects of Erosion Angle on CFRP Skin Coating Removal and Adhesion of Recoating. China Surf. Eng. 2023, 1, 116–123. [Google Scholar]
- Shi, X.; Han, Q.; Chen, T.T.; Wang, W.M. Analysis of Factors Affecting Adhesion of Waterborne Paint for Casting. Technol. Exp. Communion 2023, 1, 31–36. [Google Scholar]
- Xu, C.S.; Yao, J.H. Discussion of Polishing Rate Test for Self-Polishing Antifouling Coatings. Paint. Coat. Ind. 2016, 2, 70–74. [Google Scholar]
- Xu, H. Discussion on Classification for Environmental Testing. Trainer 2014, 4, 65–68. [Google Scholar]
- Deng, B.F.; Zhang, C.Y.; Huang, C.S.; Xie, Z.P.; Wang, J.J.; Hu, M.Y. Preparation and Performance Studies of Zinc Acrylateself-Polishing Copper-Free Antifouling Coatings. Paint. Coat. Ind. 2020, 12, 32–36. [Google Scholar]
- Jin, Q.J.; Liang, T.; Lv, L.F.; Zhang, H.J.; Wang, Y. Study of the Evaluation of Anti-Corrosion Performance of Galvanized Materials by Different Corrosion Test Methods. Mater. Prot. 2023, 2, 51–56. [Google Scholar]
- Gong, H.; Xu, C.Q.; Yao, J.h. Correlation Analysis for Copper Release Rate Test Results of Antifouling Paint in Indoor Simulated and Real Seawater Environment. Dev. Appl. Mater. 2022, 12, 114–118. [Google Scholar]
- Wieberger, F.; Kolb, T.; Neuber, C.; Ober, C.K.; Schmidt, H.-W. Combinatorial Techniques to Efficiently Investigate and Optimize Organic Thin Film Processing and Properties. Molecules 2013, 18, 4120–4139. [Google Scholar] [CrossRef] [PubMed]
- Carcione, F.; Defeo, G.A.; Galli, I.; Bartalini, S.; Mazzotti, D. Material Circularity: A Novel Method for Biobased Carbon Quantification of Leather, Artificial Leather, and Trendy Alternatives. Coatings 2023, 13, 892. [Google Scholar] [CrossRef]
- Zhang, H.; Zhang, X.; Zhao, X.; Tang, Y.; Zuo, Y. Preparation of Ti–Zr-Based Conversion Coating on 5052 Aluminum Alloy, and Its Corrosion Resistance and Antifouling Performance. Coatings 2018, 8, 397. [Google Scholar] [CrossRef]
- Liu, Y.L.; Wang, S.L.; Li, C.G.; Fang, D.Q.; Wu, J.H. Preparation and Performance of Environment-friendly Copper-free Self-polishing Antifouling Paints. Surf. Technol. 2017, 12, 1–5. [Google Scholar]
- Xiang, J.T.; Yang, X.K.; Yang, X.R. Application of Comprehensive Accelerated Test Technology in Rapid Evaluation of Polyurethane Coating in Low Pressure Environment. Equip. Environ. Eng. 2021, 12, 128–133. [Google Scholar] [CrossRef]
- Wang, H.J.; Cui, G.Y.; Fan, H.H.; Feng, W.H. Application of Least Square Method in Circuit Experiment. J. Electr. Electron. Educ. 2022, 6, 152–155. [Google Scholar]
- Li, Z.P. Design of Voltage Detection Algorithm Based on Least Square Method. Parts Des. 2022, 11, 22–25. [Google Scholar]
- Zhao, Y.X.; Liu, S.C.; Yan, W.; Zhu, Z.B.; Ju, M. Study on Modeling of Silicon Carbide MOSFET Based on Levenberg-Marquardt Algorithm. J. Nanjing Norm. Univ. Eng. Technol. Ed. 2022, 3, 30–37. [Google Scholar]
- Xiao, S.R.; Hu, Q.C.; Li, N.N.; Chen, X.B. Research on multi-sensor calibration method of UAV based on Levenberg-Marquardt algorithm. Mach. Tool Hydraul. 2022, 10, 12–18. [Google Scholar]
- Wang, J.F.; Li, X.; Yin, Z.L.; Yang, X.R. Application of Multi-factor Integrated Simulation of Marine Climate and Acceleration Test Technologies in Screening of Fastener Surface Treatment Technologies. Surface Technol. 2016, 2, 175–180. [Google Scholar]
- Jia, K.; Yang, Z.; Wei, C.; Zheng, L.M.; Li, Y.B.; Bi, T.S. Pilot Protection Based on Spearman Rank Correlation Coefficient for Transmission Line Connected to Renewable Energy Source. China Surf. Eng. 2020, 15, 103–111. [Google Scholar]
- Peng, J.C.; Guo, Z.H.; Yang, X.R. Relativity and Acceleration Verification of Multi-factors Integrated Marine Climate Natural Accelerated Test Technologies. Equip. Environ. Eng. 2016, 5, 98–104. [Google Scholar]
- Chen, Z.C.; Li, H.S.; Zhang, P.S.; Zhou, Y.R. Highly Accelerated Ground Simulation Technology of Space Ultraviolet Radiation. Equip. Environ. Eng. 2021, 2, 57–61. [Google Scholar]

| Serial Number | Chemical Composition | Percentage (%) |
|---|---|---|
| 1 | Zinc acrylate resin | 15~20 |
| 2 | Plasticizers | 2~4 |
| 3 | Organic antifouling agent | 20~40 |
| 4 | Auxiliary antifouling agent | 20~40 |
| 5 | Pigments | 1~2 |
| 6 | Thixotropic agents | 1~2 |
| 7 | Xylene | 10~15 |
| Exudation Rate Li (μg/(cm2·d)) | RST Time Tsi (day) | RST Time Order xi | MFAT Model Test Time TJi (day) | MFAT Model Test Time Order yi | Rank Difference di |
|---|---|---|---|---|---|
| 34.2 | 182 | 1 | 185 | 1 | 0 |
| 20.9 | 365 | 2 | 222 | 2 | 0 |
| 15.7 | 547 | 3 | 240 | 3 | 0 |
| 8.7 | 1080 | 4 | 276 | 4 | 0 |
Disclaimer/Publisher’s Note: The statements, opinions and data contained in all publications are solely those of the individual author(s) and contributor(s) and not of MDPI and/or the editor(s). MDPI and/or the editor(s) disclaim responsibility for any injury to people or property resulting from any ideas, methods, instructions or products referred to in the content. |
© 2023 by the authors. Licensee MDPI, Basel, Switzerland. This article is an open access article distributed under the terms and conditions of the Creative Commons Attribution (CC BY) license (https://creativecommons.org/licenses/by/4.0/).
Share and Cite
Chang, M.; Jia, J.; Huang, C.; Zhang, S.; Tang, L.; Jiang, L.; Ma, H.; Lang, H.; Wang, Q.; Yan, J. An Effectiveness Analysis for the Multi-Factor Accelerated Test of a Copper-Free Self-Polishing Antifouling Coating. Coatings 2023, 13, 1685. https://doi.org/10.3390/coatings13101685
Chang M, Jia J, Huang C, Zhang S, Tang L, Jiang L, Ma H, Lang H, Wang Q, Yan J. An Effectiveness Analysis for the Multi-Factor Accelerated Test of a Copper-Free Self-Polishing Antifouling Coating. Coatings. 2023; 13(10):1685. https://doi.org/10.3390/coatings13101685
Chicago/Turabian StyleChang, Meng, Junwei Jia, Congshu Huang, Shaonan Zhang, Lirong Tang, Lingling Jiang, Haoyuan Ma, Hao Lang, Qingqing Wang, and Jiashuo Yan. 2023. "An Effectiveness Analysis for the Multi-Factor Accelerated Test of a Copper-Free Self-Polishing Antifouling Coating" Coatings 13, no. 10: 1685. https://doi.org/10.3390/coatings13101685
APA StyleChang, M., Jia, J., Huang, C., Zhang, S., Tang, L., Jiang, L., Ma, H., Lang, H., Wang, Q., & Yan, J. (2023). An Effectiveness Analysis for the Multi-Factor Accelerated Test of a Copper-Free Self-Polishing Antifouling Coating. Coatings, 13(10), 1685. https://doi.org/10.3390/coatings13101685