
High-Aligned PVDF Nanofibers with a High Electroactive Phase Prepared by Systematically Optimizing the Solution Property and Process Parameters of Electrospinning

 ,
,  and
and 
Abstract
:1. Introduction
2. Materials and Methods
2.1. Materials
2.2. PVDF Nanofibers Electrospinning
2.2.1. Preparation of PVDF Solutions
2.2.2. Production of PVDF Nanofibers
2.3. Analytical Methods
2.3.1. Solutions Viscosity
2.3.2. Morphological Characterization of the Nanofibers
2.3.3. Identification and Quantification of the Electroactive β and γ-Phases of the Poly(vinylidene fluoride) Nanofibers
- Differential scanning calorimetry
- Fourier transform infrared spectroscopy
2.3.4. Piezoelectric Properties of the Poly(vinylidene fluoride) Nanofibers
2.3.5. Orientation of PVDF Nanofibers
- Anisotropy index
- Goodness
3. Results and Discussion
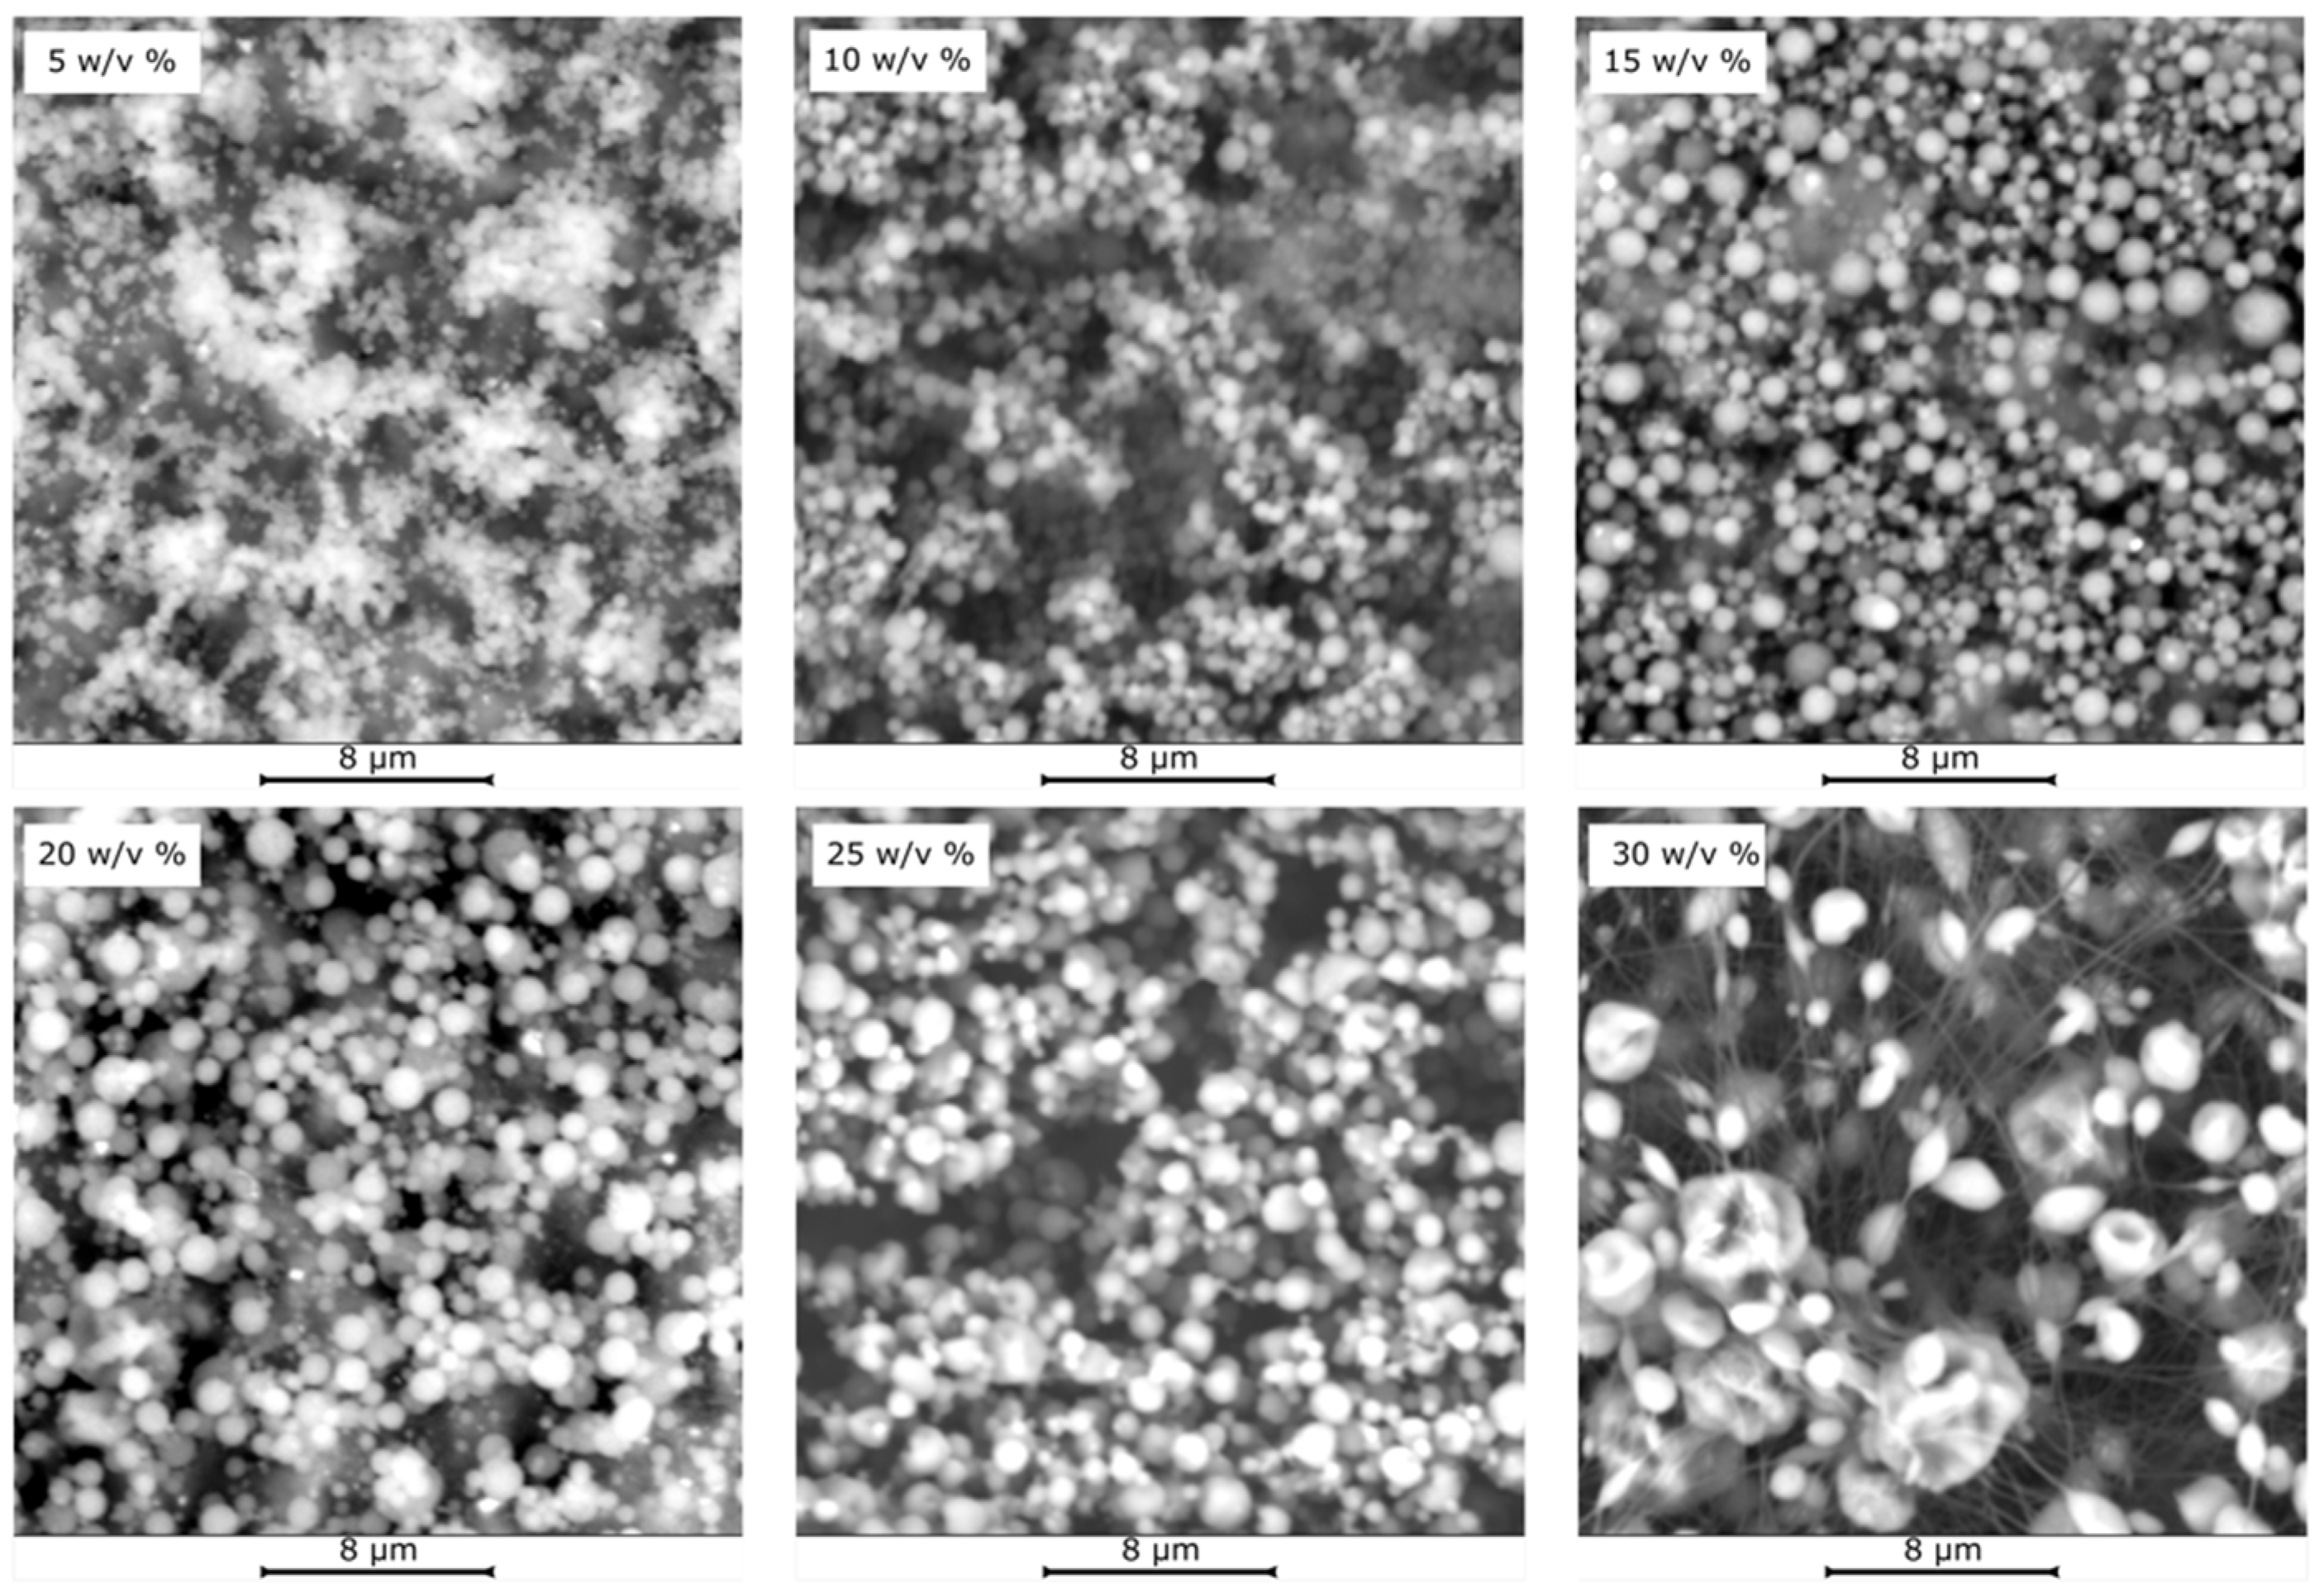
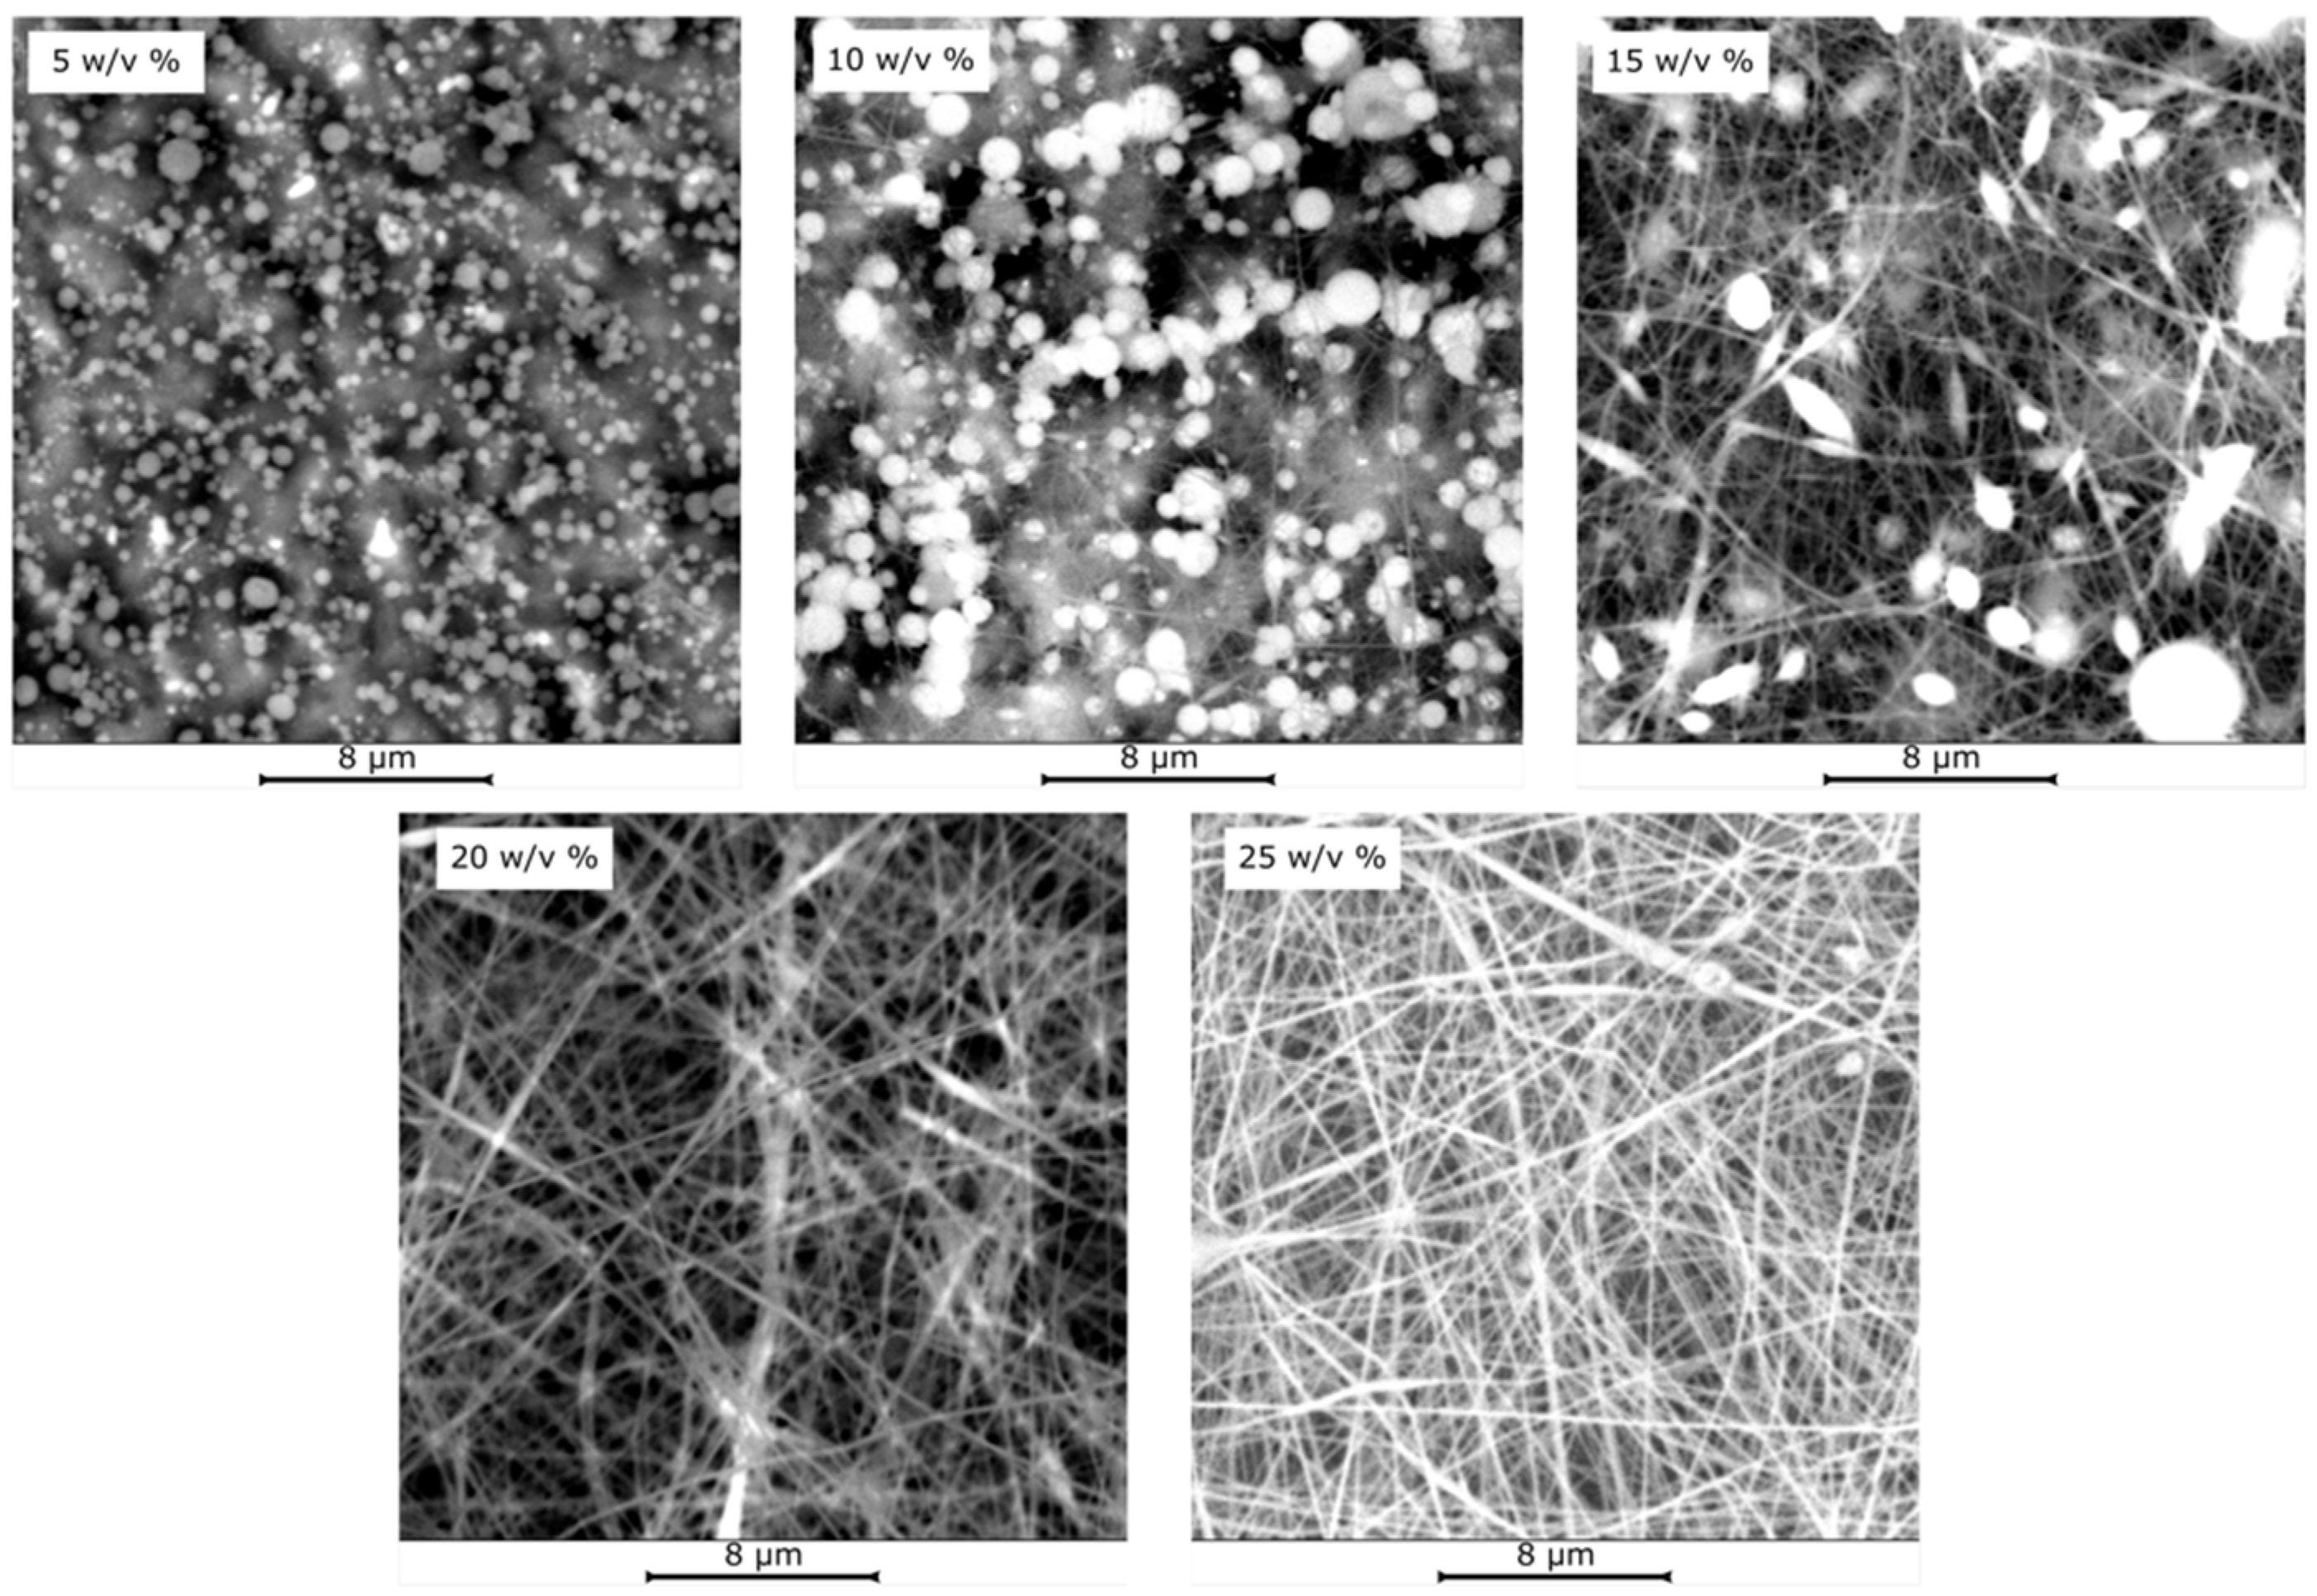
3.1. Influence of the Formulation Parameters on the Morphology of the PVDF Electropsun Mat
3.2. Factors Affecting the Electroactive Phase of PVDF Nanofibers
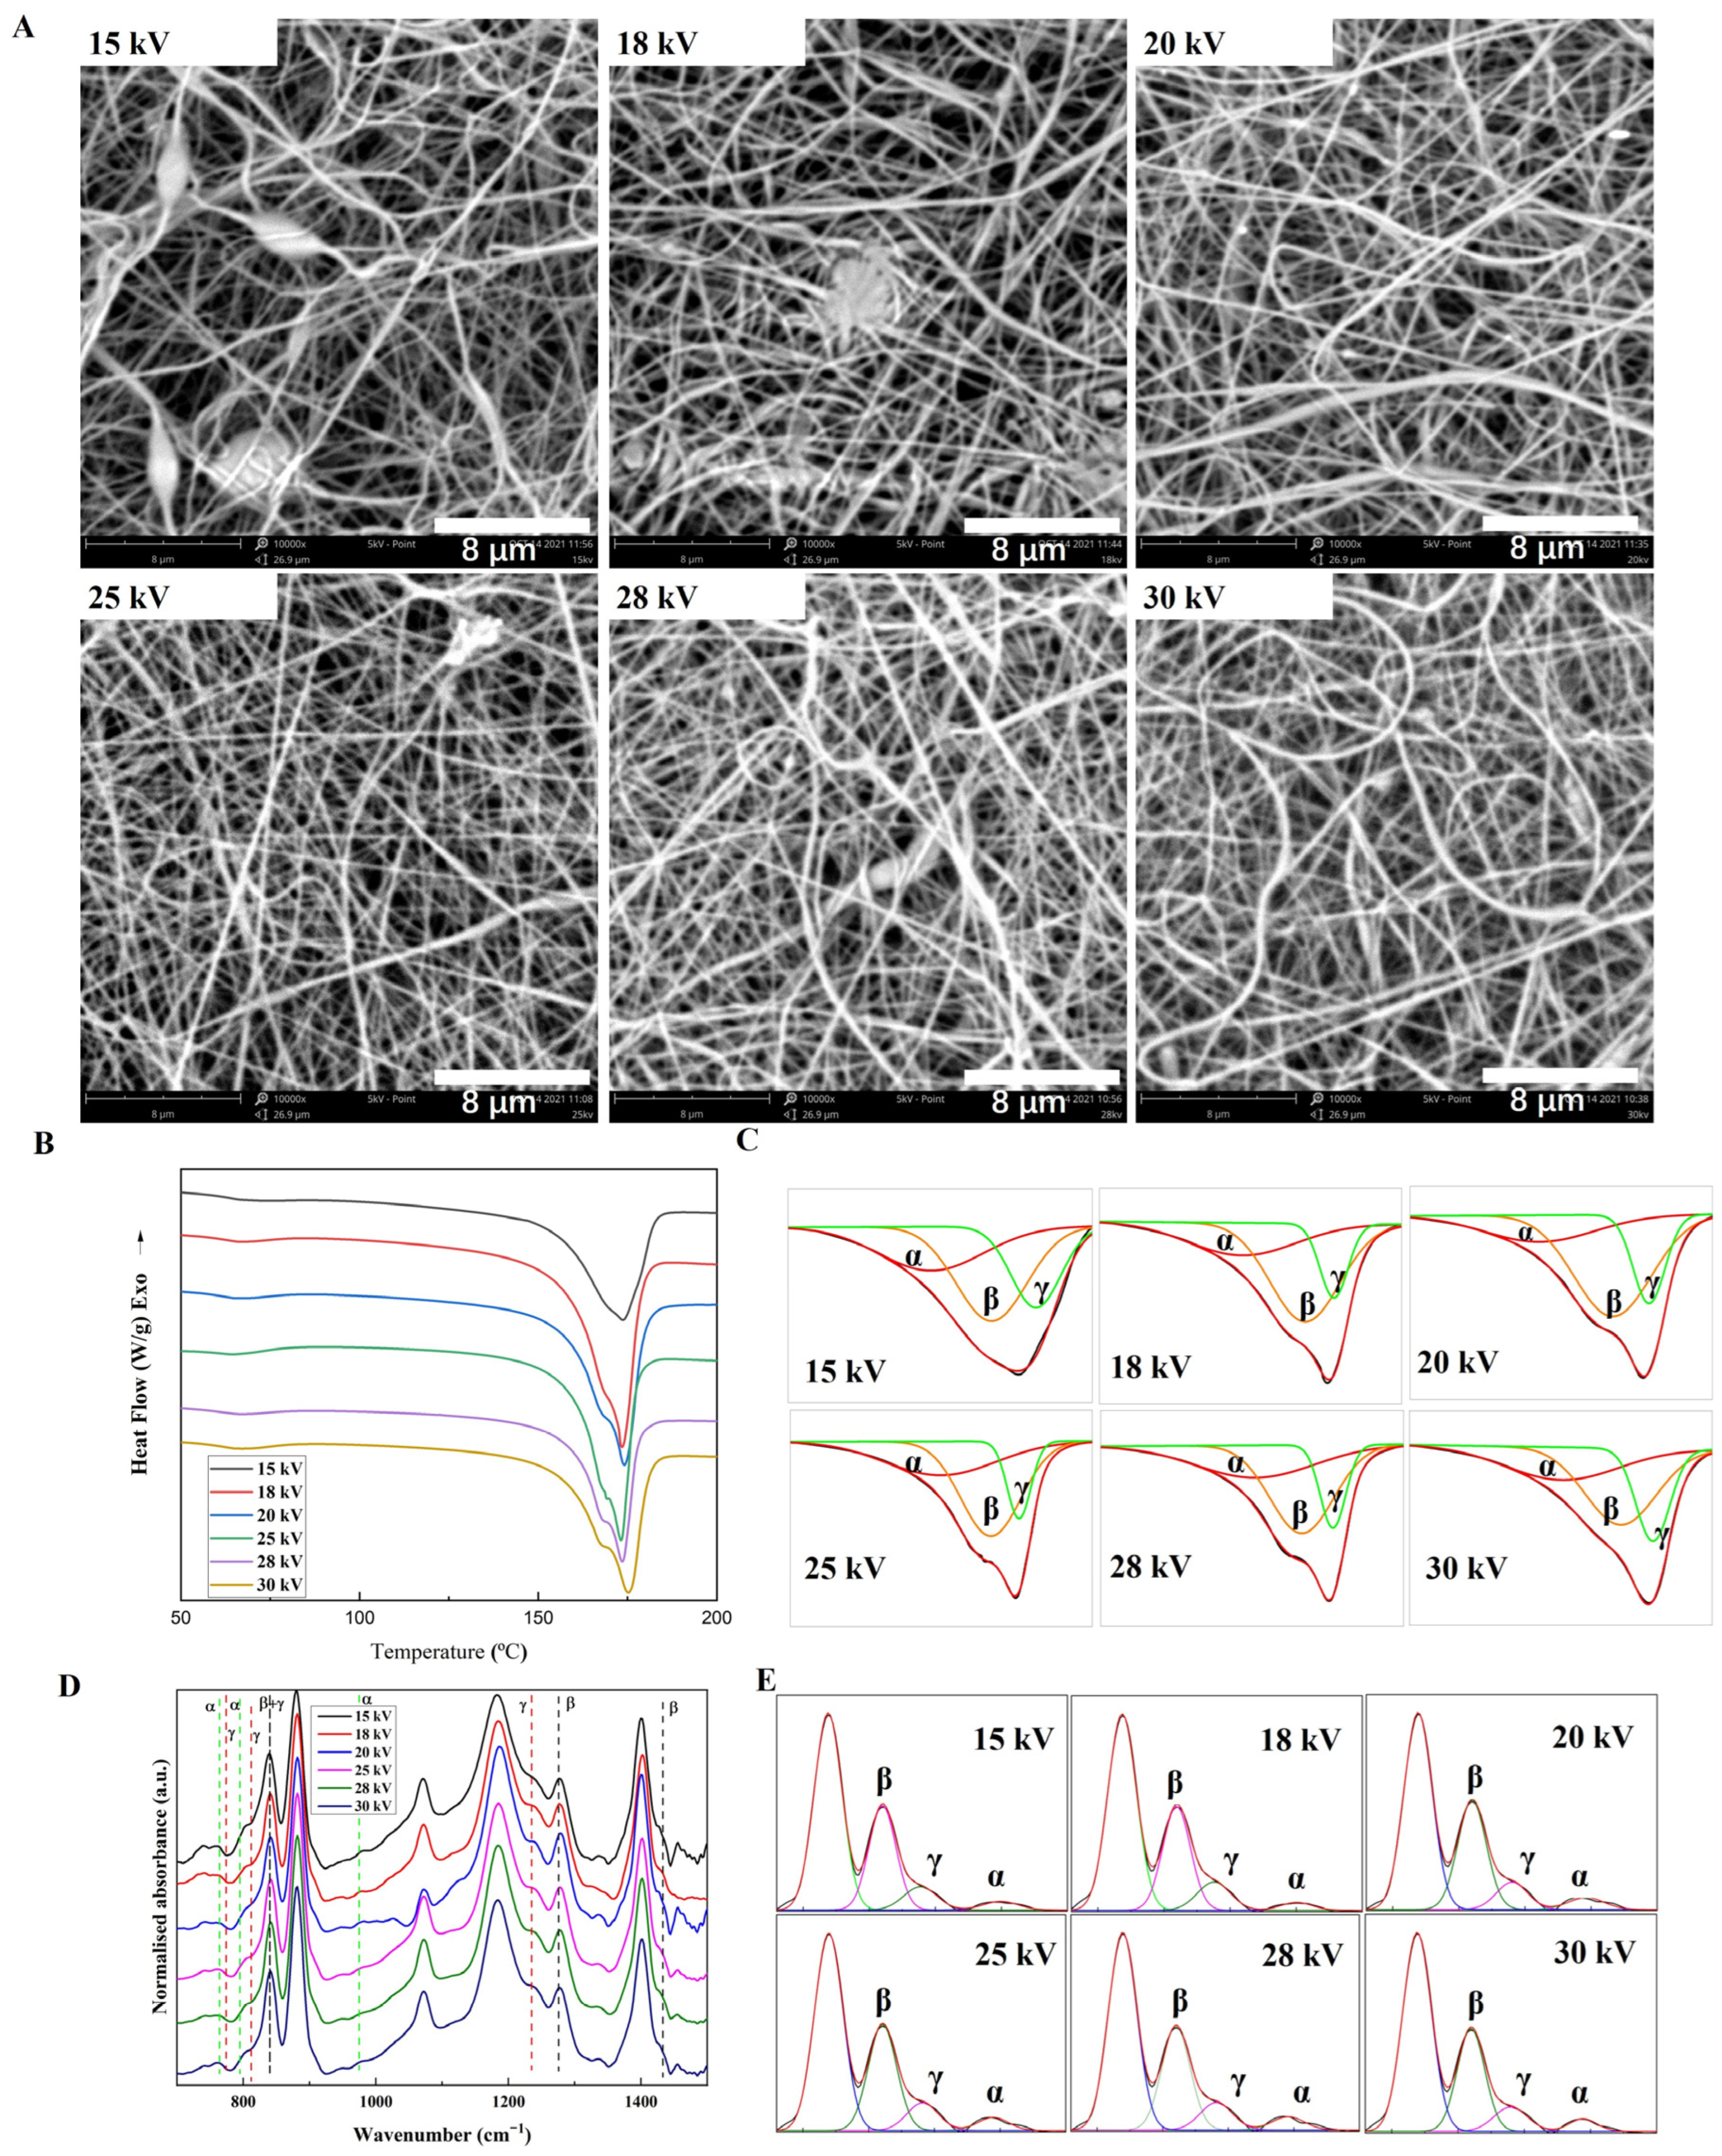
3.2.1. Applied Voltage
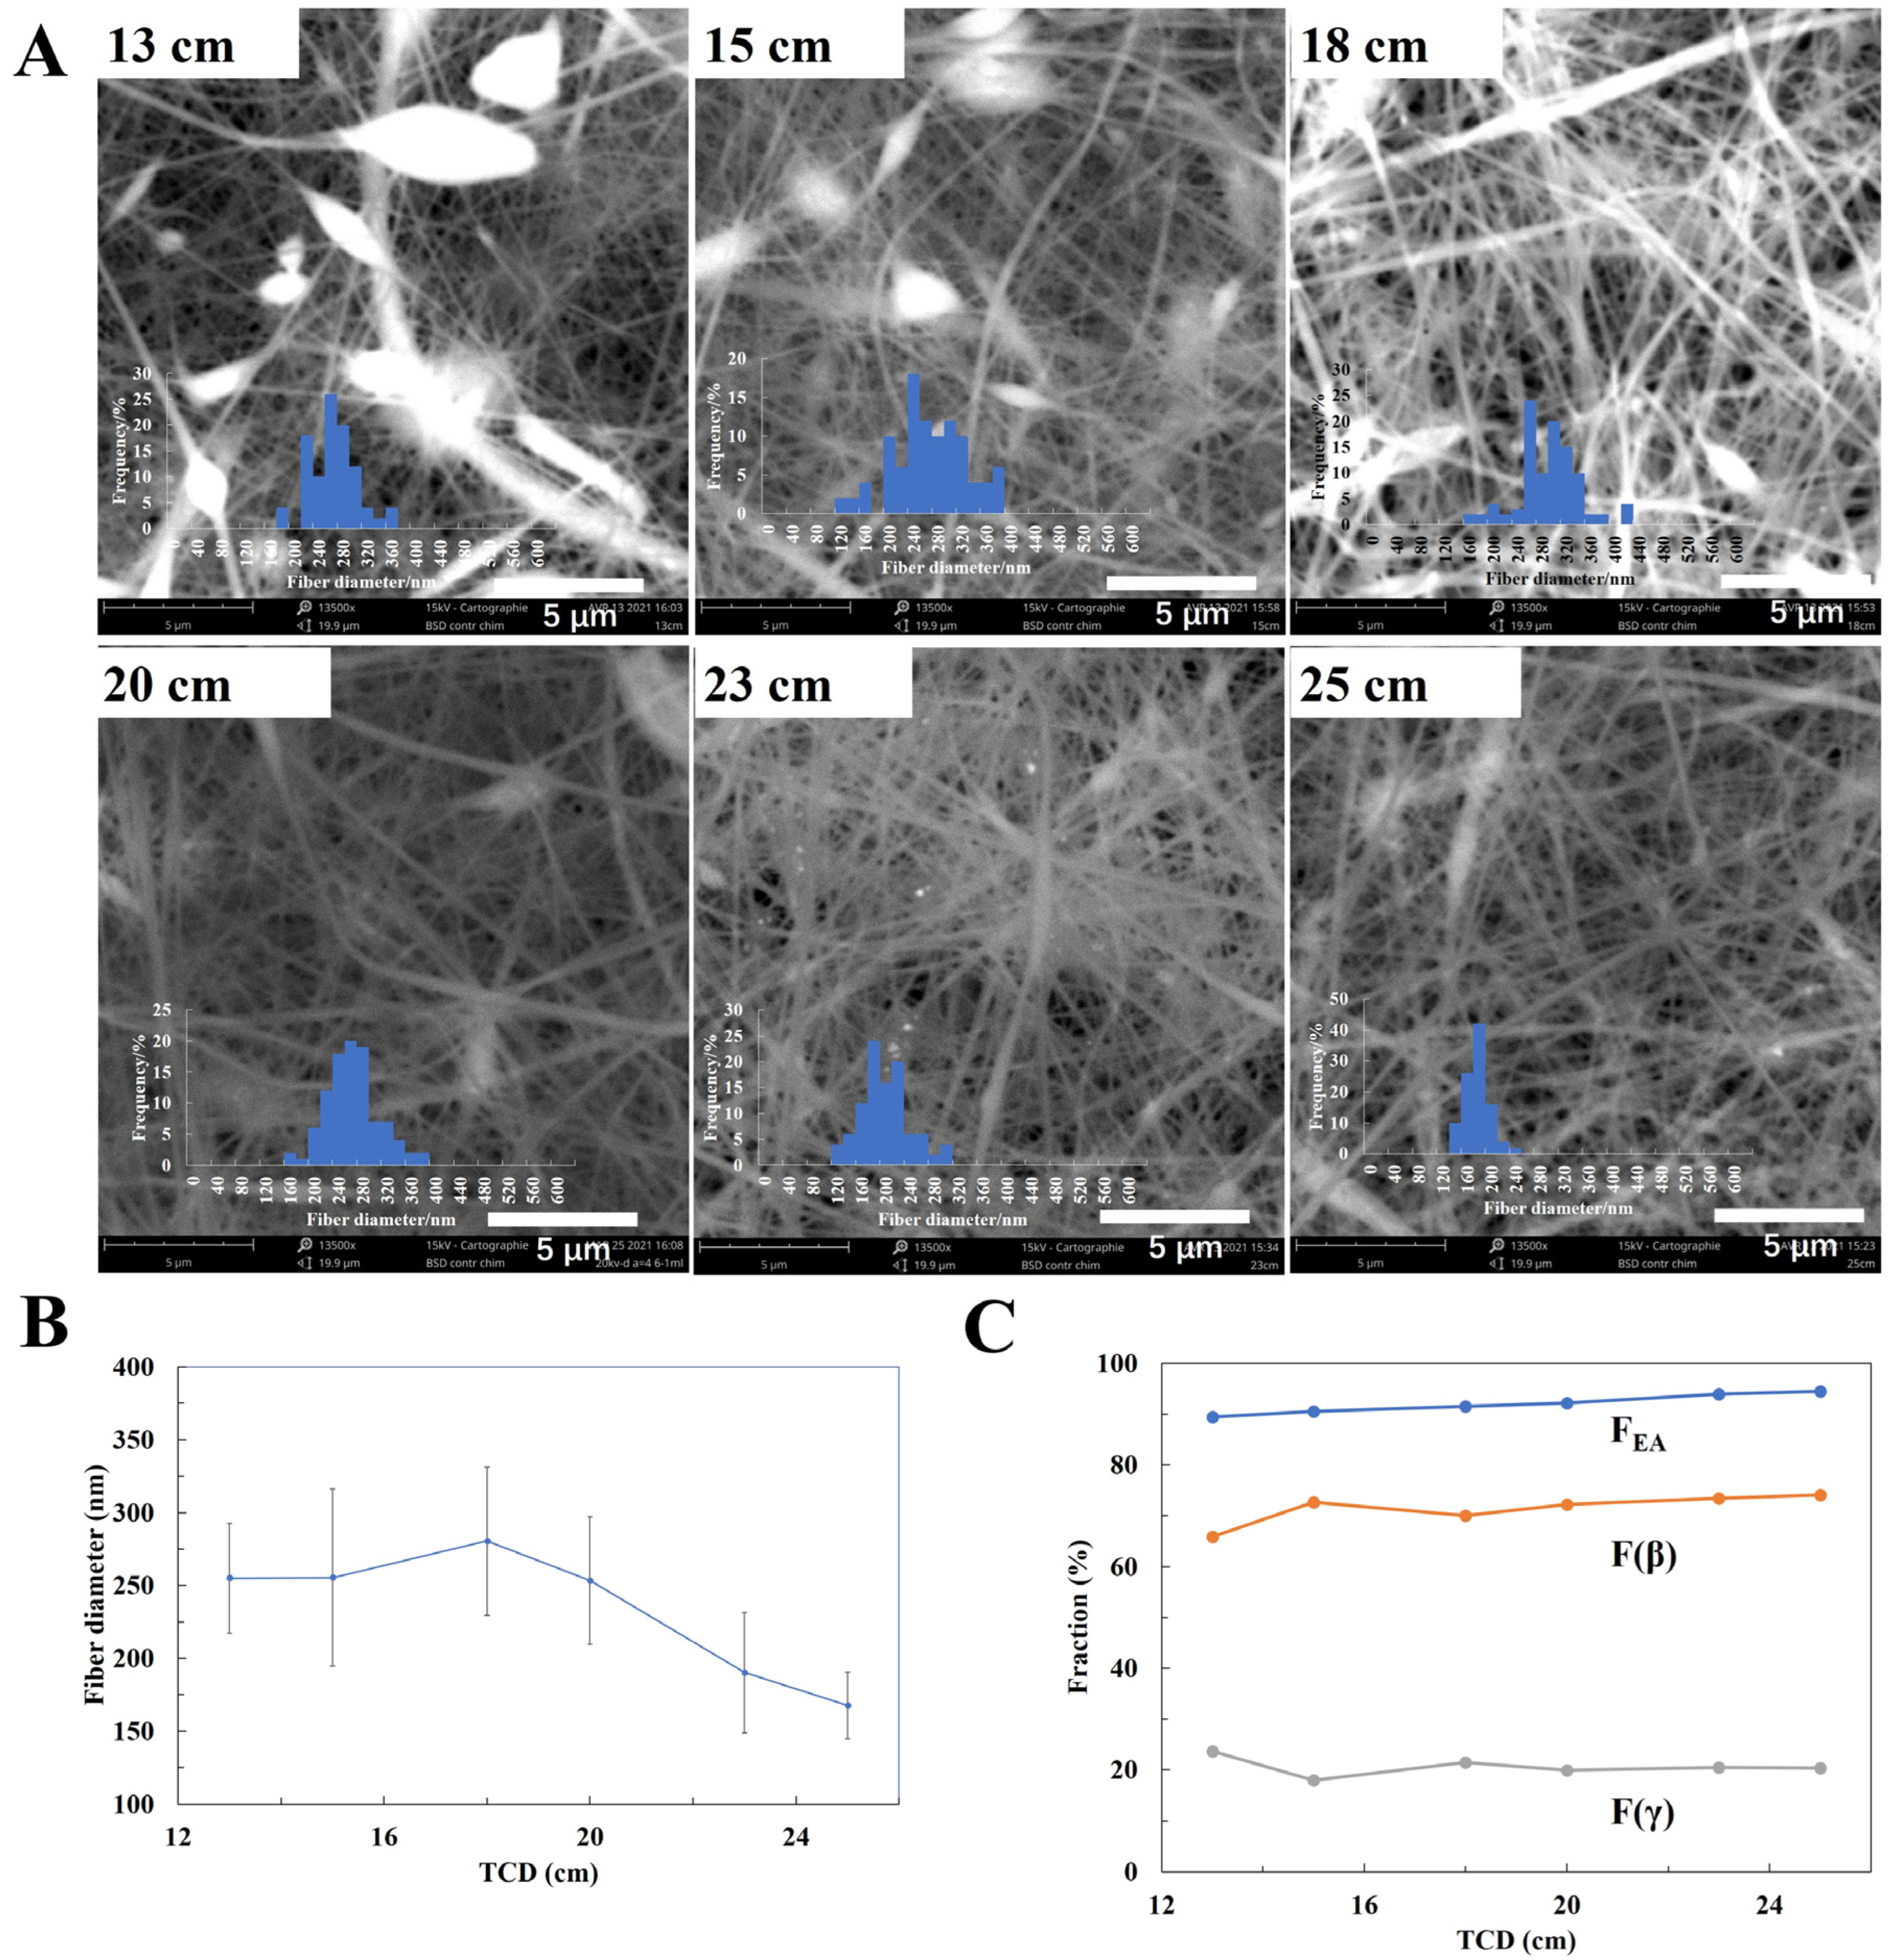
3.2.2. Tip to Collector Distance (TCD)
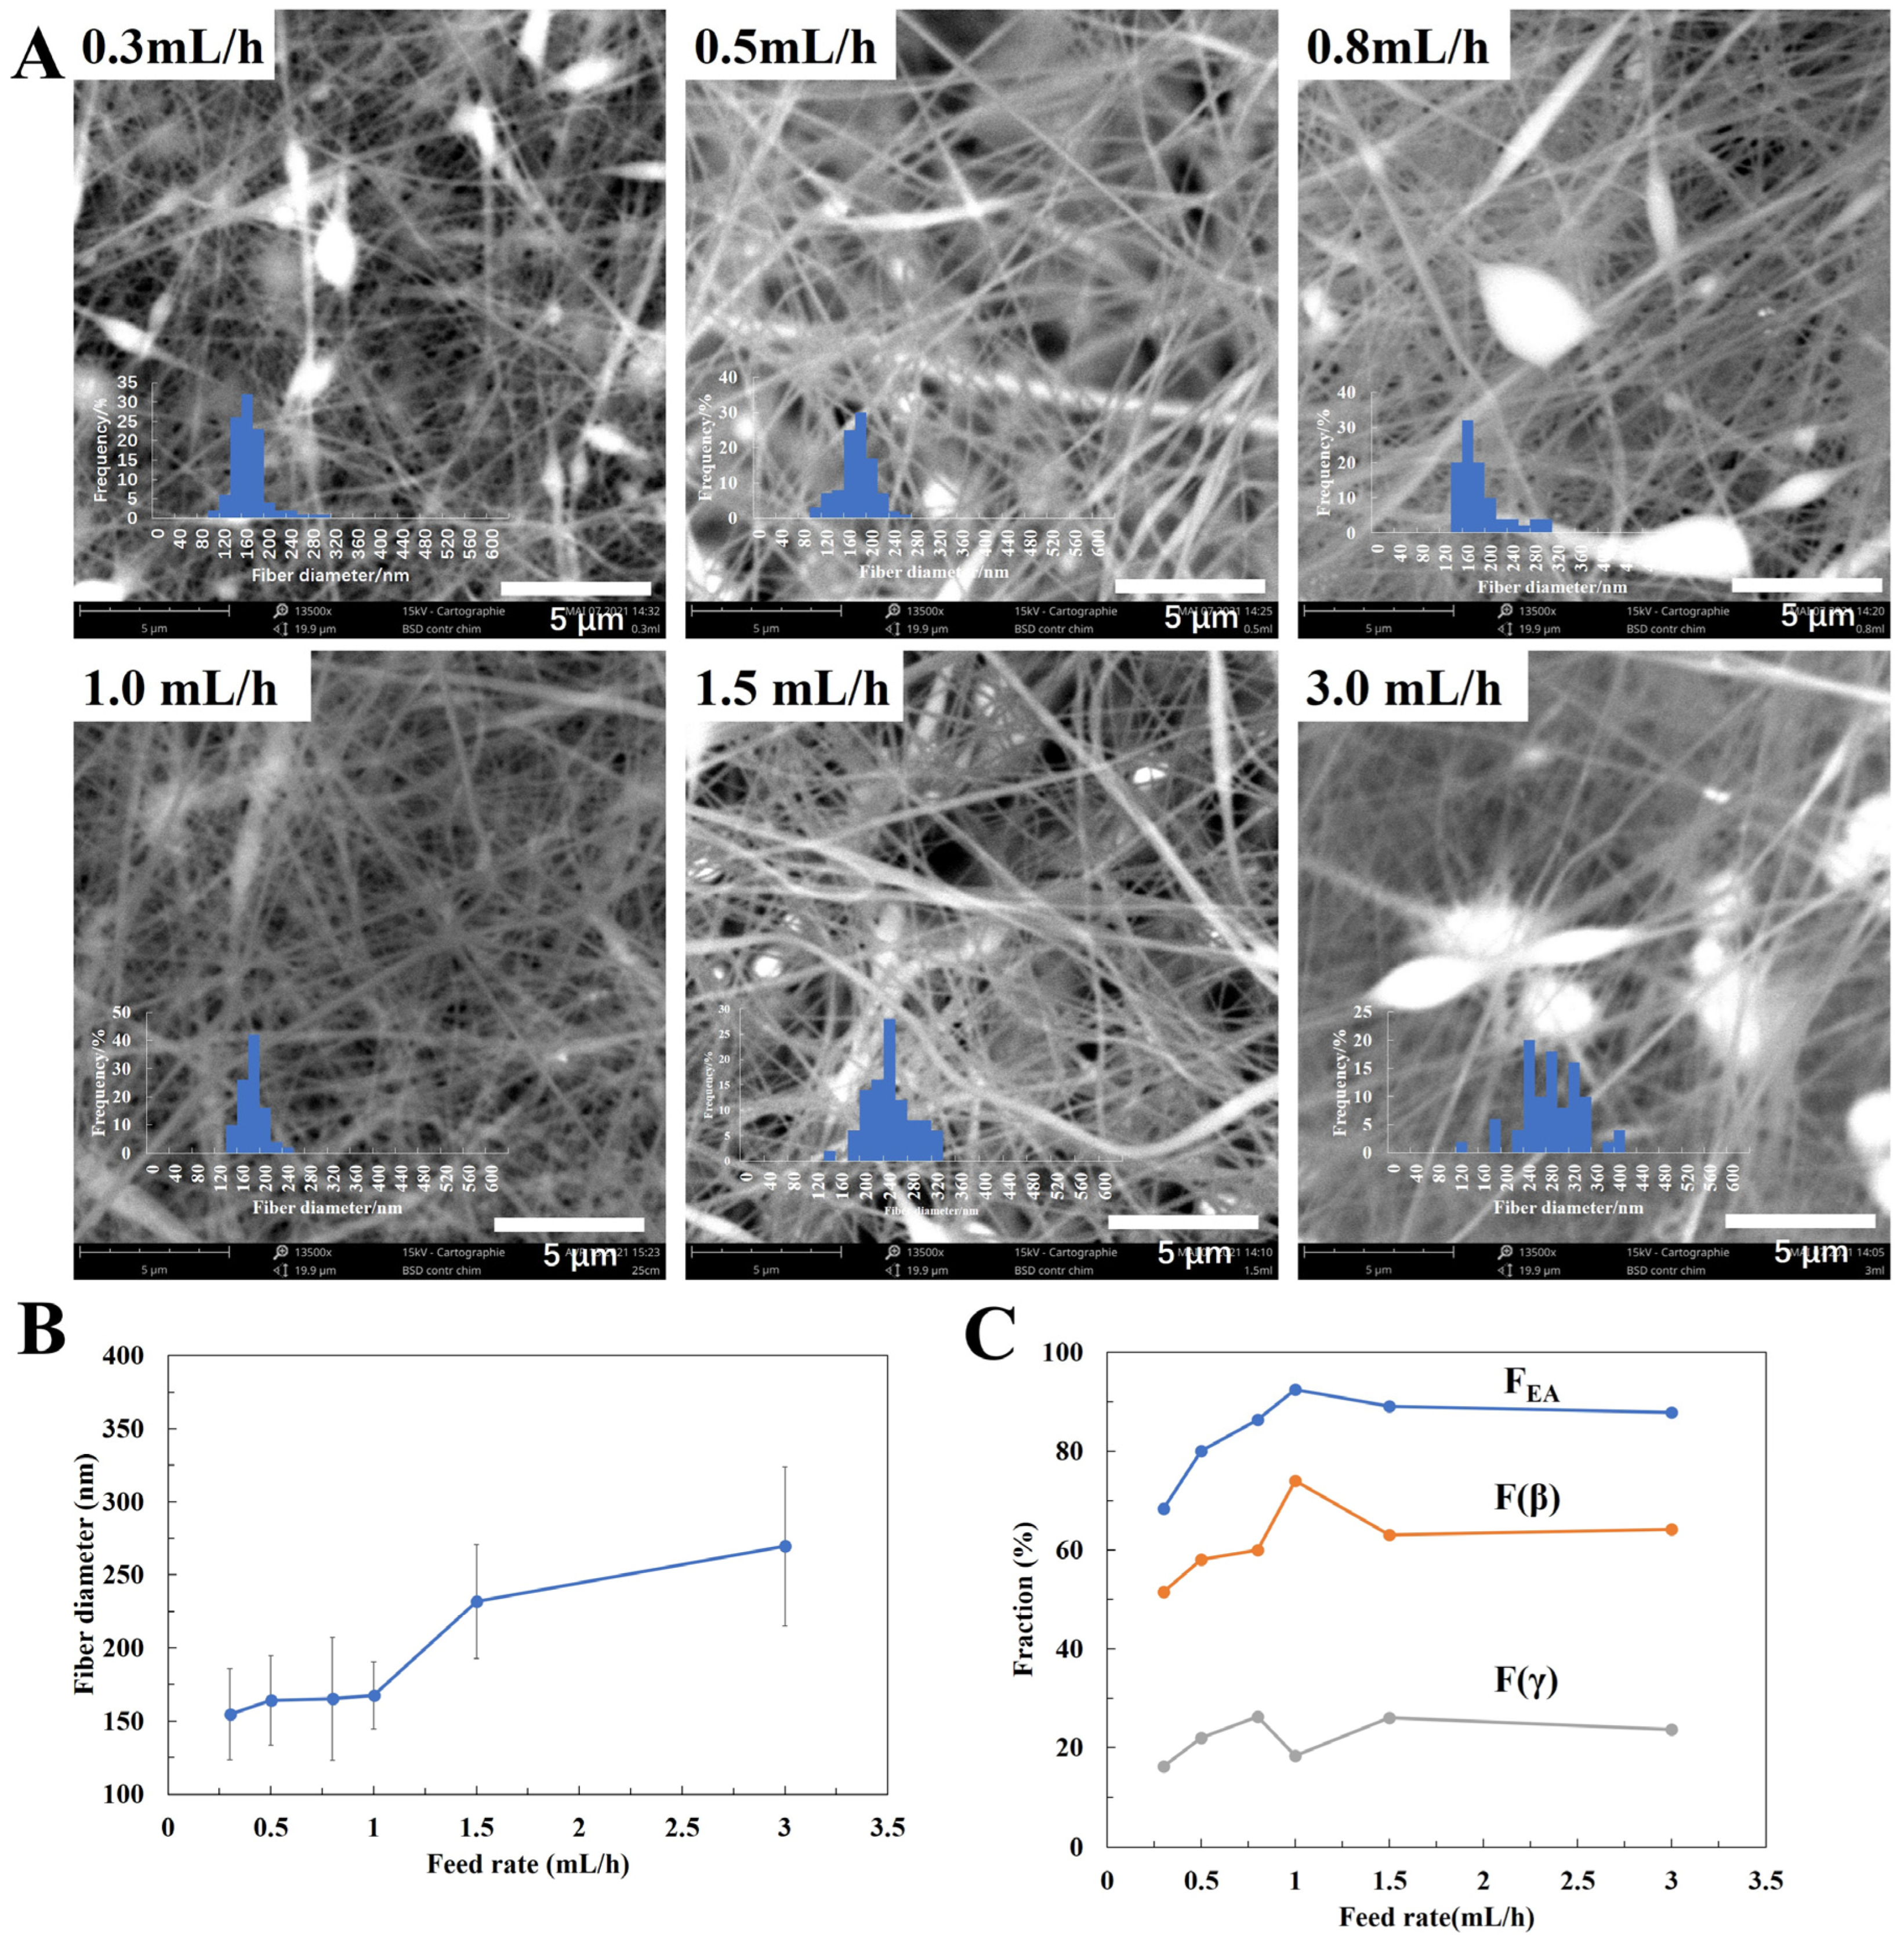
3.2.3. Feed Rate
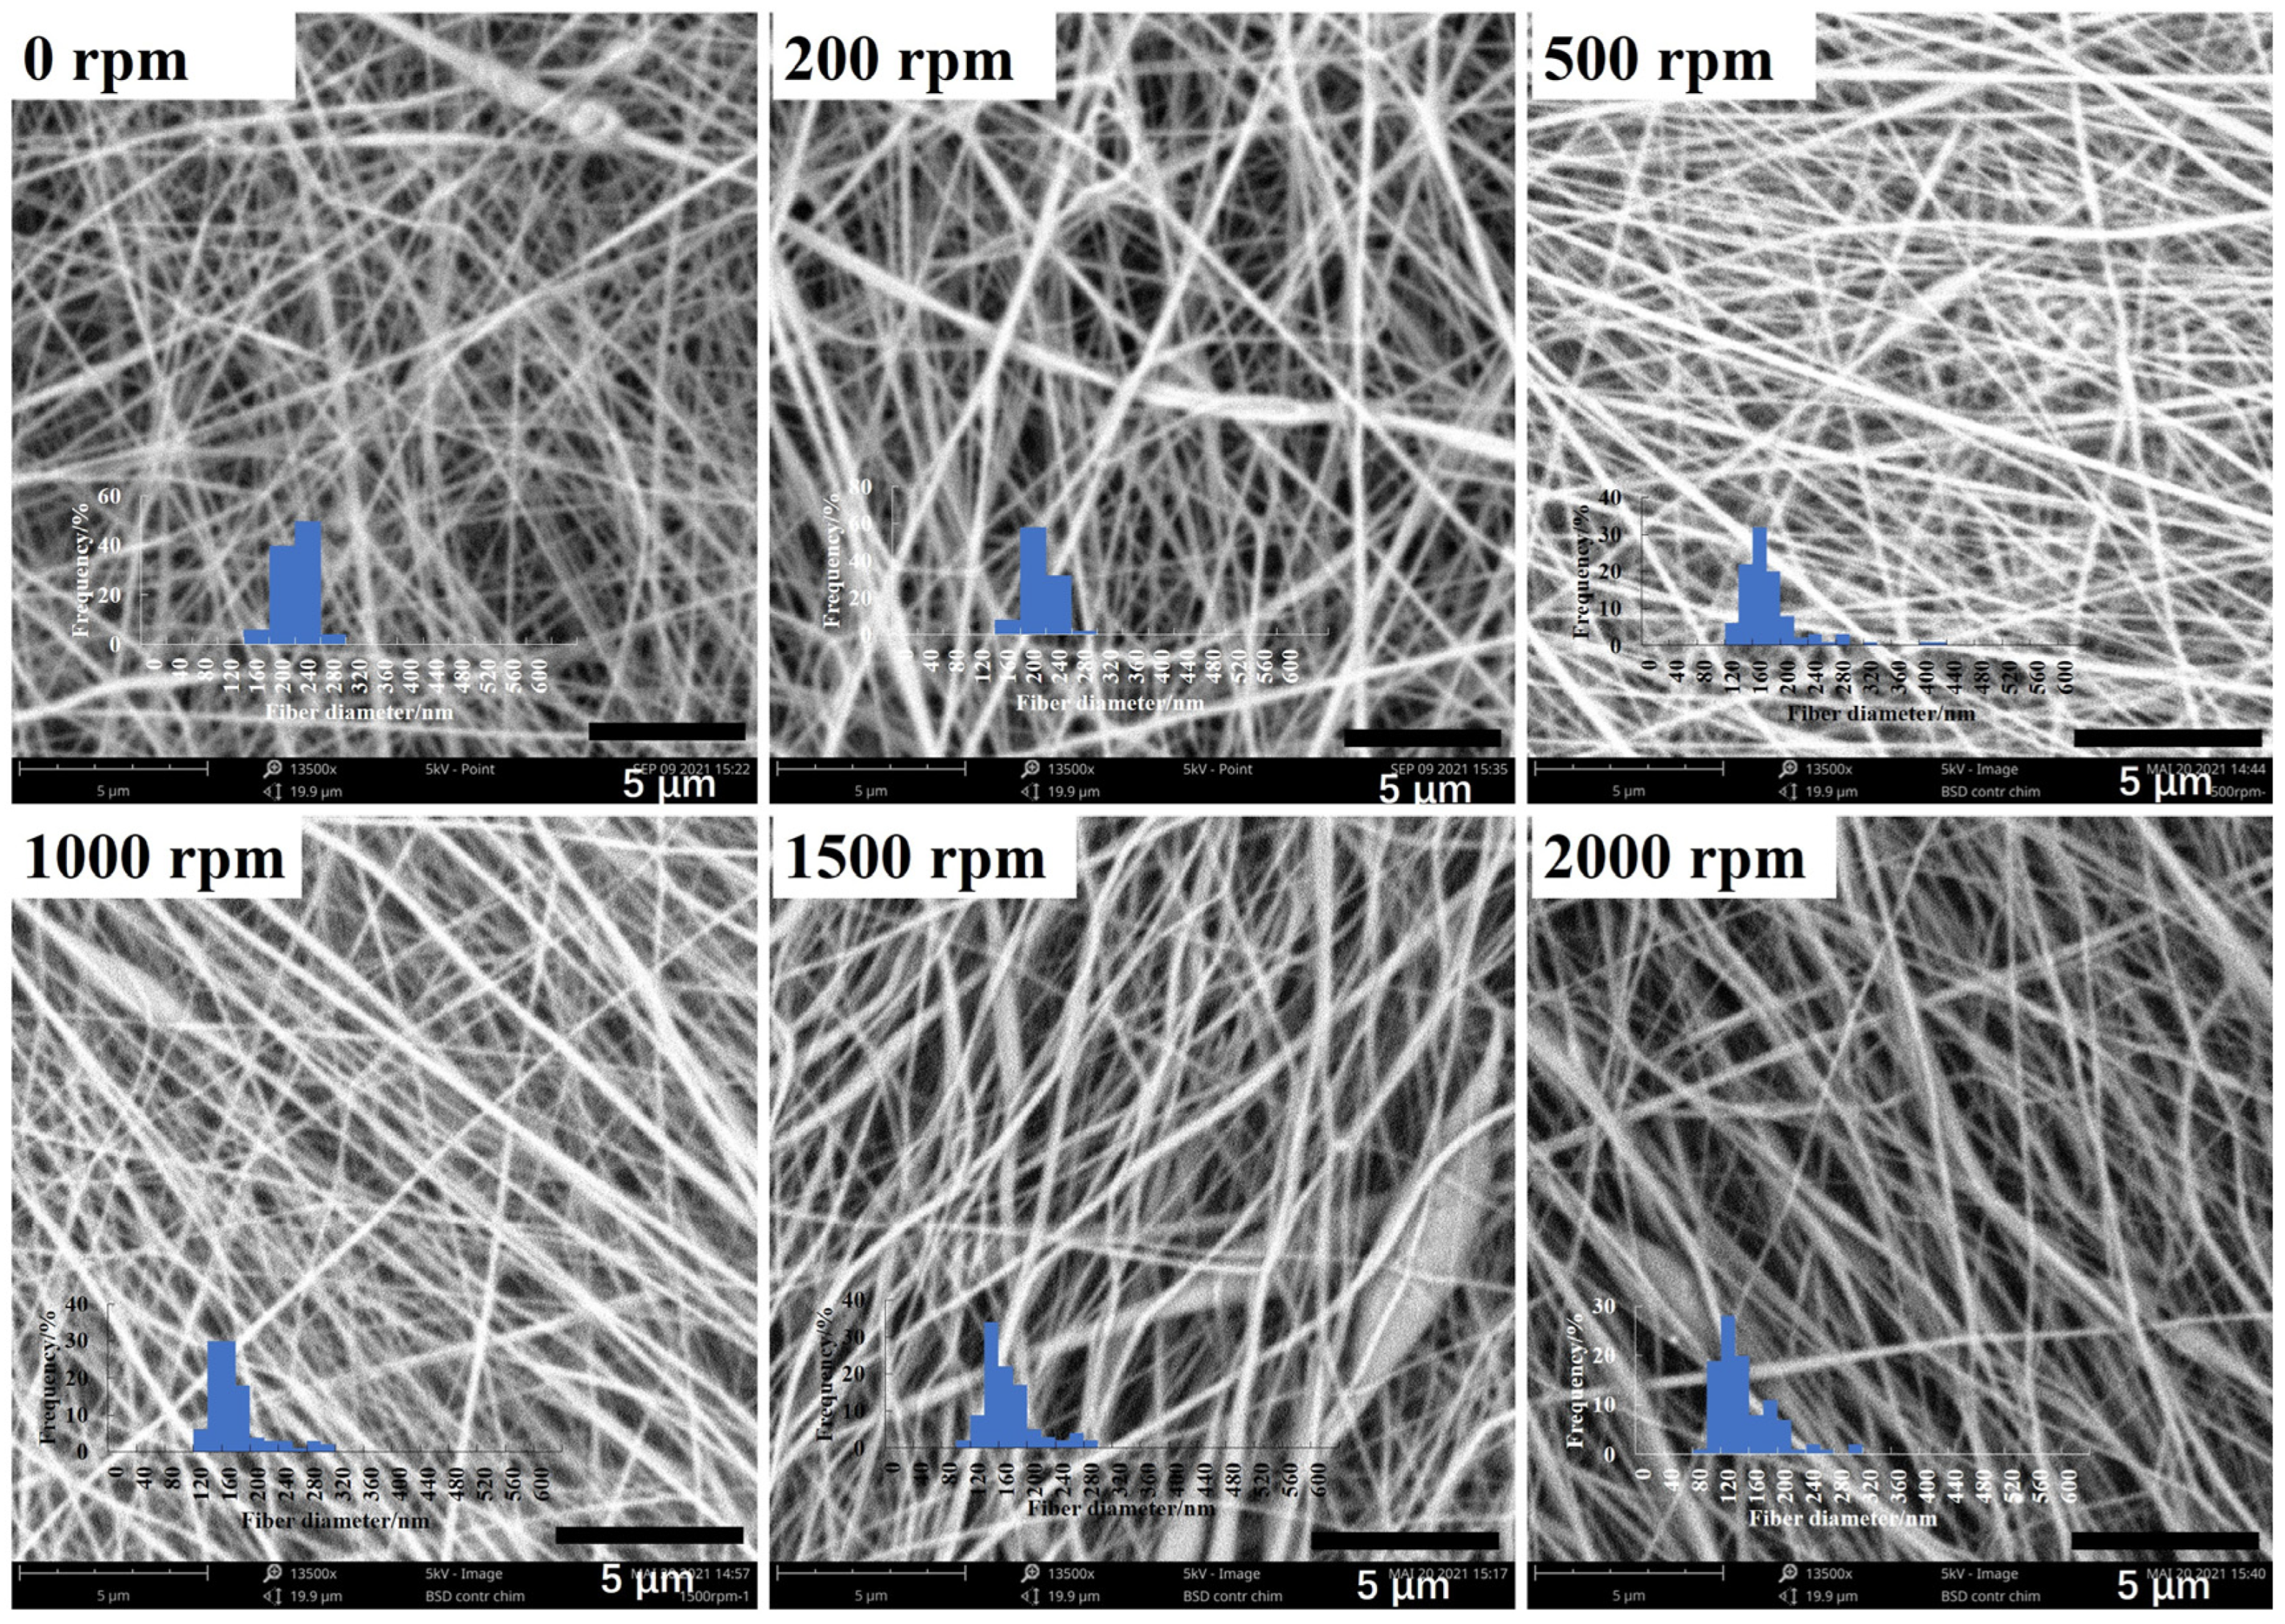
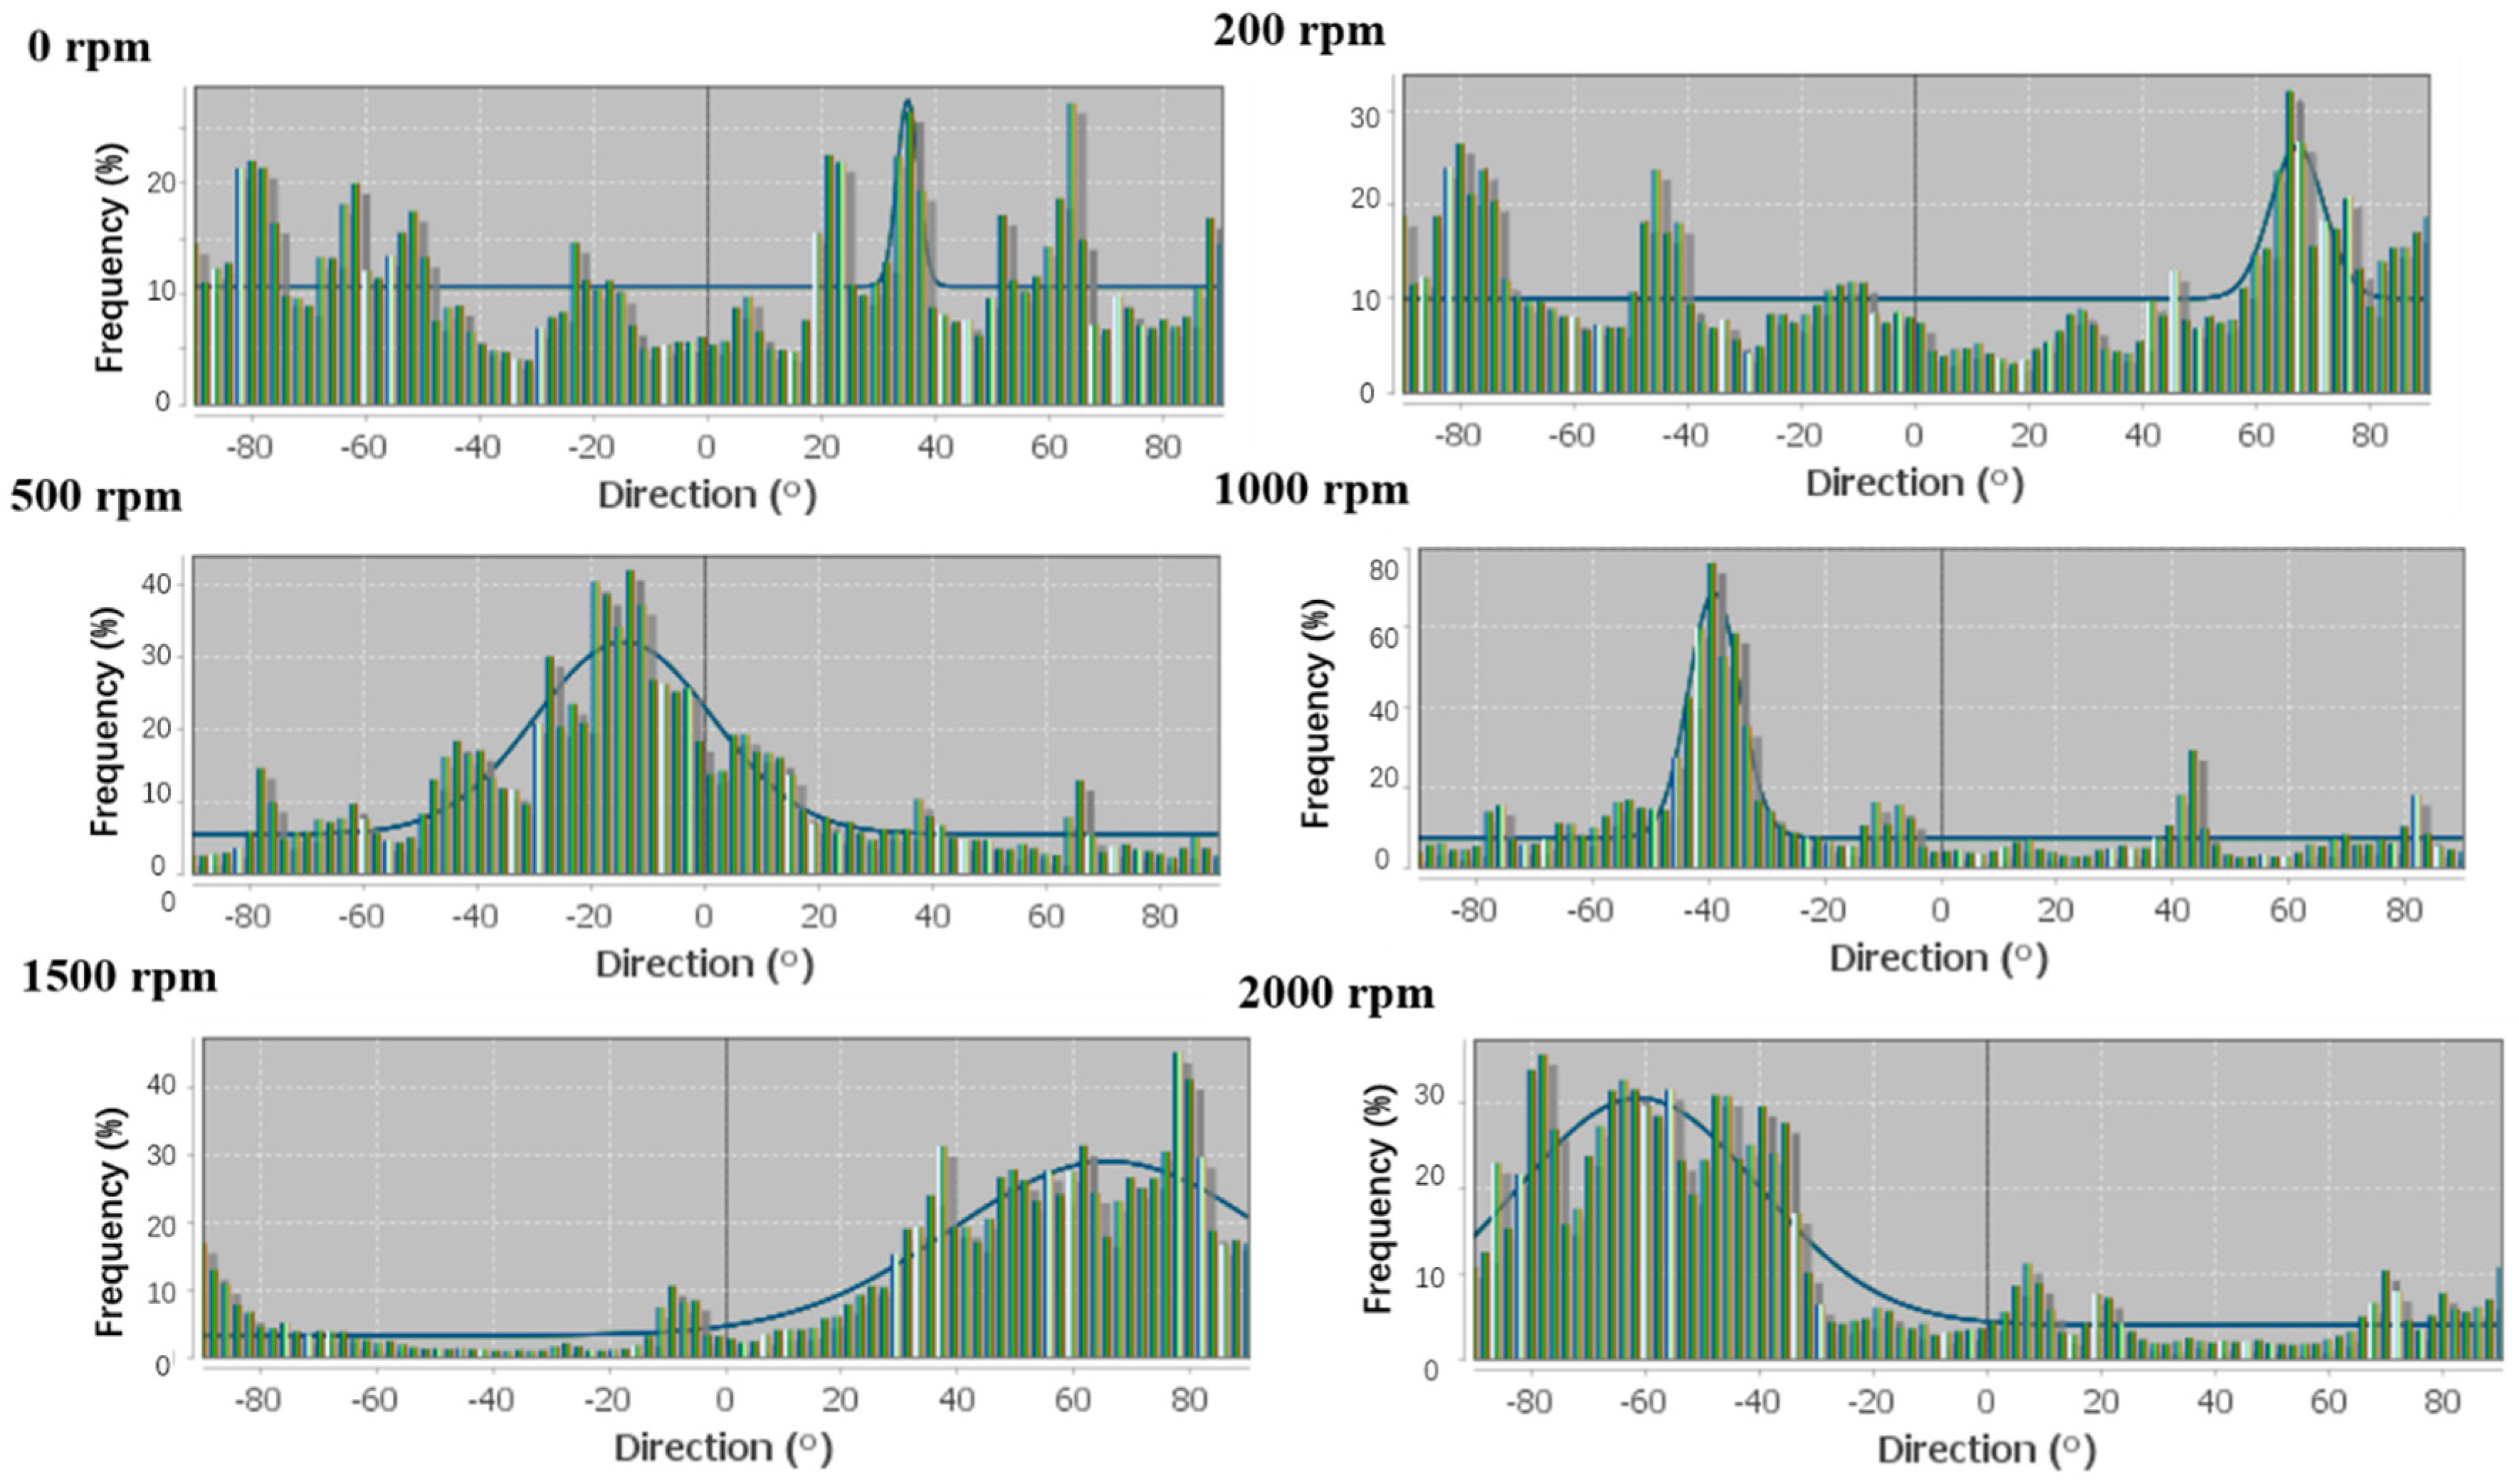
3.2.4. Collector
4. Conclusions
Author Contributions
Funding
Institutional Review Board Statement
Informed Consent Statement
Data Availability Statement
Conflicts of Interest
References
- Pathak, D.; Kumar, S.; Andotra, S.; Thomas, J.; Kaur, N.; Kumar, P.; Kumar, V. New tailored organic semiconductors thin films for optoelectronic applications star. Eur. Phys. J. Appl. Phys. 2021, 95, 10201. [Google Scholar] [CrossRef]
- Chen, C.; Bai, Z.; Cao, Y.; Dong, M.; Jiang, K.; Zhou, Y.; Tao, Y.; Gu, S.; Xu, J.; Yin, X.; et al. Enhanced piezoelectric performance of BiCl3/PVDF nanofibers-based nanogenerators. Compos. Sci. Technol. 2020, 192, 108100. [Google Scholar] [CrossRef]
- Alhasssan, Z.A.; Burezq, Y.S.; Nair, R.; Shehata, N. Polyvinylidene difluoride piezoelectric electrospun nanofibers: Review in synthesis, fabrication, characterizations, and applications. J. Nanomater. 2018, 2018, 8164185. [Google Scholar] [CrossRef]
- Huang, J.; Yao, M.; Yao, X. A novel approach to improving the electromechanical properties of PZT-based piezoelectric ceramics via a grain coating modification strategy. Ceram. Int. 2021, 47, 16294–16302. [Google Scholar] [CrossRef]
- Zhang, M.; Yang, J.; Si, C.; Han, G.; Zhao, Y.; Ning, J. Research on the piezoelectric properties of AlN thin films for MEMS applications. Micromachines 2015, 6, 1236–1248. [Google Scholar] [CrossRef]
- Shaikh, M.O.; Huang, Y.B.; Wang, C.C.; Chuang, C.H. Wearable woven triboelectric nanogenerator utilizing electrospun PVDF nanofibers for mechanical energy harvesting. Micromachines 2019, 10, 438. [Google Scholar] [CrossRef]
- Kim, M.; Lee, S.; Kim, Y.-I. Solvent-controlled crystalline beta-phase formation in electrospun P(VDF-TrFE) fibers for enhanced piezoelectric energy harvesting. APL Mater. 2020, 8, 071109. [Google Scholar] [CrossRef]
- Ishii, Y.; Kurihara, S.; Kitayama, R.; Sakai, H.; Nakabayashi, Y.; Nobeshima, T.; Uemura, S. High electromechanical response from bipolarly charged as-electrospun polystyrene fiber mat. Smart Mater. Struct. 2019, 28, 08LT02. [Google Scholar] [CrossRef]
- Wang, W.; Zheng, Y.; Jin, X.; Sun, Y.; Lu, B.; Wang, H.; Fang, J.; Shao, H.; Lin, T. Unexpectedly high piezoelectricity of electrospun polyacrylonitrile nanofiber membranes. Nano Energy 2019, 56, 588–594. [Google Scholar] [CrossRef]
- Zheng, T.; Yue, Z.; Wallace, G.G.; Du, Y.; Higgins, M.J. Nanoscale piezoelectric effect of biodegradable PLA-based composite fibers by piezoresponse force microscopy. Nanotechnology 2020, 31, 375708. [Google Scholar] [CrossRef]
- Liu, R.Q.; Wang, X.X.; Fu, J.; Zhang, Q.Q.; Song, W.Z.; Xu, Y.; Chen, Y.Q.; Ramakrishna, S.; Long, Y.Z. Preparation of nanofibrous PVDF membrane by solution blow spinning for mechanical energy harvesting. Nanomaterials 2019, 9, 1090. [Google Scholar] [CrossRef] [PubMed]
- Hu, X.; Jiang, Y.; Ma, Z.; He, Q.; He, Y.; Zhou, T.; Zhang, D. Highly sensitive P(VDF-TrFE)/BTO nanofiber-based pressure sensor with dense stress concentration microstructures. ACS Appl. Polym. Mater. 2020, 2, 4399–4404. [Google Scholar] [CrossRef]
- Syu, M.H.; Guan, Y.J.; Lo, W.C.; Fuh, Y.K. Biomimetic and porous nanofiber-based hybrid sensor for multifunctional pressure sensing and human gesture identification via deep learning method. Nano Energy 2020, 76, 105029. [Google Scholar] [CrossRef]
- Bae, J.-H.; Chang, S.-H. PVDF-based ferroelectric polymers and dielectric elastomers for sensor and actuator applications: A review. Funct. Compos. Struct. 2019, 1, 012003. [Google Scholar] [CrossRef]
- Samadi, A.; Hosseini, S.M.; Mohseni, M. Investigation of the electromagnetic microwaves absorption and piezoelectric properties of electrospun Fe3O4-GO/PVDF hybrid nanocomposites. Org. Electron. 2018, 59, 149–155. [Google Scholar] [CrossRef]
- Wan, C.; Bowen, C.R. Multiscale-structuring of polyvinylidene fluoride for energy harvesting: The impact of molecular-, micro- and macro-structure. J. Mater. Chem. A 2017, 5, 3091–3128. [Google Scholar] [CrossRef]
- Xin, Y.; Zhu, J.; Sun, H.; Xu, Y.; Liu, T.; Qian, C. A brief review on piezoelectric PVDF nanofibers prepared by electrospinning. Ferroelectrics 2018, 526, 140–151. [Google Scholar] [CrossRef]
- Wang, J.; Nabawy, M.R.A.; Cioncolini, A.; Revell, A.; Weigert, S. Planform geometry and excitation effects of PVDF-based vibration energy harvesters. Energies 2021, 14, 211. [Google Scholar] [CrossRef]
- Stojanovska, E.; Ozturk, N.D.; Polat, Y.; Akbulut, H.; Kilic, A. Solution blown polymer/biowaste derived carbon particles nanofibers: An optimization study and energy storage applications. J. Energy Storage 2019, 26, 100962. [Google Scholar] [CrossRef]
- Wang, D.; Zhang, D.; Li, P.; Yang, Z.; Mi, Q.; Yu, L. Electrospinning of flexible poly(vinyl alcohol)/MXene nanofiber-based humidity sensor self-powered by monolayer molybdenum diselenide piezoelectric nanogenerator. Nano-Micro. Lett. 2021, 13, 57. [Google Scholar] [CrossRef]
- Singh, R.K.; Lye, S.W.; Miao, J. Measurement of impact characteristics in a string using electrospun PVDF nanofibers strain sensors. Sens. Actuators A Phys. 2020, 303, 111841. [Google Scholar] [CrossRef]
- Khalifa, M.; Janakiraman, S.; Ghosh, S.; Venimadhav, A.; Anandhan, S. PVDF/halloysite nanocomposite-based non-wovens as gel polymer electrolyte for high safety lithium ion battery. Polym. Compos. 2018, 40, 2320–2334. [Google Scholar] [CrossRef]
- Arumugam, R.; Srinadhu, E.S.; Subramanian, B.; Nallani, S. β-PVDF based electrospun nanofibers—A promising material for developing cardiac patches. Med. Hypotheses 2019, 122, 31–34. [Google Scholar] [CrossRef]
- Ghosh, S.K.; Mandal, D. Synergistically enhanced piezoelectric output in highly aligned 1D polymer nanofibers integrated all-fiber nanogenerator for wearable nano-tactile sensor. Nano Energy 2018, 53, 245–257. [Google Scholar] [CrossRef]
- Surmenev, R.A.; Chernozem, R.V.; Pariy, I.O.; Surmeneva, M.A. A review on piezo- and pyroelectric responses of flexible nano- and micropatterned polymer surfaces for biomedical sensing and energy harvesting applications. Nano Energy 2021, 79, 105442. [Google Scholar] [CrossRef]
- Sun, J.; Zhang, Z.; Lu, B.; Mei, S.; Xu, Q.; Liu, F. Research on parametric model for polycaprolactone nanofiber produced by centrifugal spinning. J. Braz. Soc. Mech. Sci. 2018, 40, 186. [Google Scholar] [CrossRef]
- Li, H.; Huang, H.; Meng, X.; Zeng, Y. Fabrication of helical microfibers from melt blown polymer blends. J. Polym. Sci. Part B Polym. Phys. 2018, 56, 970–977. [Google Scholar] [CrossRef]
- He, Z.; Rault, F.; Lewandowski, M.; Mohsenzadeh, E.; Salaun, F. Electrospun PVDF nanofibers for piezoelectric applications: A review of the influence of electrospinning parameters on the β phase and crystallinity enhancement. Polymers 2021, 13, 174. [Google Scholar] [CrossRef]
- Jiyong, H.; Yuanyuan, G.; Hele, Z.; Yinda, Z.; Xudong, Y. Effect of electrospinning parameters on piezoelectric properties of electrospun PVDF nanofibrous mats under cyclic compression. J. Text. Inst. 2018, 109, 843–850. [Google Scholar] [CrossRef]
- Yee, W.A.; Kotaki, M.; Liu, Y.; Lu, X. Morphology, polymorphism behavior and molecular orientation of electrospun poly(vinylidene fluoride) fibers. Polymer 2007, 48, 512–521. [Google Scholar] [CrossRef]
- Gee, S.; Johnson, B.; Smith, A.L. Optimizing electrospinning parameters for piezoelectric PVDF nanofiber membranes. J. Memb. Sci. 2018, 563, 804–812. [Google Scholar] [CrossRef]
- Wu, C.M.; Chou, M.H.; Zeng, W.Y. Piezoelectric response of aligned electrospun polyvinylidene fluoride/carbon nanotube nanofibrous membranes. Nanomaterials 2018, 8, 420. [Google Scholar] [CrossRef]
- Higashi, S.; Hirai, T.; Matsubara, M.; Yoshida, H.; Beniya, A. Dynamic viscosity recovery of electrospinning solution for stabilizing elongated ultrafine polymer nanofiber by TEMPO-CNF. Sci. Rep. 2020, 10, 13427. [Google Scholar] [CrossRef]
- Barrau, S.; Ferri, A.; Da Costa, A.; Defebvin, J.; Leroy, S.; Desfeux, R.; Lefebvre, J.M. Nanoscale investigations of α- and γ-crystal phases in PVDF-based nanocomposites. ACS Appl. Mater. Interfaces 2018, 10, 13092–13099. [Google Scholar] [CrossRef]
- Boudriaux, M.; Rault, F.; Cochrane, C.; Lemort, G.; Campagne, C.; Devaux, E.; Courtois, C. Crystalline forms of PVDF fiber filled with clay components along processing steps. J. Appl. Polym. Sci. 2016, 133. [Google Scholar] [CrossRef]
- Cai, X.; Lei, T.; Sun, D.; Lin, L. A critical analysis of the α, β and γ phases in poly(vinylidene fluoride) using FTIR. RSC Adv. 2017, 7, 15382–15389. [Google Scholar] [CrossRef]
- Li, Y.; Xu, M.H.; Xia, Y.S.; Wu, J.M.; Sun, X.K.; Wang, S.; Hu, G.H.; Xiong, C.X. Multilayer assembly of electrospun/electrosprayed PVDF-based nanofibers and beads with enhanced piezoelectricity and high sensitivity. Chem. Eng. J. 2020, 388, 124205. [Google Scholar] [CrossRef]
- Shehata, N.; Elnabawy, E.; Abdelkader, M.; Hassanin, A.H.; Salah, M.; Nair, R.; Ahmad Bhat, S. Static-aligned piezoelectric poly (vinylidene fluoride) electrospun nanofibers/MWCNT composite membrane: Facile method. Polymers 2018, 10, 965. [Google Scholar] [CrossRef]
- Qin, X.; Wu, D. Effect of different solvents on poly(caprolactone) (PCL) electrospun nonwoven membranes. J. Therm. Anal. Calorim. 2011, 107, 1007–1013. [Google Scholar] [CrossRef]
- Tiwari, S.K.; Venkatraman, S.S. Importance of viscosity parameters in electrospinning: Of monolithic and core-shell fibers. Mater. Sci. Eng. C 2012, 32, 1037–1042. [Google Scholar] [CrossRef]
- Gupta, P.; Elkins, C.; Long, T.E.; Wilkes, G.L. Electrospinning of linear homopolymers of poly(methyl methacrylate): Exploring relationships between fiber formation, viscosity, molecular weight and concentration in a good solvent. Polymer 2005, 46, 4799–4810. [Google Scholar] [CrossRef]
- Kalimuldina, G.; Turdakyn, N.; Abay, I.; Medeubayev, A.; Nurpeissova, A.; Adair, D.; Bakenov, Z. A review of piezoelectric PVDF film by electrospinning and its applications. Sensors 2020, 20, 5214. [Google Scholar] [CrossRef]
- Gheibi, A.; Bagherzadeh, R.; Merati, A.A.; Latifi, M. Electrical power generation from piezoelectric electrospun nanofibers membranes: Electrospinning parameters optimization and effect of membranes thickness on output electrical voltage. J. Polym. Res. 2014, 21, 571. [Google Scholar] [CrossRef]
- Ribeiro, C.; Sencadas, V.; Ribelles, J.L.G.; Lanceros-Méndez, S. Influence of processing conditions on polymorphism and nanofiber morphology of electroactive poly(vinylidene fluoride) electrospun membranes. Soft Mater. 2010, 8, 274–287. [Google Scholar] [CrossRef]
- Jiyong, H.; Yinda, Z.; Hele, Z.; Yuanyuan, G.; Xudong, Y. Mixed effect of main electrospinning parameters on the β-phase crystallinity of electrospun PVDF nanofibers. Smart Mater Struct. 2017, 26, 085019. [Google Scholar] [CrossRef]
- Benz, M.; Euler, W.B. Determination of the crystalline phases of poly(vinylidene fluoride) under different preparation conditions using differential scanning calorimetry and infrared spectroscopy. J. Appl. Polym. Sci. 2003, 89, 1093–1100. [Google Scholar] [CrossRef]
- Boccaccio, T.; Bottino, A.; Capannelli, G.; Piaggio, P. Characterization of PVDF membranes by vibrational spectroscopy. J. Membr. Sci. 2002, 210, 315–329. [Google Scholar] [CrossRef]
- Li, B.; Xu, C.; Zheng, J.; Xu, C. Sensitivity of pressure sensors enhanced by doping silver nanowires. Sensors 2014, 14, 9889–9899. [Google Scholar] [CrossRef] [PubMed]
- Liu, S.; Xue, S.; Zhang, W.; Zhai, J.; Chen, G. Significantly enhanced dielectric property in PVDF nanocomposites flexible films through a small loading of surface-hydroxylated Ba0.6Sr0.4TiO3 nanotubes. J. Mater. Chem. A 2014, 2, 18040–18046. [Google Scholar] [CrossRef]
- Shao, H.; Fang, J.; Wang, H.; Lin, T. Effect of electrospinning parameters and polymer concentrations on mechanical-to-electrical energy conversion of randomly-oriented electrospun poly(vinylidene fluoride) nanofiber mats. RSC Adv. 2015, 5, 14345–14350. [Google Scholar] [CrossRef]
- Wang, S.H.; Wan, Y.; Sun, B.; Liu, L.Z.; Xu, W. Mechanical and electrical properties of electrospun PVDF/MWCNT ultrafine fibers using rotating collector. Nanoscale Res. Lett. 2014, 9, 522. [Google Scholar] [CrossRef] [PubMed]
- Zhou, Z.; Wu, X.-F. Electrospinning superhydrophobic-superoleophilic fibrous PVDF membranes for high-efficiency water-oil separation. Mater. Lett. 2015, 160, 423–427. [Google Scholar] [CrossRef]
- Wu, X.; Wang, Y.; Liu, J.; He, S.; Zhang, L. Improved crack growth resistance and its molecular origin of natural rubber/carbon black by nanodispersed clay. Polym. Eng. Sci. 2012, 52, 1027–1036. [Google Scholar] [CrossRef]


| Applied Voltage (kV) | 15 | 18 | 20 | 25 | 28 | 30 | |
|---|---|---|---|---|---|---|---|
| Fiber diameter (nm) | 304 ± 29 | 296 ± 42 | 253 ± 44 | 241 ± 40 | 203 ± 51 | 190 ± 64 | |
| FTIR | FEA (%) | 76.5 ± 1.1 | 81.5 ± 1.6 | 92.2 ± 0.3 | 88.2 ± 0.5 | 90.6 ± 0.4 | 85.9 ± 1.0 |
| F(β) (%) | 48.7 ± 1.3 | 55.0 ± 1.2 | 72.2 ± 2.1 | 61.7 ± 0.6 | 64.0 ± 0.5 | 58.8 ± 1.8 | |
| F(γ) (%) | 27.8 ± 0.2 | 26.5 ± 0.5 | 19.9 ± 2.0 | 26.5 ± 0.3 | 26.5 ± 0.4 | 27.1 ± 0.9 | |
| DSC | FEA (%) | 70.0 | 71.7 | 78.4 | 66.6 | 66.7 | 69.1 |
| F(β) (%) | 43.6 | 55.0 | 57.6 | 50.4 | 48.4 | 43.9 | |
| F(γ) (%) | 26.4 | 16.7 | 20.8 | 16.2 | 18.3 | 25.2 | |
| Xc (%) | 36.5 | 48.4 | 45.3 | 43.9 | 41.7 | 38.1 | |
| F(β)Total (%) | 15.9 | 26.6 | 26.1 | 22.1 | 20.2 | 16.7 | |
| d33 (pC/N) | 9.0 ± 1.3 | 10.8 ± 1.1 | 11.4 ± 2.1 | 8.5 ± 1.3 | 9.3 ± 1.0 | 7.8 ± 1.0 | |
| α | 0.227 | 0.412 | 0.467 | 0.326 | 0.153 | 0.214 | |
| Goodness | 0.190 | 0.280 | 0.320 | 0.160 | 0.200 | 0.290 | |
| Rotating Speed (Rpm) | 0 | 200 | 500 | 1000 | 1500 | 2000 | |
|---|---|---|---|---|---|---|---|
| Fiber diameter (nm) | 198 ± 25 | 191 ± 23 | 165 ± 50 | 159 ± 39 | 155 ± 37 | 134 ± 42 | |
| FTIR | FEA (%) | 86.7 ± 1.0 | 90.6 ± 1.1 | 87.7 ± 1.0 | 86.8 ± 1.1 | 87.4 ± 0.3 | 84.7 ± 1.0 |
| F(β) (%) | 59.6 ± 2.1 | 63.1 ± 0.6 | 61.2 ± 1.4 | 58.0 ± 1.1 | 57.2 ± 3.1 | 55.2 ± 2.9 | |
| F(γ) (%) | 27.1 ± 0.1 | 27.5 ± 0.9 | 26.5 ± 1.6 | 28.8 ± 4.5 | 30.2 ± 4.5 | 29.5 ± 3.0 | |
| DSC | FEA (%) | 71.4 | 74.7 | 62.2 | 57.5 | 52.9 | 59.5 |
| F(β) (%) | 47.5 | 50.2 | 41.8 | 37.9 | 32.5 | 43.1 | |
| F(γ) (%) | 23.9 | 24.5 | 20.4 | 19.6 | 20.4 | 16.4 | |
| Xc (%) | 42.2 | 44.8 | 41.1 | 41.2 | 36.9 | 42.8 | |
| F(β)Total (%) | 20.0 | 22.5 | 17.2 | 15.6 | 11.9 | 18.4 | |
| d33 (pC/N) | 10.1 ± 0.8 | 10.7 ± 1.9 | 9.1 ± 1.3 | 8.3 ± 1.1 | 7.7 ± 0.7 | 7.2 ± 1.4 | |
| α | 0.571 | 0.756 | 0.848 | 0.902 | 0.967 | 0.981 | |
| Goodness | 0.08 | 0.16 | 0.69 | 0.74 | 0.73 | 0.74 | |
Publisher’s Note: MDPI stays neutral with regard to jurisdictional claims in published maps and institutional affiliations. |
© 2022 by the authors. Licensee MDPI, Basel, Switzerland. This article is an open access article distributed under the terms and conditions of the Creative Commons Attribution (CC BY) license (https://creativecommons.org/licenses/by/4.0/).
Share and Cite
He, Z.; Rault, F.; Vishwakarma, A.; Mohsenzadeh, E.; Salaün, F. High-Aligned PVDF Nanofibers with a High Electroactive Phase Prepared by Systematically Optimizing the Solution Property and Process Parameters of Electrospinning. Coatings 2022, 12, 1310. https://doi.org/10.3390/coatings12091310
He Z, Rault F, Vishwakarma A, Mohsenzadeh E, Salaün F. High-Aligned PVDF Nanofibers with a High Electroactive Phase Prepared by Systematically Optimizing the Solution Property and Process Parameters of Electrospinning. Coatings. 2022; 12(9):1310. https://doi.org/10.3390/coatings12091310
Chicago/Turabian StyleHe, Zhongchen, François Rault, Astha Vishwakarma, Elham Mohsenzadeh, and Fabien Salaün. 2022. "High-Aligned PVDF Nanofibers with a High Electroactive Phase Prepared by Systematically Optimizing the Solution Property and Process Parameters of Electrospinning" Coatings 12, no. 9: 1310. https://doi.org/10.3390/coatings12091310
APA StyleHe, Z., Rault, F., Vishwakarma, A., Mohsenzadeh, E., & Salaün, F. (2022). High-Aligned PVDF Nanofibers with a High Electroactive Phase Prepared by Systematically Optimizing the Solution Property and Process Parameters of Electrospinning. Coatings, 12(9), 1310. https://doi.org/10.3390/coatings12091310