Article

Synthesis, Characterization and Investigation of Anticorrosion Properties of an Innovative Metal–Organic Framework, ZnMOF-BTA, on Carbon Steel in HCl Solution

1
CAS Key Laboratory of Nuclear Materials and Safety Assessment, Institute of Metal Research, Chinese Academy of Sciences, Shenyang 110016, China
2
School of Materials Science and Engineering, University of Science and Technology of China, Hefei 230026, China
3
Materials Chemistry Research Group, Department of Pure and Applied Chemistry, University of Calabar, Calabar 540271, Nigeria
4
Institute of Corrosion Science and Technology, Guangzhou 510530, China
*
Authors to whom correspondence should be addressed.
Coatings 2022, 12(9), 1288; https://doi.org/10.3390/coatings12091288
Submission received: 20 July 2022 / Revised: 15 August 2022 / Accepted: 20 August 2022 / Published: 2 September 2022
(This article belongs to the Special Issue Advanced Corrosion Protection through Coatings and Surface Rebuilding)

Abstract

:
An innovative metal–organic framework (ZnMOF-BTA) with corrosion inhibition properties was prepared by the solvothermal reaction of zinc nitrate, 1,2,3-benzotriazole, and 2,5-thiophene dicarboxylic acid. ZnMOF-BTA was characterized by FTIR, XRD, XPS, SEM, and thermogravimetric analyses, and the corrosion inhibition performance on Q235 carbon steel in 1 M HCl solution was evaluated by weight loss, polarization, and EIS measurements. XRD results showed that ZnMOF-BTA has a monoclinic crystal structure and belongs to C12/c1 space group, while DTA/TGA results revealed it has a good crystalline quality and excellent thermal stability with a melting point of 410 °C. FTIR and XPS results revealed that Zn2+, TDC2−, and BTA molecules were successfully used in ZnMOF-BTA synthesis. Electrochemical test results show that the obtained ZnMOF-BTA is effective in corrosion inhibition of Q235 carbon steel in acidic conditions and maximum inhibition efficiency of over 90% is obtained at 6 wt.% ZnMOF-BTA extract concentration. Adsorption studies revealed that the adsorption of BTA molecules follows the Langmuir isotherm model with an R2 value of 0.97889, while the ΔG◦ads value of −10.28 kJ mol−1 indicates that adsorption is by physisorption. The study provides a new corrosion inhibitor compound with proven corrosion inhibition properties.

1. Introduction

Corrosion of steel constitutes a serious worldwide industrial problem that results in significant economic losses, material failure, and a decrease in efficiency with serious environmental problems. Acid solutions are extensively used in the industries in many processes such as pickling, oil well acidification, cleaning, decalcification, and petrochemical processes resulting in the accelerated corrosion of metals and alloys in such aggressive acidic environments. Therefore, the protection of metals from corrosion is of great importance and has been receiving a considerable amount of attention over the past few decades [1,2].
Several methods such as the use of corrosion inhibitors, organic coatings, or hybrid protective coatings have successfully been used in order to control or mitigate corrosion processes that take place on steel surfaces [3]. Corrosion inhibitors have been widely used to reduce corrosion rates and protect metals against degradation, especially in acidic media, in the presence of chlorides [4]. Because of their donor–acceptor interaction with the metal and the creation of a protective layer on the metal surface, inhibitors can effectively reduce the corrosion rate even at extremely low concentrations [5].
Various organic inhibitors have been reported to be efficient corrosion inhibitors for metals and alloys. Their inhibition effect depends mainly on the molecular structure, the functional groups/heteroatoms (being electron donors or acceptors), and the number of such groups per molecule [6]. It is worthy to note that most effective inhibitors are based on molecules containing aromatic rings or heteroatoms, such as oxygen, nitrogen, phosphorus, and sulfur [7]. These features are believed to provide suitable sites for the adsorption of the inhibitor onto the metal surface, hence forming a protective film that creates a barrier between the metal surface and its environment. Azole compounds (thiazole, benzotriazole, imidazole, and thiadiazole), amines, Schiff bases, and amino acid drug compounds have been successfully used for the protection of metals such as aluminum, copper, and alloys [5,8].
In practice, both passive and active protection of metals is of great importance, and this has been attempted by the incorporation of corrosion inhibitors into inorganic and organic porous materials before application [9]. These porous materials were regarded as containers that have a good ability to control the immobilization of inhibitor molecules. Most attention has been focused on using inhibitors encapsulated in materials such as mesoporous inorganic materials (i.e., mesoporous silica nanoparticles) [10], layered double hydroxides [11], oxide nanoparticles [12], nanotubes, and polyelectrolyte shells [13] for a controlled release of the inhibitor.
Metal–organic frameworks (MOFs) are compounds consisting of metal ions or clusters coordinated with organic ligands or linkers [14]. The advantages of high porosity, large specific surface areas, and versatility of their structures make MOFs very attractive in many fields such as separation, gas adsorption, and catalysis [15]. The careful pre-design of secondary building units (SBUs) and organic ligands has enabled the construction of a range of MOFs with desired characteristics and predictable topologies over the last two decades. Compared with the porous organic (hydrocarbons) or inorganic counterparts [16], MOFs have numerous merits, including permanent pores, easy functionalization, and large capacity for guests (e.g., inhibitors, drugs, gases, dye molecules) [17], and accessible metal sites [18]. These many advantages have made MOFs very good and cost-effective porous materials as containers for corrosion inhibitors, especially in organic coatings where they served as containers for the controlled release of organic inhibitors in corrosive media.
Although the use of MOFs in corrosion and protection has been reported in the literature [19], the research scope has been limited, and the underlying mechanisms have not been thoroughly investigated. Furthermore, the distinctions between MOFs and other standard corrosion inhibitors in terms of adsorption mechanisms have not been completely investigated. In this study, we synthesized ZnMOF-BTA by reacting zinc nitrate hexahydrate with 2,5-thiophene dicarboxylic acid (H2TDC) in the presence of 1,2,3-benzotriazole (BTA) via the conventional solvothermal method. Scanning electron microscopy (SEM), X-ray diffraction (XRD), Fourier transform infrared (FTIR) spectroscopy, and transmission electron microscopy (TEM) were used to characterize the structure of ZnMOF-BTA. Weight loss measurements, potentiodynamic polarization tests, and electrochemical impedance spectroscopy (EIS) were used to evaluate the inhibitory function of ZnMOF-BTA in an acid medium.

2. Experimental

2.1. Materials

The substrate used in this work is Q235 carbon steel which has the nominal composition as shown in Table 1.
Q235 steel samples (50 mm × 50 mm × 3 mm) were purchased from Henan Runlu Trading Co., Ltd., Wugang, China. The samples were ultrasonically cleaned and degreased with acetone and ethanol before use. Zinc nitrate hexahydrate was bought from Tianjin Kermel Chemical Reagent Co., Ltd., Tianjin, China. 1,2,3-Benzotriazole (BTA) and 2,5-thiophene dicarboxylic acid (H2TDC) were purchased from Sinopharm Chemical Reagent Co., Ltd., Beijing, China, and Shanghai Macklin Biochemical Co., Ltd., Shanghai, China respectively. The chemicals were of reagent grade and were used without further purification.

2.2. Synthesis of ZnMOF-BTA

The metal–organic frameworks were synthesized via the conventional solvothermal method [20]. First, 5 mmol (1.49 g) zinc nitrate hexahydrate was dissolved in 20 mL of methanol in a beaker, and 10 mmol (1.19 g) of BTA and 10 mmol (1.73 g) of H2TDC were dissolved in 30 mL methanol in a separate beaker. The two mixtures were then mixed and stirred for 30 min using a magnetic stirrer to ensure uniform dispersion. The resulting solutions were then poured into Teflon autoclaves and heated in an oven at 140 °C for 3 days. After natural cooling and centrifugation, the crystals were obtained, washed several times with a mixture of methanol and water at a volume ratio of 1:1 to remove residual impurities, and dried in the oven. The synthesis route of ZnMOF-BTA is shown in Figure 1.

2.3. Characterization of the Synthesized ZnMOF-BTA

The surface morphology and chemical composition of the prepared ZnMOF-BTA samples were observed using XL30 type ESEM SEM coupled to EDX and JEOL TEM-2100F TEM. The functional groups and chemical bonds present in the ZnMOF-BTA crystals were determined using FT-IR spectroscopy within the wavelength range of 400–4000 cm−1 (IS50 FT-IR, Thermo Scientific, Waltham, MA, USA) and an Escalab 250 Thermo Fisher XPS system with 150 W Al Ka radiation at 1486.6 eV; the C1s 284.6 eV was used as a standard while determining the core level spectra of the constituents’ elements. Thermal and thermogravimetric analyses were performed to estimate the stability of the ZnMOF-BTA crystals using an STA 449 F5 Jupiter thermal analyzer. The crystals were heated at a rate of 10 °C/min in the air.

2.4. X-ray Crystallography

Single-crystal X-ray diffraction of ZnMOF-BTA was recorded on an XtaLAB AFC12 (RINC) Kappa single diffractometer (Rigaku, Japan) with Cu Kα radiation (λ = 1.54184 Å). The crystal was kept at 149.99(10) K during data collection. The data were processed and restored by the CrysAlisPro program using Olex2 software and empirical absorption correction using spherical harmonics, implemented in SCALE3 ABSPACK scaling algorithm. The structure was solved with the ShelXT [21] structure solution program using direct methods, and the ShelXL [22] refinement package was used to refine the coordinates of the non-hydrogen atoms and their anisotropic temperature factors using least-squares minimization. All hydrogen atom coordinates were obtained by theoretical hydrogenation. The SQUEEZE program was used to filter out highly disordered solvent molecules in the metal complex structure [23].

2.5. BTA Release

To understand the release rate of BTA molecules from the ZnMOF-BTA crystals, a UV-Vis spectrophotometer (Rayleigh UV-2100) was utilized. The concentration–absorbance curve of BTA was obtained by measuring the absorbance of different known concentrations of BTA in water. The suspension (50 mL) containing ZnMOF-BTA (0.05 g) was constantly stirred in a conical flask on a magnetic stirrer for different time periods ranging from 0 to 240 min. The BTA molecules were gradually released from the MOF with increasing time, and the concentration of BTA in the suspension was determined by the absorbance using UV-Vis spectroscopy within the range of 287–297 nm. The BTA release rate experiments were performed in water at room temperature.

2.6. Weight Loss Measurement

The weight loss experiment was carried out using procedures described in the literature. Q235 carbon steel specimens and extract solutions of ZnMOF-BTA were used for the weight loss measurements. The extract solutions were prepared by stirring a given amount of ZnMOF-BTA crystals in 1 M HCl solution for 6 h on a magnetic stirrer, after which the solution was left overnight and then filtered. The filtrates were used for the weight loss tests. Prior to all measurements, the specimens were mechanically polished with 400, 600, and 800 grades of emery papers, then washed with deionized water, degreased, and dried with ethanol. The polished carbon steel specimens were immersed in glass cells containing 1 M hydrochloric acid solution without and with different concentrations of ZnMOF-BTA extract for 24 h at 25 °C. The inhibition efficiency I . E w (%) was calculated using Equations (1)–(4) [24,25]:
Δ m = m 1 m 2
W = Δ m S T
θ = W c o r r o W c o r r W c o r r o
I . E w   = θ × 100
where m 1 and m 2 are the masses (g) of carbon steel samples before and after the corrosion test and the difference gives the weight loss Δm. S is the total area of carbon steel immersed in 1M hydrochloric acid solution (cm2); T is the immersion time (h); θ is the weight loss ratio; and W c o r r o and W c o r r are the corrosion rates (mg·cm−2·h−1) of carbon steel sheet in 1M hydrochloric acid solution without and with different concentrations of ZnMOF-BTA extract, respectively [26,27].

2.7. Electrochemical Tests

The electrochemical tests were carried out using a Gamry reference 600 potentiostat/galvanostat piloted by the Gamry Echem analyst software, and extract solutions of ZnMOF-BTA were used. The tests were carried out at room temperature; the potentiostat was connected to a three-electrode cell consisting of a saturated calomel electrode (reference electrode), platinum plate electrode (counter electrode), and carbon steel substrates (working electrode). The surface area exposed to the electrolyte was 1.0 cm2. The potentiodynamic measurements were carried out by an upward sweep from the cathodic to the anodic region within a potential range from −700 mV/SCE to −300 mV/SCE at a scan rate of 0.333 mV/s. Before all experiments, the potential was stabilized at free potential by measuring the open circuit potential for 30 min. The corrosion inhibition efficiency was assessed from the corrosion current density values using the Tafel extrapolating method. The inhibition efficiency I . E p (%) obtained from the polarization measurements was calculated according to Equation (5) [28].
I . E p   =   i c o r r o i c o r r i c o r r o   × 100
where i c o r r o and i c o r r are the corrosion current densities in the absence and presence of the inhibitor.
Electrochemical impedance spectroscopy (EIS) measurements were carried out with the electrochemical system at open circuit potential (EOCP) at frequencies between 100 kHz and 10 mHz at an amplitude of 10 mV. EIS measurements were taken after stabilizing the system for 0.5 h at 298 K. The EIS results were fitted using the ZView software [29] to obtain desired electrochemical parameters. The corrosion inhibition efficiency I . E z (%) was determined using Equation (6) [30].
I . E z =   R p R p o R p   × 100
where R p o and R p are the polarization resistances of carbon steel in 1 M hydrochloric acid solution without and with different inhibitor concentrations, respectively.

3. Results and Discussion

3.1. Characterization of ZnMOF-BTA

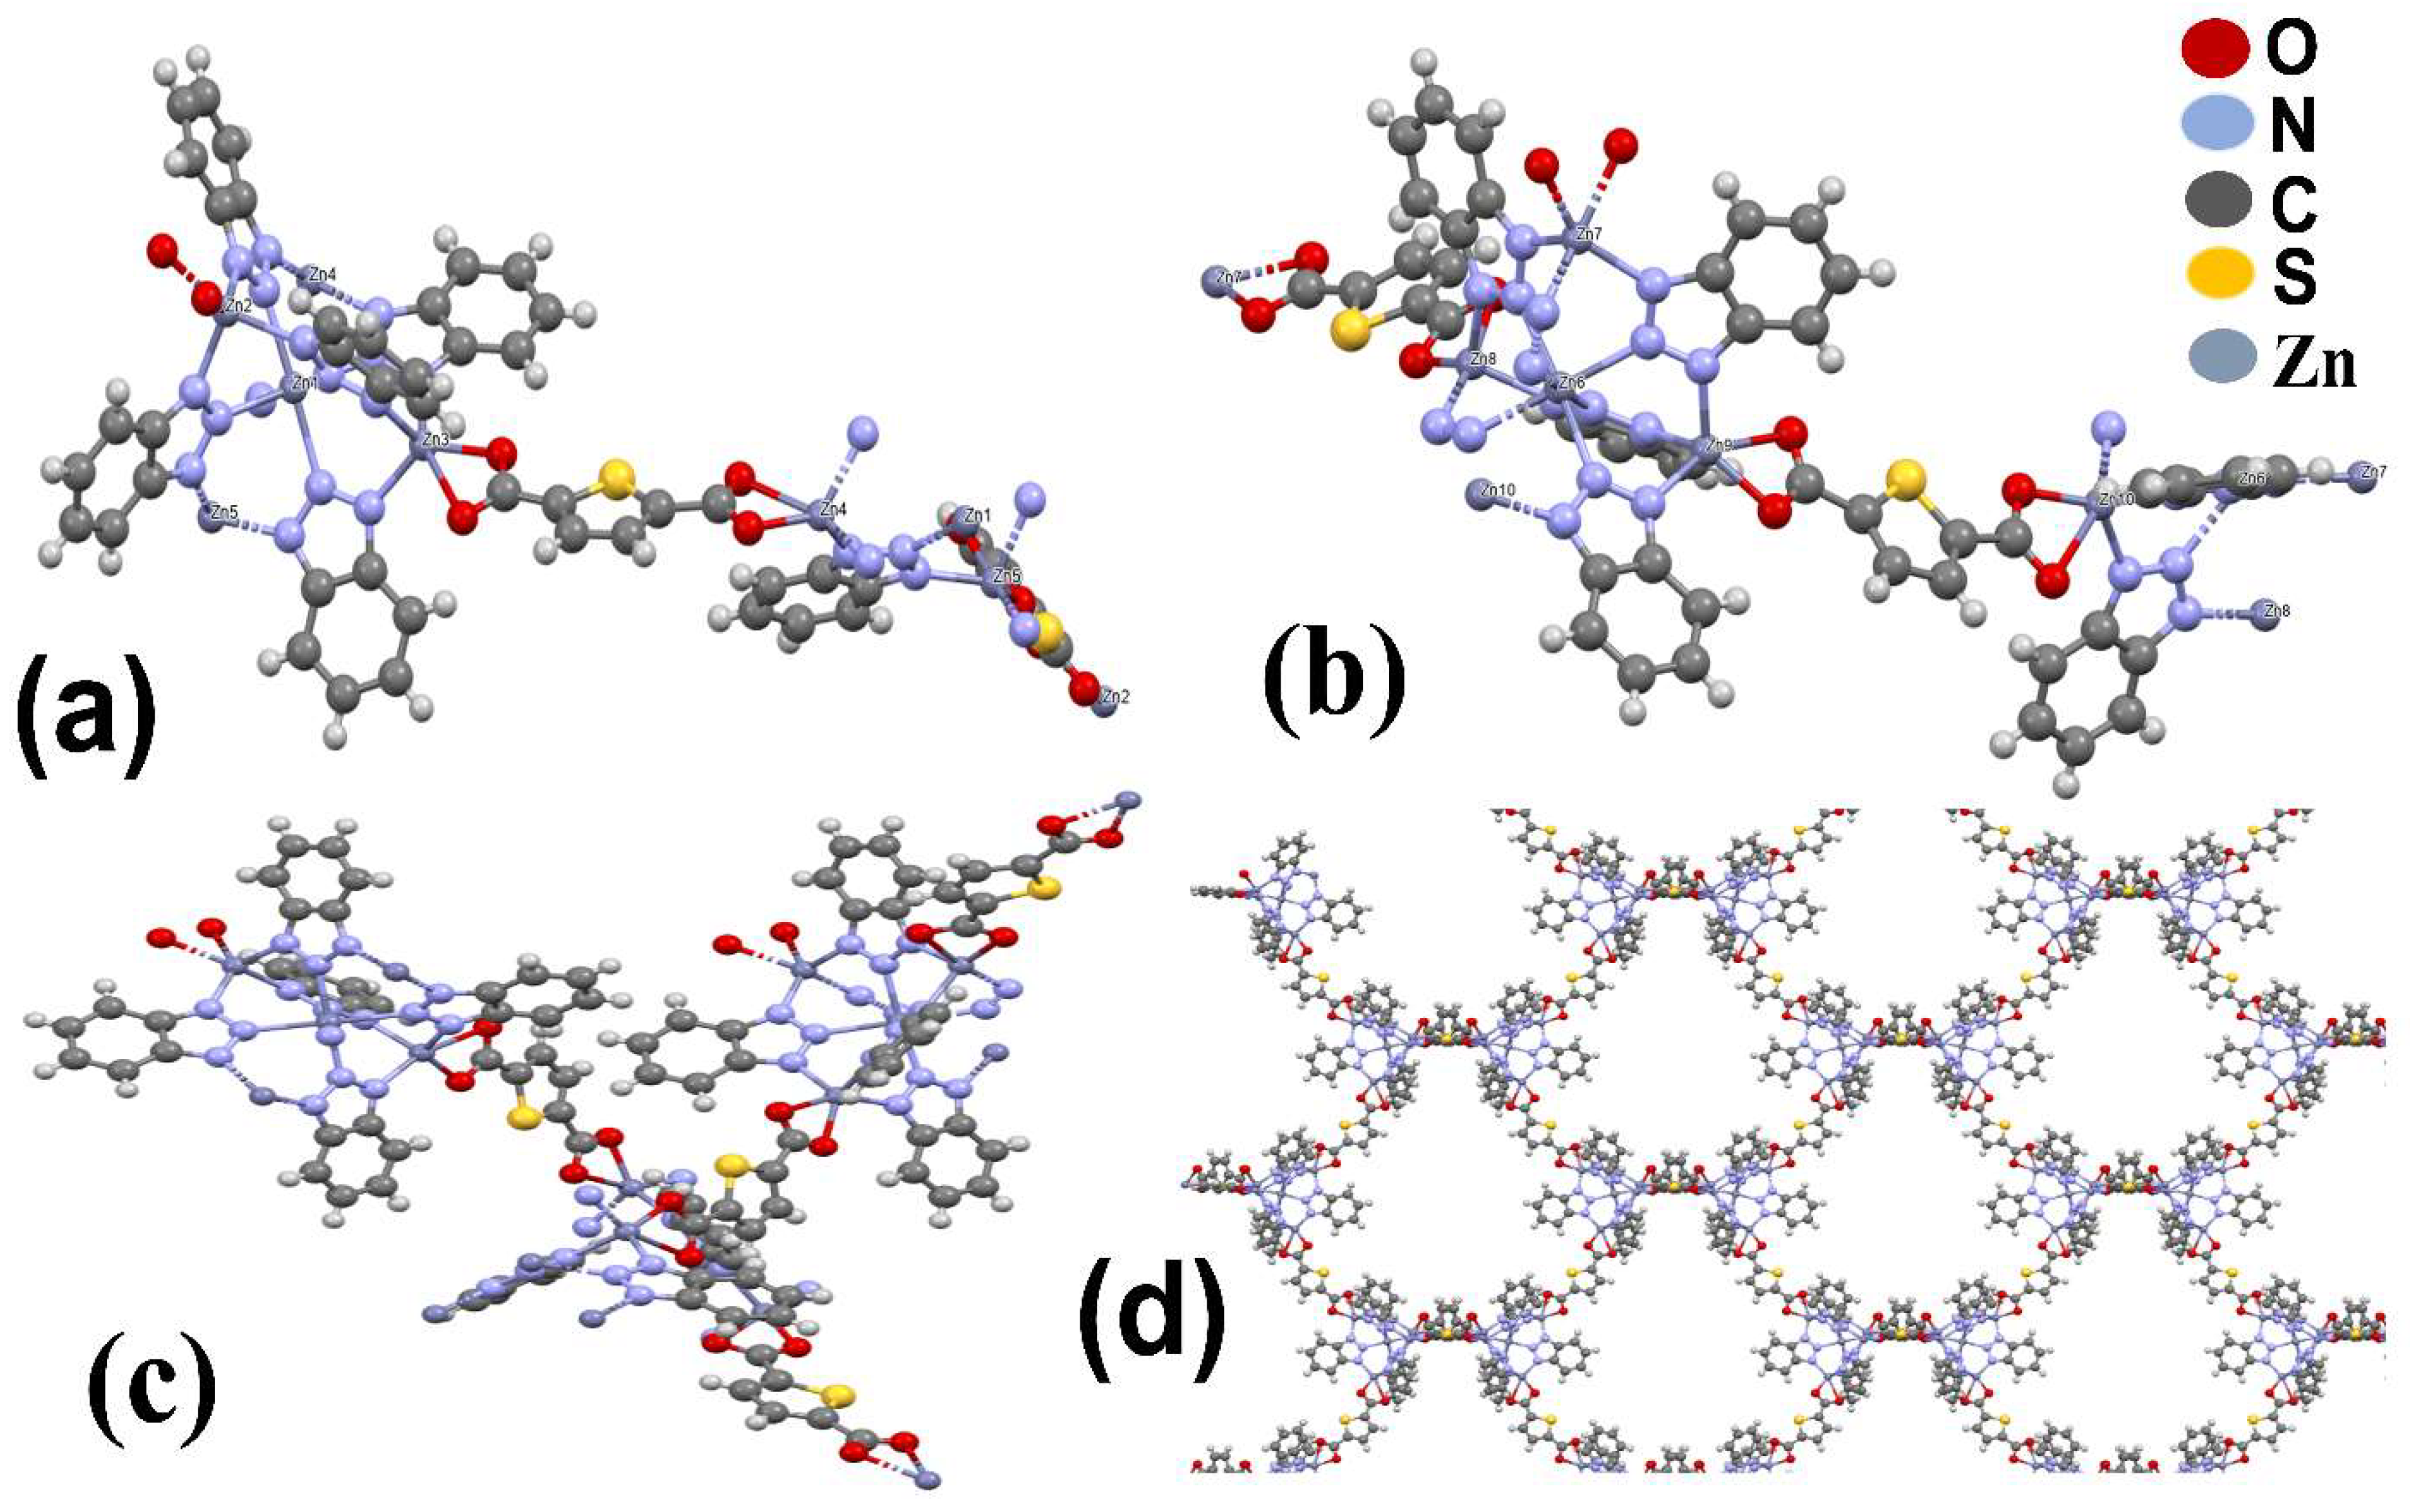
3.1.1. Crystal Structure

The asymmetric unit of the ZnMOF-BTA molecule reveals a stoichiometric ratio of 5:6:2 for Zn(II) ions, BTA, and TDC2− ligands (Figure 2a,b). Single-crystal X-ray diffraction investigation showed that ZnMOF-BTA crystallizes in the monoclinic crystal system and belongs to C12/c1 space group. The crystallographic data, collection procedures, and refinement results of ZnMOF-BTA are listed in Table 2.
A dimer molecule with each asymmetric monomer unit consisting of five zinc atoms, six BTA molecules, and two TDC2− ligand molecules is found to be the fundamental building block of the ZnMOF-BTA framework. Each asymmetric unit of the ZnMOF-BTA dimer molecule consists of five crystallographic independent Zn (II) ions coordinated with six BTA molecules and two TDC2− (2,5-thiophene dicarboxylate) ions, all having one site occupancy. As shown in Figure 2a, the Zn (II) ions have two different types of coordination; Zn1 atoms are six-coordinated, and the remaining Zn(II) ions (Zn2, Zn3, Zn4, and Zn5) atoms are five-coordinated, adopting octahedral [ZnN6] and square pyramidal [ZnN3O2] distorted coordination environments, respectively. Each Zn1 atom is coordinated with six nitrogen atoms, each from the six different BTA ligand molecules, while each of the Zn2, Zn3, Zn4, and Zn5 atoms are surrounded by three nitrogen atoms, each from three different BTA ligand molecules, and two carboxylate oxygen atoms from one TDC2− ligand. Each Zn2, Zn3, Zn4, and Zn5 atom is coordinated by two carboxylate oxygen atoms from one individual TDC2− ligand at the basal positions with one BTA molecule in the apical position and two other BTA molecules in the basal positions. A similar coordination mode is seen in the complementary monomer unit where Zn6, Zn7, Zn8, Zn9, and Zn10 atoms have the same coordination as that seen with Zn1, Zn2, Zn3, Zn4, and Zn5 atoms, respectively (Figure 2b).
The Zn−N bond lengths range from 2.004 (36) to 2.2424 (39) Å while those of Zn−O range from 1.9401 (30) to 2.5700 (50) Å, both of which fall into the normal bond length ranges of Zn−N and Zn−O bonds [31]. In addition, the bond angles around Zn (II) centers range from 29.639 (164) to 179.642 (159)°. Some selected bond lengths and angles are shown in Table 3. It is worth mentioning that in the ZnMOF-BTA framework, two carboxyl groups of the TDC2− ligand and the amine NH group of the BTA ligand are all deprotonated, with the TDC2− ligand assuming a μ2-kO’,O’:kO”,O” coordination mode, bridging two Zn(II) ions in bis-O,O-chelating fashion as shown in Figure 2a,b. There are several of these four slightly different TDC2− coordination modes, bridging numerous Zn2 and Zn5, Zn3 and Zn4, Zn7 and Zn 8, and Zn 9 and Zn10 ions that constitute the entire metal–organic framework.
An X-ray diffraction (XRD) experiment was performed on the synthesized ZnMOF-BTA crystals at ambient temperature to confirm whether the crystal structures are actually representative of the bulk materials. Figure 3 shows the XRD patterns for BTA, H2TDC, Zn(NO3)2.6H2O, simulated XRD, and ZnMOF-BTA crystals. The as-received BTA shows a high degree of crystallinity with prominent peaks at 2θ = 14.98°. 15.4°, 20.26°, 24.35°, 25.97°, and 27.88° indicating the crystalline layers of BTA in the monoclinic crystal structure (PDF #32-1536). In addition, the XRD pattern of H2TDC shows characteristic peaks at 2θ = 15.4°, 17.04°, 26.2°, and 32.71° (PDF #38-1723). The XRD pattern of ZnMOF-BTA shows the characteristic peaks on BTA, H2TDC, and Zn(NO3)2.6H2O compounds indicating that BTA, H2TDC, and Zn2+ were successfully utilized in the synthesis of the ZnMOF-BTA framework via the solvothermal process. The peaks in the experimental XRD patterns are similar to those in the simulated patterns from single-crystal diffraction data, which shows the phase purity of the synthesized crystals. The differences in intensity are most likely due to the crystalline powder samples’ preferred orientation. ZnMOF-BTA shows no signs of crystal degradation during X-ray data collection, indicating that the compound is stable at ambient temperature. The XRD data were analyzed with MDI Jade 6 software, and the result revealed that the synthesized ZnMOF-BTA crystals belong to the monoclinic crystal system and C2/c (15) space group (PDF#41-1362), which is consistent with the result of the single-crystal X-ray diffraction.

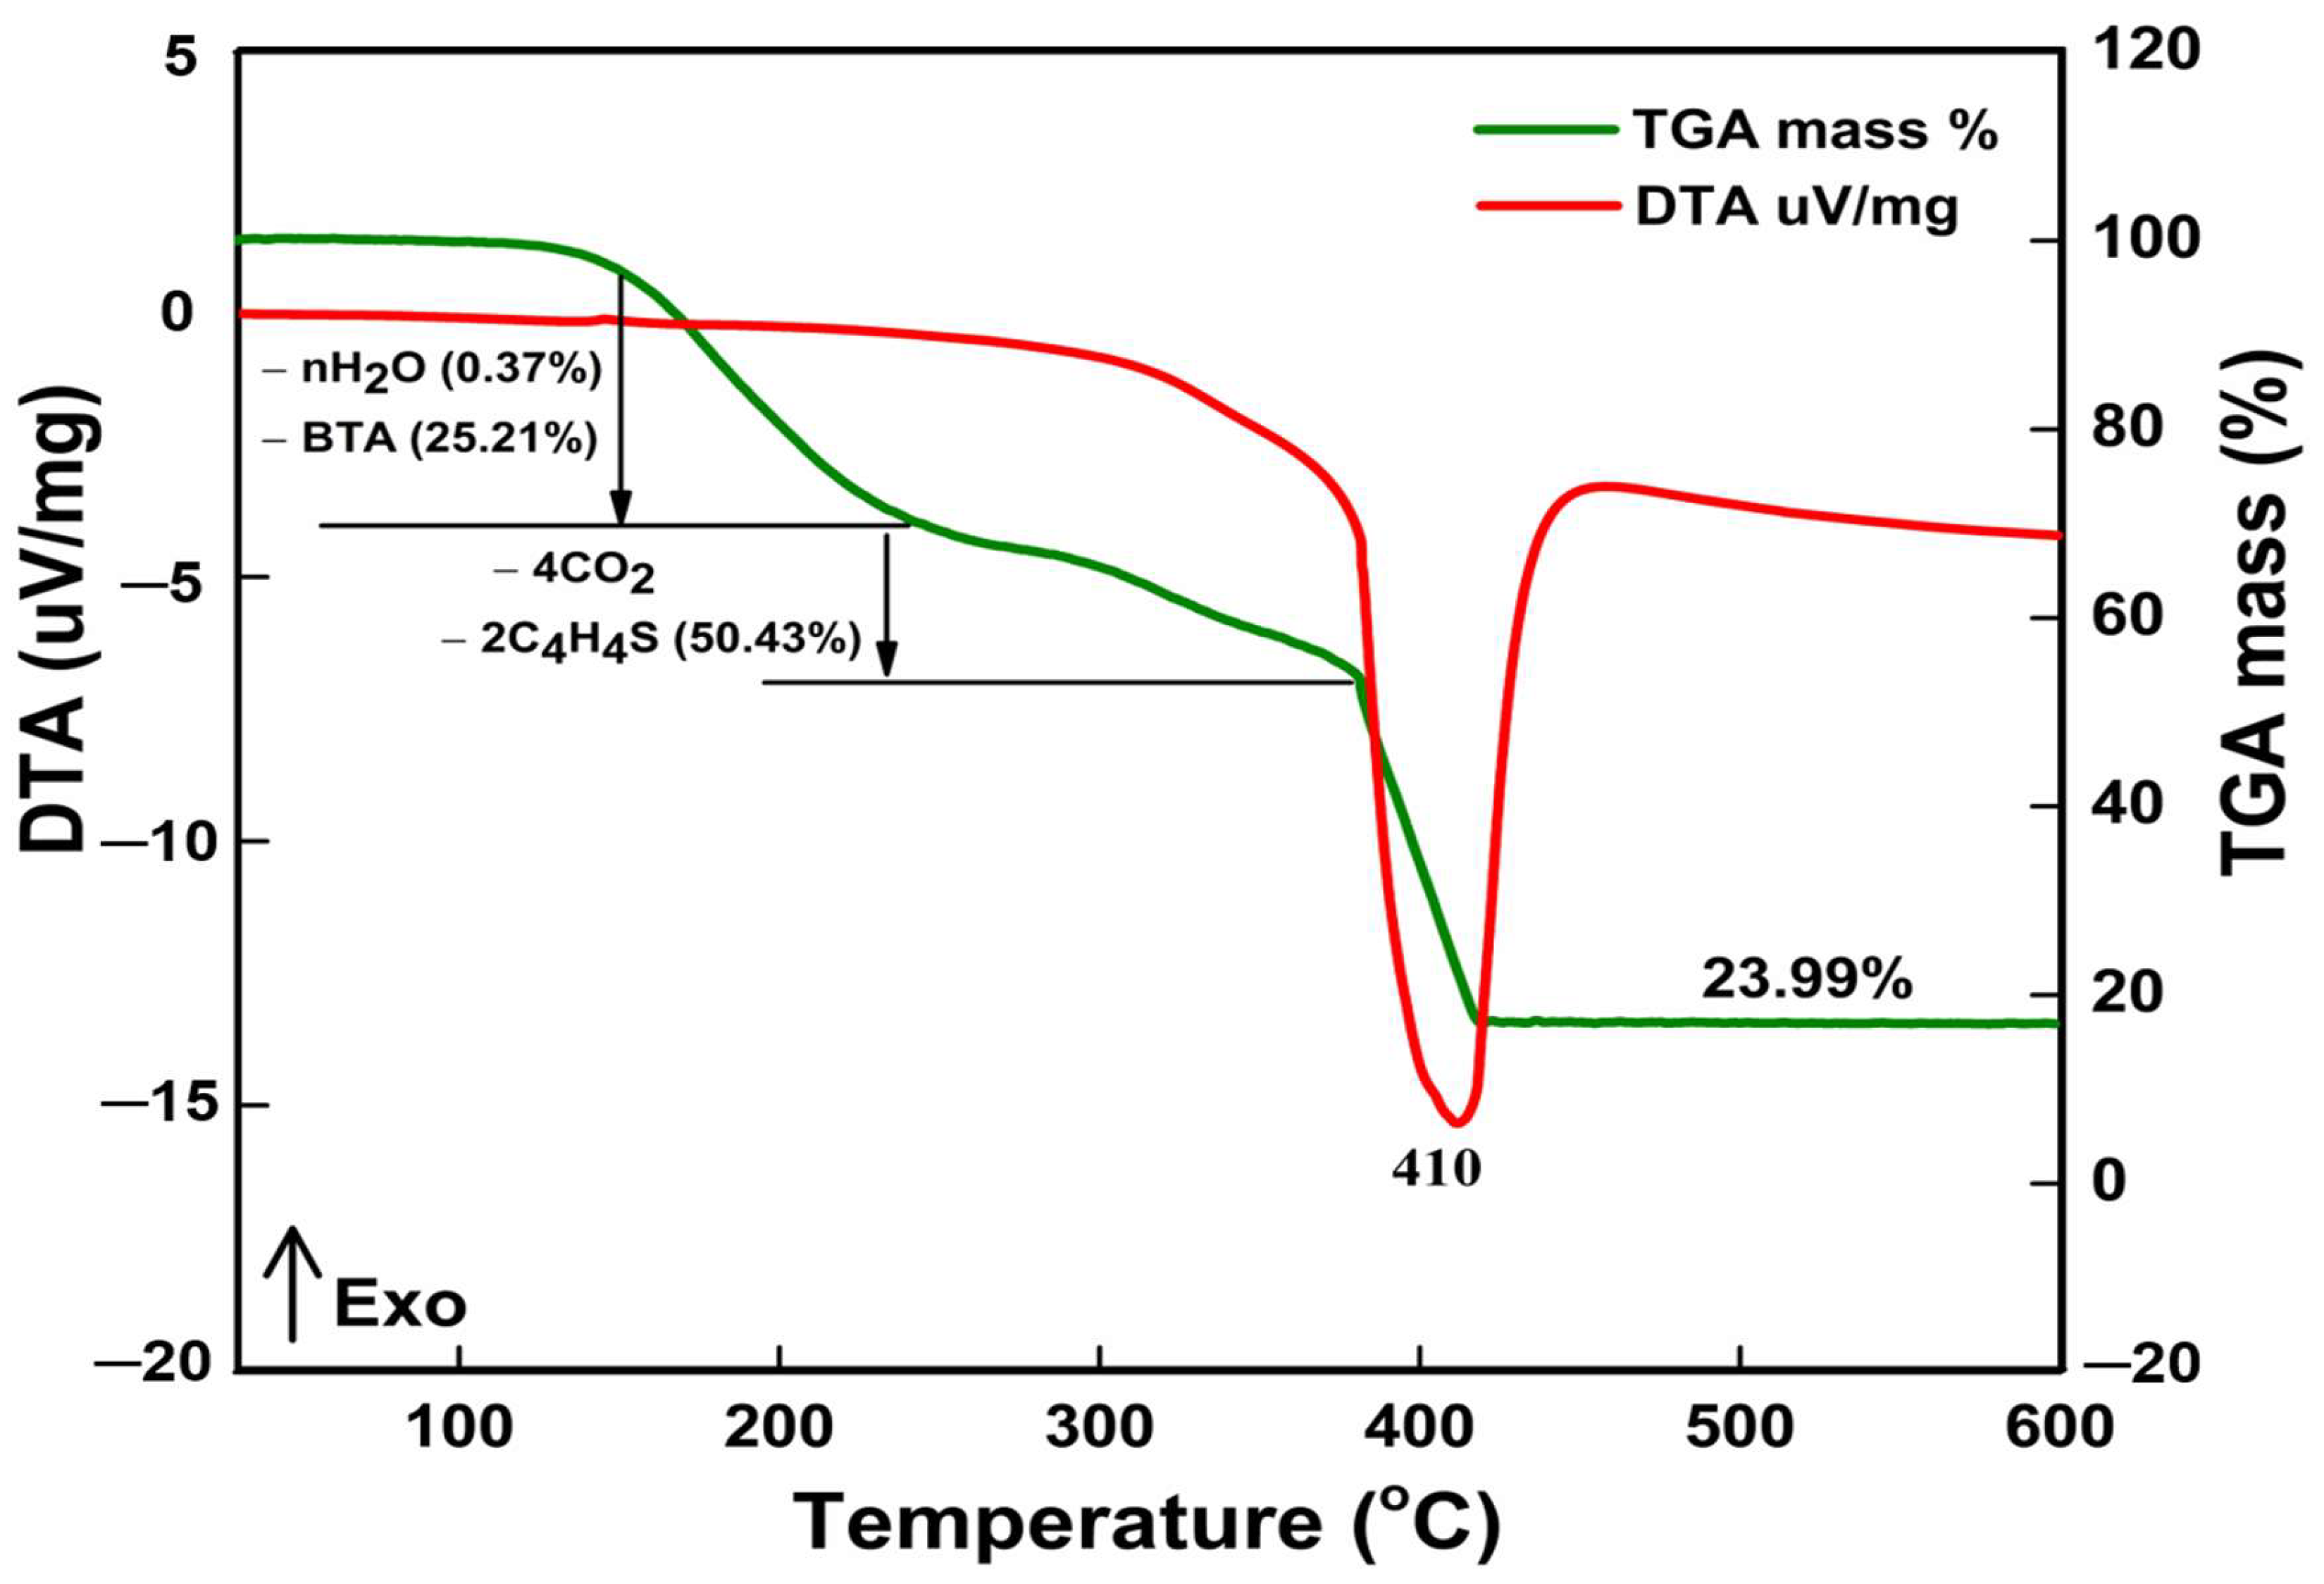
3.1.2. FTIR, XPS, and Thermal Stability Analyses

Figure 4 shows the IR spectra of BTA, H2TDC, and ZnMOF-BTA, which reveal the prominent chemical bonds present in the synthesized metal–organic frameworks. In the spectrum of ZnMOF-BTA, metallic–oxygen bands are observed at 435 cm−1 and 463 cm−1 and are assigned to stretching vibrations of Zn-O bonds in the MOF [32], and bands observed at 745 cm−1 and 753 cm−1 correspond to the characteristic signals of the C−H in-plane bending vibrations of the benzotriazole and benzene rings. Bands are also observed at 1000 cm−1 and 1100 cm−1 corresponding to N−H out-of-plane bending vibrations of the triazole rings. Furthermore, there are C=N stretching bands of triazole rings observed at 1210 cm−1 and 1248 cm−1, while signals of C=C stretching aromatic weak bands are also observed at 1363 cm−1 and 1530 cm−1 in the MOF [33]. At 1715 cm−1, there is a stretching vibration of the carbonyl group observed in the spectrum of the ZnMOF-BTA [34]. These bands are also observed in the spectra of BTA and H2TDC, as shown in Figure 4, which shows that BTA and H2TDC compounds were successfully used in the synthesis of the MOF framework.
Weak bands observed at 2950cm−1, 3050 cm−1, and 3100 cm−1 in the BTA and H2TDC spectra were also observed and assigned to sp2 C-H stretching in the ZnMOF-BTA spectrum. The ZnMOF-BTA curve also revealed that the N-H stretching bands (2710 cm−1, 2790 cm−1) and OH stretching broad bands (2521cm−1, 2638 cm−1) vividly present in BTA and H2TDC spectra, respectively, are absent in the ZnMOF-BTA spectrum as the amine groups of the BTA molecules and oxygen of the OH groups of the carboxylic acid are coordinated with Zn (II) ions within the ZnMOF-BTA framework and thus absent in the spectrum [35].
An X-ray photoelectron spectroscopy technique was used to investigate the chemical elements and the binding states of the as-synthesized ZnMOF-BTA crystals. Figure 5a shows the complete XPS survey spectra, which demonstrate the existence of sulfur, nitrogen, oxygen, carbon, and zinc species in the ZnMOF-BTA crystals, with surface concentrations of 3.22 at %, 7.38 at %, 18.07 at %, 69.39 at %, and 1.94 at %, respectively. As seen in Figure 5b, the Zn2p XPS scan exhibited doublet peaks of Zn 2p1/2 and Zn 2p3/2 at 1043.8 and 1020.9 eV, respectively, which could be ascribed to the Zn2+ oxidation state belonging to Zn−O and Zn−N bonds in the ZnMOF-BTA framework [36]. The spectrum of C1s (Figure 5c) demonstrated four peaks at 284.4, 285.2, 286.7, and 288.9 eV corresponding to sp2 C−C, C−S, sp2 C−N, and C=O, respectively [37,38].
Figure 5d depicts the S2p spectrum, which can be fitted into two main high-intensity peaks at 163.9 eV and 164.9 eV corresponding to the binding energies of C−S (thiol, R−SH group) in the ZnMOF-BTA framework [39]. The spectrum of O1s (Figure 5e) demonstrated two peaks at 529.46 and 530.77 eV corresponding to Zn–O and C=O, respectively [40]. In the N1s spectrum (Figure 5f), the peak could be deconvoluted into two Gaussian peaks. The peak at 396.6 eV indicates the presence of Zn–N bonds, and that at 397.7 eV can be ascribed to sp2 hybridized N (C=N groups) in the as-synthesized ZnMOF-BTA powder [41].
The thermal properties of ZnMOF-BTA crystals were analyzed to ascertain their thermal stability using differential thermal analysis (DTA) and thermogravimetric analysis (TGA) of the crystals. TGA and DTA curves of ZnMOF-BTA are depicted in Figure 6. In the DTA curve, the exothermic peak at 410 °C is attributed to the sample’s melting point, and the curve demonstrated that there is no phase transition until the material melts, extending the temperature range for the crystal’s utility in many applications. Furthermore, close to the melting point of the sample, there is no breakdown. This guarantees that the material is suitable for use in lasers, where the crystals must survive extremely high temperatures. The sharpness of the endothermic peak indicates that the grown sample has a high degree of crystallinity [35].
In the TGA curve, two major weight losses were observed during the exothermic decomposition process. The first weight loss occurred between 95 and 220 °C and was attributed to the loss of trapped water (solvent) molecules within the ZnMOF-BTA framework at 95–118 °C which represents a 0.37% weight loss and the loss of coordinated BTA molecules of the ZnMOF-BTA at 119–220 °C, representing a weight loss of 25.21% [42]. The other weight loss was found between 230 and 400 °C and was attributed to the decomposition of the organic moiety (TDC2−) of the ZnMOF-BTA framework which corresponds to the loss of CO2 molecules and the organic moiety -C4H4S, representing a weight loss of 50.43% [40]. Further increase in the temperature above 400 °C led to the breakdown of the MOF framework at 410 °C and formed its metal oxide (ZnO) representing 23.99% of the residual mass. The summary of thermal analysis results of ZnMOF-BTA crystals is shown in Table 4. The TGA and DTA results show that ZnMOF-BTA crystals have good crystalline quality and excellent thermal stability [42,43].

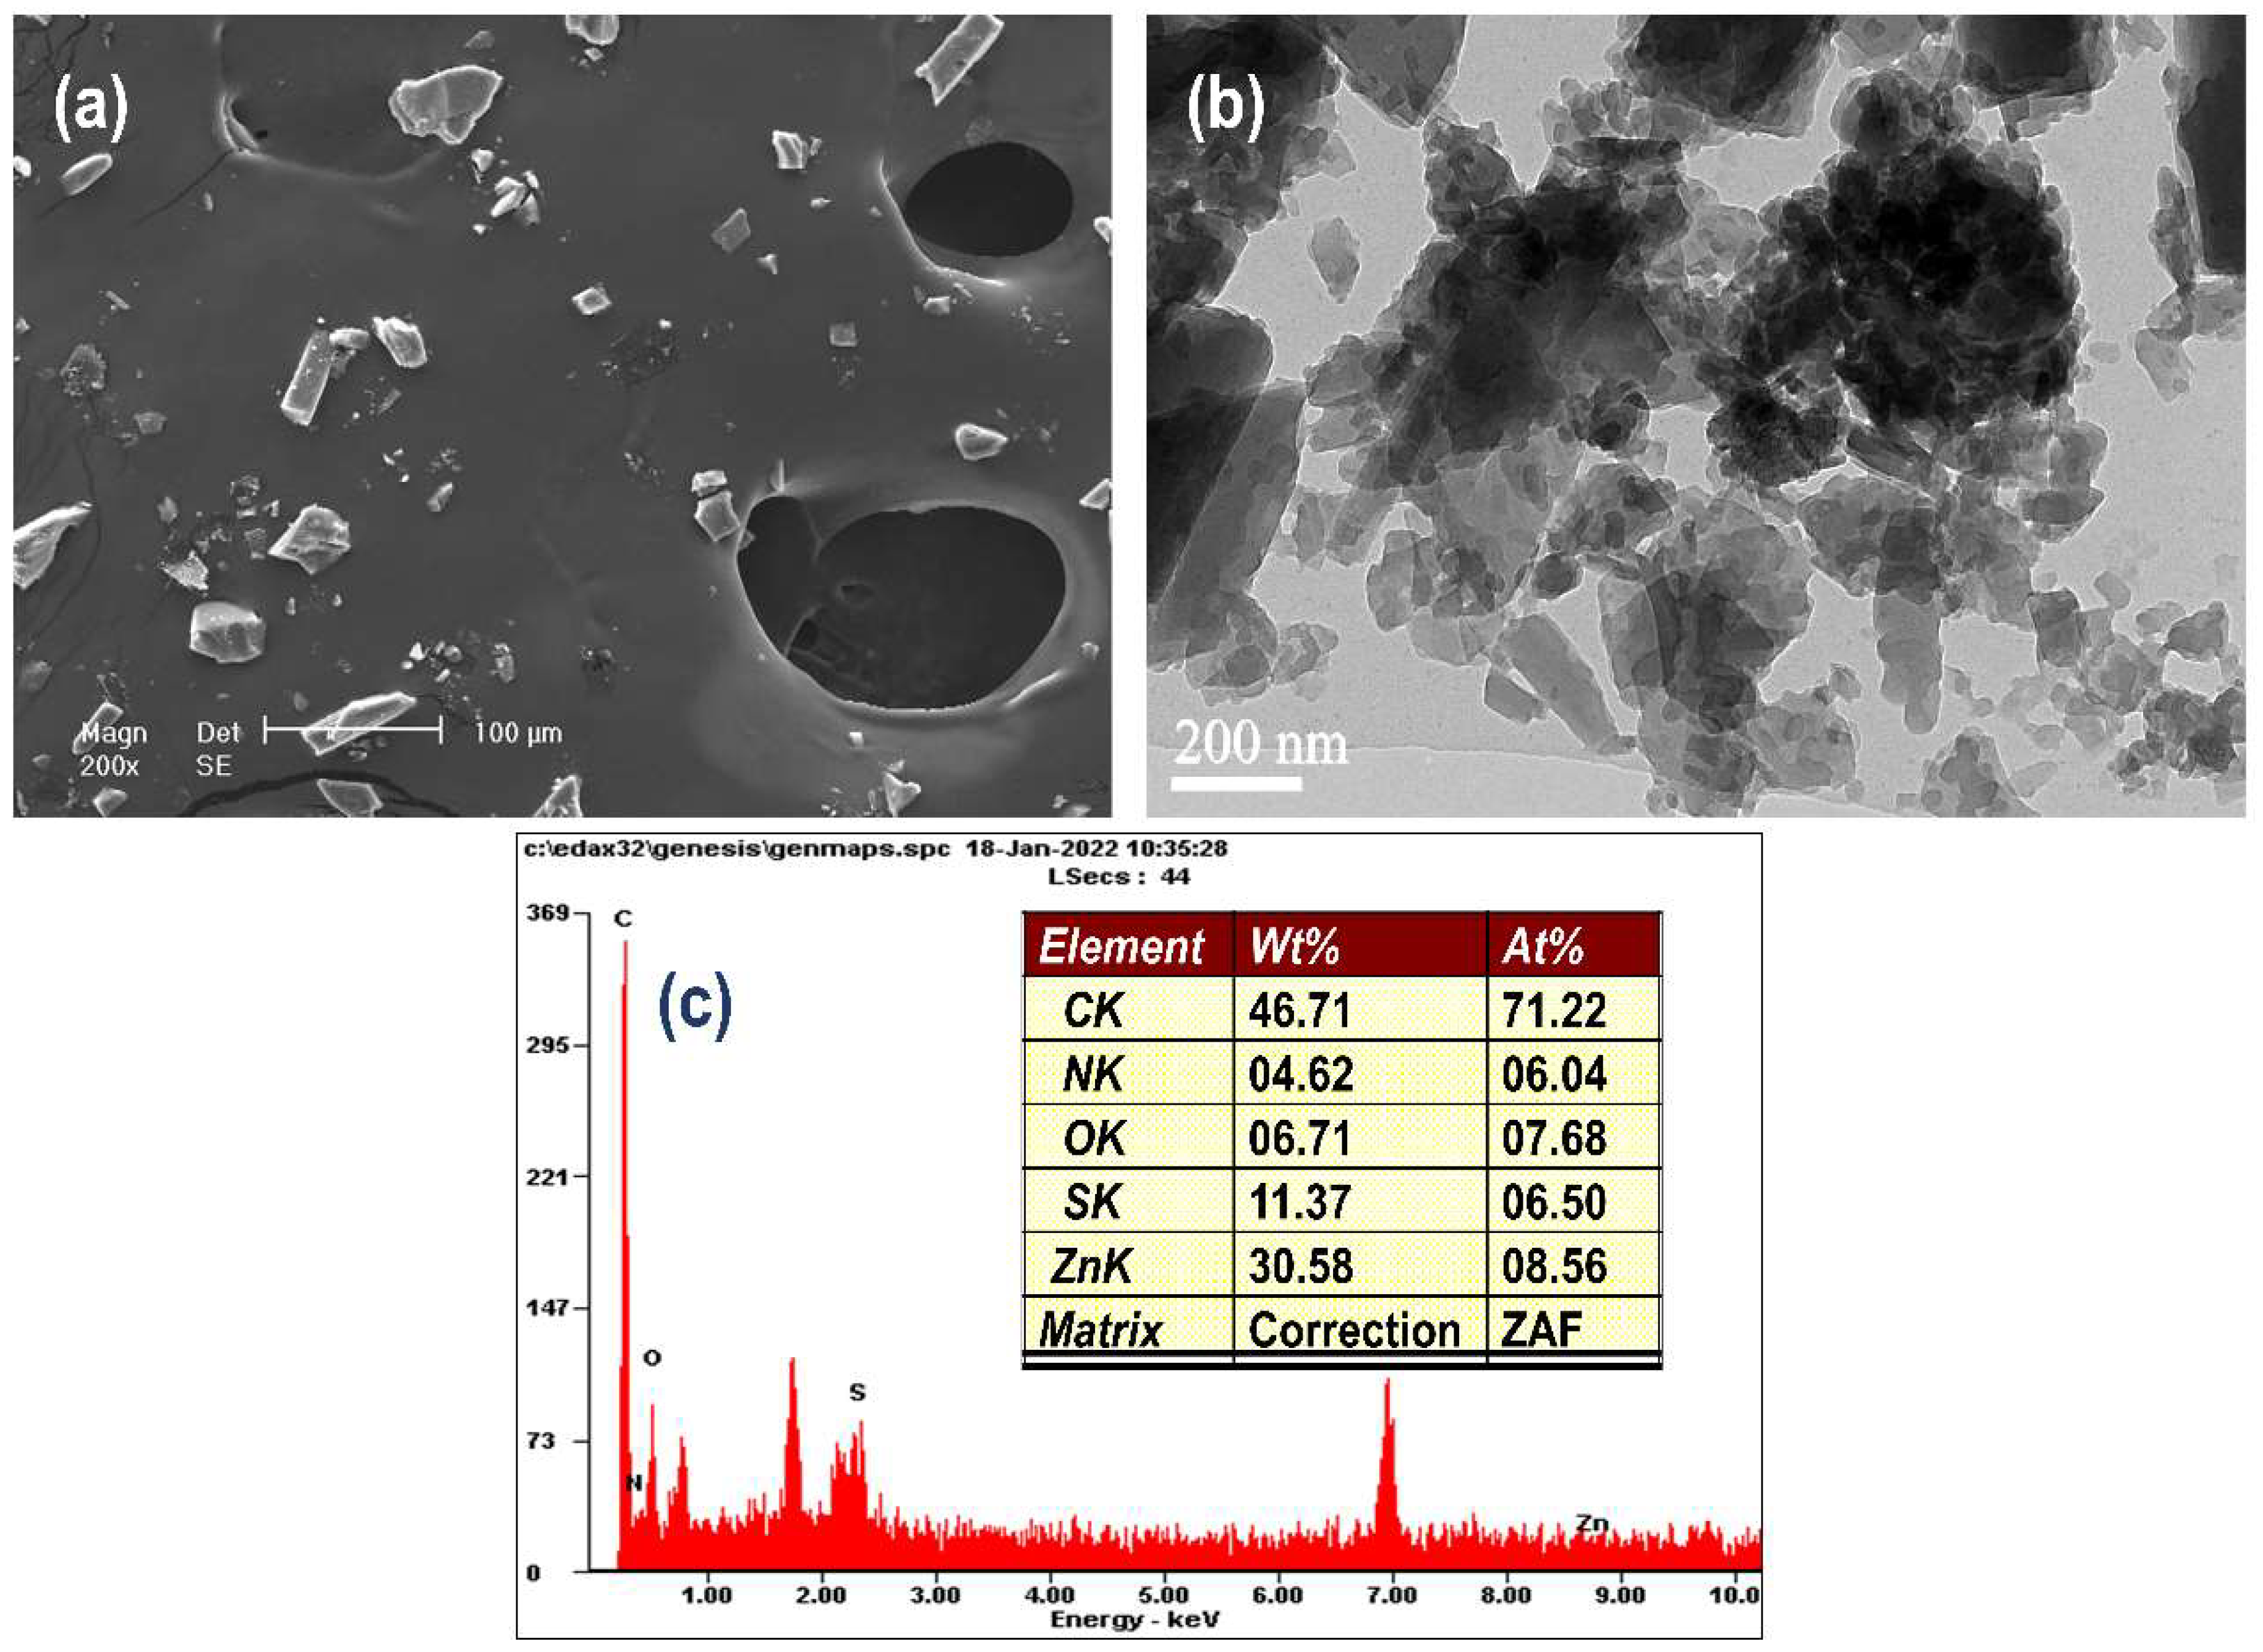
3.2. Crystal Surface Morphology Analysis

Figure 7a shows the surface morphology of ZnMOF-BTA crystals as observed by SEM. As shown in the figure, ZnMOF-BTA crystals showed uneven crystalline particles of varying shapes and sizes. The outer surfaces have some degree of roughness, and they are not closely packed together. Figure 7b shows the TEM image of the synthesized ZnMOF-BTA. The image also revealed that the MOF particles have non-uniform structures of different sizes and shapes and are non-closely packed. EDS data in Figure 7c shows the percentage composition of each element present in the ZnMOF-BTA compound.

3.3. BTA Release from ZnMOF-BTA

In aggressive media, a uniform release rate of an inhibitor compound provides a longer anticorrosion period for functional materials [44]. To better understand and assess the release process of BTA from the ZnMOF-BTA, UV-Vis spectroscopy was employed to observe the variation in the release rate by means of absorbance. The concentration–absorbance curve of BTA (different known concentrations of BTA in water) was used as a standard to observe the concentration of BTA released by the synthesized ZnMOF-BTA in solution. The absorbance of BTA extracted from ZnMOF-BTA crystals in NaCl solution was then converted into concentration via the fitting equation of the BTA standard curve. The results of the fitted time–concentration curve of BTA extracts from ZnMOF-BTA show that the release rate of BTA by ZnMOF-BTA is 6.39 × 10⁻⁴ g/h, which clearly illustrates that the BTA molecules were uniformly released from the MOF compound and thus provide longer anticorrosion protection [44].

3.4. Weight Loss Measurement

The weight loss of the carbon steel in the corrosive medium can be used to reflect its corrosion rate. The effect of different concentrations of ZnMOF-BTA additions was tested in 1M hydrochloric acid solution using weight loss measurements at 298K. The weight loss, corrosion rate, and inhibition efficiency I . E w (%) of ZnMOF-BTA are shown in Table 5. The weight loss results showed that the corrosion rate of carbon steel decreased with the increasing concentration of ZnMOF-BTA extract in the hydrochloric acid solution. The ZnMOF-BTA extract exhibited a maximum   I . E w (%) value of 94.94% at 6.0 wt.% concentration. This may be attributed to the presence of several nitrogen heteroatoms and aromatic rings of the BTA molecules released by the ZnMOF-BTA in hydrochloric acid solution, which adsorbs on the carbon steel surface to form a protective barrier [45]. The results showed that adding ZnMOF-BTA to 1M hydrochloric acid solution inhibits corrosion processes and protects carbon steel from degradation. The results also revealed that the inhibition efficiency of ZnMOF-BTA is greater than the inhibition efficiencies of some MOFs reported in the literature [46].

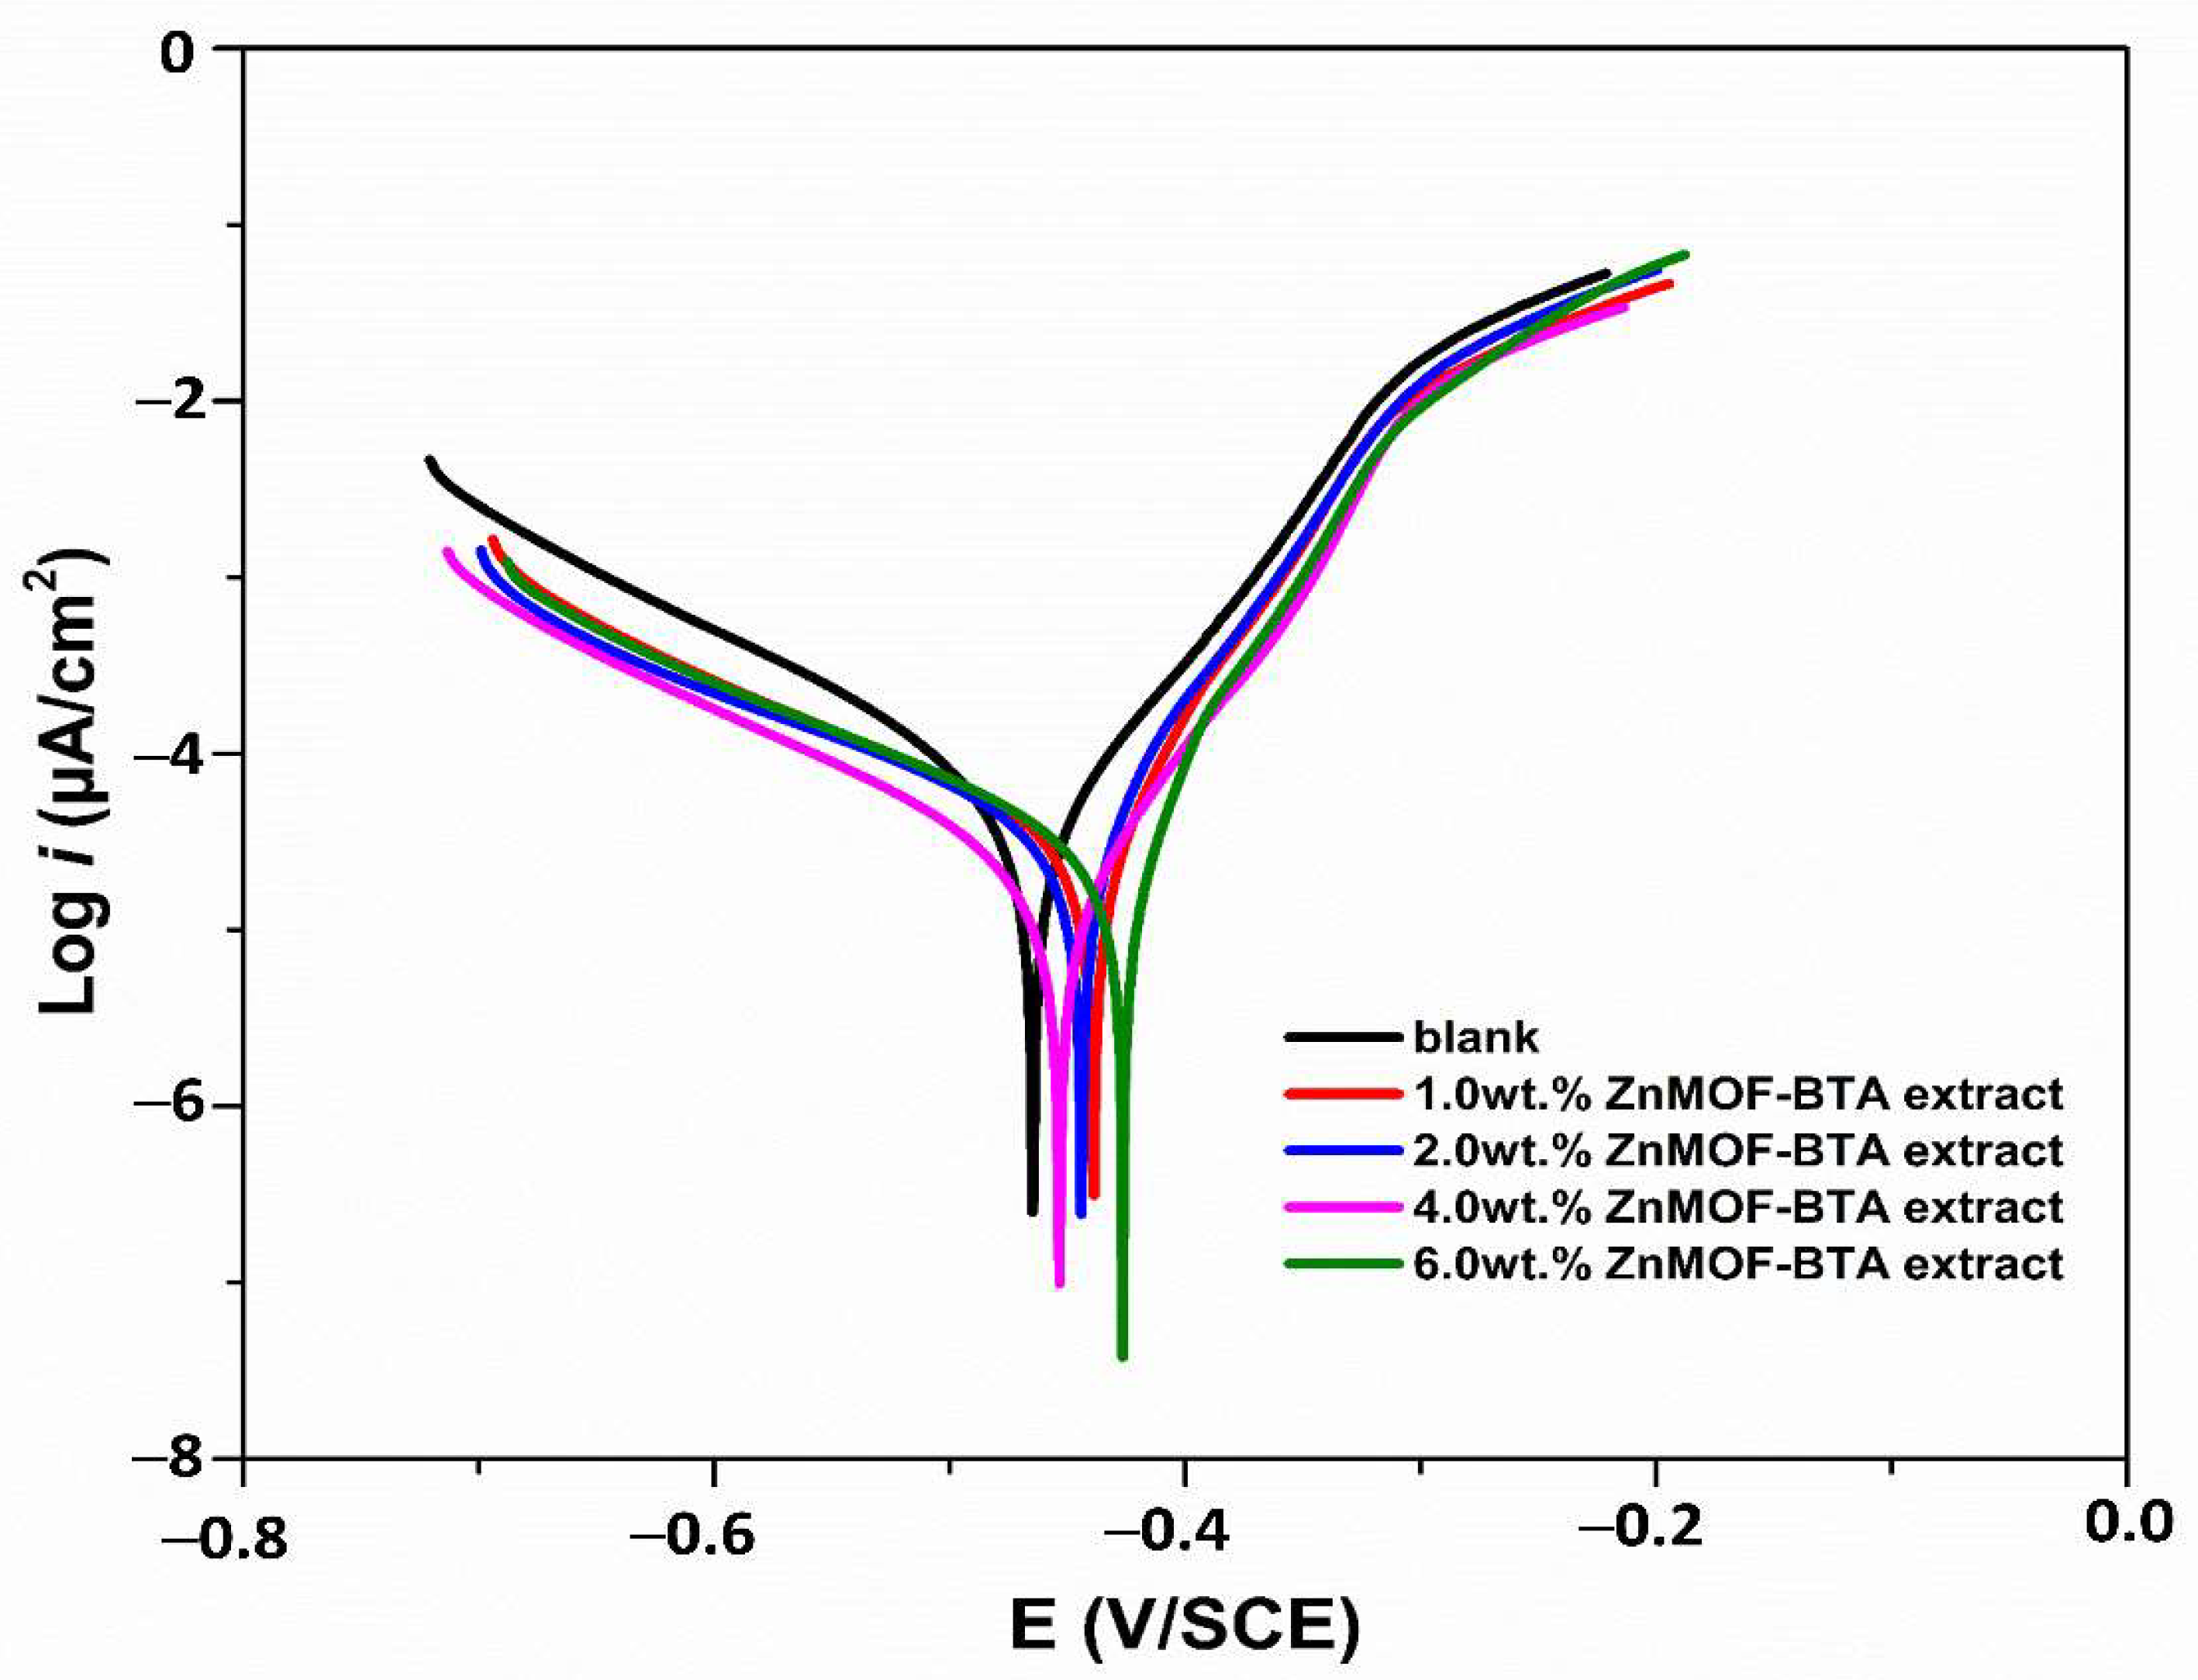
3.5. Potentiodynamic Polarization Test

Figure 8 shows the potentiodynamic polarization curves at 298 K of carbon steel in the absence and presence of different concentrations of ZnMOF-BTA extract. The corrosion parameters such as corrosion potential (Ecorr), anodic Tafel slope (βa), cathodic Tafel slope (βc), and the corrosion current densities (icorr) were obtained by extrapolating the Tafel slope [47] and are shown in Table 6. The percentage inhibition efficiency I . E p (%) and the surface coverage (θ) were calculated using Equation (5). Figure 8 shows a shift of both anodic and cathodic curves to lower current densities on the addition of the ZnMOF-BTA extract; this indicates that ZnMOF-BTA extract reduces the corrosion rate of carbon steel. The decrease in corrosion rate is likely because of the adsorption of the inhibitor (BTA) molecules on the carbon steel surface [48]. As observed, the Ecorr shifted to less negative values. In addition, ZnMOF-BTA is seen to reduce the anodic and cathodic reactions to nearly the same extent. The adsorption of the inhibitor via active sites probably results in the decrease observed in the anodic or cathodic reaction [7].
Table 6 shows the corrosion parameters of carbon steel in the presence and absence of ZnMOF-BTA; as the inhibitor concentration is increased, the icorr decreases and the inhibition efficiency increases. In fact, when the inhibitor was added, the slopes of the cathodic (βc) and anodic (βa) Tafel curves (Table 6) were slightly lowered, indicating that the ZnMOF-BTA merely blocks the accessible surface area. In other words, the inhibitor reduces the surface area of carbon steel exposed to corrosion while only inactivating a portion of the surface in relation to the corrosive medium [48]. As a result, ZnMOF-BTA can be classified as a mixed-type inhibitor.
Many factors influence the inhibition efficiency, including adsorption sites, method of interaction, molecular size, and structure [7,49]. The high inhibition efficiency observed may be due to the effect of the size, structure, and functional group of the inhibitor.

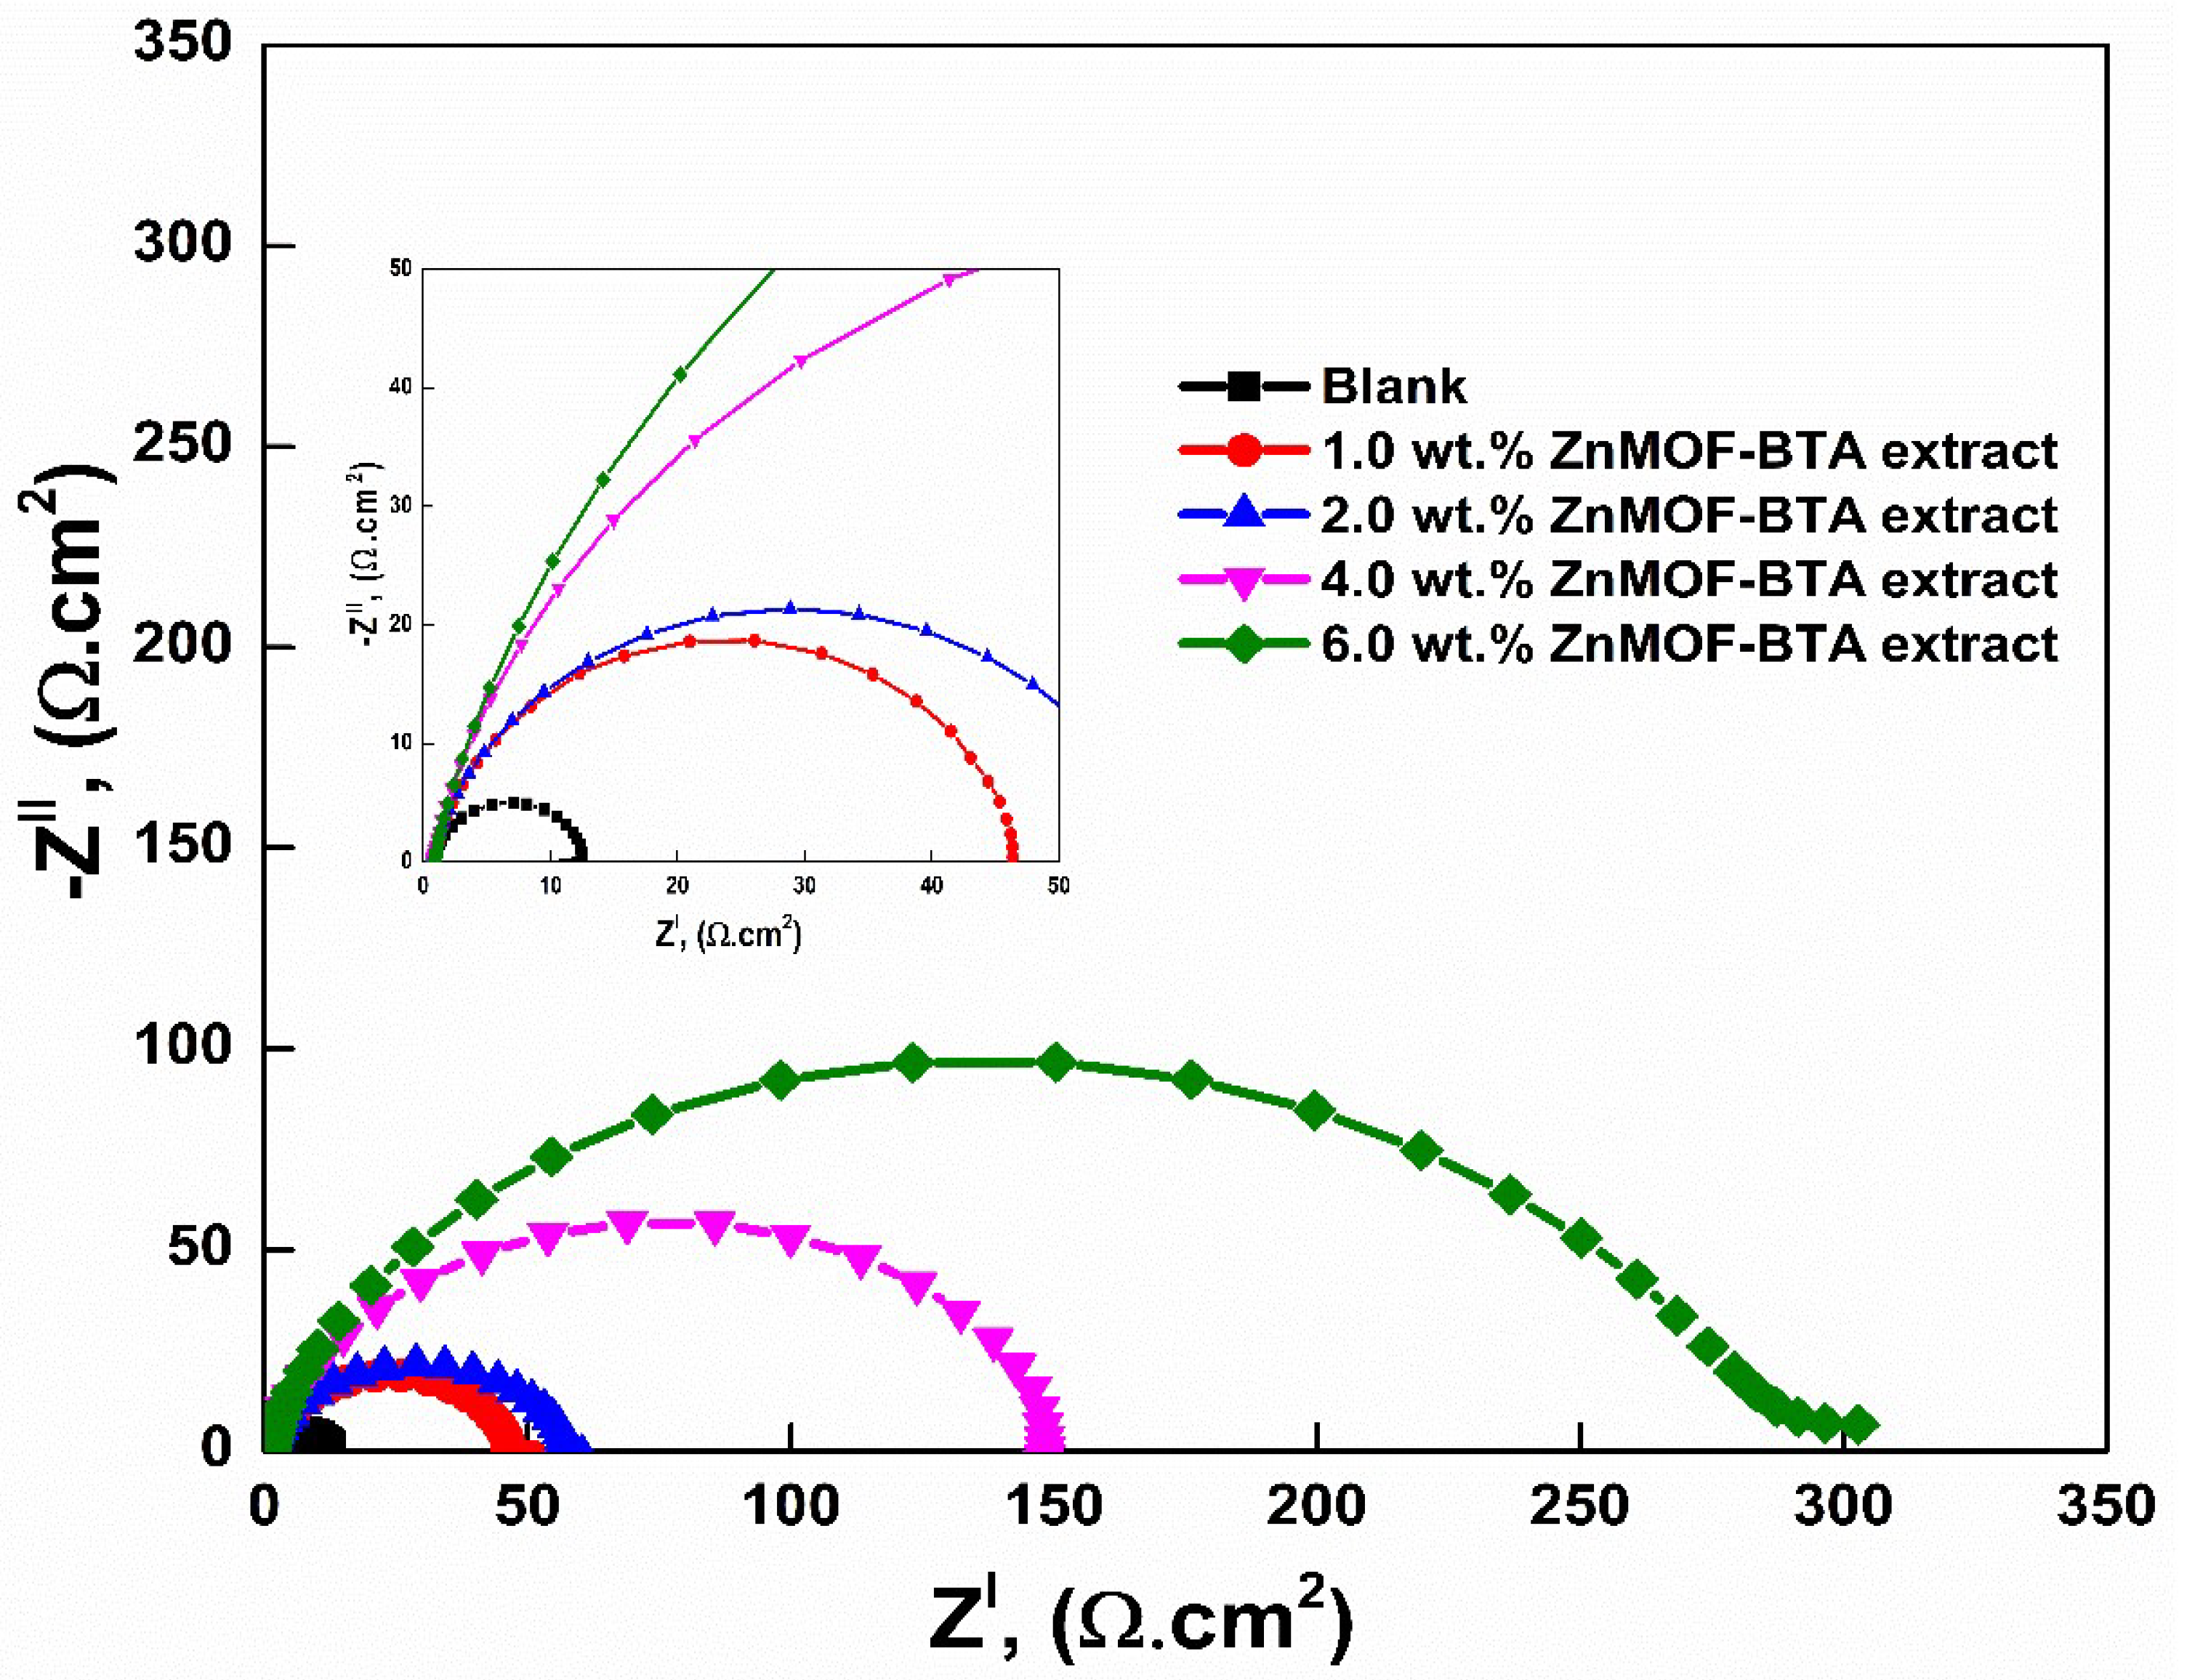
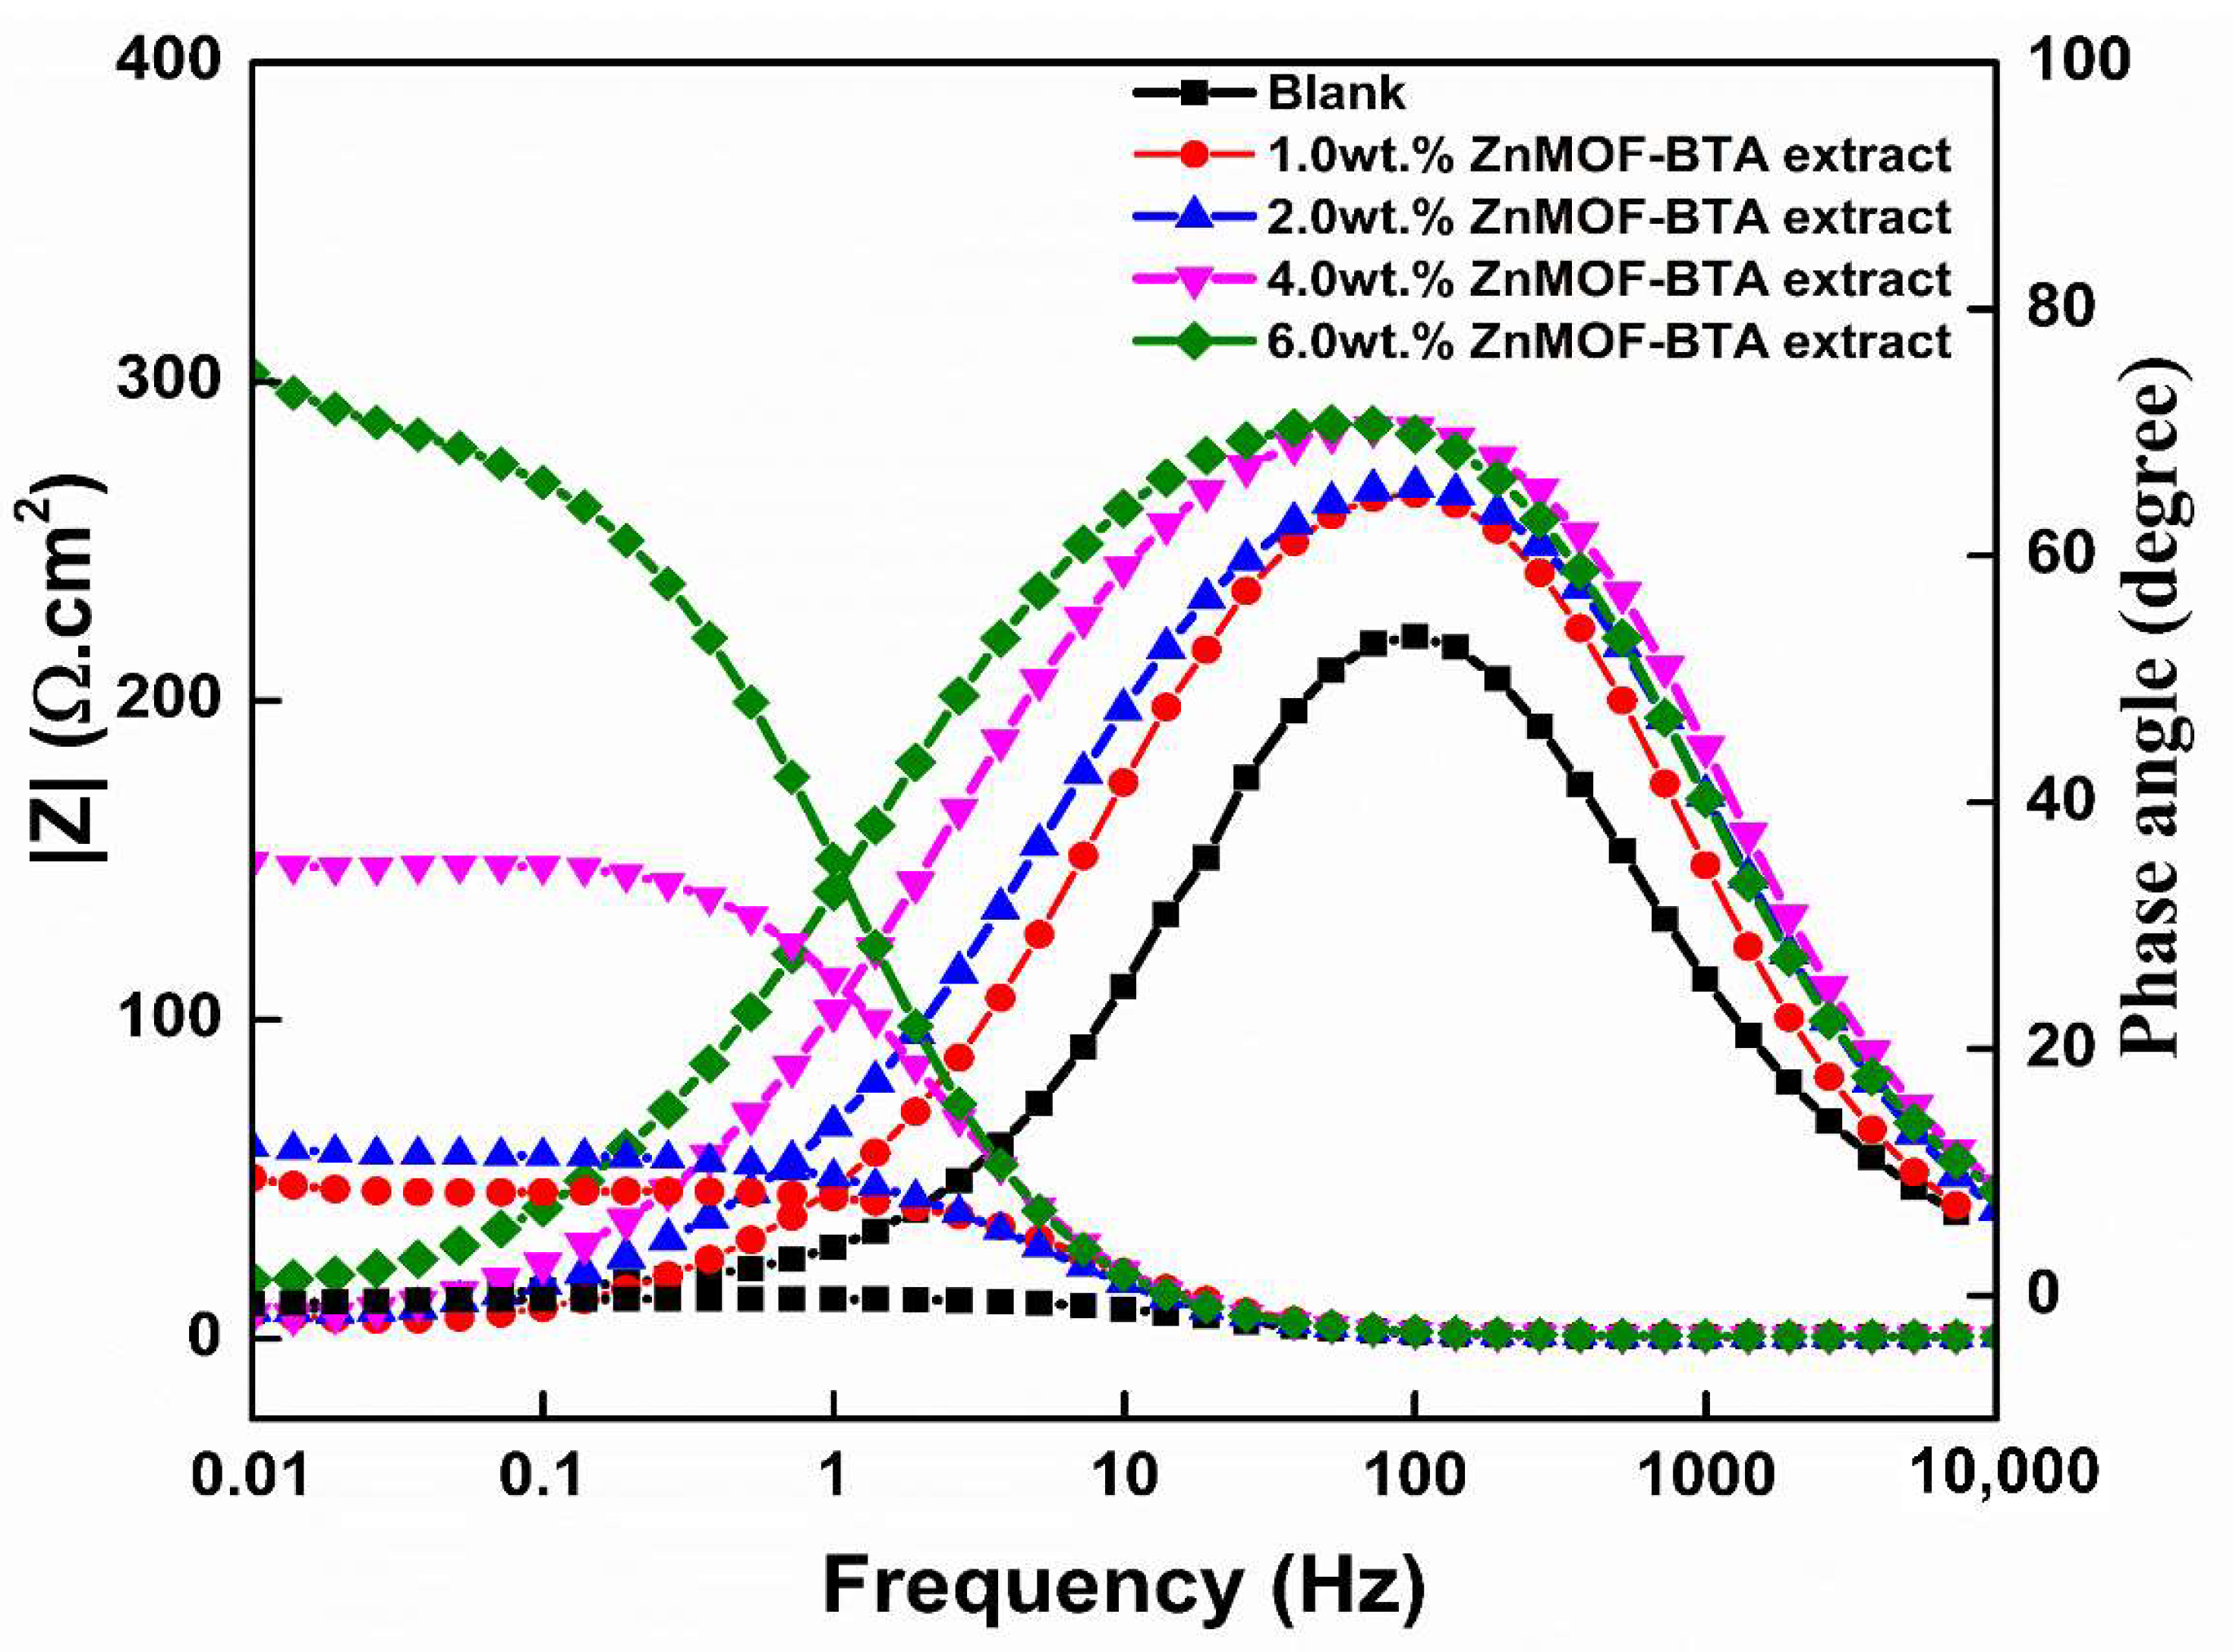
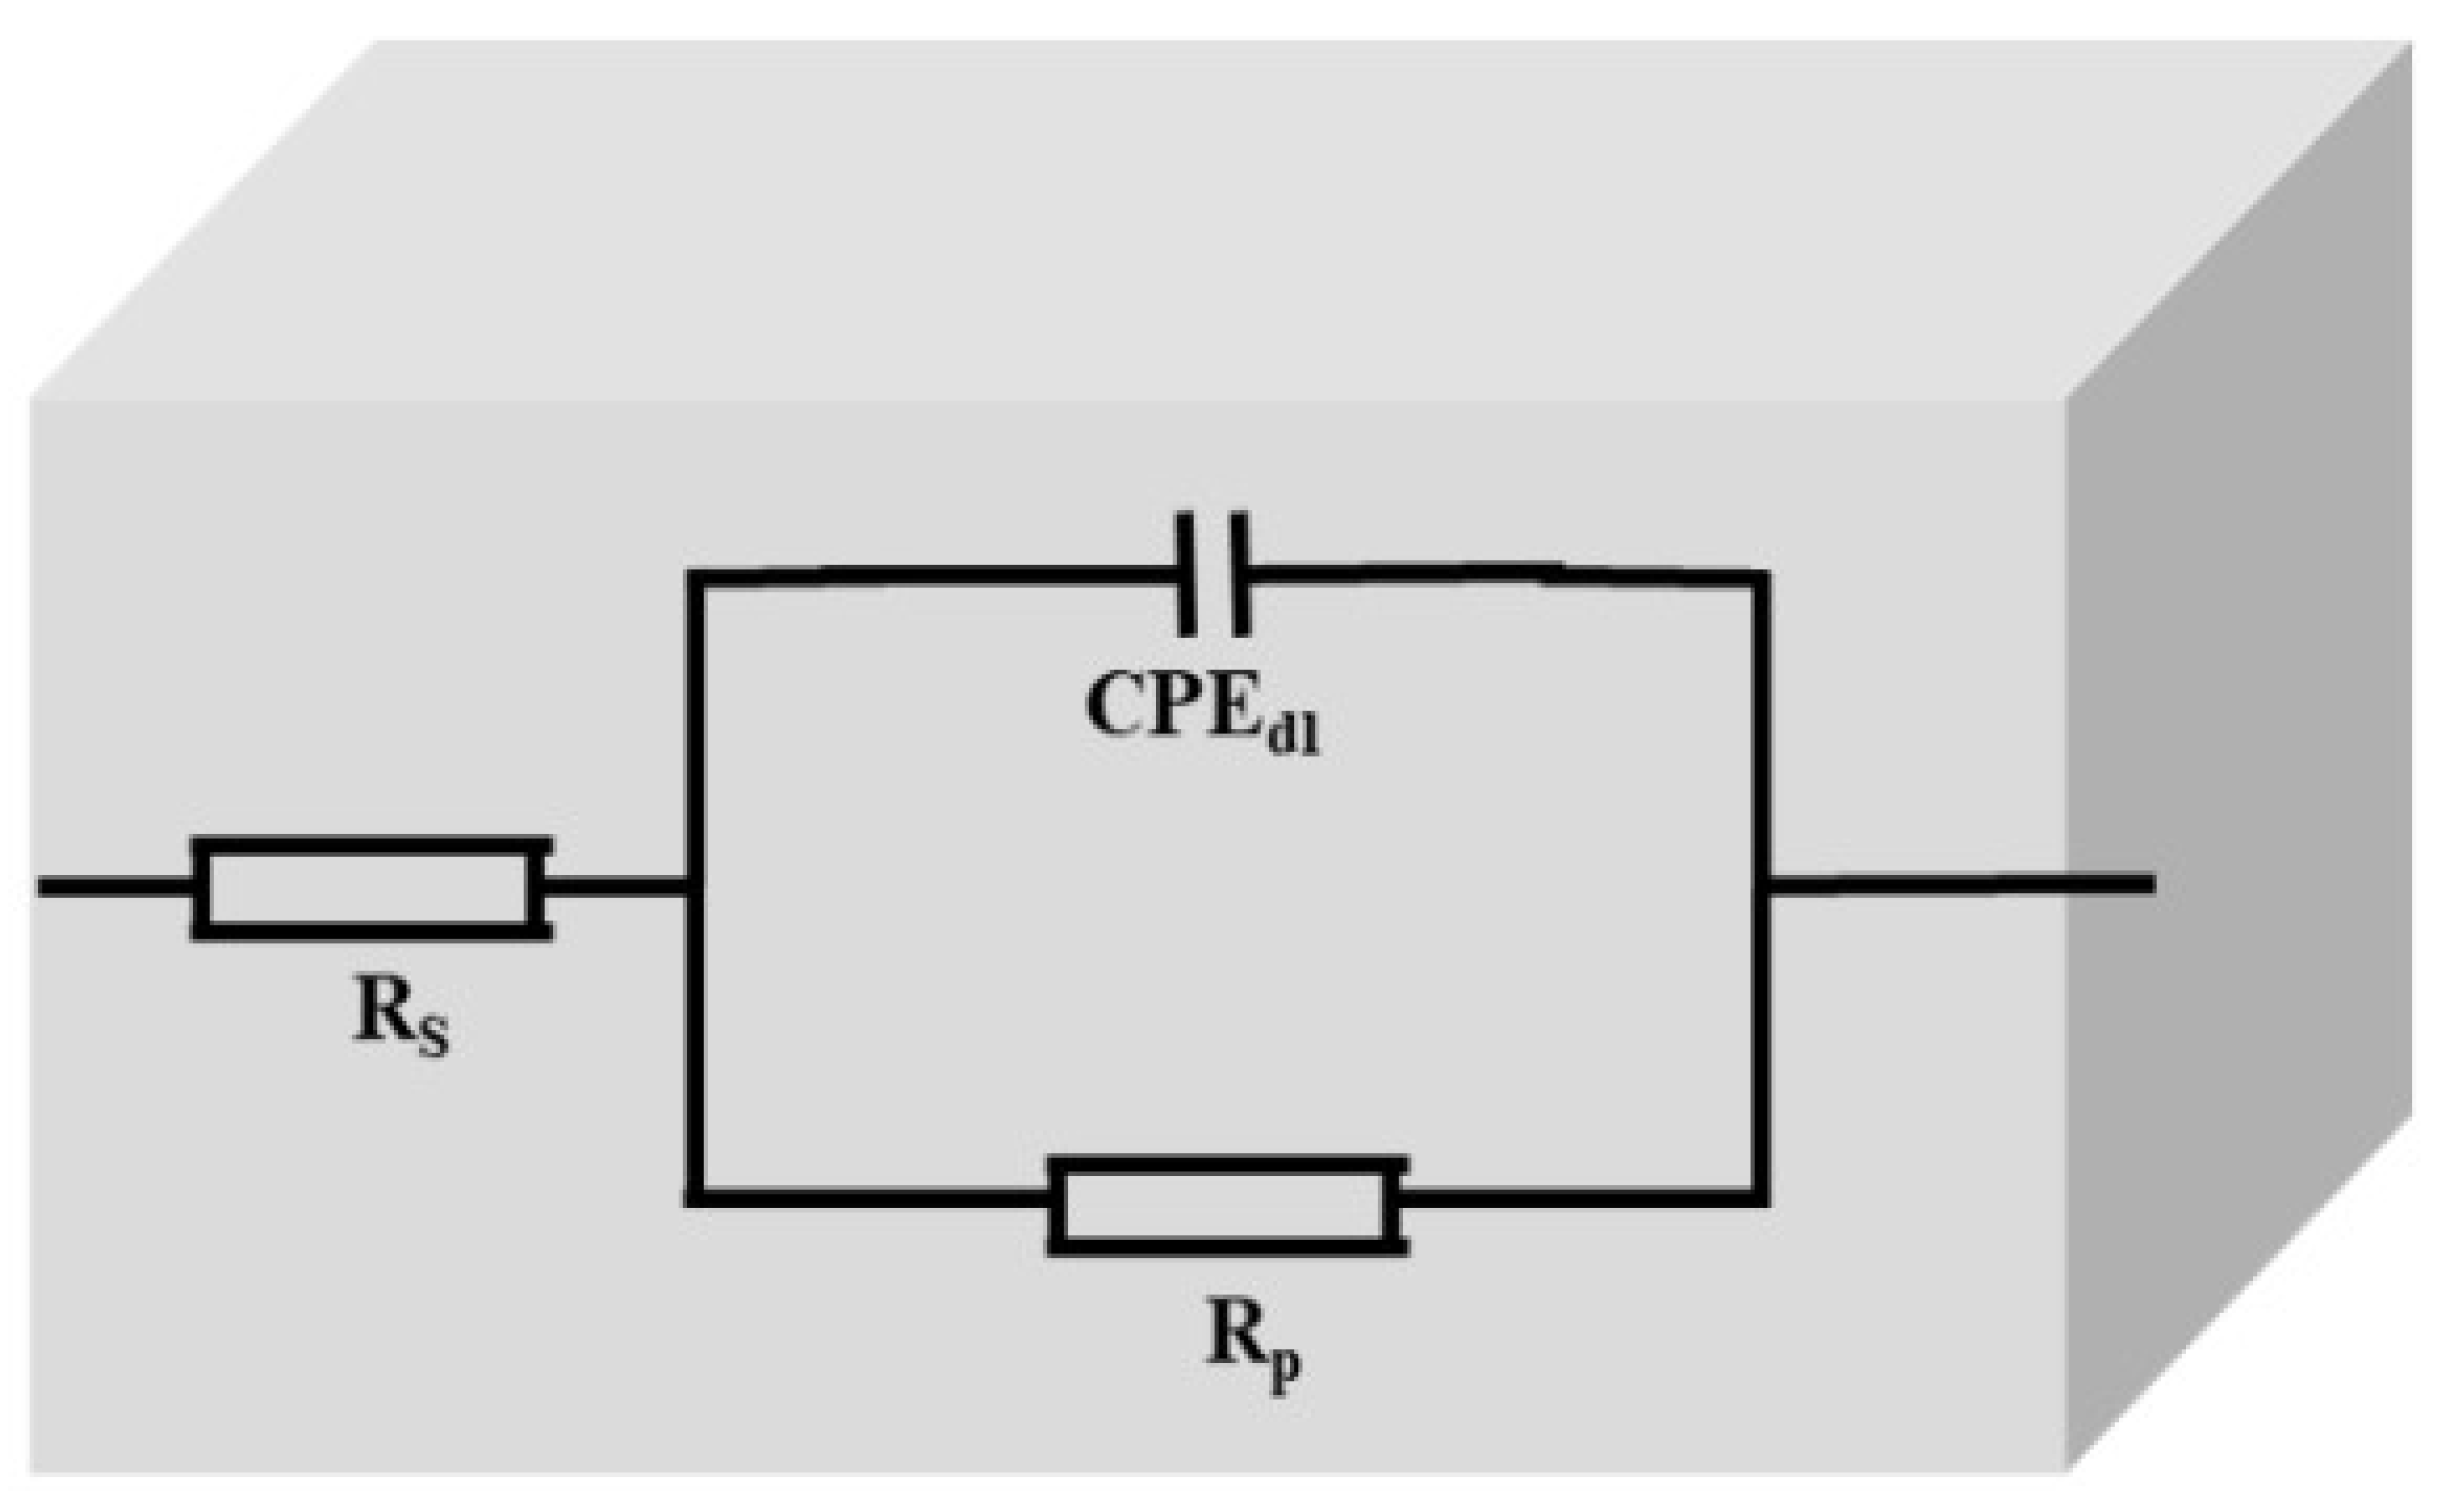
3.6. Electrochemical Impedance Spectroscopy (EIS)

The electrode processes and surface phenomena at the film–solution interface were studied using EIS. The polarization resistance and interface capacitance of the corrosion system is related to the corrosion behavior and corrosion mechanism of metals [50]. As a result, EIS can be utilized to determine the polarization resistance of the material and interfacial capacitance in order to investigate ZnMOF-BTA adsorption behavior in carbon steel corrosion. The Nyquist plots of carbon steel in the presence and absence of different concentrations of ZnMOF-BTA extract in 1M hydrochloric acid solution are given in Figure 9.
The radius of the capacitive arc of the Nyquist semicircles gives an indication of the electrochemical impedance of the system. The arc of the semicircle increases as the concentration of ZnMOF-BTA increases, which indicates an increase in corrosion resistance [51]. This could be due to the adsorption of BTA molecules on the carbon steel surface. The maximum capacitive arc appears at 6.0 wt.% ZnMOF-BTA; this suggests a more compact film at this concentration. In addition, the capacitive impedance arc at 6 wt.% showed an additional loop at high frequencies, suggesting that the corrosion channel did not fully open and that the ZnMOF-BTA extracts had certain protective effects [52].
Figure 10 shows the Bode modulus and phase angle plots of carbon steel in the presence and absence of different concentrations of ZnMOF-BTA extract in 1M hydrochloric acid solution. The impedance modulus |Z| of the low-frequency region in the Bode plot is frequently utilized to assess the protective film’s shielding ability [51]. All of the experimental groups had a time constant, but as the inhibitor concentration was increased, the peak of the phase angle gradually moved to a lower frequency (Figure 10). As shown in Table 7, at the lowest frequency, the impedance modulus |Z| of carbon steel in the blank solution is 12.24 Ω·cm2. Carbon steels with varying concentrations of ZnMOF-BTA extract at the lowest frequency, on the other hand, have a higher impedance modulus than the blank carbon steel solution, and the higher the concentration, the higher the impedance modulus. The corrosion inhibitor’s ability to suppress carbon steel corrosion will be stronger as the impedance modulus value grows. The maximal impedance modulus |Z| of ZnMOF-BTA extracts at the lowest frequency was 283.55 Ω·cm2, significantly more than the impedance value of similar metal–organic frameworks reported in the literature [53], which showed that the protective film deposited on the carbon steel surface by the BTA inhibitor molecules from ZnMOF-BTA may effectively prevent the corrosion medium from penetrating the carbon steel surface. The Bode phase plots show that the phase angle values increased as the concentration of ZnMOF-BTA extracts increased, indicating the protective ability of the BTA inhibitor molecules on the carbon steel surface [54,55].
The equivalent circuit diagram for the corrosion of carbon steel in the presence of ZnMOF-BTA inhibitor is shown in Figure 11, where Rs is the solution resistance, Rp is the film’s corrosion resistance to corrosive media, CPE is the constant phase element, and Cdl is the charge transfer capacitance response of the passivation film on the electrolyte/substrate interface. The capacitive loops are not perfect semicircles, which can be attributed to the frequency dispersion effect caused by the electrode surface’s roughness and inhomogeneity. CPE is introduced instead of capacitor C due to the unevenness and roughness of the passivation film surface, and its impedance is represented by Equation (7) [56]:
Z c p e = Y o j ω n 1
where Y o is the CPE scale factor, which is proportional to the active surface area exposed to the electrolyte; n is the CPE power value, which reflects the deviation from the ideal capacitor’s performance; j is the given imaginary part (j2 = −1); and ω is the angular frequency. The Cdl is calculated according to the following equation [57]:
C d l = [ Y O ω m n 1 ]
where ω m is the angular frequency when the imaginary part of the impedance reaches the maximum. As shown in Table 7, ZView software was used to fit the measured impedance values. Table 7 shows the appropriate electrochemical parameters, including Rs, Rp, Y o , n, and Cdl. As shown in Table 7, as the concentration of ZnMOF-BTA extracts increases, Rp increases and Cdl decreases. A drop in Cdl values might be caused by a decrease in the local dielectric constant as the BTA molecules slowly replaced the corrosive medium on the metal surface and an increase in the thickness of the electrical double layer, which increases the polarization impedance of the solution. This is consistent with the corrosion inhibition efficiency trend, indicating that ZnMOF-BTA is capable of efficiently protecting the metal substrate [58].
ZnMOF-BTA may be able to effectively protect carbon steel from corrosion because BTA molecules contain amine groups (-NH-) and π electron-rich benzene rings, making it easier for the molecules to form covalent bonds with metal Fe ions of the steel, causing the corrosion inhibitor molecules and metal Fe ions to form a protective film through covalent bonds and be adsorbed on the metal surface [59]. The results of inhibition efficiency calculated from EIS, I . E z (%), are in line with the results of I . E w (%) and I . E p (%) from weight loss measurement and potentiodynamic polarization experiments, respectively.

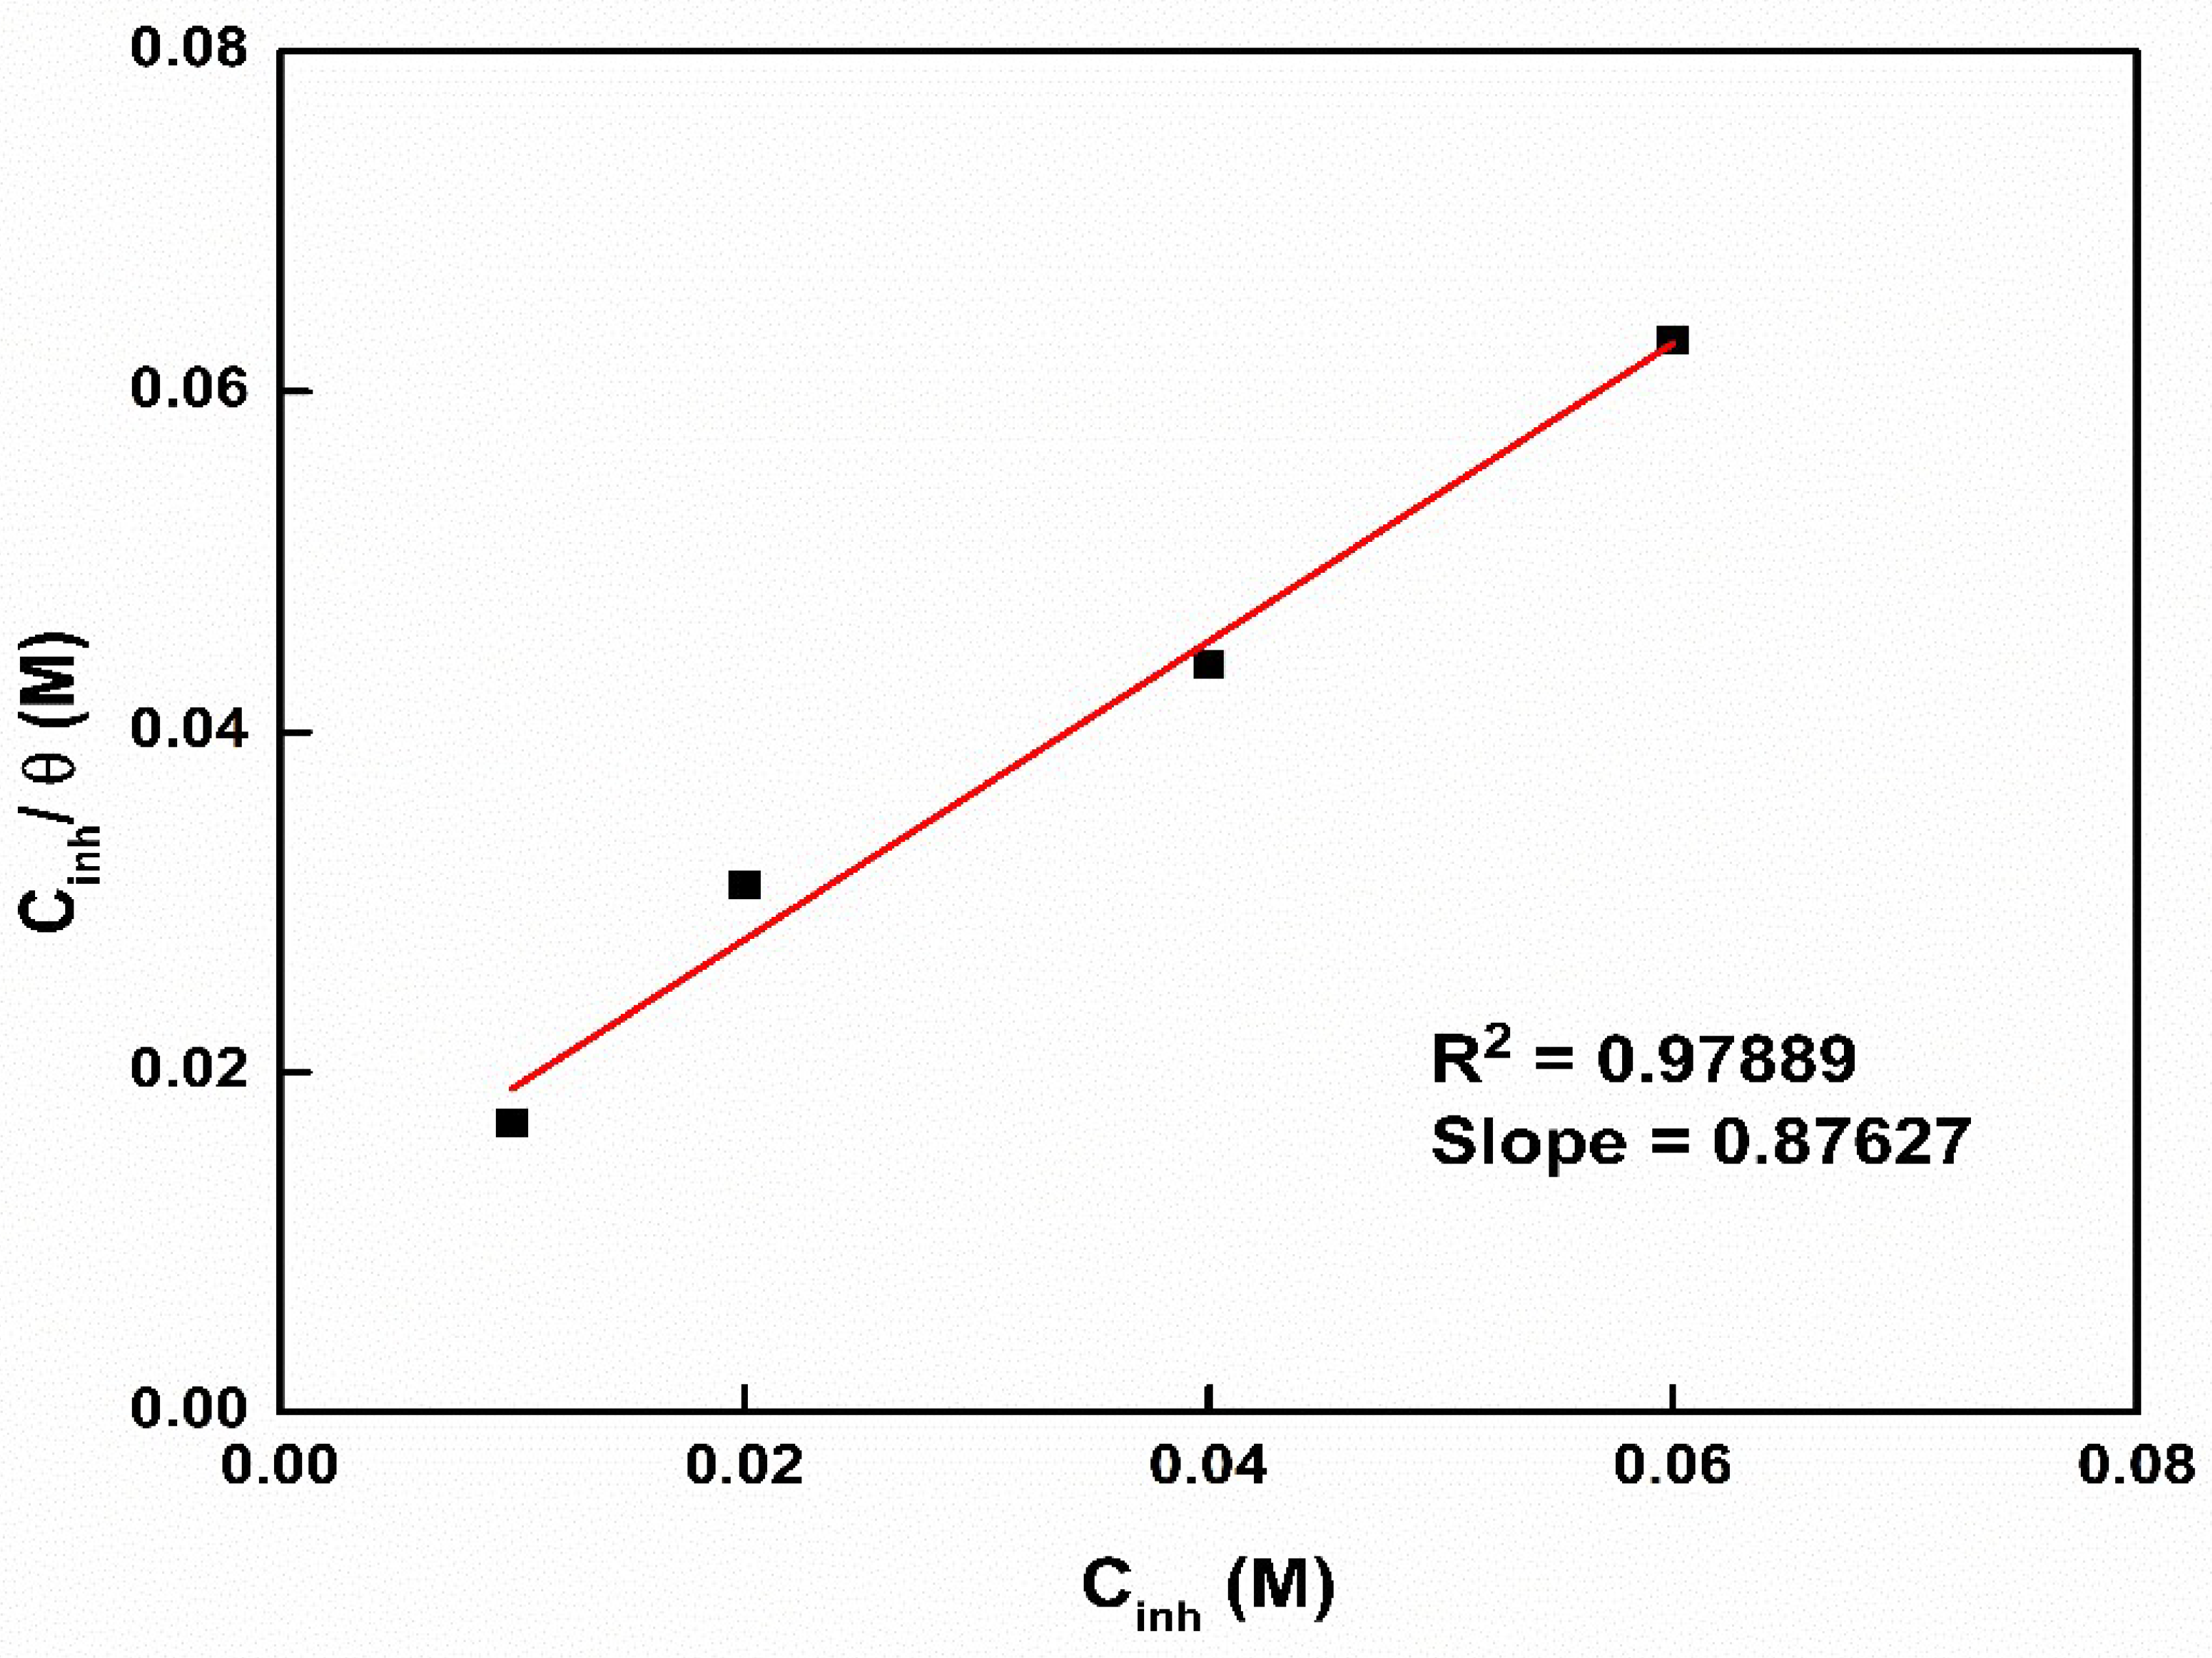
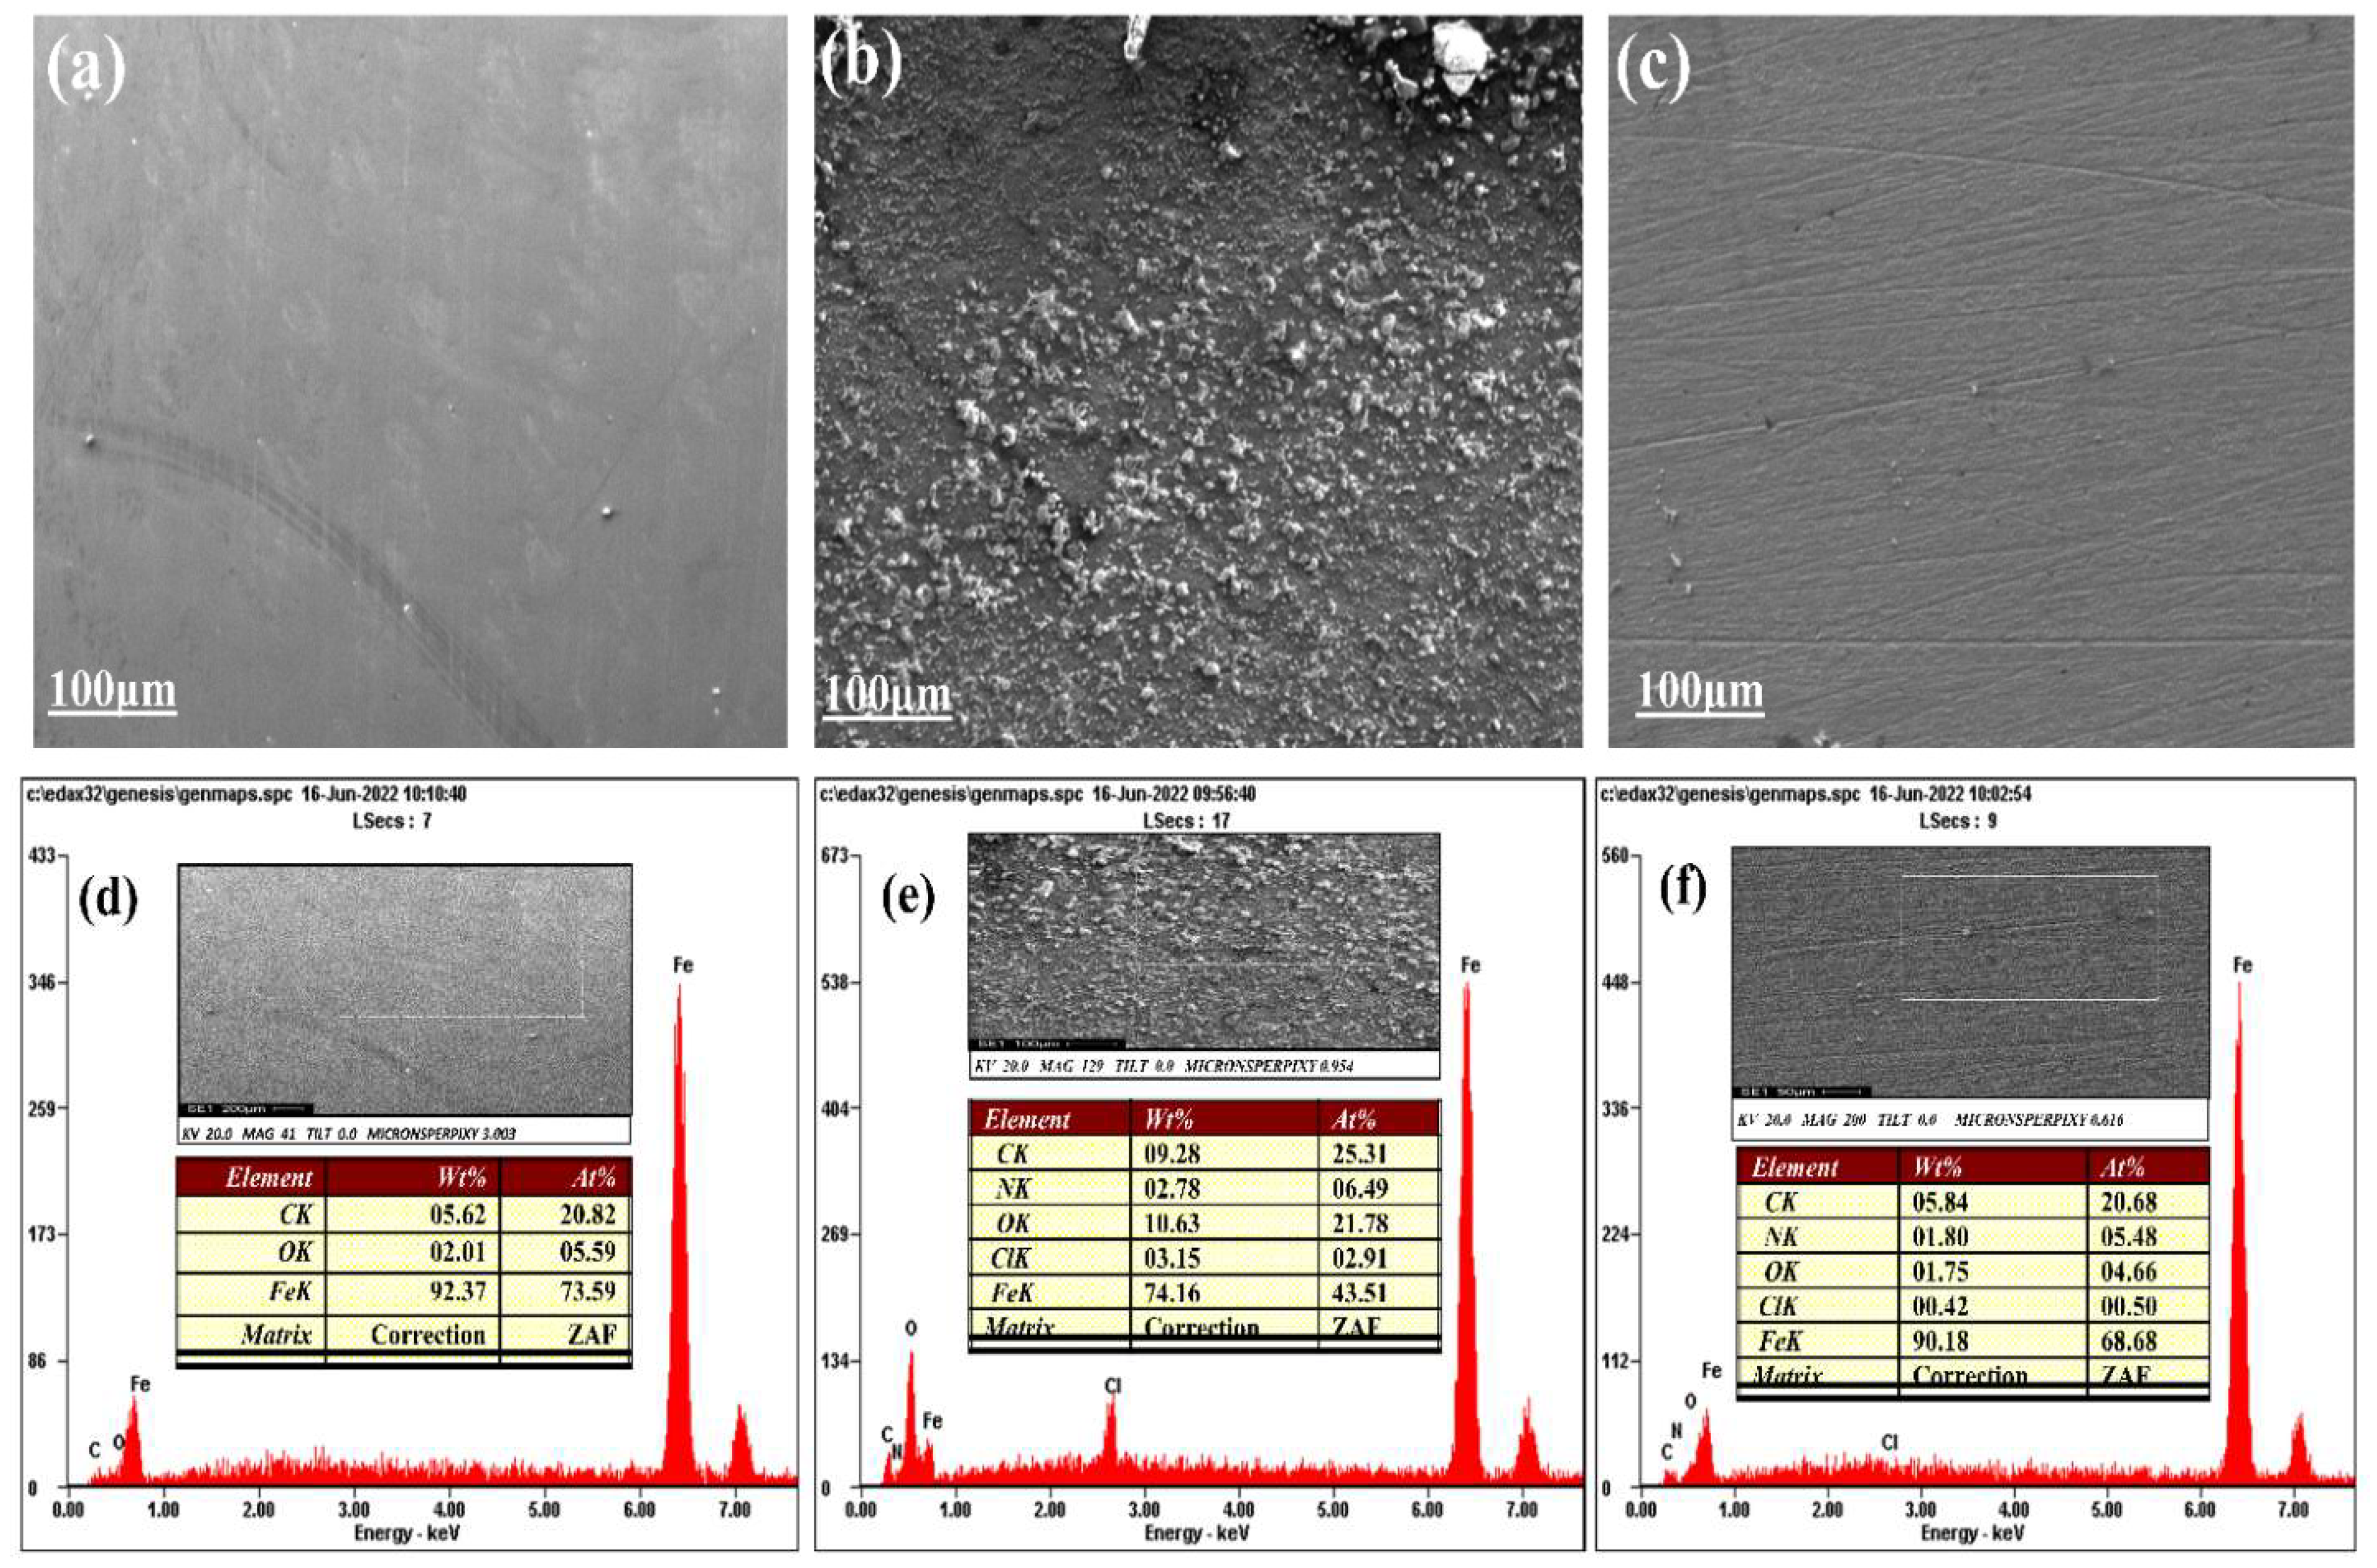
3.7. Adsorption Isotherm, Corrosion Morphology, and Mechanism of Inhibition

Electrochemical tests have shown that the BTA inhibitor molecules from ZnMOF-BTA can successfully reduce carbon steel corrosion in a 1M hydrochloric acid solution. In corrosion inhibition studies, the adsorption isotherm is crucial for determining the mechanism of the adsorption process. The inhibition of metal corrosion by an inhibitor is usually explained in terms of physisorption, chemical adsorption, or mixed adsorption of these species on the metal surface. The physisorption process is due to electrostatic interaction between the charged metal surface and the charged inhibitor molecules, while the chemical adsorption process involves the transfer or sharing of electrons between the inhibitor molecules and the metal surface’s unsaturated “d” orbitals [60].
By fitting the experimental data with different adsorption isotherms, the adsorption mechanism of the inhibitor molecules on the carbon steel surface was established. The experimental data best fitted the Langmuir isotherm with an R2 value of 0.97889. The Langmuir isotherm is given by Equation (9) [61].
C i n h θ = 1 K a d s + C i n h
where the fraction of sites covered by the adsorbed inhibitor molecule (θ) and inhibition concentration ( C i n h ) are related to the equilibrium adsorption constant (Kads) as shown above. Theta values are obtained from weight loss measurements using Equations (1)–(3). The Langmuir adsorption isotherms of BTA released from ZnMOF-BTA on a carbon steel surface at various concentrations are shown in Figure 12.
The equation that correlates the Kads and the standard free energy of adsorption ΔG◦ads (kj.mol−1) is given by Equation (10) [62].
K a d s = 1 55.5   exp Δ G a d s o R T
where T is the absolute temperature (K), R is the universal gas constant (8.3144 J K−1 mol−1s), and the value 55.5 is the concentration of water in solution (mol·L−1). As shown in Figure 12, the linear correlation coefficient value R2 is 0.97889 (almost = 1), which shows that the adsorption of ZnMOF-BTA on carbon steel surface in hydrochloric acid follows the Langmuir adsorption isotherm [63]. The values of the equilibrium constant Kads and the free energy of adsorption ΔG◦ads calculated from the Langmuir isotherm are shown in Table 8.
The negative value of ΔG◦ads ensures that the adsorption process is spontaneous and the adsorbed layer on the metal surface is stable. In order to interpret the nature of the adsorption process of the inhibitor molecules, Chaouiki et al. [64] estimated that when the value of ΔG◦ads is between 0 and −20 KJ mol−1, the adsorption process is due to electrostatic interaction between the charged metal surface and the charged inhibitor molecules (physisorption or physical adsorption). In addition, Al-Senani and Alshabanat [65] have shown that ΔG◦ads values close to −40 kJ mol−1 or higher indicate the chemisorption adsorption process of charge transfer between the inhibitor molecules and the metal surface. Others have suggested that the ΔG◦ads of chemical adsorption processes for organic inhibitors in aqueous systems range from −21 to −42 kJ.mol−1 [66]. As a result, the value of ΔG◦ads has been regarded within the range of physical adsorption in this study. As shown in Table 8, the value of free energy of adsorption (ΔG◦ads) was found to be −10.28 kJ mol−1 for ZnMOF-BTA. The value indicates that the adsorption of the BTA molecules from ZnMOF-BTA on a carbon steel surface in a hydrochloric acid medium is by physisorption and BTA molecules adsorbed strongly onto the surface of carbon steel, as evidenced by the Kads value of 1.141 M−1 [67].
Figure 13a–c show the corrosion surface morphologies of Q235 carbon steel sheets observed by SEM after 48 h immersion in 1M hydrochloric acid solution with and without ZnMOF-BTA extract at 298K. Figure 13a is the SEM micrograph of the polished carbon steel surface, which shows a smooth and clean surface with only scratches due to polishing. The carbon steel surface in the 1M hydrochloric acid solution without ZnMOF-BTA extract is shown in Figure 13b; the micrograph shows an uneven surface with many pits, indicating the very serious corrosion of carbon steel. In Figure 13c, the micrograph with a solution of 2 wt.% ZnMOF-BTA extract shows a relatively clean and smooth surface with only slight corrosion spotted on the steel surface, which indicates that the addition of ZnMOF-BTA greatly reduced the corrosion rate of carbon steel in an acid medium.
Figure 13d–f show the EDS spectra and corresponding percentage weight contents. The EDS spectrum of polished Q235 carbon steel, shown in Figure 13d, reveals the characteristic element peaks of C (5.62 wt.%), O (2.01 wt.%), and Fe (92.37 wt.%). The EDS spectrum and element composition of Q235 carbon steel in 1 M HCl solution differ substantially (Figure 13e). Due to the formation of a corrosion layer (iron oxide), the intensity of the Fe peak drops, and other peaks for minor elements (Cl, N) become visible (5.93 wt.%). As a result of the oxidation of the Q235 carbon steel surface, the oxygen intensity (10.63 wt.%) also increases.
However, in the presence of ZnMOF-BTA extract, the EDS spectrum is different from that of polished Q235 carbon steel in a 1 M HCl solution (Figure 13f). The dissolution of the content of Fe in the presence of ZnMOF-BTA extract is slighter than the sample in 1 M HCl solution, which is 90.18 wt.%, and the intensity of oxygen decreases slightly (1.75 wt.%) showing that there is very little or no oxidation of the carbon steel surface. These findings also show that the addition of ZnMOF-BTA extract slows down the corrosion of Q235 carbon steel significantly.
The results above show that the ZnMOF-BTA compound has a good corrosion inhibition property for carbon steel in 1M hydrochloric acid solution, which may be a physisorption process and obey the Langmuir adsorption isotherm model. The BTA molecules containing many N heteroatoms and numerous aromatic rings rich in π-electrons are used in synthesizing the ZnMOF-BTA. When the BTA molecules are released by the ZnMOF-BTA in solution, these heteroatoms and aromatic rings serve as adsorption active sites for the MOF compound, which helps to prevent corrosion.
Adsorption on the metal surface is the first step in the inhibitory process in acid media [68]. The formation of a donor–acceptor surface complex between the inhibitor’s p-electrons and the metal’s unoccupied d-orbitals is postulated in most inhibition investigations [69]. The inhibitor compound in aqueous acidic solutions is either neutral or in the form of cations (i.e., protonated species). There are two types of adsorption that might be considered in general. The neutral form of the inhibitor may adsorb on the metal surface via a chemisorption mechanism that involves the displacement of water molecules from the metal surface and the sharing of electrons between N atoms and Fe and/or between the aromatic ring’s π-electrons and the vacant d-orbitals of Fe.
In acidic conditions, on the other hand, it is well known that the steel surface is positively charged [70]. Therefore, electrostatic repulsion makes it difficult for a protonated inhibitor to adsorb on the positively charged steel surface. Because chloride ions have a lower degree of hydration and are particularly adsorbed, they generate an excess negative charge in the solution, favoring more protonated inhibitor adsorption. The following may happen when the protonated inhibitor is deposited on the metal surface: (i) a coordinate bond formation may occur as a result of a partial electron transfer from N atoms to the metal surface, and (ii) the protonated inhibitor may form a metal–inhibitor complex on the carbon steel surface by combining with freshly produced Fe2+ ions [70].
F e 2 + + i n h i n h x F e 2 + x +
Van der Waals forces may cause these complexes to be adsorbed onto the steel surface, forming a protective coating that prevents corrosion. The film simultaneously inhibits both anodic and cathodic reactions [35]. As a result, the adsorption of BTA inhibitor molecules containing N heteroatoms and π-electrons of the aromatic rings on the surface of carbon steel is the primary mechanism of corrosion inhibition of ZnMOF-BTA.

4. Conclusions

ZnMOF-BTA was successfully synthesized, characterized, and tested for the corrosion protection of Q235 carbon steel in acidic conditions. The results of weight loss and electrochemical studies show that the obtained ZnMOF-BTA is a mixed-type inhibitor and effective in corrosion inhibition of Q235 carbon steel in acidic conditions. The synthesis of ZnMOF-BTA provides a new corrosion inhibitor with proven corrosion inhibition properties.

Author Contributions

Conceptualization, F.L. and H.S.; formal analysis, I.K.N. and J.L.; investigation, I.K.N.; resources F.L. and H.S.; data curation, N.G. and S.A.; writing—original draft preparation, I.K.N.; writing—review and editing, A.I.I.; supervision, F.L. and H.S. All authors have read and agreed to the published version of the manuscript.

Funding

This research received no external funding.

Institutional Review Board Statement

Not applicable.

Informed Consent Statement

Not applicable.

Data Availability Statement

Not applicable.

Conflicts of Interest

The authors declare no conflict of interest.

References

  1. Singh, A.K.; Quraishi, M.A. Effect of Cefazolin on the corrosion of mild steel in HCl solution. Corros. Sci. 2010, 52, 152–160. [Google Scholar] [CrossRef]
  2. Tang, F.; Chen, G.; Brow, R.K.; Koenigstein, M.L. Corrosion Resistance of a Sand Particle-Modified Enamel Coating Applied to Smooth Steel Bars. Materials 2014, 7, 6632–6645. [Google Scholar] [CrossRef] [PubMed]
  3. Bera, S.; Rout, T.K.; Udayabhanu, G.; Narayan, R. Water-based & eco-friendly epoxy-silane hybrid coating for enhanced corrosion protection & adhesion on galvanized steel. Prog. Org. Coat. 2016, 101, 24–44. [Google Scholar]
  4. Raja, P.B.; Ismail, M.; Ghoreishiamiri, S.; Mirza, J.; Ismail, M.C.; Kakooei, S.; Rahim, A.A. Reviews Corrosion Inhibitors: A Short View. Chem. Eng. Commun. 2016, 203, 1145–1156. [Google Scholar] [CrossRef]
  5. Finšgar, M. 2-Phenylimidazole Corrosion Inhibitor on Copper: An XPS and ToF-SIMS Surface Analytical Study. Coatings 2021, 11, 966. [Google Scholar] [CrossRef]
  6. Al Suhybani, A.A.; Sultan, Y.H.; Hamid, W.A. Corrosion of aluminum in alkaline solutions. Materwiss Werksttech 2012, 22, 301–307. [Google Scholar] [CrossRef]
  7. Zohdy, K.M. Surface Protection of Carbon Steel in Acidic Solution Using Ethylenediaminetetraacetic Disodium Salt. Int. J. Electrochem. Sci. 2015, 10, 414–431. [Google Scholar]
  8. Knack, D.H.; Marshall, J.L.; Harlow, G.P.; Dudzik, A.; Szaleniec, M.; Liu, S.; Heider, J. BN/CC isosteric compounds as enzyme inhibitors: N-and B-ethyl-1,2-azaborine inhibit ethylbenzene hydroxylation as nonconvertible substrate analogues. Angew. Chem. Int. Ed. Engl. 2013, 52, 2599–2601. [Google Scholar] [CrossRef]
  9. Yin, D.; Yu, Z.; Chen, L.; Cao, K. Enhancement of the Anti-Corrosion Performance of Composite Epoxy Coatings in Presence of BTA-loaded Copper-Based Metal-Organic Frameworks. Int. J. Electrochem. 2019, 14, 4240–4253. [Google Scholar] [CrossRef]
  10. Udoh, I.I.; Shi, H.; Daniel, E.F.; Li, J.; Gu, S.; Liu, F.; Han, E. Active anticorrosion and self-healing coatings: A review with focus on multi-action smart coating strategies. J. Mater. Sci. Technol. 2022, 116, 224–237. [Google Scholar] [CrossRef]
  11. Sun, C.; Li, H.; Chen, L. Nanostructured ceria-based materials: Synthesis, properties, and applications. Energy Environ. Sci. 2012, 5, 8475–8505. [Google Scholar] [CrossRef]
  12. Jain, P.; Patidar, B.; Bhawsar, J. Potential of Nanoparticles as a Corrosion Inhibitor: A Review. J. Bio. Tribo-Corros. 2020, 6, 43. [Google Scholar] [CrossRef]
  13. Kamburova, K.; Radeva, T. Polyelectrolyte-modified kaolinite nanocontainers for entrapment of corrosion inhibitor benzotriazole. Colloid Polym. Sci. 2018, 296, 1157–1164. [Google Scholar] [CrossRef]
  14. Mahmoodi, N.M.; Abdi, J.; Taghizadeh, M.; Taghizadeh, A.; Hayati, B.; Shekarchi, A.A.; Vossoughi, M. Activated carbon/metal-organic framework nanocomposite: Preparation and photocatalytic dye degradation mathematical modeling from wastewater by least squares support vector machine. J. Environ. Manag. 2019, 233, 660–672. [Google Scholar] [CrossRef]
  15. Furukawa, H.; Cordova, K.E.; O’Keeffe, M.; Yaghi, O.M. The chemistry and applications of metal-organic frameworks. Science 2013, 341, 1230444. [Google Scholar] [CrossRef]
  16. Wu, D.; Xu, F.; Sun, B.; Fu, R.; He, H.; Matyjaszewski, K. Design and preparation of porous polymers. Chem. Rev. 2012, 112, 3959–4015. [Google Scholar] [CrossRef]
  17. Sun, L.; Li, J.; Lu, W.; Gu, Z.; Luo, Z.; Zhou, H.; Zhou, H. Confinement of metal-organic polyhedra in silica nanopores. J. Am. Chem. Soc. 2012, 134, 15923–15928. [Google Scholar] [CrossRef]
  18. Mahmoodi, N.M.; Taghizadeh, M.; Taghizadeh, A. Ultrasound-assisted green synthesis and application of recyclable nanoporous chromium-based metal-organic framework. Korean J. Chem. Eng. 2018, 36, 287–298. [Google Scholar] [CrossRef]
  19. Zafari, S.; Shahrak, M.N.; Ghahramaninezhad, M. New MOF-Based Corrosion Inhibitor for Carbon Steel in Acidic Media. Met. Mater. Int. 2019, 26, 25–38. [Google Scholar] [CrossRef]
  20. Lee, Y.; Kim, J.; Ahn, W. Synthesis of metal-organic frameworks: A mini-review. Korean J. Chem. Eng. 2013, 30, 1667–1680. [Google Scholar] [CrossRef]
  21. Sheldrick, G. Integrated space-group and crystal-structure determination. Acta Crystallogr. 2015, 71, 3–8. [Google Scholar] [CrossRef]
  22. Sheldrick, G.M. Crystal structure refinement with SHELXL. Acta Crystallogr. 2015, 71, 3–8. [Google Scholar]
  23. Spek, A.L. PLATON SQUEEZE: A tool for the calculation of the disordered solvent contribution to the calculated structure factors. Acta Crystallogr. 2015, 71, 9–18. [Google Scholar]
  24. Ikeuba, A.I.; Ita, B.I.; Okafor, P.C.; Bassey, V.M.; Ugi, B.U.; Kporokpo, E.B. Green Corrosion Inhibitors for Mild Steel in H2SO4 Solution: Flavonoids of Gongronema latifolium. Prot. Met. Phys. Chem. Surf. 2015, 51, 1043–1049. [Google Scholar] [CrossRef]
  25. Ikeuba, A.I.; Okafor, P.C.; Ekpe, U.J.; Ebenso, E.E. Alkaloid and non-alkaloid ethanolic extracts from seeds of Garcinia kola as green corrosion inhibitors of mild steel in H2SO4 solution. Int. J. Electrochem. Sci. 2013, 8, 7455–7467. [Google Scholar]
  26. Ikeuba, A.I.; Okafor, P.C. Green corrosion protection for mild steel in acidic media: Saponins and crude extracts of Gongronema latifolium. Pigment. Resin Technol. 2018, 48, 57–64. [Google Scholar] [CrossRef]
  27. Abeng, F.E.; Ikpi, M.E.; Okafor, P.C.; Anadebe, V.C.; Uwakwe, K.J.; Ikeuba, A.I.; Okafor, N.A. Corrosion inhibition of API 5L X-52 steel in oilfield acidizing solution by Gentamicine and sulfamethoxazole: Experimental, plane-wave density functional theory (PWDFT) and the generalized-gradient approximation (GGA) simulations. J. Adhes. Sci. Technol. 2021, 35, 1–24. [Google Scholar] [CrossRef]
  28. Karimi, M. Investigation of the Stability of Oxadiasole and Their Analogs Using Quantum Mechanics Computation. Comput. Chem. 2016, 4, 11–16. [Google Scholar] [CrossRef]
  29. El-Lateef, H.M.A.; Abu-Dief, A.M.; Abdel-Rahman, L.H.; Sañudo, E.C.; Aliaga-Alcalde, N. Electrochemical and theoretical quantum approaches on the inhibition of C1018 carbon steel corrosion in acidic medium containing chloride using some newly synthesized phenolic Schiff bases compounds. J. Electroanal. 2015, 743, 120–133. [Google Scholar] [CrossRef]
  30. Praveen, B.M.; Alhadhrami, A.; Prasanna, B.M.; Hebbar, N.; Prabhu, R. Anti-Corrosion Behavior of Olmesartan for Soft-Cast Steel in 1 mol dm−3 HCl. Coatings 2021, 11, 965. [Google Scholar] [CrossRef]
  31. Sharma, D.; Jha, R. Analysis of structural, optical and magnetic properties of Fe/Co co-doped ZnO nanocrystals. Ceram. Int. 2017, 43, 8488–8496. [Google Scholar] [CrossRef]
  32. Phiri, I.; Bon, C.Y.; Kim, S.; Mwemezi, M.; Hamenu, L.; Madzvamuse, A.; Kim, S.H.; Ko, J.M. Effects of novel benzotriazole based zwitterionic salt as electrolyte additive for lithium ion batteries. Curr. Appl. Phys. 2020, 20, 122–131. [Google Scholar] [CrossRef]
  33. Stojković, D.L.; Jevtić, V.V.; Vuković, N.; Vukić, M.; Čanović, P.; Zarić, M.M.; Mišić, M.M.; Radovanović, D.M.; Baskić, D.; Trifunović, S.R. Synthesis, characterization, antimicrobial and antitumor reactivity of new palladium(II) complexes with methionine and tryptophane coumarine derivatives. J. Mol. Struct. 2018, 1157, 425–433. [Google Scholar] [CrossRef]
  34. Gu, S.; Shi, H.; Zhang, C.; Wang, W.; Liu, F.; Han, E. Mesoporous CeO2 containers in water-borne epoxy coatings for dual active corrosion protection of mild steel. Prog. Org. Coat. 2021, 158, 106376. [Google Scholar] [CrossRef]
  35. Ge, L.; Zuo, F.; Liu, J.; Ma, Q.; Wang, C.; Sun, D.; Bartels, L.; Feng, P. Synthesis and Efficient Visible Light Photocatalytic Hydrogen Evolution of Polymeric g-C3N4 Coupled with CdS Quantum Dots. J. Phys. Chem. C 2012, 116, 13708–13714. [Google Scholar] [CrossRef]
  36. Huang, B.B.; Liu, Y.C.; Xie, Z.L. Biomass derived 2D carbons via a hydrothermal carbonization method as efficient bifunctional ORR/HER electrocatalysts. J. Mater. Chem. A 2017, 5, 23481–23488. [Google Scholar] [CrossRef]
  37. Macedo, J.C.A.; Gontijo, E.S.J.; Herrera, S.G.; Rangel, E.C.; Komatsu, D.; Landers, R.; Rosa, A.H. Organosulphur-modified biochar: An effective green adsorbent for removing metal species in aquatic systems. Surf. Interfaces 2021, 22, 100822. [Google Scholar] [CrossRef]
  38. Min, H.; Dietrich, P.M.; Girard-Lauriault, P.L.; Gross, T.; Lippitz, A.; Unger, W.E.S. Ambient-ageing processes in amine self-assembled monolayers on microarray slides as studied by ToF-SIMS with principal component analysis, XPS, and NEXAFS spectroscopy. Anal. Bioanal. Chem. 2012, 403, 613–623. [Google Scholar] [CrossRef]
  39. Song, Z.Y.; Duan, H.; Li, L.C.; Zhu, D.Z.; Cao, T.C.; Lv, Y.K.; Xiong, W.; Wang, Z.W.; Liu, M.X.; Gan, L.H. High-energy flexible solid-state supercapacitors based on O, N, S-tridoped carbon electrodes and a 3.5 V gel-type electrolyte. Chem. Eng. J. 2019, 372, 1216–1225. [Google Scholar] [CrossRef]
  40. Wu, D.; Wang, C.; Wu, H.; Wang, S.; Wang, F.; Chen, Z.; Zhao, T.; Zhang, Z.; Zhang, L.Y. Synthesis of hollow Co3O4 nanocrystals in situ anchored on holey graphene for high rate lithium-ion batteries. Carbon 2020, 163, 137–144. [Google Scholar] [CrossRef]
  41. Dhanaraj, P.V.; Rajesh, N.P.; Sundar, J.K.; Natarajan, S.; Vinitha, G. Studies on growth, crystal structure and characterization of novel organic nicotinium trifluoroacetate single crystals. Mater. Chem. Phys. 2011, 129, 457–463. [Google Scholar] [CrossRef]
  42. Al-Awadi, N.A.; Shuaib, N.M.; Abbas, A.; El-Sherif, A.A.A.; El-Dissouky, A.; Al-Saleh, E.A. Synthesis, Characterization, and Biological Activity of -Methyl-2-(-1,2,3-Benzotriazol-1-y1)-3-Oxobutan- ethioamide Complexes with Some Divalent Metal (II) Ions. Bioinorg. Chem. Appl. 2008, 2008, 479897. [Google Scholar] [CrossRef]
  43. Yeşilel, O.Z.; İlker, I.; Büyükgüngör, O. Three copper(II) complexes of thiophene-2,5-dicarboxylic acid with dissimilar ligands: Synthesis, IR and UV–Vis spectra, thermal properties and structural characterizations. Polyhedron 2009, 28, 3010–3016. [Google Scholar] [CrossRef]
  44. Khaled, M.A.; Ismail, M.A.; El-Hossiany, A.A.; Fouda, A.E.-S. Novel pyrimidine-bichalcophene derivatives as corrosion inhibitors for copper in 1 M nitric acid solution. RSC Adv. 2021, 11, 25314–25333. [Google Scholar] [CrossRef]
  45. Belayachi, M.; Serrar, H.; Zarrok, H.; el Assyry, A.; Zarrouk, A.; Oudda, H.; Boukhris, S.; Hammouti, B.; Ebenso, E.; Guenbour, A. New pyrimidothiazine Derivative as Corrosion Inhibitor for Carbon Steel in Acidic Media. Int. J. Electrochem. 2015, 10, 3010–3025. [Google Scholar]
  46. Velazquez-Torres, N.; Porcayo-Calderon, J.; Martinez-Valencia, H.; Lopes-Cecenes, R.; Rosales-Cadena, I.; Sarmiento-Bustos, E.; Rocabruno-Valdés, C.I.; Gonzalez-Rodriguez, G.J. Corrosion Resistance of a Plasma-Oxidized Ti6Al4V Alloy for Dental Applications. Coatings 2021, 11, 1136. [Google Scholar] [CrossRef]
  47. Etaiw, S.E.; Fouda, A.; Amer, S.; El-bendary, M. Structure, Characterization and Anti-Corrosion Activity of the New Metal–Organic Framework [Ag(qox)(4-ab)]. J. Inorg. Organomet. Polym. Mater. 2011, 21, 327–335. [Google Scholar] [CrossRef]
  48. Li, J.; Wang, Q.; Gao, N.; Nwokolo, I.K.; Zhang, W.; Ma, L.; Liu, F.; Han, E.-H. Interface Characteristics and Anticorrosion Performances of Cold Galvanizing Coatings Incorporated with γ-chloropropyl Triethoxysilane Hot-Dip Galvanized Steel. Coatings 2021, 11, 402. [Google Scholar] [CrossRef]
  49. Rajeswari, V.; Devarayan, K.; Viswanathamurthi, P. Expired pharmaceutical compounds as potential inhibitors for cast iron corrosion in acidic medium. Res. Chem. Intermed. 2017, 43, 3893–3913. [Google Scholar] [CrossRef]
  50. Karimi, M.; Nabavi-Amri, S.A.; Soleymanpour, A. Study of Electrical Discharge Machining Parameters on Stainless Steel Using Copper Tool Electrode and Its Effect on the Structure and Electrochemical Properties. Acta Chim. Slov. 2021, 68, 279–288. [Google Scholar] [CrossRef]
  51. Song, L.; Zhou, Y.; Sheng, X.; Yao, Q.; Xi, X. MPEC-IMI as an effective green inhibitor to protect Q235 steel in 0.5 M HCl medium. Res. Chem. Intermed. 2018, 44, 5833–5855. [Google Scholar] [CrossRef]
  52. Chen, J.; Zhao, W. Silk fibroin-Ti3C2TX hybrid nanofiller enhance corrosion protection for waterborne epoxy coatings under deep sea environment. Chem. Eng. J. 2021, 423, 130195. [Google Scholar] [CrossRef]
  53. Murmu, M.; Saha, S.K.; Murmu, N.C.; Banerjee, P. Effect of stereochemical conformation into the corrosion inhibitive behaviour of double azomethine based Schiff bases on mild steel surface in 1 mol L−1 HCl medium: An experimental, density functional theory and molecular dynamics simulation study. Corros. Sci. 2019, 146, 134–151. [Google Scholar] [CrossRef]
  54. Li, J.; Shi, H.; Liu, F.; Han, E. Self-healing epoxy coating based on tung oil-containing microcapsules for corrosion protection. Prog. Org. Coat. 2021, 156, 106236. [Google Scholar] [CrossRef]
  55. Hamed, E.; El-Rehim, S.S.A.; El-Shahat, M.F.; Shaltot, A.M. Corrosion inhibition of nickel in H2SO4 solution by alanine. Mater. Sci. Eng. B 2012, 177, 441–448. [Google Scholar] [CrossRef]
  56. Selvamani, R.; Singh, G.; Tiwari, V.S. Grain size effect on impedance and modulus properties of (Na0.5Bi0.5TiO3) (1−x) (BaZrO3) ceramics. Mater. Res. Express 2016, 3, 056301. [Google Scholar] [CrossRef]
  57. Soleymanibrojeni, M.; Shia, H.; Udoh, I.I.; Liu, F.; Han, E. Microcontainers with 3-amino-1,2,4-triazole-5-thiol for Enhancing Anticorrosion Waterborne Coatings for AA2024-T3. Prog. Org. Coat. 2019, 137, 105336. [Google Scholar] [CrossRef]
  58. Jafari, H.; Danaee, I.; Eskandari, H. Inhibitive Action of Novel Schiff Base Towards Corrosion of API 5L Carbon Steel in 1 M Hydrochloric Acid Solutions. Trans. Indian Inst. Met. 2015, 68, 729–739. [Google Scholar] [CrossRef]
  59. Shi, X.; Wang, Y.; Li, H.; Zhang, S.; Zhao, R.; Li, G.; Zhang, R.; Sheng, Y.; Cao, S.; Zhao, Y.; et al. Corrosion resistance and biocompatibility of calcium-containing coatings developed in near-neutral solutions containing phytic acid and phosphoric acid on AZ31B alloy. J. Alloys Compd. 2020, 823, 153721. [Google Scholar] [CrossRef]
  60. Singh, A.; Ansari, K.R.; Quraishi, M.A.; Lgaz, H.; Lin, Y. Synthesis and investigation of pyran derivatives as acidizing corrosion inhibitors for N80 steel in hydrochloric acid: Theoretical and experimental approaches. J. Alloys Compd. 2018, 762, 347–362. [Google Scholar] [CrossRef]
  61. Madani, A.; Kaabi, I.; Sibous, L.; Bentouhami, E. Synthesis, characterization, and evaluation of the corrosion inhibition on mild steel of two new Schiff bases derived from 4,4’-diaminobiphenyl: Density functional theory investigation. J. Iran. Chem. Soc. 2021, 18, 3077–3095. [Google Scholar] [CrossRef]
  62. Madkour, L. Correlation between corrosion inhibitive effect and quantum molecular structure of Schiff bases for iron in acidic and alkaline media. Nature 2014, 2, 680–704. [Google Scholar]
  63. Olasunkanmi, L.O.; Moloto, B.P.; Obot, I.B.; Ebenso, E.E. Anticorrosion studies of some hydantoin derivatives for mild steel in 0.5M HCl solution: Experimental, quantum chemical, Monte Carlo simulations, and QSAR studies. J. Mol. Liq. 2018, 252, 62–74. [Google Scholar] [CrossRef]
  64. Chaouiki, A.; Lgaz, H.; Salghi, R.; Chafiq, M.; Gaonkar, S.L.; Bhat, K.S.; Subrahmanya, O.; Hassan, A.; Chung, I.-M.I.H. Inhibitory effect of a new isoniazid derivative as an effective inhibitor for mild steel corrosion in 1.0 M HCl: Combined experimental and computational study. Res. Chem. Intermed. 2020, 46, 2919–2950. [Google Scholar] [CrossRef]
  65. Al-Senani, G.M.; Alshabanat, M. Study the corrosion inhibition of carbon steel in 1 M HCl using extracts of date palm waste. Int. J. Electrochem. Sci. 2018, 13, 3777–3788. [Google Scholar] [CrossRef]
  66. Ansari, K.R.; Quraishi, M.A.; Singh, A. Schiff’s base of pyridyl substituted triazoles as new and effective corrosion inhibitors for mild steel in hydrochloric acid solution. Corros. Sci. 2014, 79, 5–15. [Google Scholar] [CrossRef]
  67. Verma, C.; Quraishi, M.A.; Gupta, N.K. 2-(4-{[4-Methyl-6-(1-methyl-1H-1,3-benzodiazol-2-yl)-2-propyl-1H-1,3-benzodiazol-1-yl] methyl} phenyl) benzoic acid as green corrosion inhibitor for mild steel in 1 M hydrochloric acid. Ain Shams Eng. J. 2018, 9, 1225–1233. [Google Scholar] [CrossRef] [Green Version]
  68. Rahiman, A.F.S.A.; Sethumanickam, S. Corrosion inhibition, adsorption and thermodynamic properties of poly (vinyl alcohol-cysteine) in molar HCl. Arab. J. Chem. 2017, 10, S3358–S3366. [Google Scholar] [CrossRef]
  69. Tan, B.; He, J.; Zhang, S.; Xu, C.; Chen, S.; Liu, H.; Li, W. Insight into anti-corrosion nature of Betel leaves water extracts as the novel and eco-friendly inhibitors. J. Colloid Interface Sci. 2021, 585, 287–301. [Google Scholar] [CrossRef]
  70. Li, X.; Deng, S.; Li, N.; Xie, X. Inhibition effect of bamboo leaves extract on cold rolled steel in Cl3CCOOH solution. J. Mater. Res. Technol. 2017, 6, 158–170. [Google Scholar] [CrossRef] [Green Version]
Figure 1. The schematic route of ZnMOF-BTA synthesis.
Coatings 12 01288 g001
Figure 2. (a) ZnMOF-BTA framework, (b) asymmetric monomer units, and (c) dimer molecule; (d) a framework of ZnMOF-BTA molecules.
Coatings 12 01288 g002
Figure 3. XRD data of ZnMOF-BTA, BTA, H2TDC, and Zn(N03)2.6H2O.
Coatings 12 01288 g003
Figure 4. FTIR spectra of ZnMOF-BTA, BTA, and H2TDC.
Coatings 12 01288 g004
Figure 5. XPS spectra for as-prepared ZnMOF-BTA crystals: (a) XPS survey scan, (b) Zn2p, (c) C 1s, (d) S 2p, (e) O 1s, and (f) N 1s spectra.
Coatings 12 01288 g005
Figure 6. The TGA and DTA curves of ZnMOF-BTA. 2014.
Coatings 12 01288 g006
Figure 7. (a) SEM image, (b) TEM image, and (c) EDS data of ZnMOF-BTA.
Coatings 12 01288 g007
Figure 8. Potentiodynamic polarization curves for the corrosion of carbon steel in 1 M HCl in the absence and presence of different concentrations of ZnMOF-BTA extracts at 298K.
Coatings 12 01288 g008
Figure 9. Nyquist plots of carbon steel in the presence and absence of different concentrations of ZnMOF-BTA extracts in 1 M HCl solution at 298K.
Coatings 12 01288 g009
Figure 10. Bode and phase plots of carbon steel in the presence and absence of different concentrations of ZnMOF-BTA extracts in 1 M HCl solution at 298K.
Coatings 12 01288 g010
Figure 11. Equivalent circuit model used in fitting the impedance data.
Coatings 12 01288 g011
Figure 12. Langmuir adsorption plots for carbon steel in 1M HCl solution containing various concentrations of BTA released from ZnMOF-BTA at 298K.
Coatings 12 01288 g012
Figure 13. SEM images and EDS spectra for carbon steel surfaces: (a,d) polished surface, (b,e) without ZnMOF-BTA extract, (c,f) with 2 wt.% of ZnMOF-BTA extract in 1 M HCl solution for 48 h at 298 K.
Coatings 12 01288 g013
Table 1. Chemical composition of Q235 carbon steel (wt.%).
FeCSiMnPS
Q235Balance0.220.351.400.0450.05
Table 2. Crystallographic and refinement data of ZnMOF-BTA.
CompoundZnMOF-BTA
Moiety formula2(C24 H14 N9 O4 S Zn2.5)
Formula sumC48 H28 N18 O8 S2 Zn5
Formula weight1375.85
Crystal descriptionBlock/colorless
Crystal systemMonoclinic
Space group, HallC 1 2/c 1, -C 2yc
a (Å)35.2666(4)
b (Å)38.1974(2)
c (Å)26.9717(3)
α (°)90
Β (°)127.718(2)
γ (°)90
Volume (Å3)28740.8(8)
Radiation typeCu Kα (λ = 1.54184)
T K150
Z16
Dx (g × cm−3)1.272
μ mm−12.854
F(000)11008.0
θ range (°)3.9−75.4
Crystal size mm0.15 × 0.13 × 0.12
Tot. reflections59,616
Uniq. Reflections, Rint28,131
R1 indices (I > 2\(I))0.0585
wR2 indices (all data)0.1689
Δρmin, Δρmax (e·Å−3)−0.817, 1.337
GOF1.038
Table 3. Selected bond lengths and angles for ZnMOF-BTA.
BondDistance (Å)BondDistance (Å)BondBond Angles (Å)
Zn1−N2 i2.1996 (48)Zn1−N11 i2.1552 (37)N11−Zn1−N5175.703 (144)
Zn1−N5 i2.1775 (38)Zn1−N17 ii2.1904 (43)N11−Zn1−N1790.857 (151)
Zn2−N3 i2.0302 (42)Zn2−O7 iv2.1142 (83)N4−Zn2−N3101.436 (194)
Zn2−N4 i2.0106 (56)Zn2−O8 iv2.1464 (109)N4−Zn2−O8111.287 (270)
Zn3−N9 i2.0275 (51)Zn3−O1 i2.5350 (30)O2−Zn3−N13128.942 (168)
Zn3−N12 i2.0063 (51)Zn3−O2 i1.9401(30)O2−Zn3−O175.783 (185)
Zn4−N1 iii2.0239 (49)Zn4−O3 i1.9800 (38)N16−Zn4−O493.501(182)
Zn4−N10 iii2.0420 (26)Zn4−O4 i2.3117 (48)O3−Zn4−O459.594 (166)
Zn5−N6 iii2.0533 (55)Zn5−O5 i1.9427 (50)N18−Zn6−N1599.110 (181)
Zn5−N15 iii2.0402 (28)Zn5−O6 i2.5700 (50)O5−Zn5−O676.567 (191)
Zn6−N20 i2.1969 (48)Zn6−N35 iii2.1905 (22)
Zn6−N26 i2.1905 (22)Zn6−N32 iii2.1969 (49)
Zn7−N21 i2.0288 (35)Zn7−O11 iv2.1141 (48)
Zn8−N25 i2.0177 (36)Zn8−O9 i1.9713 (36)
Zn9−N19 i2.0207 (52)Zn9−O13 i2.2496 (48)
Zn9−N27 i2.0515 (37)Zn9−O14 i1.9666 (39)
Zn10−N30 ii2.0361 (31)Zn10−O15 i2.4960 (30)
Zn10−N31 i2.0145 (40)Zn10−O16 i1.9521(30)
C1−C2 i1.37 (1)O1−C31 i1.233 (5)
C1−C6 i1.42 (1)O3−C36 i1.244 (5)
N4−N5 i1.337 (7)N3−C2 i1.36 (1)
N32−N33 i1.332 (7)N24−C56 i1.367 (6)
Symmetry transformations used to generate equivalent atoms: (i) x, y, z; (ii) −1/2 + x, 3/2-y, −1/2 + z; (iii) 1/2 + x, 3/2-y, 1/2 + z; (iv) −1/2 + x, −1/2 + y, z.
Table 4. Summary of TGA results of ZnMOF-BTA.
StageDecomposition StepsTemp Range (°C)TG Weight Loss (%)Decomposition Product
ObservedCalculated
1st[Zn5(BTA)6(TDC)2(H2O)n]95–1180.37 -nH2O
Coatings 12 01288 i001
[Zn5(BTA)6(TDC)2]119–22025.2125.40-6[C6H4N3]
Coatings 12 01288 i002
2nd[Zn5(TDC)2]230–40050.4350.80-4CO2
Coatings 12 01288 i003 -2C4H4S
3rdZnO residue400–41023.9923.805ZnO
Table 5. Weight loss parameters of carbon steels in 1M HCl solution with and without different concentration of ZnMOF-BTA extracts for 24 h at 298 K.
SampleWeight % (g)W (mg·cm−2·h−1)I.Ew (%)θ
Blank solution-1.667--
ZnMOF-BTA1.00.70357.830.5783
2.00.58365.030.6503
4.00.13891.720.9172
6.00.09694.940.9494
Table 6. Polarization parameters for the corrosion of carbon steel in 1 M HCl in the absence and presence of different concentrations of ZnMOF-BTA extracts at 298K.
SampleWeight %
(g)
−Ecorr
(mV/SCE)
βc
(mV/dec)
βa
(mV/dec)
icorr
(μA/cm2)
I.Ep (%)θ
Blank-458.492.463.131.4--
ZnMOF-BTA1.0438.587.440.418.242.00.420
2.0444.065.133.913.856.10.561
4.0453.784.054.611.164.70.647
6.0425.950.226.009.171.00.710
Table 7. Electrochemical parameters for carbon steel in 1M HCl solution without and with different concentrations of ZnMOF-BTA extracts at 298 K.
CPE
InhibitorWeight % (g)Rs (Ω·cm2)Rp
(Ω·cm2)
YO
(× 10−6 sn·Ω−1·cm−2)
nCdl
(× 10−6 sn·Ω−1·cm−2)
I.EZ (%)
Blank-0.5311.71 ± 0.112390.87658.22-
ZnMOF-BTA1.01.9045.95 ± 0.3904.00.88586.1373.3
2.02.3156.98 ± 0.4850.50.85498.5278.6
4.04.22147.6 ± 1.1457.80.86295.2491.7
6.07.25276.3 ± 2.2398.20.84261.5395.5
Table 8. Thermodynamic parameters for the adsorption of BTA molecules released from ZnMOF-BTA on the carbon steel surface in 1M HCl solution at 298 K.
InhibitorSlopeInterceptKads(M−1)R2∆G°ads (KJ·mole−1)
ZnMOF-BTA0.876270.010271.1410.97889−10.28
Publisher’s Note: MDPI stays neutral with regard to jurisdictional claims in published maps and institutional affiliations.

